
Abstract
Nanosized DNA assemblies are useful for delivering immunostimulatory cytosine–phosphate–guanine (CpG) DNA to immune cells, but little is known about the optimal structure for such delivery. In this study, we designed three different DNA nanostructures using four 55-mer oligodeoxynucleotides (ODNs), that is, tetrapod-like structured DNA (tetrapodna), tetrahedral DNA (tetrahedron), and tetragonal DNA (tetragon), and compared their potencies. Electrophoresis showed that tetrapodna was obtained with high yield and purity, whereas tetrahedron formed multimers at high ODN concentrations. Atomic force microscopy revealed that all preparations were properly constructed under optimal conditions. The thermal stability of tetrapodna was higher than those of the others. Dynamic light scattering analysis showed that all of the assemblies were about 8 nm in diameter. Upon addition to mouse macrophage-like RAW264.7 cells, tetrahedron was most efficiently taken up by the cells. Then, a CpG DNA, a ligand for toll-like receptor 9, was linked to these DNA nanostructures and added to RAW264.7 cells. CpG tetrahedron induced the largest amount of tumor necrosis factor-α, followed by CpG tetrapodna. Similar results were obtained using human peripheral blood mononuclear cells. Taken together, these results indicate that tetrapodna is the best assembly with the highest yield and high immunostimulatory activity, and tetrahedron can be another useful assembly for cellular delivery if its preparation yield is improved.
Introduction
R
Unmethylated cytosine–phosphate–guanine (CpG) dinucleotide with appropriate flanking sequences (CpG motif) is a pathogen-associated molecular pattern and a ligand for toll-like receptor 9 (TLR9) expressed in various mammalian immune cells [7–9]. The binding of DNA containing the CpG motif, or CpG DNA, to the receptor leads to the production of proinflammatory cytokines, including tumor necrosis factor (TNF)-α, interleukin (IL)-6, and interferon (IFN)-α [10]. Therefore, CpG DNA has attracted attention in the treatment of cancer, virus infections, and allergic diseases [11–13].
Apart from the use of chemically stabilized DNA/RNA analogs, such as phosphorothioate DNA [14,15], several attempts have been made to increase the activity of natural phosphodiester CpG DNA through efficient delivery of the DNA to the target immune cells. We reported that multibranched, polypod-like structured DNA, or polypodna, prepared using three or more oligodeoxynucleotides (ODNs), is a useful DNA nanostructure for the delivery of natural phosphodiester CpG DNA to mouse macrophage-like RAW264.7 cells, mouse dendritic DC2.4 cells, mouse bone marrow-derived dendritic cells, and human peripheral blood mononuclear cells (PBMCs) [16–19].
The polypod-like structure was found to be quite effective for the delivery of DNA to these immune cells. Separately, Li et al. reported that the DNA tetrahedron, designed using four ODNs, was useful for the delivery of CpG DNA to RAW264.7 cells [20]. These previous studies have clearly demonstrated that nanosized DNA assemblies are suitable systems for the delivery of CpG DNA to immune cells for immunostimulation. However, no systematic studies have been carried out to elucidate the optimal structure of such DNA assemblies for the delivery of immunostimulatory CpG DNA to immune cells.
In this study, we examined the importance of the structure of nanosized DNA assemblies in the preparation efficiency as well as the stimulation of immune cells. Since our previous study demonstrated that the number and length of ODNs were key parameters for the physicochemical and biological properties of polypodnas [18], these parameters were fixed to extract the structure-dependent differences among the nanosized DNA assemblies.
To this end, tetrahedral DNA (tetrahedron) consisting of four 55-mer ODNs, reported by Li et al. [20], was selected as one of the DNA assemblies for comparison. To minimize the difference in the sequences, one of the ODNs for the tetrahedron (the common ODN) was used to newly design tetrapodna consisting of four 55-mer ODNs. In addition, a tetragonal DNA (tetragon) was also designed with the common ODN and three other 55-mer ODNs. These three DNA nanostructures were compared in terms of preparation efficiency, physicochemical property, cellular uptake, and immunostimulatory activity. RAW264.7 cells and human PBMCs were used for cellular interaction of these DNA nanostructures.
Materials and Methods
Chemicals
Roswell Park Memorial Institute (RPMI) 1640 medium was obtained from Nissui Pharmaceutical, Co., Ltd., (Tokyo, Japan). Opti-MEM was purchased from Life Technologies (Rockville, MD). Fetal bovine serum (FBS) was obtained from HyClone Laboratories, Inc., (South Logan, UT). The 100 base pair (bp) DNA ladder was purchased from Takara Bio (Otsu, Japan). All other chemicals were the highest grade available and used without further purification.
Cell culture
The murine macrophage-like cell line, RAW264.7, was cultured in RPMI medium supplemented with 10% heat-inactivated FBS, 0.2% sodium bicarbonate, 100 IU/mL penicillin, 100 μg/mL streptomycin, and 2 mM
Isolation of human PBMCs
All experiments using human primary cells were approved by the institutional review board at the Graduate School of Medicine, Kyoto University, and following the tenets of the Declaration of Helsinki. Human PBMCs were obtained from healthy donors after obtaining their written informed consent. PBMCs were isolated from peripheral blood by density gradient centrifugation using Lympholyte-H Cell Separation Media (Cedarlane Laboratories Ltd., Uithoorn, The Netherlands) as previously reported [21]. Cells collected were replated on 48-well culture plates at a density of 6×10⁵ cells/well in RPMI medium.
Oligodeoxynucleotides
All ODNs used were purchased from Integrated DNA Technologies, Inc., (Coralville, IA). The sequences of the ODNs used are listed in Table 1. ODN-1 was the common ODN used for all three preparations. Each ODN, such as tetrapodna-2 and tetrahedron-2, was identified with the name of the DNA assembly and the ODN number. For cellular uptake experiments, ODN-1 labeled with Alexa Fluor-488 at the 5′ end (Alexa ODN-1) was purchased from Japan BioService Co., Ltd., (Saitama, Japan). CpG ODN-1 was designed in such a way that a 25-base ODN containing a potent CpG motif was linked to the 5′ end of the ODN-1 and used for cytokine release experiments. AFM-tetrapodna-1, AFM-tetrapodna-3, AFM-tetrahedron-2, AFM-tetrahedron-3, AFM-tetragon-2, and AFM-tetragon-3 were used for atomic force microscopy (AFM) imaging.
All ODNs have a phosphodiester backbone. The asterisk (*) indicates the position of Alexa Fluor-488 modification. Underlined is the CpG motif (GACGTT).
AFM, atomic force microscopy; ODNs, oligodeoxynucleotides; CpG, cytosine–phosphate–guanine.
Preparation of DNA nanostructures
ODNs dissolved in an annealing buffer (Tris-EDTA buffer; 10 mM Tris-HCl, pH 8, 1 mM ethylenediaminetetraacetic acid (EDTA), and 50 mM magnesium chloride) were mixed at a final concentration of 0.5–20 μM for each ODN. The annealing buffer was used to prepare all the DNA samples. The mixtures were then incubated at 95°C for 2 min and slowly cooled down to 4°C using a thermal cycler. The annealing condition for tetrahedron was optimized in preliminary experiments, and a different condition from the original one [20] was used to minimize the formation of aggregates at high DNA concentrations. Each preparation was analyzed at 37°C by the MCE-202 MultiNA microchip electrophoresis system for DNA/RNA analysis (Shimadzu, Kyoto, Japan) or by 6% polyacrylamide gel electrophoresis (PAGE). Double-stranded (ds) DNA was prepared by annealing of ODN-1 and ODN-1′.
Atomic force microscopy imaging of DNA nanostructures
AFM images were obtained on a high-speed AFM system (Nano Live Vision; RIBM, Tsukuba, Japan) using a silicon nitride cantilever (BL-AC10EGS; Olympus, Tokyo, Japan) as reported previously [22]. All the DNA nanostructures were immobilized to the DNA frame using the two long single-stranded sequences on the 5′ end of the two ODNs of each DNA nanostructure. In brief, a DNA sample was adsorbed on a freshly cleaved mica plate pretreated with 0.1% aqueous 3-aminopropyltriethoxysilane for 5 min at room temperature, and then washed thrice with a buffer solution containing 20 mM Tris and 10 mM MgCl2. Scanning was performed in the same buffer solution.
Measurement of melting temperature
The melting temperatures (Tm) were obtained by measuring the absorbance of tetrapodna, tetrahedron, and tetragon in TE buffer containing 50 mM MgCl2 at 260 nm with a Shimadzu UV-1600 PC spectrometer (Shimadzu) equipped with a TMSPC-8 temperature controller [23].
Dynamic light scattering analysis
The apparent sizes of tetrapodna, tetrahedron, and tetragon were determined by the dynamic light scattering method using a Malvern Zetasizer 3000HS (Malvern Instruments, Malvern, UK) at 20°C. The measurement was repeated more than eight times, and the results are expressed as the mean±SD of the eight measurements.
Circular dichroism spectra of DNA nanostructures
The circular dichroism (CD) spectra of DNA were recorded using a JASCO-820-type spectropolarimeter (JASCO, Tokyo, Japan) with a 0.1-cm path length quartz cell at 20°C. The DNA samples after annealing were diluted with 50 mM MgCl2-containing TE buffer to a final DNA concentration of 68 μg/mL. The CD spectra of DNA were measured in the range of 200–320 nm.
Stability of DNA nanostructures in 50% FBS
DNA nanostructures (68 μg/mL) were mixed with nonheat-inactivated FBS of equal volume and incubated at 37°C. After 0, 2, 4, 8, 12, or 24 h of incubation, a 10 μL aliquot of the sample solution was transferred to plastic tubes and mixed with 20 μL of 0.5 M EDTA solution to stop the degradation, and then stored at −20°C until use. These samples were run on 9% PAGE at 4°C and stained with SYBR Gold (Life Technologies). The density of the DNA bands was quantitatively evaluated using the MultiGauge software (Fujifilm, Tokyo, Japan).
Cellular uptake of DNA
RAW264.7 cells or PBMCs on 96- or 48-well plates at a density of 5×10⁴ or 6×10⁵ cells/well were incubated with Alexa Fluor 488-labeled single-stranded DNA (ssDNA), tetrapodna, tetrahedron, or tetragon diluted in 0.1 mL of Opti-MEM for 2 or 4 h at 37°C. Cells were then washed thrice with 200 or 400 μL of phosphate-buffered saline and harvested. Then, the fluorescent intensity of cells was determined by flow cytometry (FACS Calibur or Gallios Flow Cytometer; BD Biosciences, NJ) using CellQuest software (version 3.1; BD Biosciences) or Kaluza software (version 1.0; BD Biosciences), and the mean fluorescence intensity (MFI) was calculated.
TNF-α release from RAW264.7 cells
RAW264.7 cells were seeded into 96-well plates at a density of 5×10⁴ cells/well. Then, CpG ssDNA, CpG tetrapodna, CpG tetrahedron, or CpG tetragon was diluted in 0.1 mL of Opti-MEM and added to the cells. The cells were incubated at 37°C for 8 h, and the supernatants were retrieved and stored at −80°C until use. The levels of TNF-α in the supernatants were determined by enzyme-linked immunosorbent assay (ELISA) using OptEIA™ sets (BD Biosciences).
IFN-α release from human PBMCs
PBMCs were seeded into 48-well plates at a density of 6×10⁵ cells/well. Then, CpG ssDNA, CpG tetrapodna, CpG tetrahedron, or CpG tetragon was diluted in 0.2 mL of Opti-MEM and added to the cells. The cells were incubated at 37°C for 24 h, and the supernatants were retrieved and stored at −80°C until use. The levels of human IFN-α were determined using the IFN-α–ELISA module set (Bender Med Systems, Vienna, Austria). Chloroquine (Sigma-Aldrich, St. Louis, MO) was used as a control for TLR involvement PBMCs. Cells were incubated with or without 100 μM chloroquine.
Statistical analysis
Differences were statistically evaluated by one-way analysis of variance (ANOVA), followed by the Tukey–Kramer test for multiple comparisons. A P-value of <0.05 was considered statistically significant.
Results
Construction of DNA nanostructures
Figure 1 shows the schematic images of tetrapodna, tetrahedron, and tetragon. The gray-colored lines indicate the common ODN (ODN-1) for all preparations. Figure 2A shows the MultiNA analysis of tetrapodna, tetrahedron, and tetragon prepared at various DNA concentrations (0.5–20 μM). A fixed amount of DNA (68 ng) was run on electrophoresis. Tetrapodna had a major single band of around 140 bp at all the DNA concentrations examined (Fig. 2A, lanes 1–5), indicating that tetrapodna was successfully formed with high efficiency by simple annealing of ODNs.
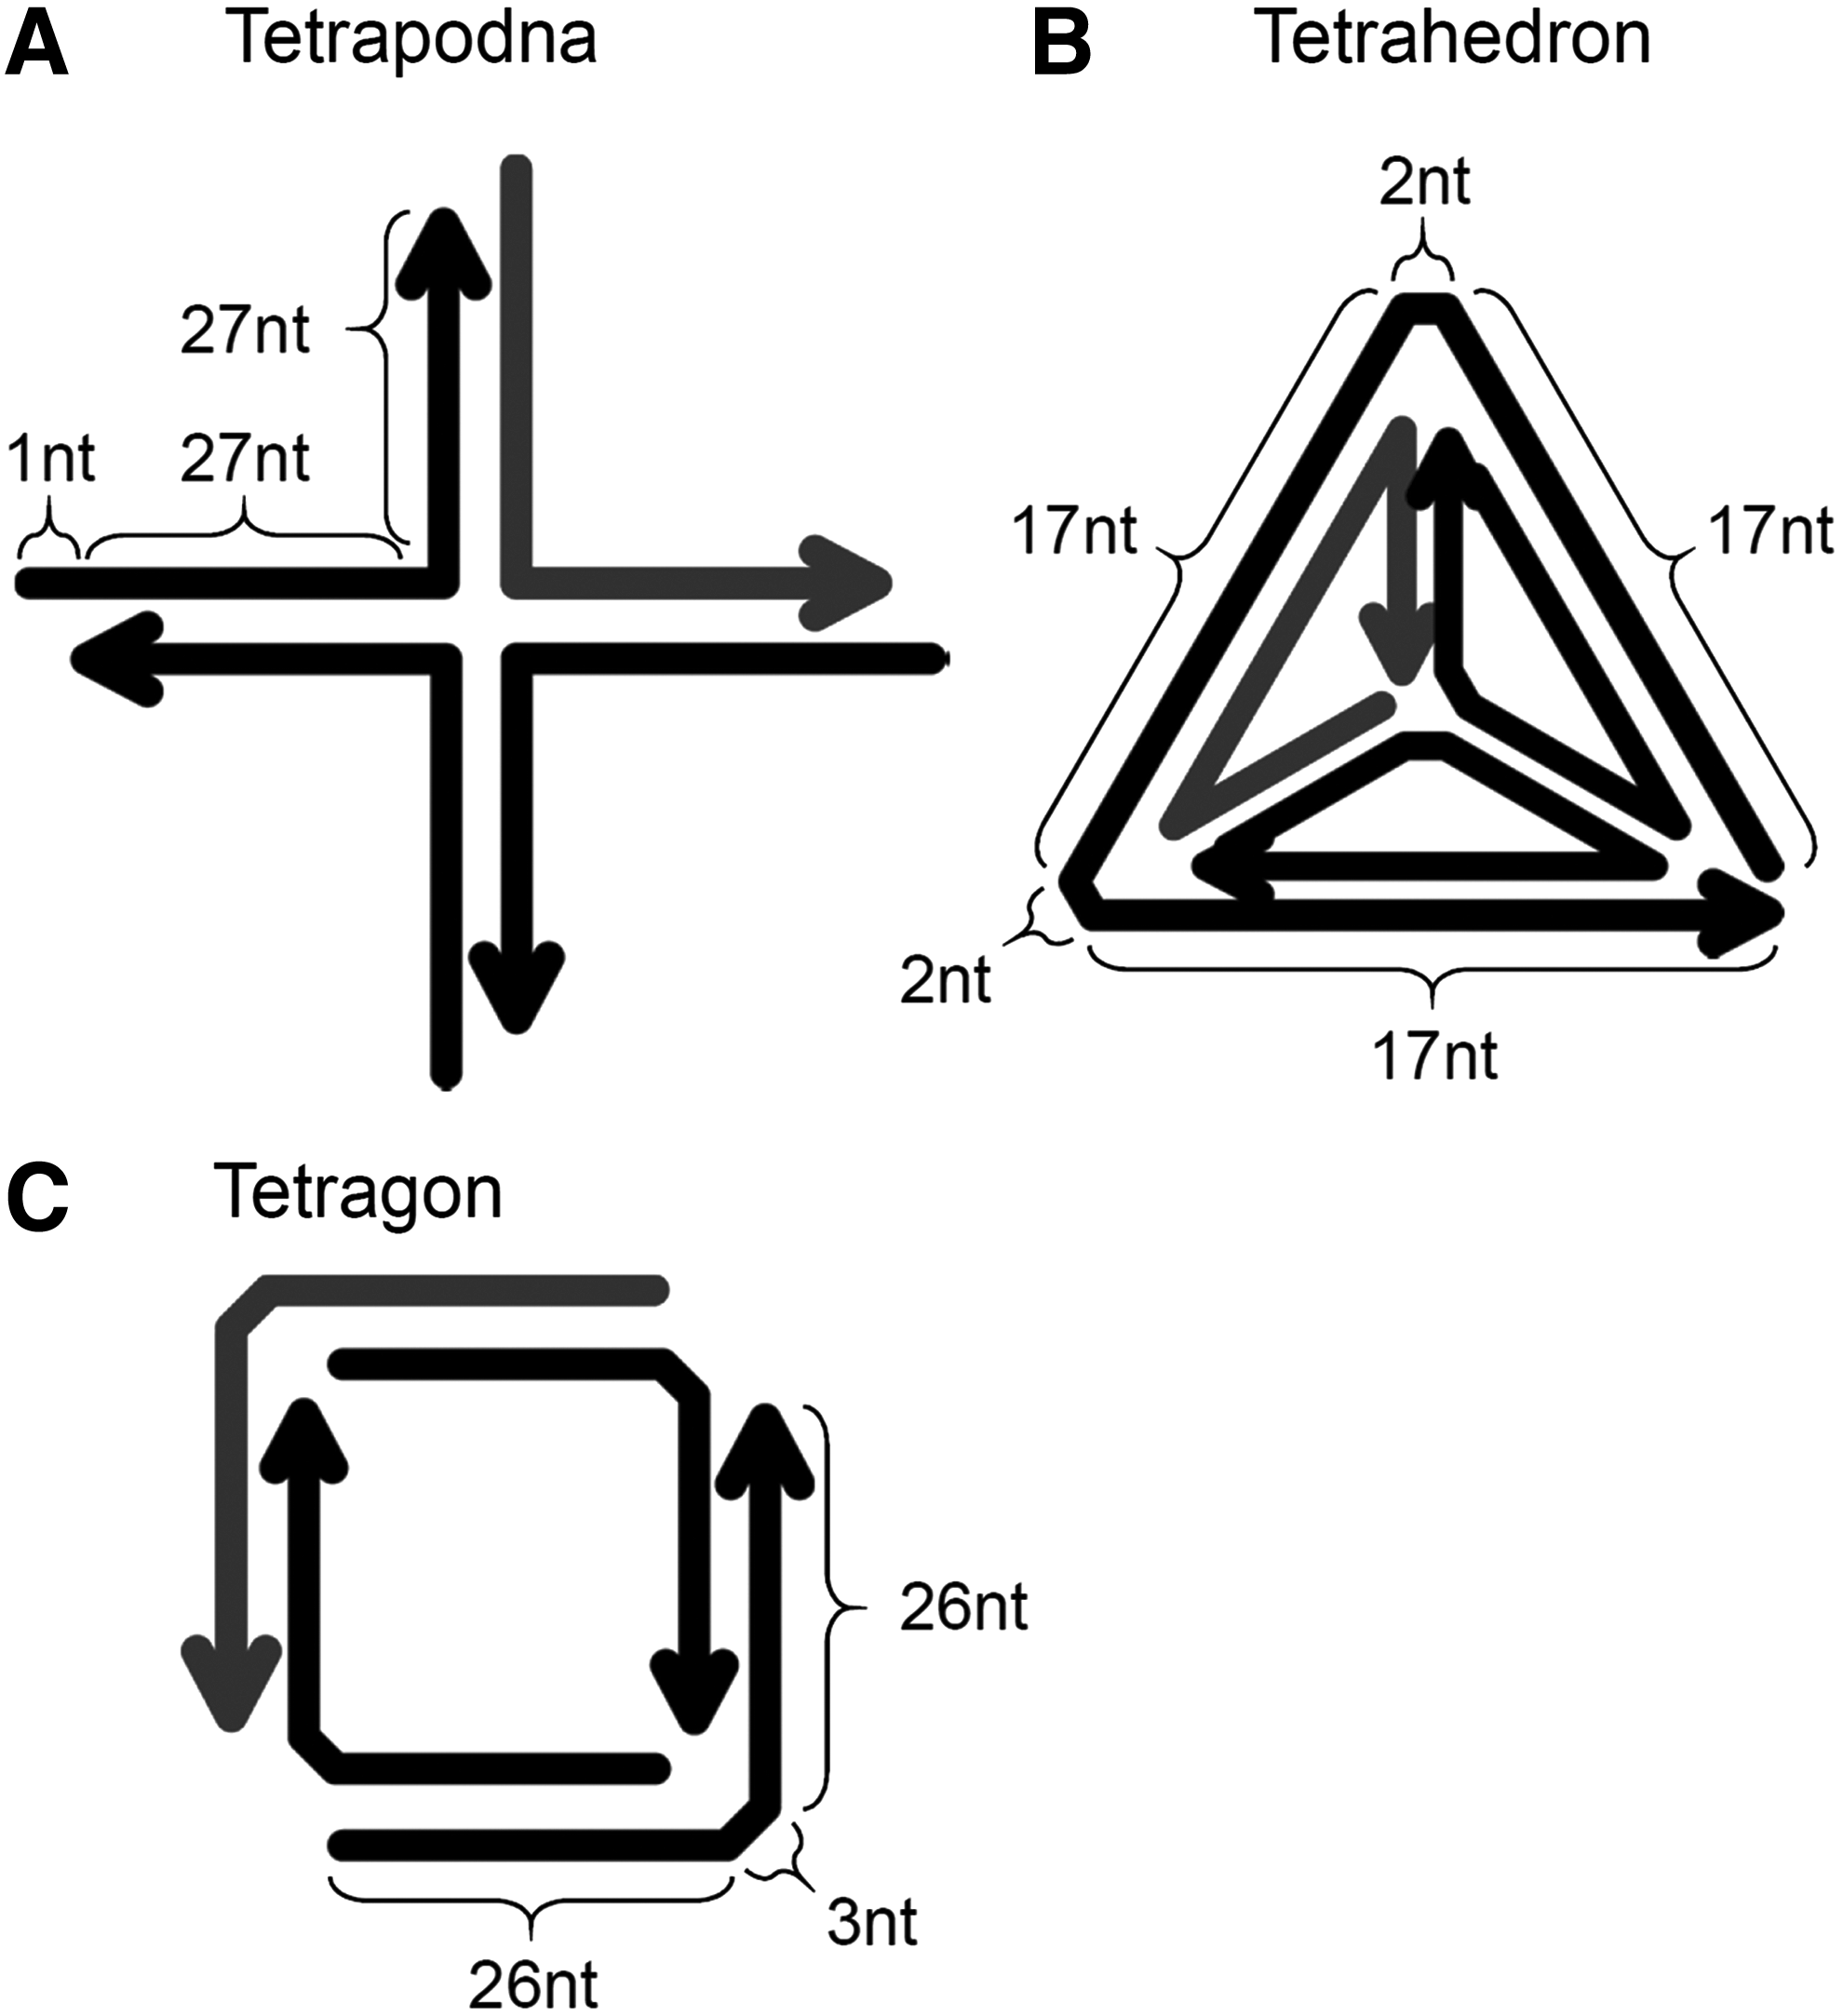
Schematic presentation of

Electrophoretic analysis of tetrapodna, tetrahedron, and tetragon.
On the other hand, the band for tetrahedron, which was detected around 90 bp, became weaker with increasing DNA concentrations at preparation (Fig. 2A, lanes 6–10). There were several bands for tetragon prepared at high DNA concentrations (Fig. 2A, lanes 11–15). The mobility was the fastest for tetrahedron, followed by tetrapodna, then tetragon. These differences would be due to the structural differences of these DNA nanostructures as all these DNA nanostructures consisted of 220 nucleotides. Figure 2B shows the PAGE analysis of these DNA nanostructures prepared at DNA concentration of 0.5–20 μM. A significant fraction of tetrahedron remained in the well, suggesting that it formed multimers or aggregates under these conditions at high DNA concentrations.
The formation of tetrapodna, tetrahedron, and tetragon was confirmed using AFM. The PAGE analysis of DNA nanostructures for AFM experiments was shown in Supplementary Figure S1; Supplementary Data are available online at www.liebertpub.com/nat. A DNA frame prepared using the DNA origami method was used to immobilize the DNA nanostructures for imaging. In addition, two of the four ODNs for each DNA nanostructure were extended to be immobilized to the frame. Figure 3 shows the AFM images of tetrapodna, tetrahedron, and tetragon immobilized to the DNA frame. AFM images with a large area were shown in Supplementary Figure S2. The images clearly show that all of the preparations had different structures from one another.
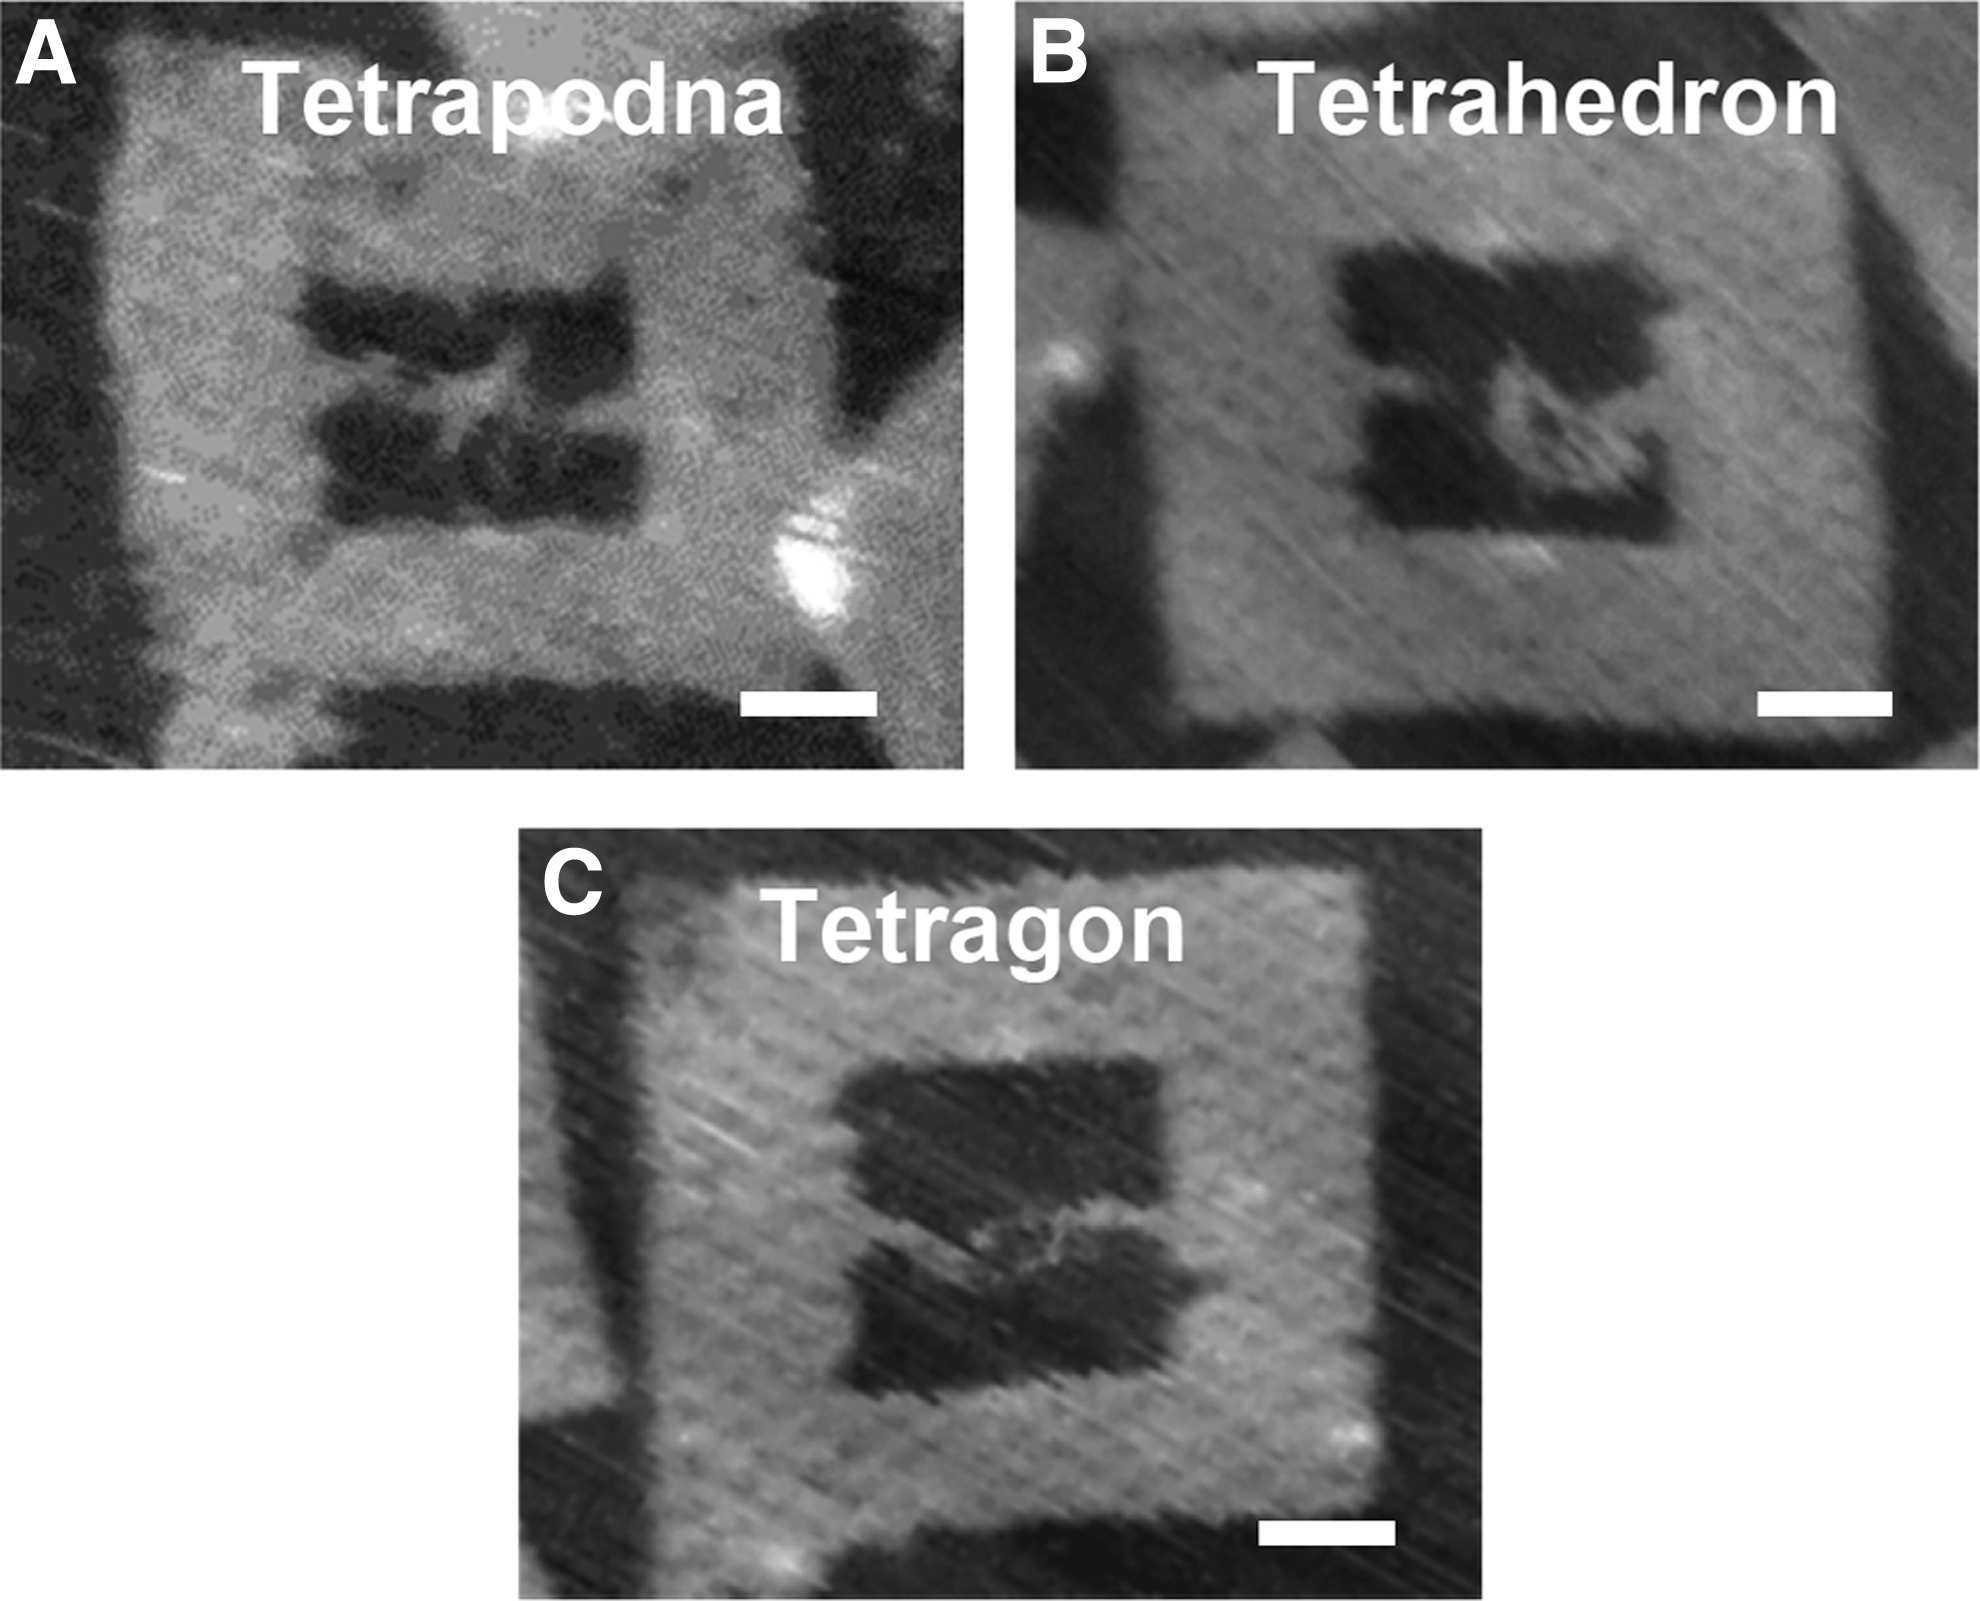
Atomic force microscopy images of
Tetrapodna was structured with four pods extruding from the center, the structural characteristics of which were almost identical to those of a larger tetrapodna consisting of 90-base ODNs [18]. The AFM image of tetragon shows a rectangular shape as designed. On the other hand, the image for tetrahedron shows a triangular structure that was more complicated than the others.
Tm and apparent size of DNA nanostructures
The thermal stabilities of tetrapodna, tetrahedron, and tetragon were examined by measuring the Tm. Table 2 summarizes the Tm values in TE buffer containing 50 mM magnesium chloride. Tetrapodna had the highest Tm, followed by tetragon. The apparent sizes of these DNA nanostructures, measured by dynamic light scattering, are also listed in Table 2. All preparations were about 8 nm in diameter.
CD spectra of DNA nanostructures
Figure 4 shows the CD spectra of tetrapodna, tetrahedron, and tetragon. All samples examined had a positive peak near 280 nm and a negative peak near 240 nm, and there were no significant differences in the spectra. The spectra of the DNA nanostructures were similar to those of dsDNA, which exhibited B-form under the conditions examined.
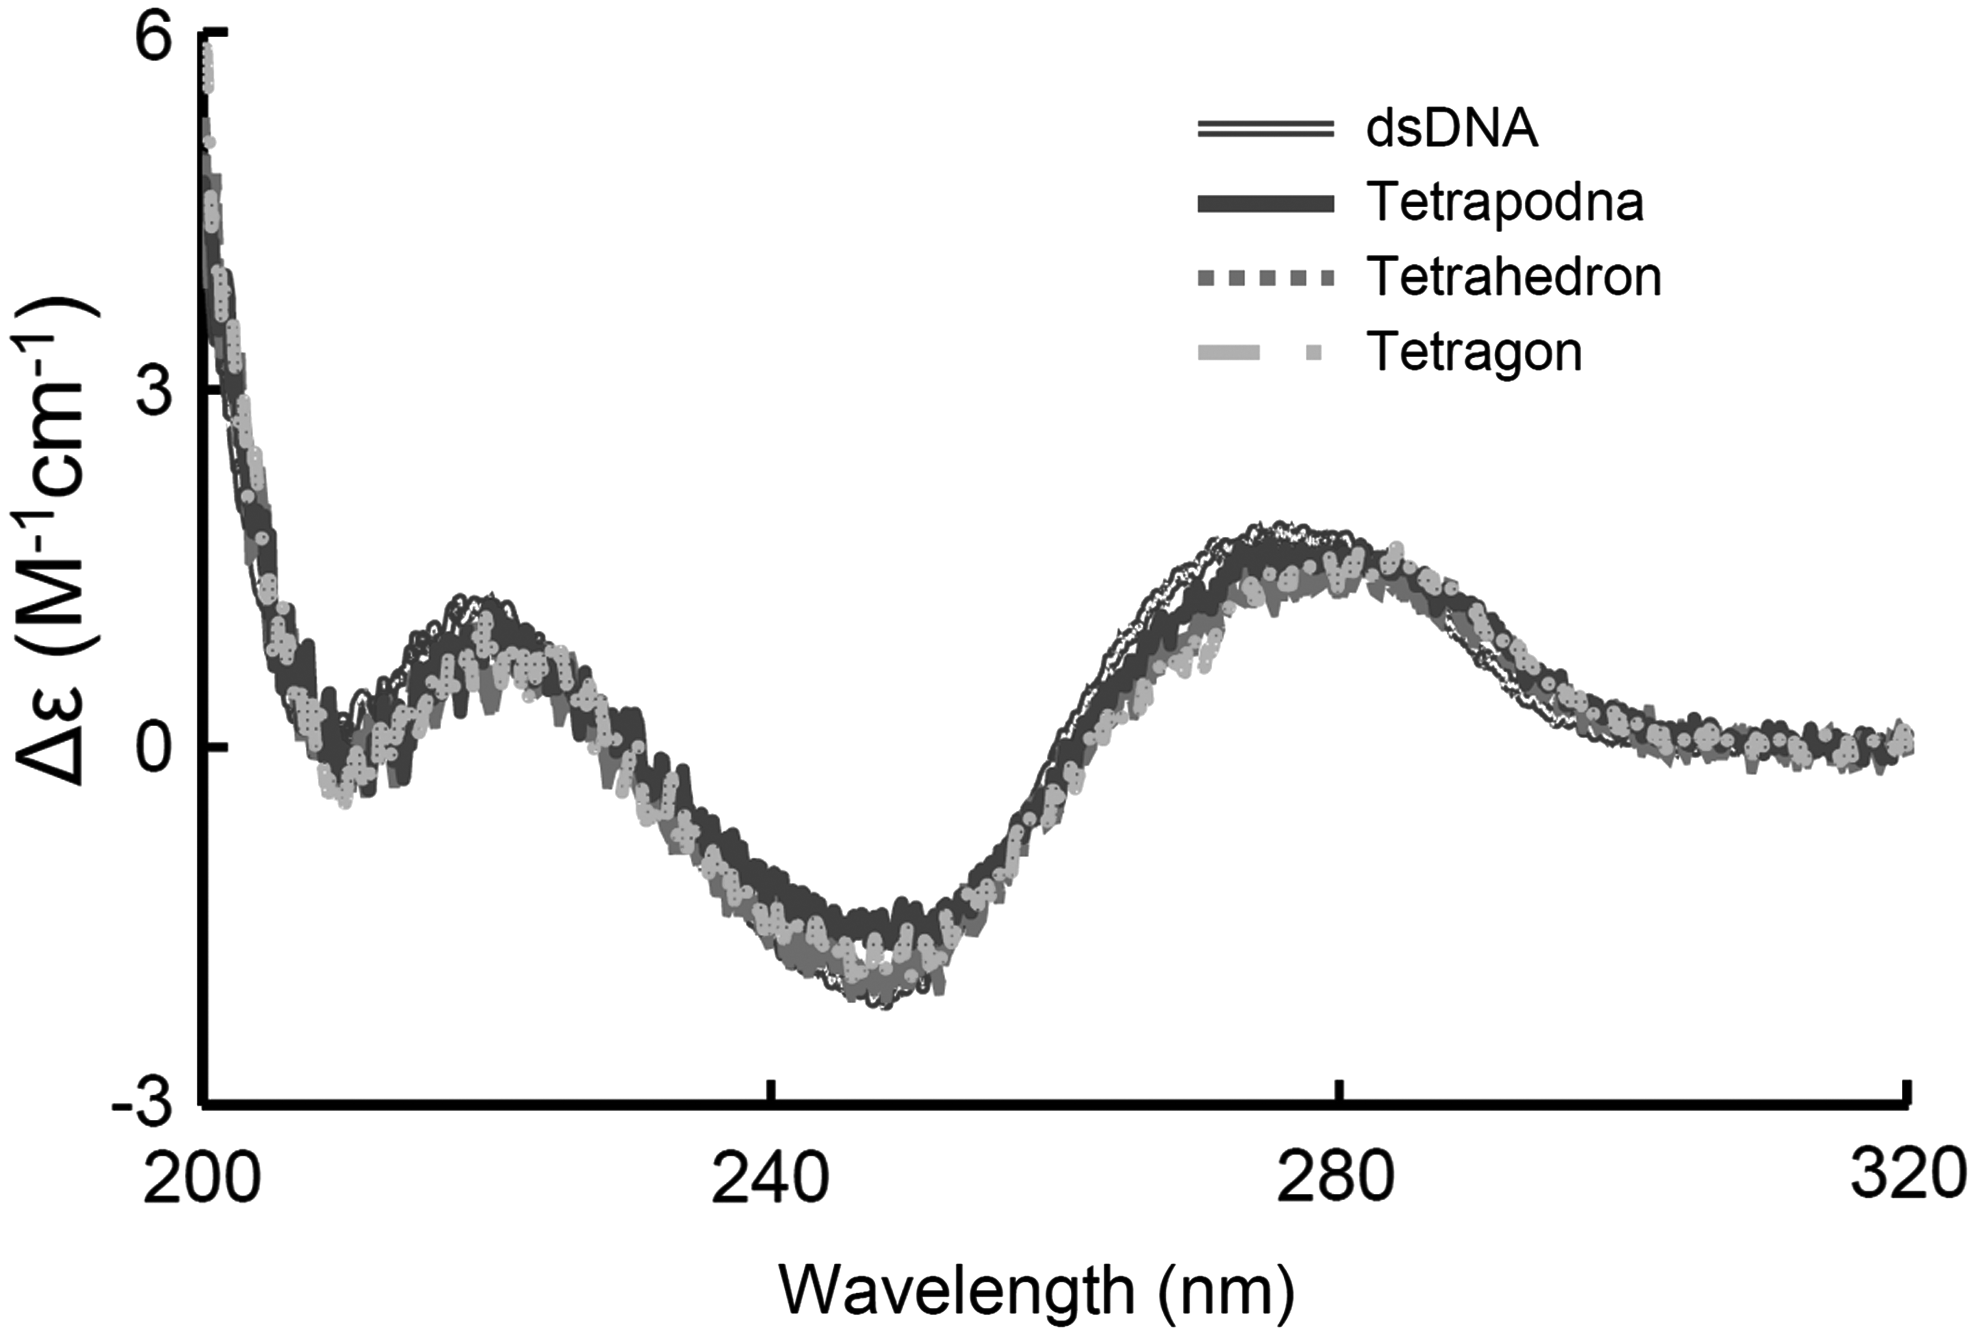
CD spectra of tetrapodna, tetrahedron, and tetragon. CD spectra were recorded using a JASCO-820-type spectropolarimeter. To facilitate comparisons, the background of CD spectra was subtracted. CD, circular dichroism.
Stability of DNA nanostructures in serum
Figure 5A shows the PAGE analysis of the DNA nanostructures incubated in solution containing 50% nonheat-inactivated FBS. The bands of the DNA nanostructures weakened with time in all cases. In addition, the bands shifted down with time because of the degradation of the DNA nanostructures. Figure 5B shows the time courses of the remaining DNA after densitometric analysis of the gels. This analysis indicated that tetragon was quickly degraded with time compared with the others.
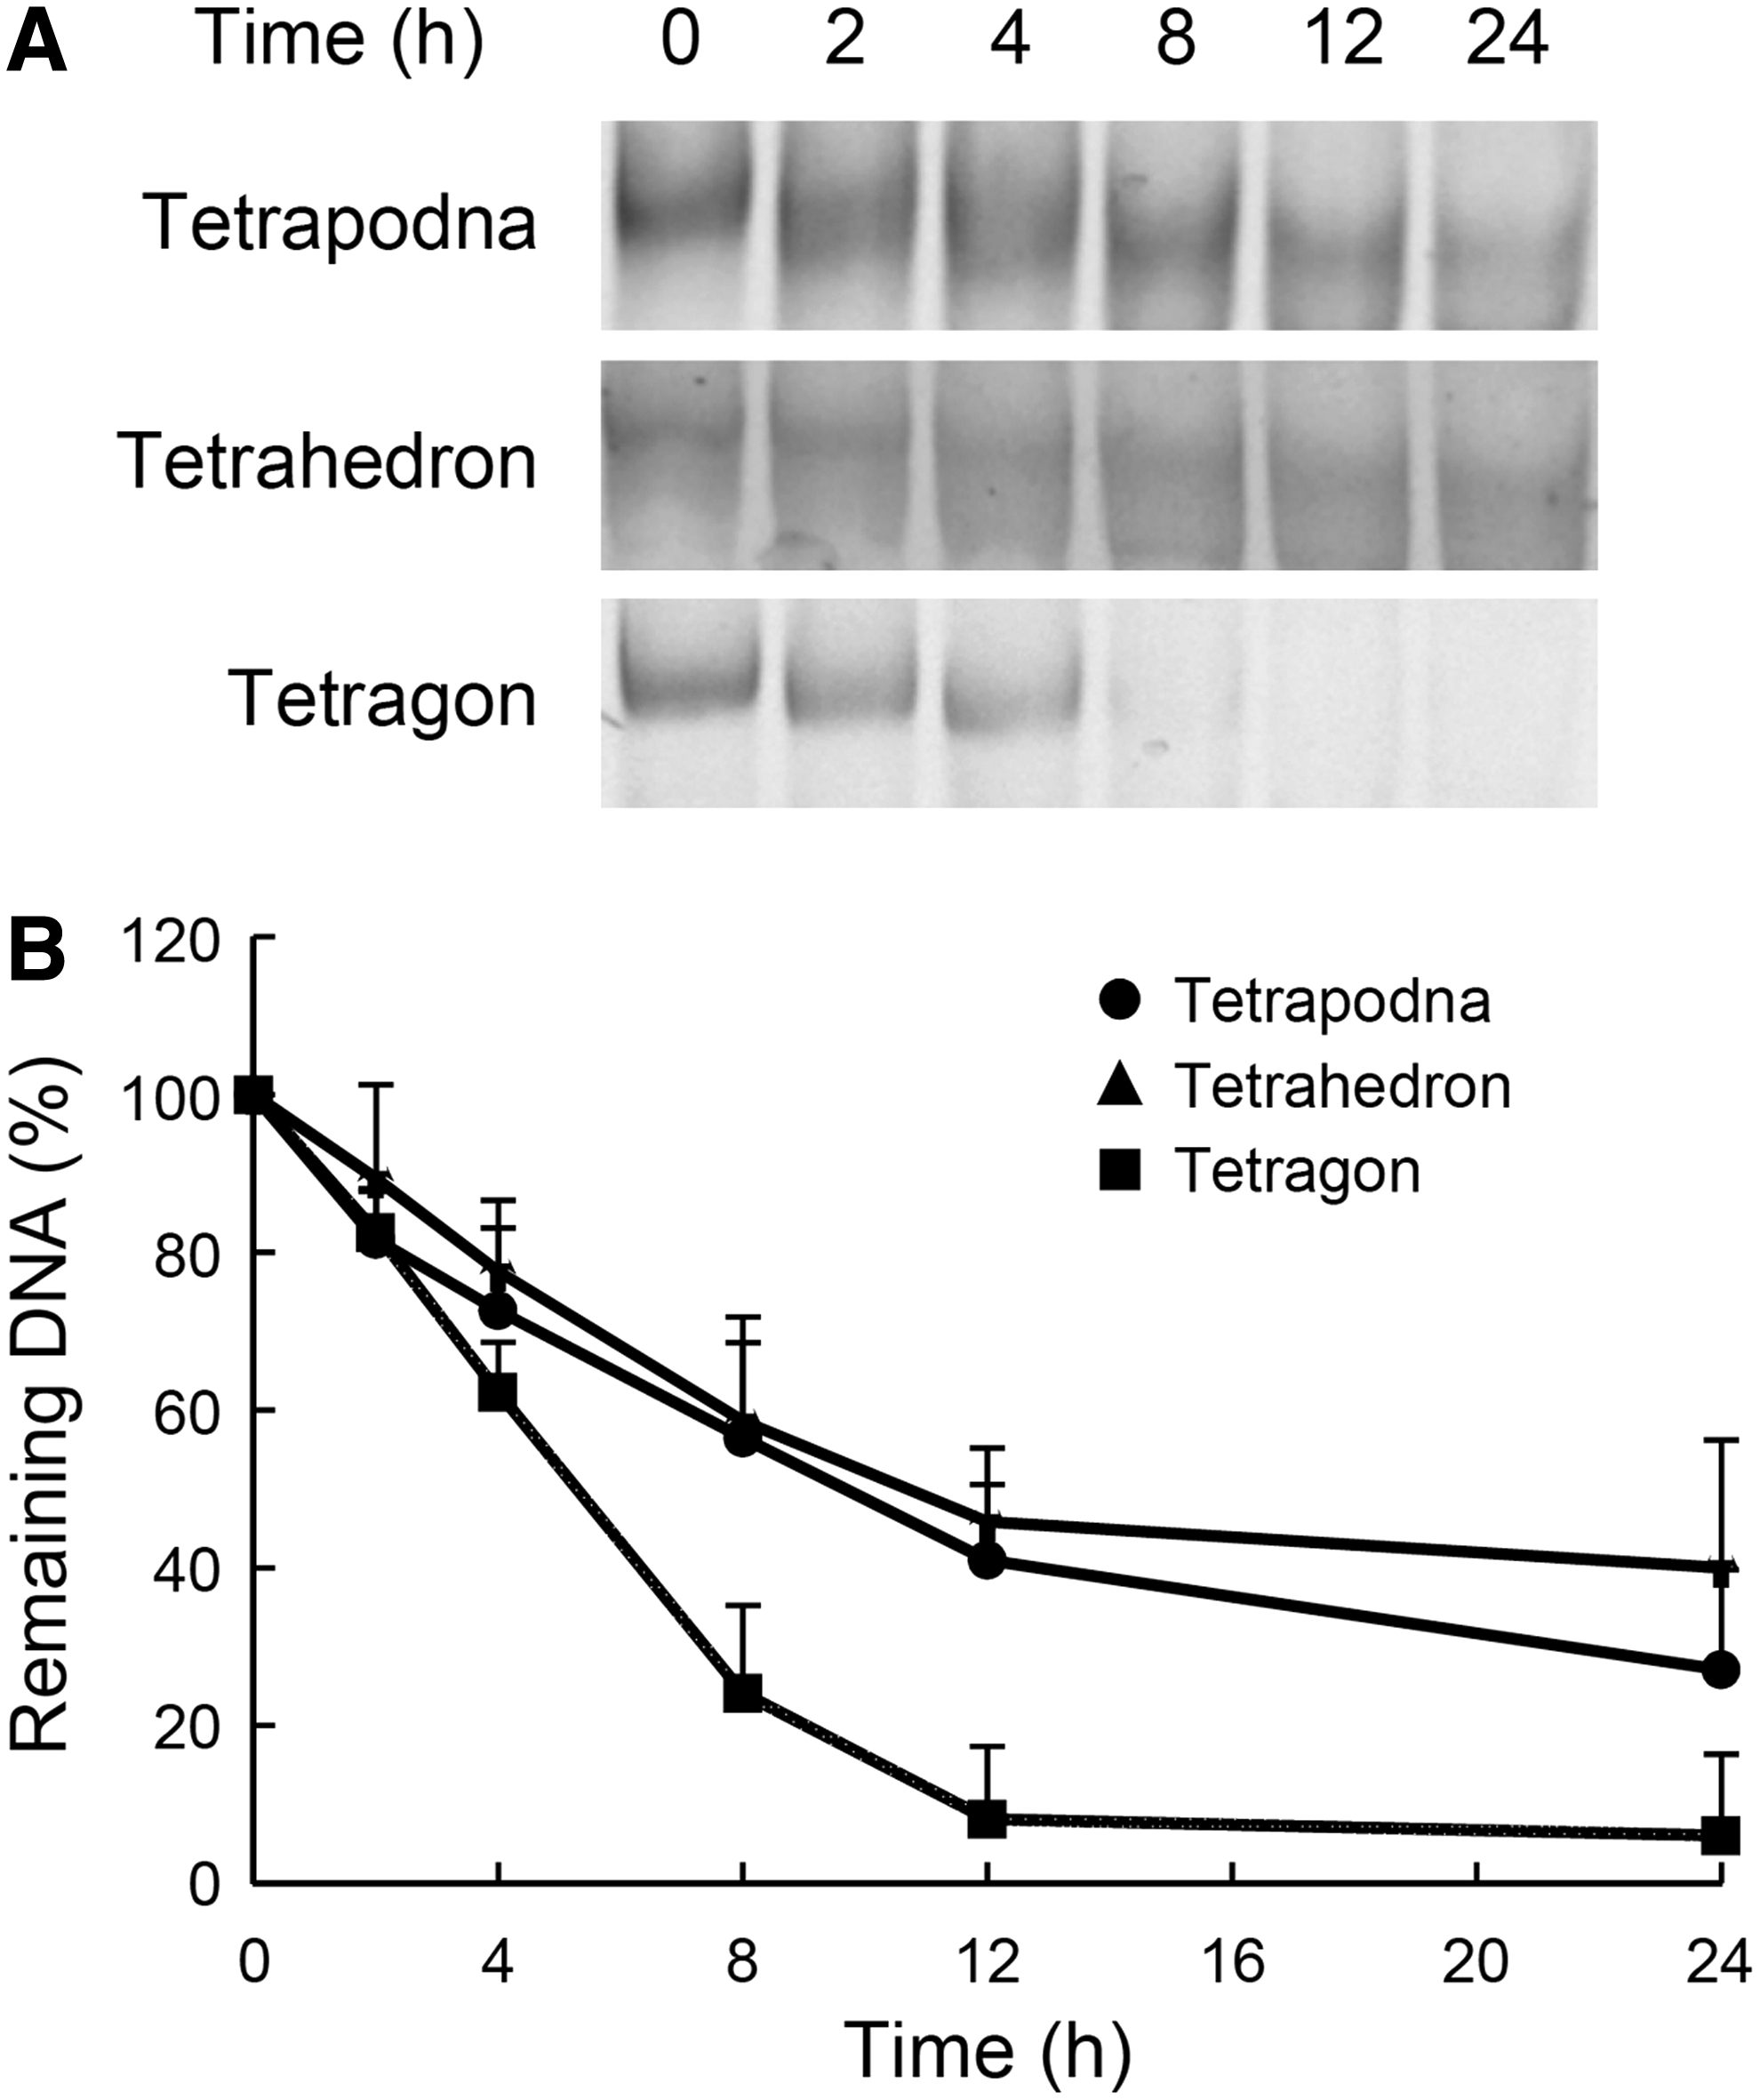
Degradation of tetrapodna, tetrahedron, and tetragon in 50% nonheat-inactivated fetal bovine serum.
Uptake of Alexa Fluor 488-labeled DNA nanostructures in RAW264.7 cells
Figure 6 shows the MFI of RAW264.7 cells after addition of Alexa Fluor 488-labeled DNA samples. RAW264.7 cells with added Alexa Fluor 488-labeled tetrahedron showed the highest MFI value, followed by Alexa Fluor 488-labeled tetrapodna, tetragon, and ssDNA (ODN-1) in this order. The MFI values increased with increasing DNA concentration from 2 to 6 μg/mL in all the cases.
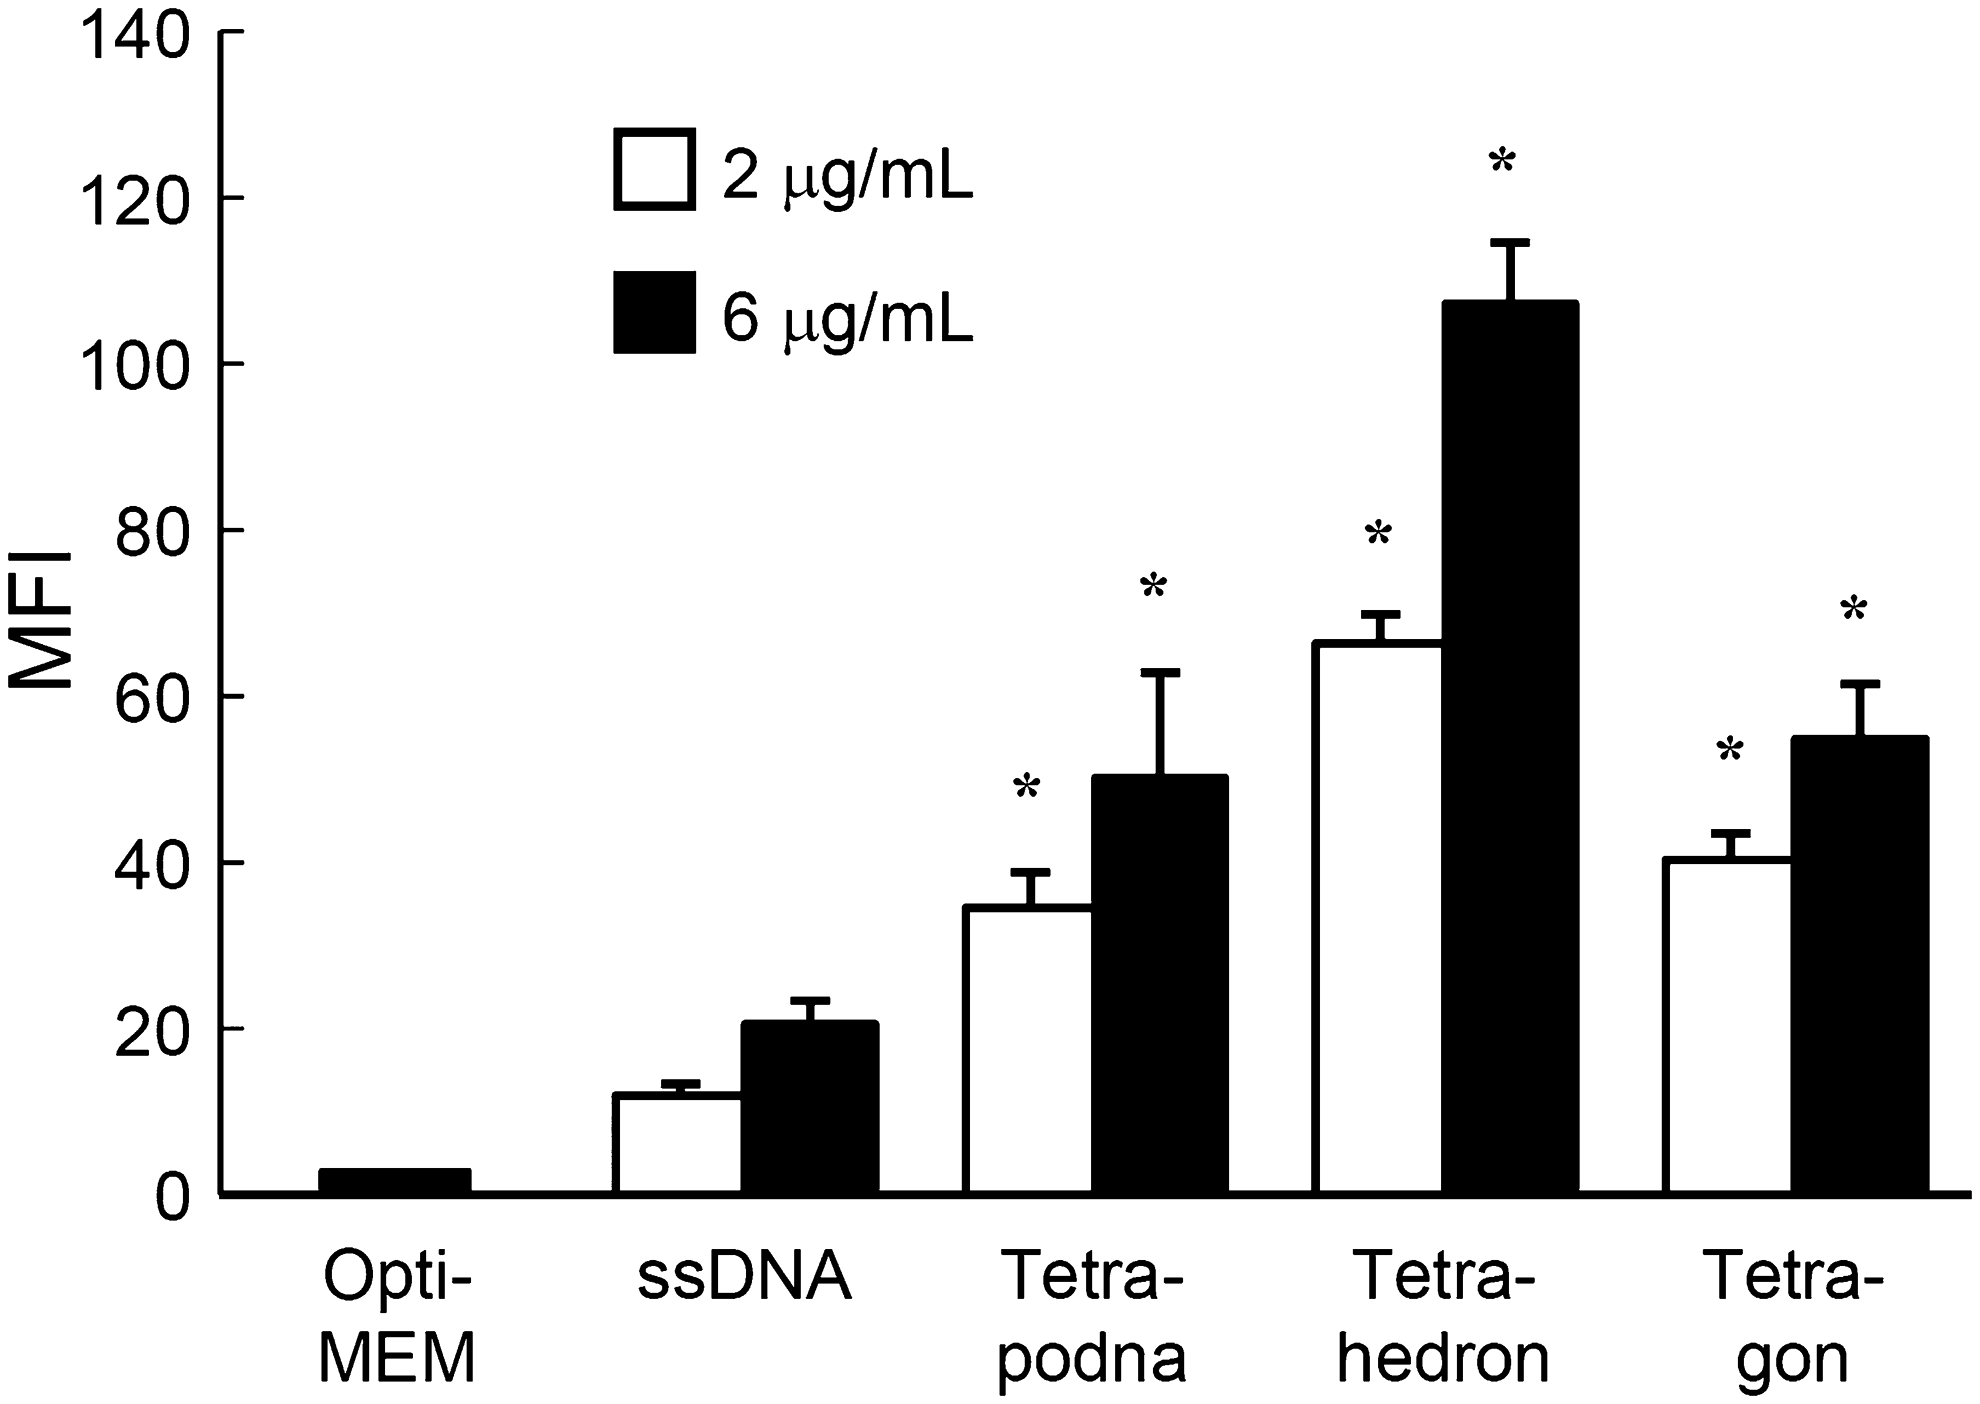
Uptake of ssDNA (ODN-1), tetrapodna, tetrahedron, and tetragon in RAW264.7 cells. Each Alexa Fluor 488-labeled DNA sample was added to cells at a final concentration of 2 or 6 μg/mL. Nonlabeled ODNs were added to Alexa Fluor 488-labeled ssDNA to adjust the amount of the fluorescently labeled DNA added to the cells. The MFI of RAW264.7 cells was measured as an index of cellular uptake (n=4 per group). Results are expressed as mean+SEM of three independent experiments. *P<0.05 compared with ssDNA at the same concentration. MFI, mean fluorescence intensity; ssDNA, single-stranded DNA.
TNF-α release from RAW264.7 cells after addition of CpG DNA nanostructures
Figure 7A shows the MultiNA analysis of tetrapodna, tetrahedron, and tetragon with an extending 25-base-long sequence containing a CpG motif (Supplementary Fig. S3 shows the PAGE analysis of these DNA nanostructures). Each DNA nanostructure containing CpG DNA was named as CpG tetrapodna, CpG tetrahedron, and CpG tetragon, respectively.
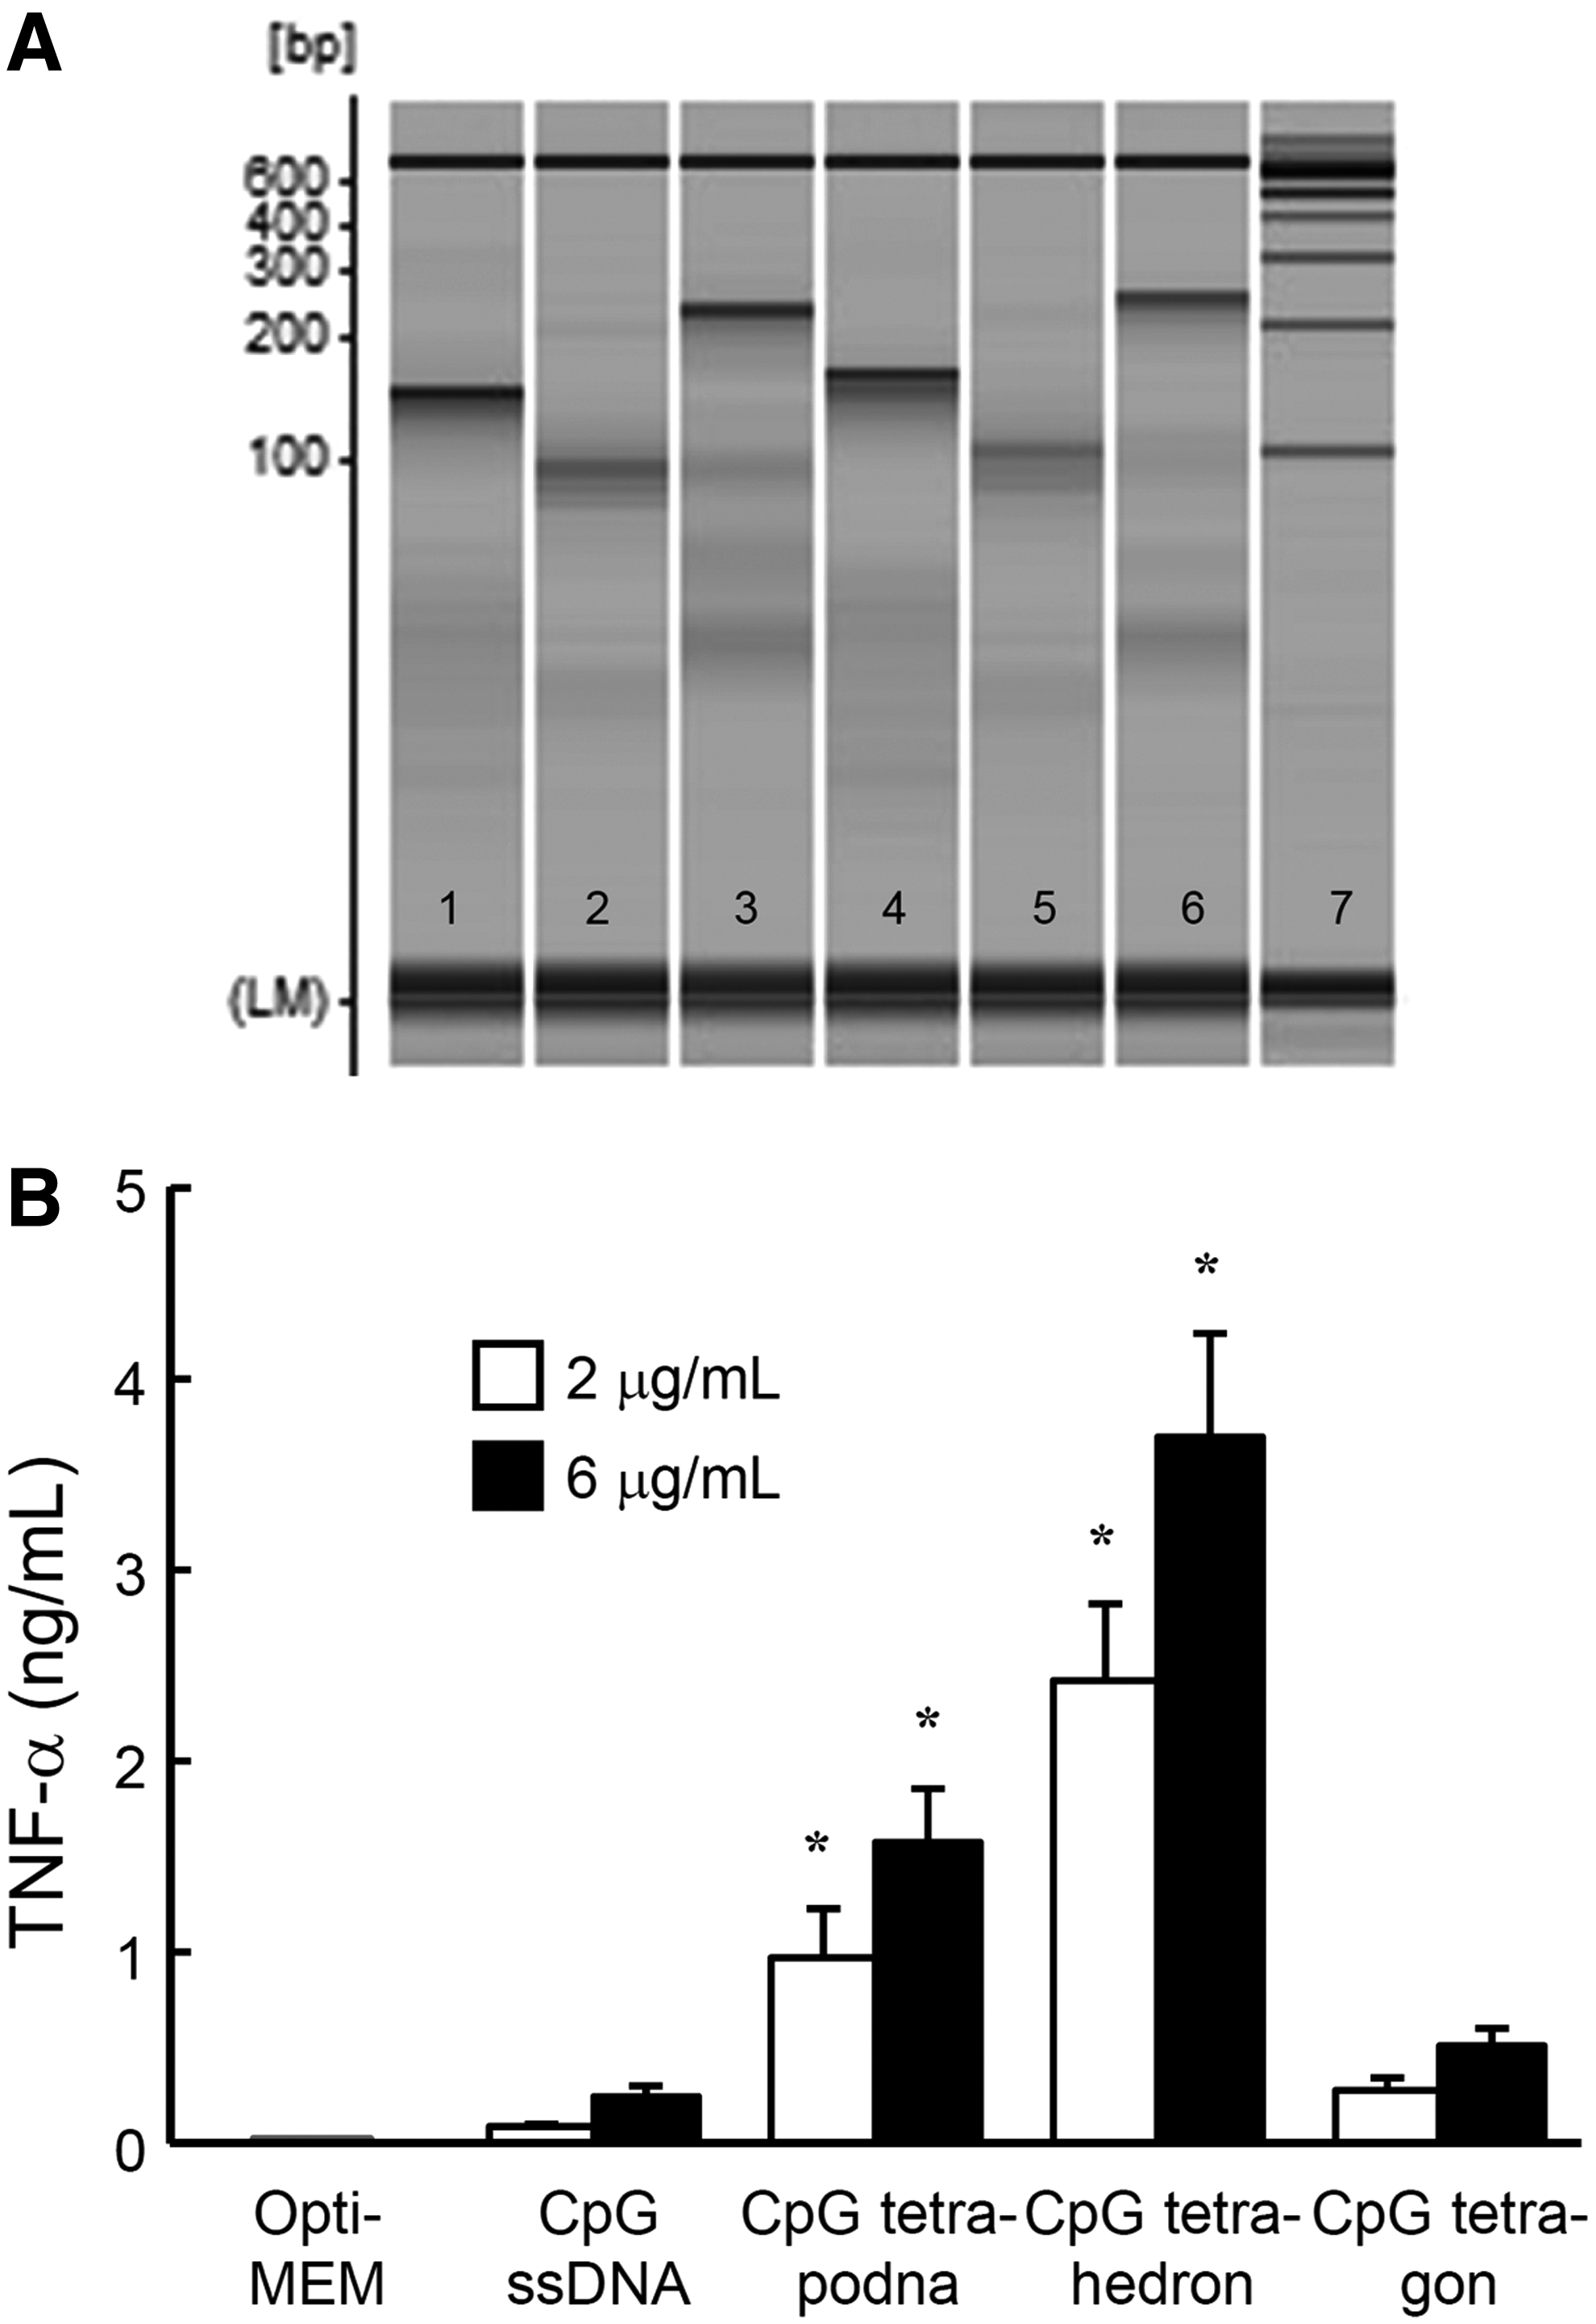
Preparation of CpG tetrapodna, CpG tetrahedron, and CpG tetragon and TNF-α release after addition of CpG DNAs to RAW264.7 cells.
Figure 7B shows the amount of TNF-α released from RAW264.7 cells after addition of CpG ssDNA (CpG ODN-1), CpG tetrapodna, CpG tetrahedron, or CpG tetragon. Compared with CpG ssDNA, all of the CpG DNA nanostructures induced high amounts of TNF-α. CpG tetrahedron induced the largest amounts of TNF-α, followed by CpG tetrapodna. CpG tetragon induced much less TNF-α release from RAW264.7 cells than CpG tetrapodna did, even though there were no significant differences in the uptake between Alexa Fluor 488-labeled tetrapodna and tetragon (Fig. 6). Tetrapodna, tetrahedron, or tetragon containing no CpG motifs induced little TNF-α release when added to RAW264.7 cells (data not shown).
DNA uptake and IFN-α release after addition of DNA nanostructures to human PBMCs
Figure 8 shows the MFI of human PBMCs after addition of Alexa Fluor 488-labeled DNA samples. PBMCs with added Alexa Fluor 488-labeled tetrahedron showed the highest MFI value. The MFI values of PBMCs added with Alexa Fluor 488-labeled ssDNA (ODN-1), tetrapodna, or tetragon were comparable with one another. Figure 9 shows the amount of IFN-α released from RAW264.7 cells after addition of CpG ssDNA (CpG ODN-1), CpG tetrapodna, CpG tetrahedron, or CpG tetragon in the absence or presence of chloroquine. All of the CpG DNA nanostructures induced high amounts of IFN-α compared with CpG ssDNA (CpG ODN-1). IFN-α release was greatly inhibited by chloroquine.

Uptake of ssDNA (ODN-1), tetrapodna, tetrahedron, and tetragon in human PBMCs. Each Alexa Fluor 488-labeled DNA sample was added to cells at a final concentration of 6 μg/mL. Nonlabeled ODNs were added to Alexa Fluor 488-labeled ssDNA to adjust the amount of the fluorescently labeled DNA added to the cells. The MFI of PBMCs was measured as an index of cellular uptake (n=4 per group). Each symbol represents a mean of a single experiment, and each experiment is identified with different symbols. Bars represent the mean of four independent experiments. *P<0.05 compared with ssDNA. PBMCs, peripheral blood mononuclear cells.
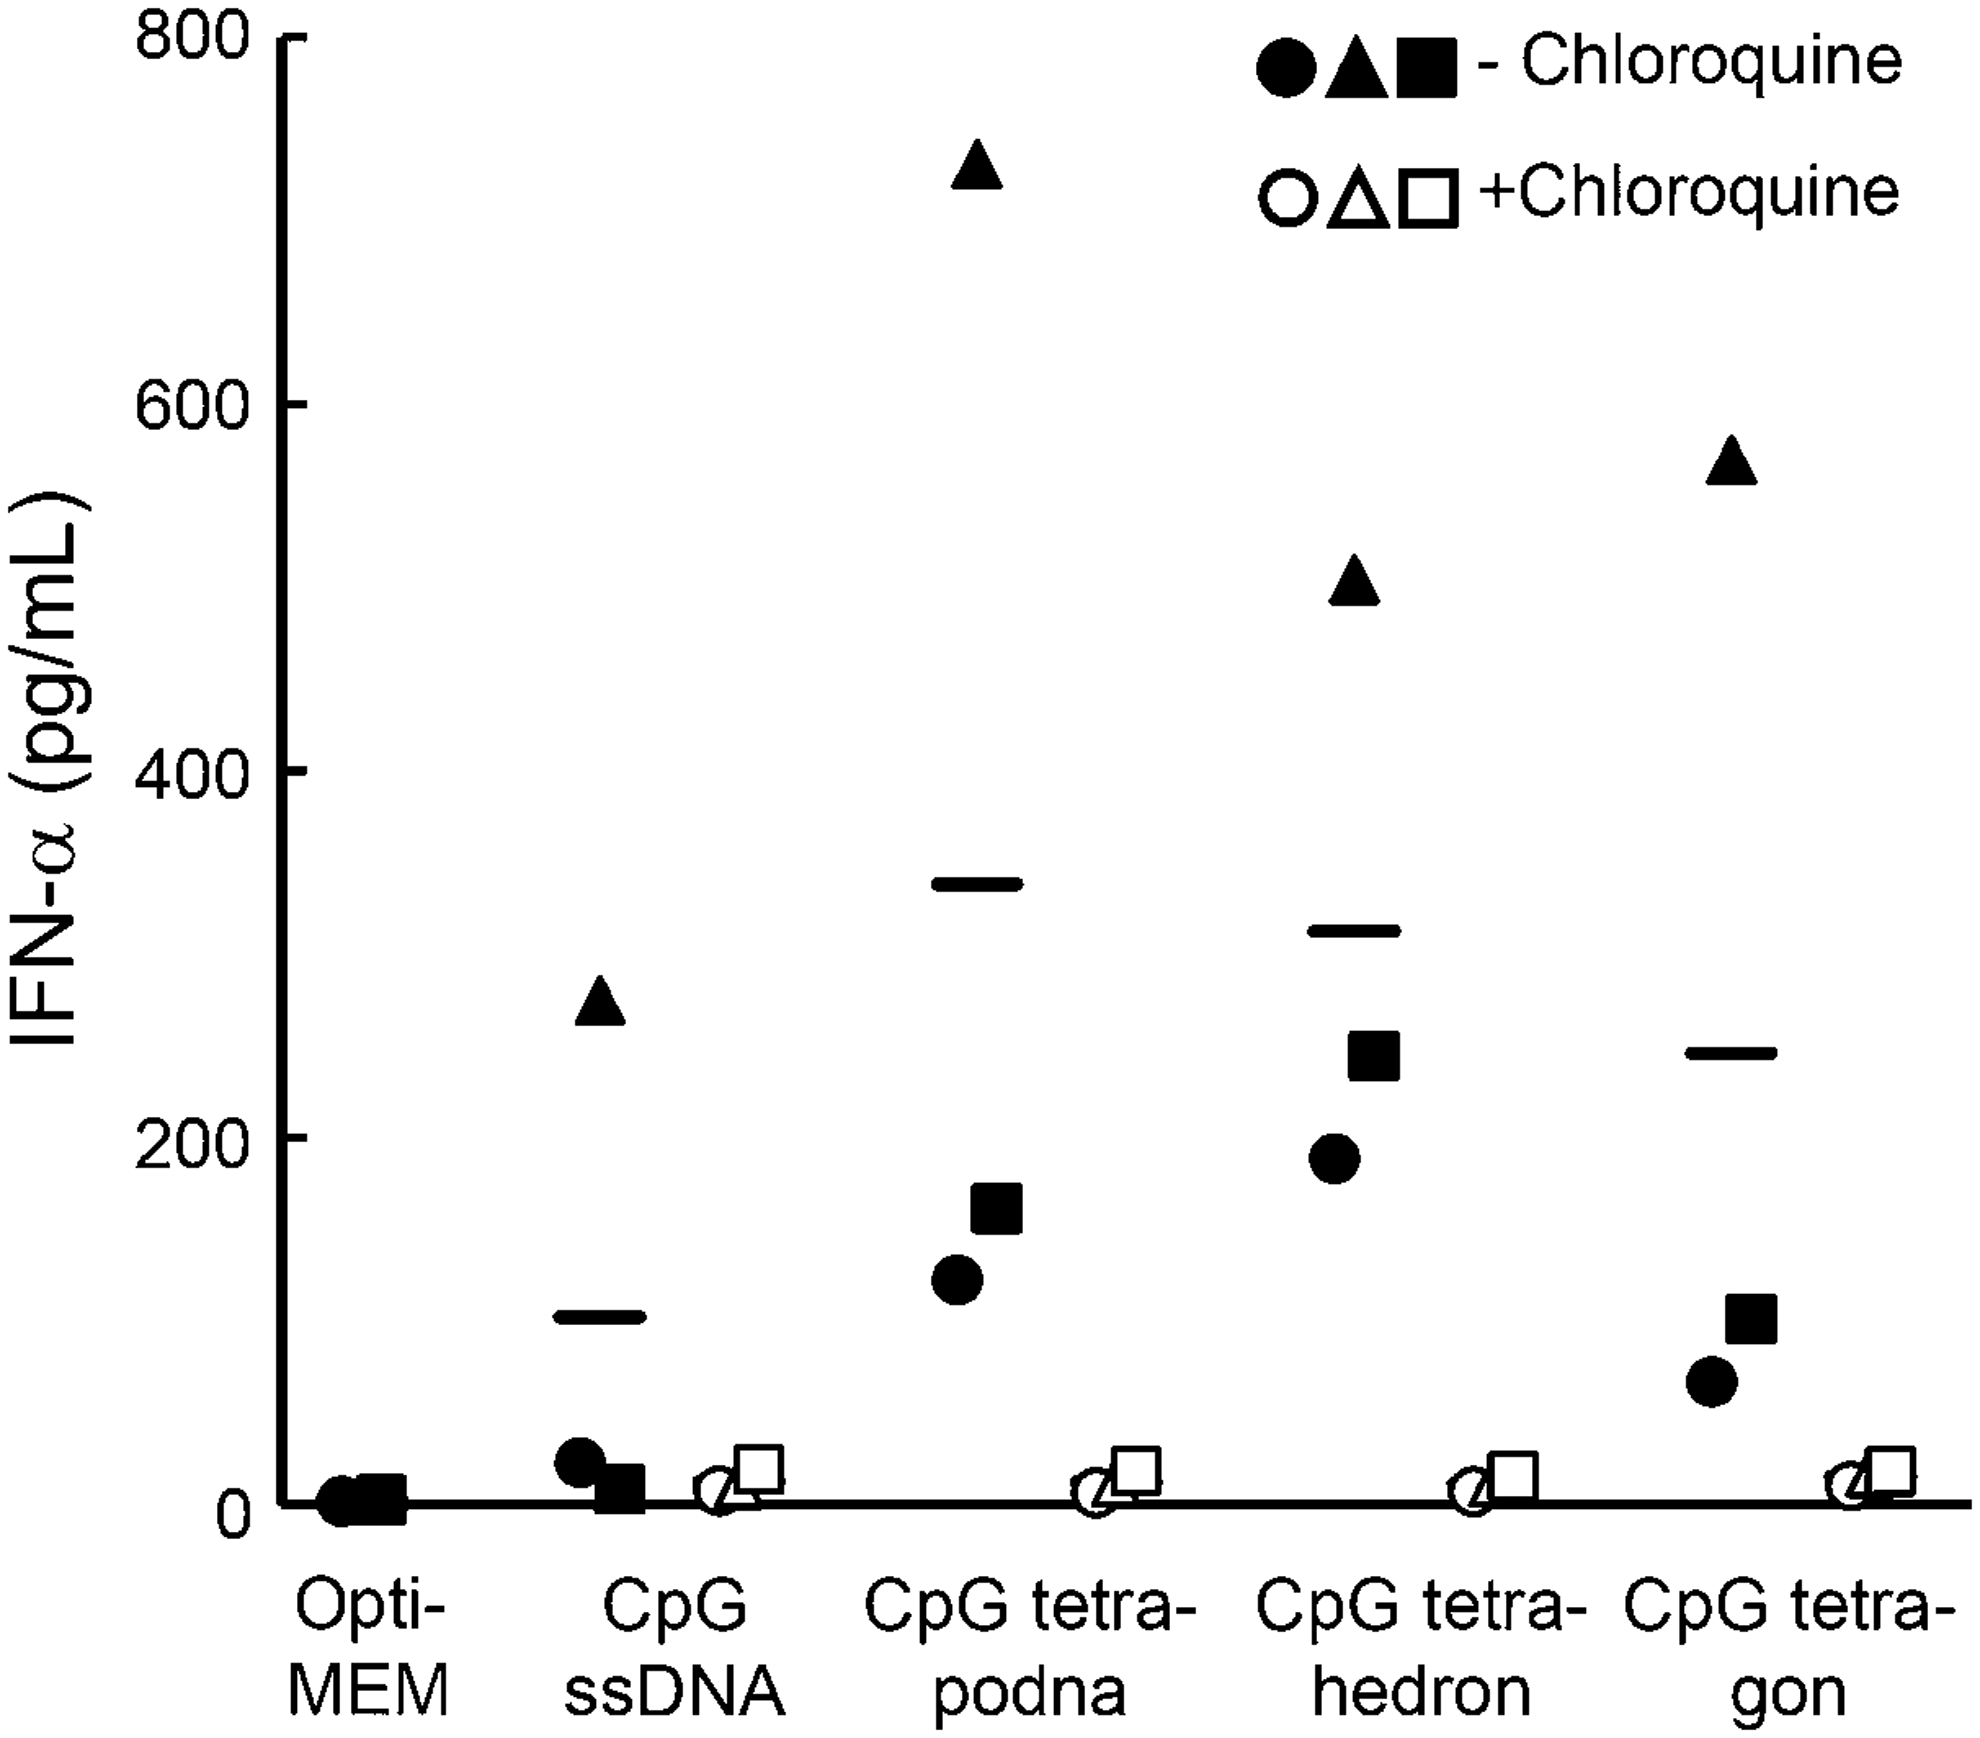
IFN-α release after addition of CpG DNAs to human PBMCs with or without treatment with 100 μM chloroquine. Each DNA sample was added to cells at a final concentration of 6 μg/mL, and the concentrations of IFN-α in the supernatant were measured at 24 h (n=4 per group). Non-CpG ODNs were added to CpG ssDNA to adjust the amount of the CpG DNA added to the cells. Each symbol represents a mean of a single experiment, and each experiment is identified with different symbols. Bars represent the mean of three independent experiments. IFN, interferon.
Discussion
The versatility of DNA nanotechnology makes it possible to design DNA nanostructures of any shape because the number of ODNs as well as their sequence and length can be arbitrarily selected. This is one of the major advantages of DNA nanotechnology and it was used in the present study to construct and compare three different DNA nanostructures.
However, a set of ODNs used for a DNA nanostructure cannot be used to construct other nanostructures, and a different set of ODNs should be prepared for each DNA nanostructure. This difference should be kept in mind when the structural properties of DNA nanostructures are compared with one another. In this study, one of the four ODNs was used for all the three DNA nanostructures to minimize the differences in the sequence of the ODNs. In addition, the guanine-cytosine content, which is a key parameter determining the thermal stability of the structures, was adjusted to be comparable among the three DNA nanostructures between 45% and 47%. Finally, the lack of significant TNF-α release from cells added with any DNA nanostructure containing no CpG motifs indicated that TNF-α release after addition of the CpG DNA nanostructures could be attributed to the CpG motif.
A set of ODNs reported by Li et al. was selected for the comparison because our preliminary studies showed that tetrahedron had much lower flexibility in design than tetrapodna. For example, tetrahedron was not obtained when four 43-mer ODNs were used (Ohtsuki et al., unpublished results), whereas tetrapodna could be formed using four ODNs from 36 to 90-mer ODNs [18]. In addition, the present study revealed that high ODN concentrations resulted in the formation of multimers or aggregates, except for tetrapodna, greatly limiting the conditions for preparing the DNA nanostructures for comparison, even though preparation efficiency is one of the most important parameters as far as biopharmaceutical applications are concerned.
Structures other than those examined in this study can also be designed using four 55-mer ODNs. A simpler structure is a linear one partly or fully containing double-stranded DNA. The structural properties of such linear DNA would be similar to those of double-stranded DNA and therefore it was not included for comparison in this study. Other structures would share the structural properties with tetrapodna (branched DNA), tetrahedron (three-dimensional DNA), or tetragon (rectangular or circular DNA) as far as symmetric structures are concerned. Therefore, the three DNA nanostructures would be reasonable for comparing the structural and biological properties of DNA nanostructures that were designable using four short ODNs.
The present study clearly demonstrated that tetrapodna was by far the best DNA nanostructure in terms of both the preparation efficiency and biological activity. This would be, at least in part, attributed to its high thermal stability (Table 2). The lengths of the consecutive double-stranded parts in each structure were 27, 17, and 26 for tetrapodna, tetrahedron, and tetragon, respectively, and the long double-stranded parts could explain the high Tm value of tetrapodna. The Tm values of the incomplete structures consisting of three of four ODNs were 73°C, 68°C, and 71°C for tetrapodna, tetrahedron, and tetragon, respectively. In addition, the Tm values of the 27-mer double-stranded DNA identical to a branch of tetrapodna and 26-mer double-stranded DNA identical to a side of tetragon were 72°C and 70°C, respectively.
These results strongly indicated that the complete structure of tetrapodna was more thermally stable than the incomplete ones. This unique property is a reason for the very high preparation efficiency of tetrapodna, even at high DNA concentrations. In contrast, the others were not stabilized by the formation of complete structures, which led to the formation of multimers/aggregates at high DNA concentrations.
The above discussions on the thermal stability suggested that it is difficult to redesign tetrahedron with high preparation efficiency even at high DNA concentrations. Li et al. reported that tetrahedron could be obtained by self-assembly of four ODNs, but the authors prepared tetrahedron at a low DNA concentration of 1 μM [20]. As demonstrated in the present study, increasing the DNA concentration reduced the preparation efficiency of tetrahedron. Any approach to avoid the oligomerization of tetrahedron would greatly expand its usefulness as delivery vehicles to immune cells.
DNA nanostructures, including tetrahedron, were considered to be monomer under the experimental conditions examined, but the possibility that they form multimers or aggregates at their interaction with cells cannot be excluded at this moment. Therefore, there is still a possibility that the efficient cellular uptake of tetrahedron is due to its more efficient formation of multimers or aggregates than the others.
Our previous study on the interaction of polypodnas with immune cells, including RAW264.7 cells and mouse bone marrow-derived dendritic cells, indicated that DNA assemblies with bulky structures were more efficiently taken up by the cells compared with ones with sparse structures [16–19]. A previous study reported that longer DNA was better than short ones in terms of cellular uptake [18].
Several receptors or membrane proteins have been reported to be involved in the cellular uptake of DNA [24,25], although no consensus applicable to various cells has been reached yet. However, the results of the cellular uptake of DNA preparations suggested that the interaction of DNA with the cell surface at multiple sites facilitated its cellular uptake. The present study showed that tetrahedron was better than tetrapodna in terms of the uptake by RAW264.7 cells (Fig. 6). The formation of oligomers might be involved in the efficient uptake of tetrahedron, even though tetrahedron was prepared under conditions where multimers were not easily formed (Fig. 2A, lane 9). The reason for this efficient cellular uptake of tetrahedron requires further investigation.
The experimental results obtained with human PBMCs showed large variations compared with those with RAW264.7 cells, probably because of intraindividual and/or interindividual variability in the property of the cells. Generally speaking, however, the results were comparable with those with RAW264.7 cells, suggesting that the DNA nanostructures examined in this study, especially CpG tetrapodna and CpG tetrahedron, induce cytokines, including IFN-α, in humans more efficiently than CpG ssDNA. The substantial inhibition of IFN-α release from human PBMCs by chloroquine, an inhibitor of endosomal TLR signaling, strongly suggests that the TLR9 is involved in the IFN-α release from the cells after addition of CpG tetrapodna, CpG tetrahedron, or CpG tetragon.
In contrast, the uptake of Alexa Fluor488-labeled tetrapodna and tetragon by human PBMCs was comparable with that of Alexa Fluor488-labeled ssDNA, which was different from the results obtained using RAW264.7 cells (Fig. 8), A possible explanation for this difference is that the population of cells that can be responsible for stimulation with CpG DNA in PBMCs, that is, plasmacytoid dendritic cells, is quite low [26]. A higher uptake of Alexa Fluor488-labeled tetrahedron than the others may indicate that tetrahedron is efficiently taken up not only by plasmacytoid dendritic cells but also by other cells in PBMCs.
The present study clearly showed that tetrapodna had the highest thermal stability and best formation efficiency, and CpG tetrapodna possessed high potency to induce TNF-α release from RAW264.7 cells and IFN-α release from PBMCs. Despite efficient cellular uptake and TNF-α release, the low formation efficiency of tetrahedron greatly limited its application as a delivery vehicle of immunostimulatory DNAs. CpG tetragon was the least efficient in terms of TNF-α release. Taken together, we conclude that tetrapodna is the best assembly as delivery vehicles for immunostimulatory nucleic acids to immune cells and that tetrahedron can be another useful assembly for cellular delivery if its preparation yield is improved.
Footnotes
Acknowledgments
This work was supported by a Grant-in-Aid for Young Scientists (B) [no. 26860021] to K.M.; Grants-in-Aid for Scientific Research (B) [no. 23390010 and no. 26293008] to M.N. from the Japan Society for the Promotion of Science; Grant-in-Aid for Scientific Research on Innovative Areas Carcinogenic spiral [no. 25114706] to M.N. from the Ministry of Education, Culture, Sports, Science, and Technology of Japan; and Cross-Disciplinary Collaborative Research Promotion Project to Y.T. from the Institute for Integrated Cell-Material Sciences, Kyoto University.
Author Disclosure Statement
No competing financial interests exist.
References
Supplementary Material
Please find the following supplemental material available below.
For Open Access articles published under a Creative Commons License, all supplemental material carries the same license as the article it is associated with.
For non-Open Access articles published, all supplemental material carries a non-exclusive license, and permission requests for re-use of supplemental material or any part of supplemental material shall be sent directly to the copyright owner as specified in the copyright notice associated with the article.