
Abstract
DNA triplexes with hydrophobic modifications were designed and evaluated for their activity as inhibitors of the cell fusion of human immunodeficiency virus type 1 (HIV-1). Triplex inhibitors displayed low micromolar activities in the cell–cell fusion assay and nanomolar activities in the anti-HIV-1 pseudovirus test. Helix structure and the presence of sufficient numbers of hydrophobic regions were essential for the antifusion activity. Results from native polyacrylamide gel electrophoresis and a fluorescent resonance energy transfer-based inhibitory assay indicated that these triplexes may interact with the primary pocket at the glycoprotein 41 (gp41) N-heptad repeat, thereby inhibiting formation of the HIV-1 gp41 6-helical bundle. Triplex-based complexes may represent a novel category of HIV-1 inhibitors in anti-HIV-1 drug discovery.
Introduction
T
We hypothesized that DNA triplexes with hydrophobic modifications at suitable positions would display inhibitory activities against the fusion of HIV-1 to the cell membrane. This hypothesis was made because an aromatic substituent and a negatively charged helical skeleton can also be achieved on DNA triplex-based molecules. DNA triplex-based inhibitors may represent a novel category of HIV-1 inhibitors in anti-HIV-1 drug discovery and may be as important as the previously described quadruplex- and duplex-based inhibitors. To the best of our knowledge, no DNA triplex-based HIV-1 inhibitor has been reported to date. Furthermore, because they are distinguished from quadruplex- and duplex-based inhibitors by their oligonucleotide assembly pattern, charge density, and molecular length, DNA triplex-based inhibitors provide structural diversity. Analysis of these DNA helix-based inhibitors will improve understanding of the structure–activity relationship among them.
Materials and Methods
Oligodeoxynucleotides and formation of triplexes
Oligodeoxynucleotides (ODNs) were synthesized in an ABI 392 DNA/RNA synthesizer (Applied Biosystems) on a 0.2-μmol scale. Universal CPG (SU3010; Beijing DNAchem Biotechnology Co. Ltd.; Supplementary Fig. S1; Supplementary Data are available online at www.liebertpub.com/nat) was used. All ODNs were deprotected by incubation in concentrated ammonia for 3 h at 55°C. ODNs were purified by reverse-phase high-performance liquid chromatography in a C-10AT system (Shimadzu) equipped with a Diamonsil C-18 column (4.6×250 mm; 5-μm particle size; Dikma). Mobile phase A consisted of 0.07 M triethylammonium acetate (pH 7.0) and 5% acetonitrile. Mobile phase B consisted of acetonitrile, which was diluted in A from 5% to 60% for 30 min at 1 mL/min. ODNs were desalted with SEP-PAK cartridges (Oasis MCX, C18; Waters), lyophilized, and stored at −18°C Supplementary Fig. S2. For characterization of the ODNs, matrix-assisted laser desorption–ionization time-of-flight mass spectrometry (MS) (KRATOS Analytical, Shimadzu Group Company), with 2′,4′,6′-trihydroxyacetophenone (THAP) as the matrix, and electrospray ionization MS (380 V; Thermo LCQ DECA) were used.
Triplexes were formed in a phosphate-buffered saline (PBS) solution containing 0.1 M Na+ and 0.05 M Mg2+. The corresponding ODNs were mixed at molar ratios of 1:1:1 (for triplexes T1 and T2, Table 1) or 1:1 (for triplexes T3–T5). Triplexes were annealed by heating at 90°C for 5 min and then cooling to 20°C at a rate of 0.3°C/min, followed by overnight incubation at 20°C. The stock concentration of triplex was 100 μM.
Bold represents the nucleoside analogs in Fig. 1.
IC50 is the concentration of inhibitor required for 50% inhibition of fusion in Tzm-bl cells and HL2/3 cells. Data were derived from the results of three separate experiments and are expressed as the mean±standard deviation.
“//” represents the 3′ end of each oligonucleotide strand.
T, triplex; D, duplex; S, single strand of oligonucleotide.
NA, not applicable; ND, not detected; ODN, oligodeoxynucleotide.
Molecular modeling
The molecular model of triplex T3 was initially built as two separate complexes (O7 and O8) in HyperChem Professional 7.0 with O8 base-pairing to the corresponding part of O7 in the duplex model. Then, the two separate complexes were manually assembled into the triplex T3 in Accelrys DS ViewerPro 5.0, according to the structural information from a similar PDB file of triplex DNA (PDB ID: 1D3R). Finally, the complex was energy minimized in HyperChem.
Cell–cell fusion assay
The cell–cell fusion assay was performed as described [14,15]. HIV-1 envelope glycoprotein (Env)-mediated cell–cell fusion was used to determine the inhibitory activity of ODNs in HL2/3 and TZM-bl cells [gifts from the AIDS Reference and Reagent Program, NIH, from Drs. B.K. Felber, G.N. Pavlakis (for HL2/3), J.C. Kappes, X. Wu, and Tranzyme, Inc. (for TZM-bl)]. HL2/3 is an effector cell line expressing HIV-1 Gag, Env, and Tat proteins at the cell surface [16]. TZM-bl cells are target cells expressing CD4 and coreceptors [17]. Fusion efficiency was determined by measuring the luciferase activity on a SpectraMax M5 Plate Reader (Molecular Devices). The half-maximal inhibitory concentration (IC50) was computed by fitting a four-parameter nonlinear regression model in the Origin software program (OriginLab).
Inhibition of HIV-1 pseudovirus infection
HIV-1 pseudovirus was generated as previously described [18–20]. The 50% tissue culture infective dose (TCID50) of a single thawed aliquot of each pseudovirus batch was determined in TZM-bl cells. Antiviral activities of triplex inhibitors were tested by a single-cycle infection assay. Briefly, triplexes were mixed with 100 TCID50 viruses by stepwise serial dilution and incubated for 1 h at room temperature. The mixture was added to TZM-bl cells (104/well) and incubated at 37°C for 48 h. The luciferase activity was measured using luciferase assay reagents (Promega) and a luminescence counter (Promega), in accordance with the manufacturer's instructions.
Native polyacrylamide gel electrophoresis test
An equimolar concentration of each triplex inhibitor was incubated with the N36 peptide (100 μM) at 37°C for 30 min, followed by the addition of C34 (100 μM) and incubation for another 30 min at 37°C. In the control experiments, N36 was incubated with C34 or PBS at 37°C for 30 min. Samples were mixed with the native polyacrylamide gel electrophoresis (N-PAGE) sample buffer (Invitrogen) and loaded onto 12% agarose gels (Invitrogen) at 25 μL/well. The gel was conducted at 90 V for 40 min, followed by 120 V for 2 h. The gel was stained with Coomassie Blue and visualized with the gel documentation and imaging analysis system (Alpha Innotech Corp.).
FRET assay
The FRET assay was carried out as previously described [14,15,21]. The peptide receptor env2.0 containing the primary pocket of the HIV-1 gp41 NHR was mixed with the fluorescence peptide probe CP2-LY, which specifically binds to the pocket. Formation of a 6-helical bundle (6HB) between env2.0 and CP2-LY caused quenching of fluorescence through FRET between the fluorophore and the Fe(bpy)3 (Supplementary Fig. S3) coordination complex center in env2.0.
In the competitive inhibition assay, inhibitors at different concentrations were added to the assay reagent. Inhibitors that competitively interacted with env2.0 would release CP2-LY, with reestablishment of the fluorescence signal. Fluorescence intensities were measured on a Molecular Device M5 Plate Reader using excitation and emission wavelengths of 425 and 540 nm, respectively. The concentration of inhibitor that achieved a 50% fluorescent signal recovery (IC50) was calculated from the dose–response curve in the Origin program.
Tm measurement and circular dichroism spectra
The thermal transition curve of each triplex was determined with a Cary-100 Bio UV-Visible spectrophotometer equipped with a Cary temperature controller (Varian). Stock solution of triplex described above was used at a final concentration of 5 μM triplex. Tm was measured while increasing the temperature from 20°C to 90°C at a rate of 1°C/min. Ultraviolet (UV) absorbance was recorded at 260 nm during the process. Three repeated experiments were performed to derive the means and standard deviations.
Circular dichroism (CD) spectra were acquired on a Biologic spectropolarimeter (MOS-450; Bio-Logic, Inc.) using a 4.0-nm bandwidth, 0.1-nm resolution, 0.1-cm path length, 4.0-s response time, and 50-nm/min scanning speed. CD spectrum results of T1 to T5 are shown in Supplementary Figs. S4–S8.
Results
ODNs and triplexes
Supplementary Table S1 shows the MS measurement results of the ODNs that were used to assemble the five DNA triplexes shown in Table 1. Tm, N-PAGE, sedimentation velocity, and CD spectrum analyses were used to verify triplex formation (Supplementary Figs. S9–S11). The hydrophobic groups used in this study (Fig. 1) were tert-Butyldiphenylsilyl (TBDPS) and 4,4′-dimethoxytriphenylmethyl (DMT). TBDPS was contained in a previously reported nucleoside analog (Fig. 1, labeled
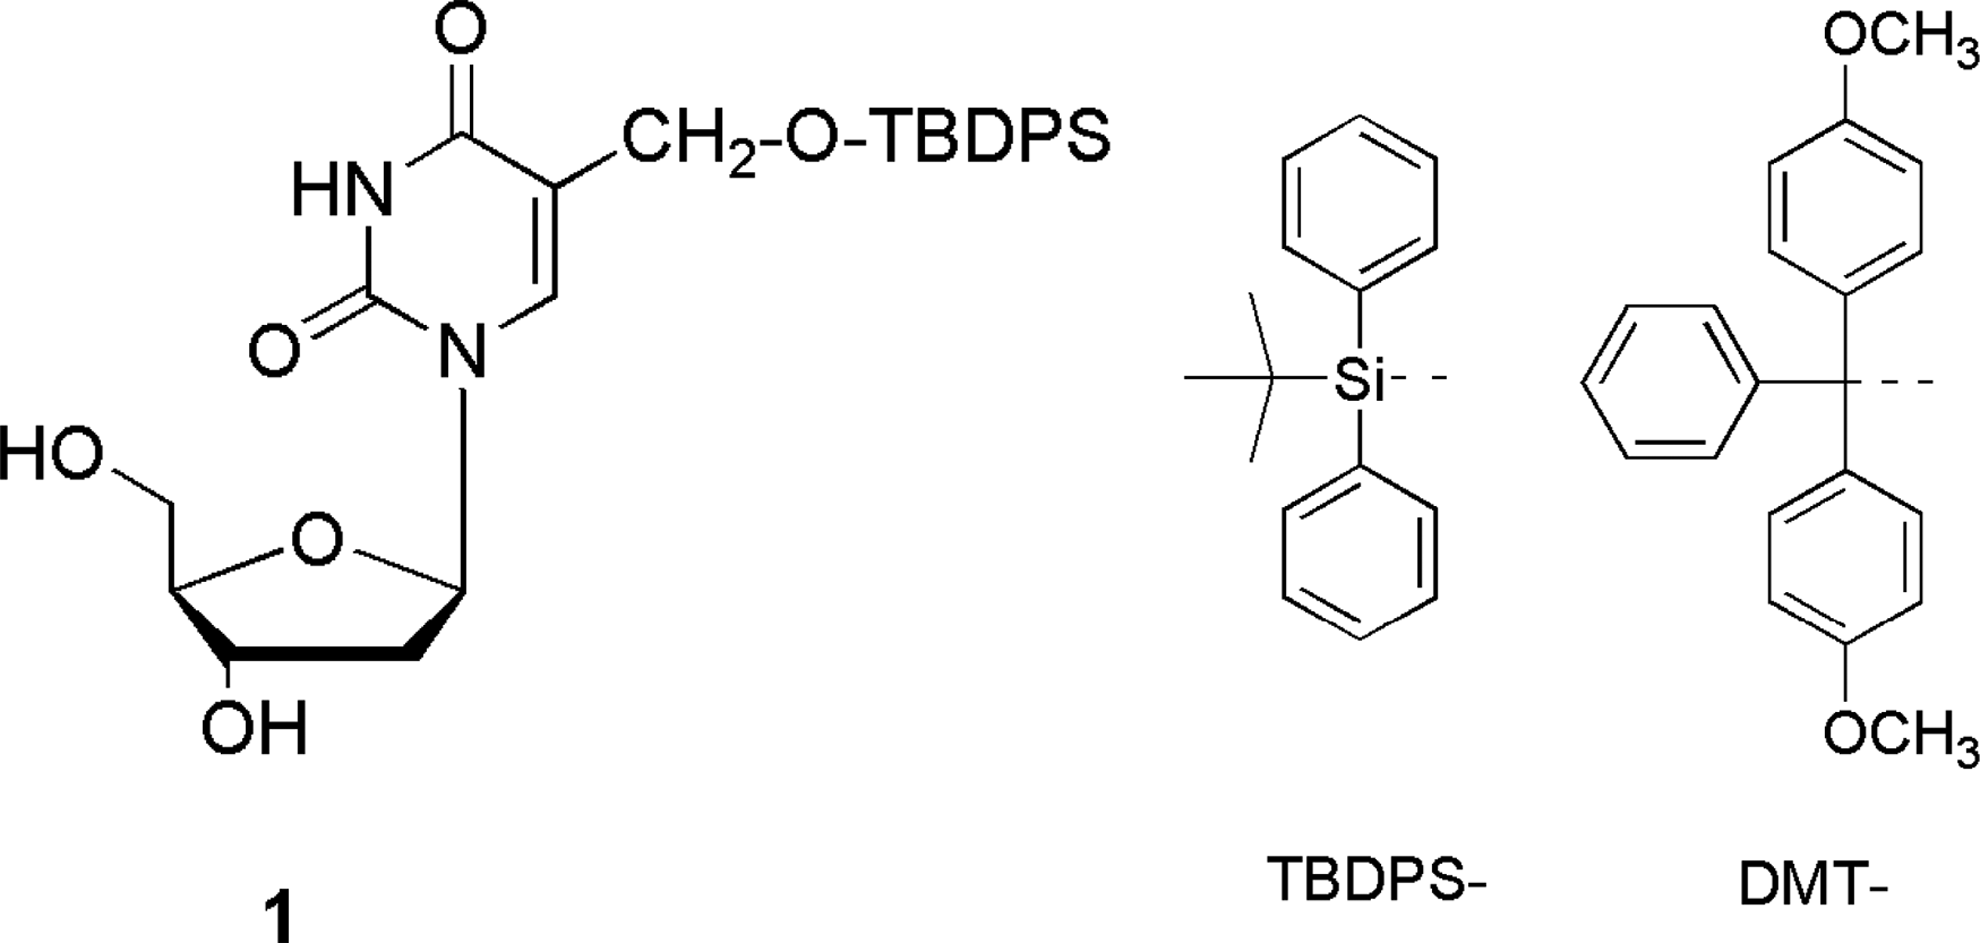
Structures of the nucleoside analogs
Inhibitory activity of triplexes determined by the cell–cell fusion assay
The DNA triplexes used in this study can be classified into two types according to their structural character. The first type (triplexes T1 and T2, Table 1) was designed to exhibit a pyrimidine–purine–purine triplex structure. For this type, as the temperature increases, the Hoogsteen strand dissociates first, followed by the W-C duplex. Thus, these triplexes typically showed a two-step melting curve (Supplementary Fig. S1), with Tm values of 76.1°C±1.5°C and 42.5°C±1.3°C for T1 and 69.9°C±2.7°C and 39.8°C±0.9°C for T2. The helices of T1 and T2 were 32- and 30-bases long, respectively. T1 contained three hydrophobic groups (one TBDPS and two DMTs) at each end of the helix. The IC50 for T1 was 1.8±0.7 μM, comparable to the previously reported IC50 values of duplex and quadruplex inhibitors [3–15]. T2 had no hydrophobic group modifications and did not show the anti-HIV-1 fusion activity.
Triplexes of the second type (T3, T4, and T5) were designed to exhibit a palindromic triplex structure, which is more stable than the pyrimidine–purine–purine structure for the same chain length [24,25]. Therefore, T3, T4, and T5 could be designed with a shorter helix length compared to T1 and T2 while maintaining similar thermal stability. Triplexes of the second type contained two 24-base homopyrimidines and two 12-base homopurines in a 1:1 molar ratio. Homopurine strands were assembled with their 3′ ends face-to-face in the center of the triplex (diagrams of the T3 structure are shown in Figs. 2 and 3). Each purine segment could form W-C base pairs with half of the antiparallel pyrimidine strand and Hoogsteen base pairs with half of the parallel pyrimidine strand. Therefore, as the temperature increases, the triplex breaks up as a whole because the W-C and Hoogsteen base pairs dissociate simultaneously. Generally, only one melting curve was observed for this type of structure, with Tm values of 41.9°C±0.8°C for T3, 40.7°C±1.3°C for T4, and 40.3°C±0.7°C for T5 (Supplementary Fig. S1).
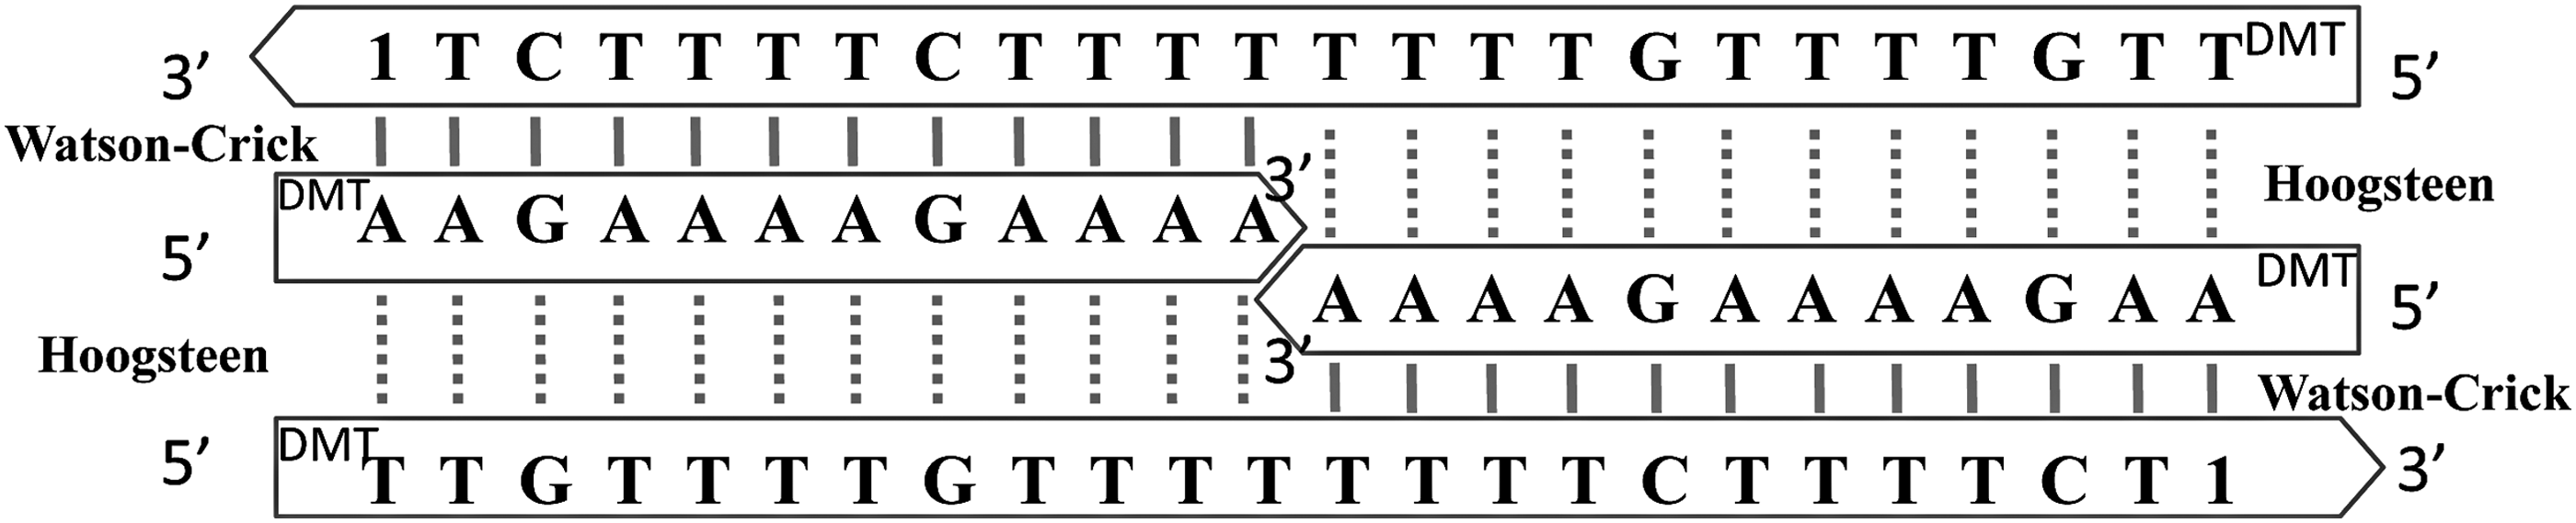
Diagram of the T3 structure. Watson–Crick H-bonds are shown as solid lines, Hoogsteen H-bonds are shown as dotted lines.
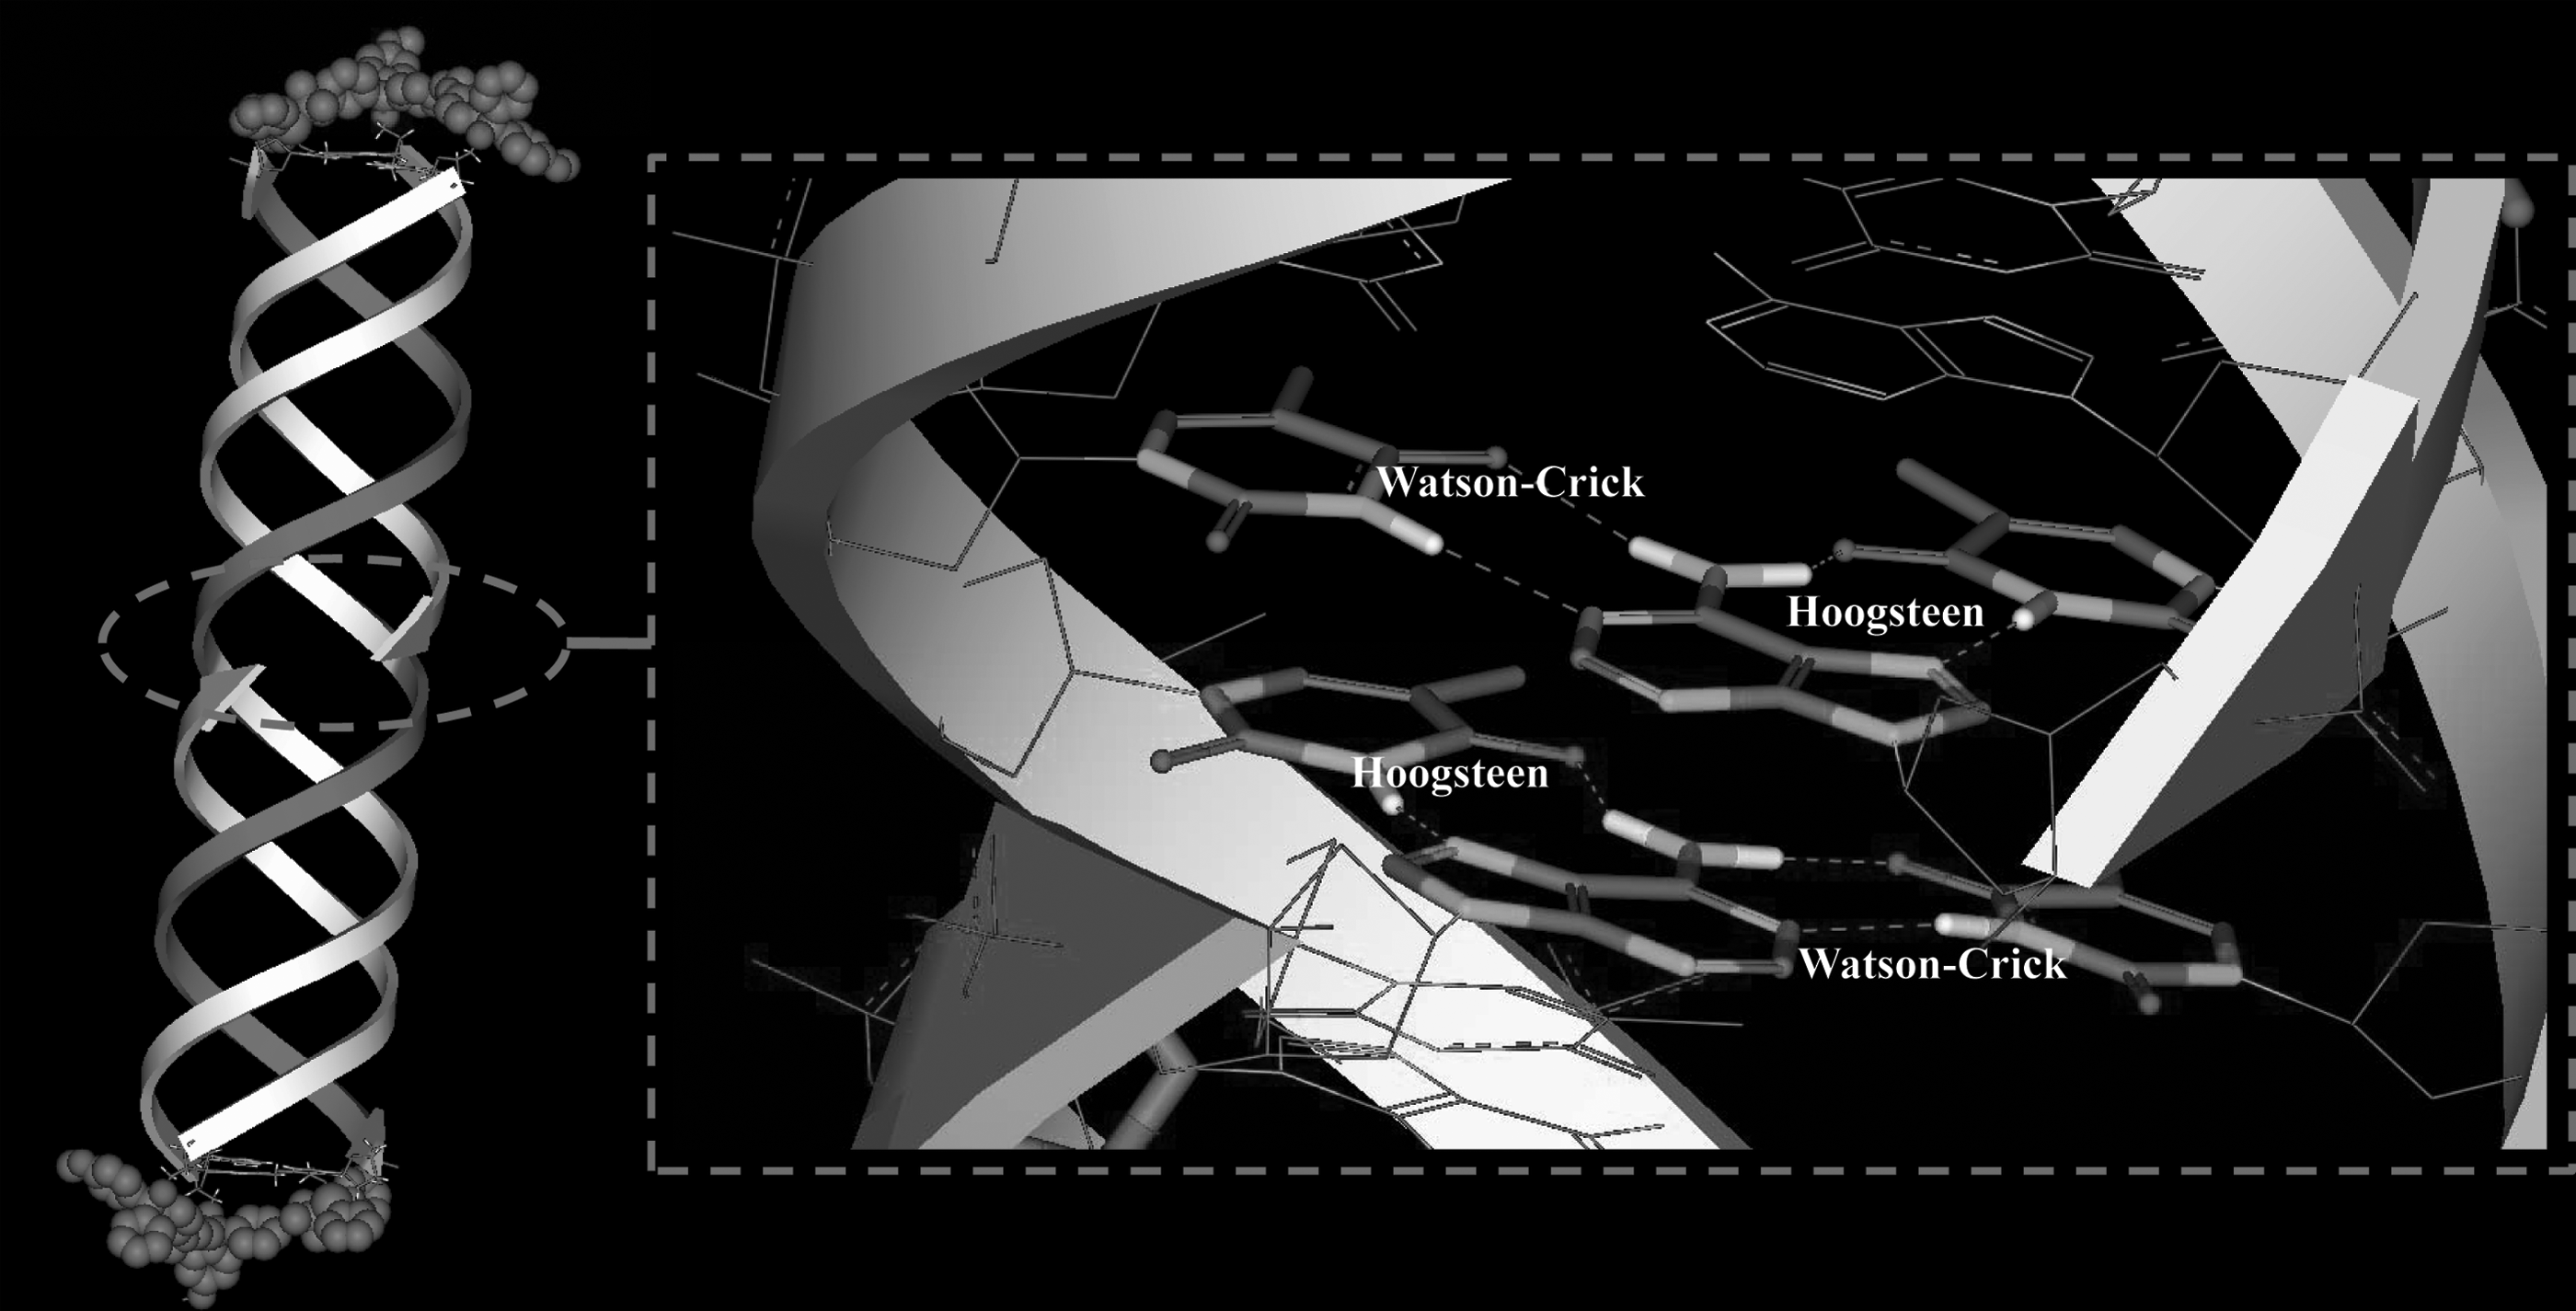
Sketch map of the three-dimensional structure of T3. The two 5′ halves of the homopyrimidine strands that form the Hoogsteen H-bonds are shown in deep color on the left. Hydrophobic groups are shown in the CPK mode. The enlarged view of the center region shows that the triplex is a continuous structure. The two base-pairing layers in the center of the helix (base-pairing of the two 3′ ends of the homopurine chains) are shown as a stick model.
The number of hydrophobic groups and their effect on the activity were also investigated for the three palindromic triplexes. T3 contained three hydrophobic groups (one TBDPS and two DMTs) at each end of the helix and it displayed an IC50 of 1.7±0.3 μM. T4 contained two DMTs at each end and it displayed an IC50 of 30.8±2.8 μM. T5 contained no hydrophobic groups and it showed no activity. These results suggest that the presence of a sufficient number of hydrophobic groups is critical to maintaining the inhibitory activity against HIV-1 fusion to the cell membrane. In addition, as T3 had the same number of hydrophobic group as T1, their similar IC50 values indicate that the activities of the two triplex types were not highly affected by the helix length.
Single-stranded ODNs (S1–S5) in the two most active triplex inhibitors (T1 and T3) were tested for their anticell fusion activity separately. Single-stranded ODNs showed no or lower activity compared to T1 and T3 (Table 1), indicating that the formation of a rigid helix structure was conducive to the inhibition of cell fusion. However, the fact that S1, S2, and S4 showed some inhibitory activity is in contrast to the results of DNA duplex- and quadruplex-based inhibitors, whose single ODNs with hydrophobic groups do not show inhibitory activity [14,15]. This discrepancy might be attributable to the longer chains of S1, S2, and S4 (32, 32, and 24 bases, respectively). Accordingly, the shorter ODN chain S5 (12 bases) showed no activity. Both N-PAGE and CD analyses were carried out for these longer single-stranded DNAs to detect if any possible self-folding was in existence. DNA from the samples with and without the annealing process showed the same band position in the gel (Supplementary Fig. S12). The CD spectra for one sample were nearly identical at 20°C, 40°C, 60°C, and 80°C (Supplementary Fig. S13). These results indicate that the annealing process had little influence on the higher structure, if such a structure existed. The activity of single-stranded DNAs might be due to some minor ordered or mismatched structures, which were not detectable in our tests.
A standard experiment based on vital cell dye was conducted to test the toxicity of T1 and T3. After incubation with various concentrations of inhibitor at 37°C in 5% CO2 for 24 h, TZM-bl and HL2/3 cells were examined for toxicity. No obvious cytotoxicity was observed, even at the highest dose of inhibitor (66 μM), confirming that the inhibitor acted by inhibiting HIV-1 fusion, not by cytotoxicity.
Inhibitory activity of triplexes on viral cell entry mediated by HIV-1 pseudovirus
We investigated the abilities of the two most active inhibitory triplexes, T1 and T3, to inhibit HIV-1 NL4-3 Env-pseudotyped virus-mediated viral cell entry. The IC50 values of T1 and T3 were 120±10 and 970±110 nM, respectively (Fig. 4). No obvious cytotoxicity was observed when cell growth was checked by microscopy. This result further confirms that these triplex inhibitors had inhibitory activities toward the cell fusion of HIV-1. Compared to T3, T1 had a higher thermostability (Table 1) and binding affinity than T3 (see Interaction of Triplex Inhibitors with the Pocket Domain of the NHR Deep Pocket section), which may correlate with its higher anti-HIV-1-cell fusion activity.
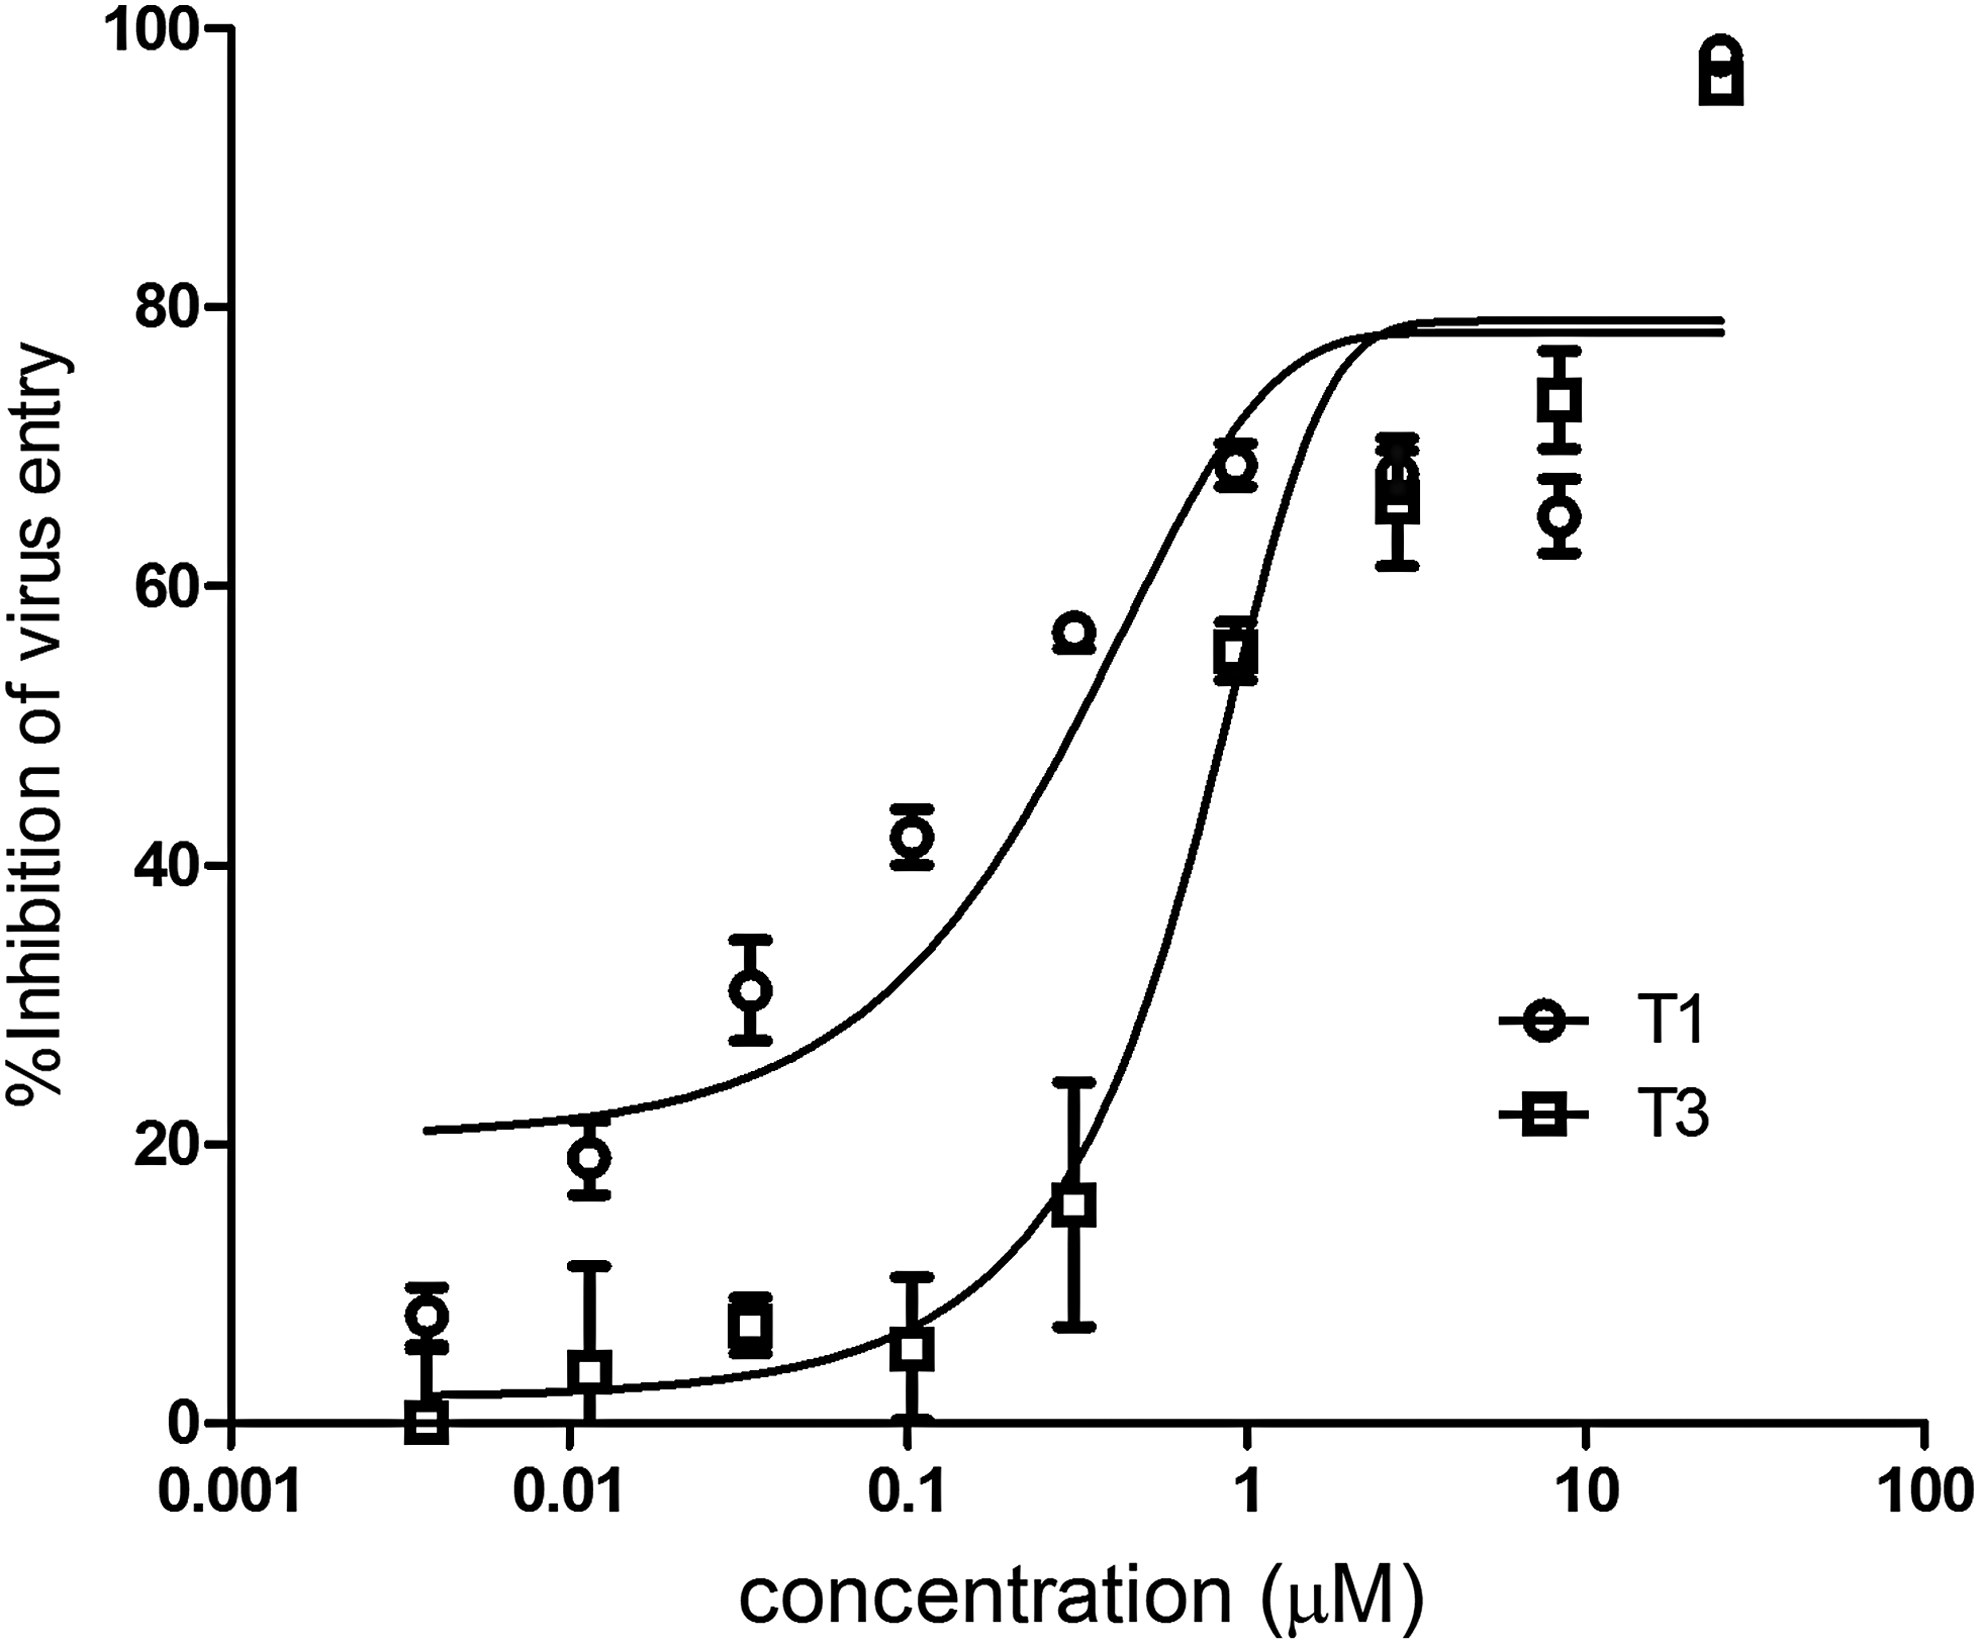
Inhibitory activity of T1 and T3 against cell fusion of the human immunodeficiency virus type 1 (HIV-1) pseudovirus. Data were derived from the results of three repeated experiments and are expressed as means±standard deviations.
Effect of triplex inhibitors on the formation of 6HB between N36 and C34
In the N-PAGE results (Fig. 5), N36 alone (lane 1) exhibited no band. This peptide carries net positive charge and may migrate off the gel [26]. In contrast, C34 alone (lane 2) displayed a band at a lower position on the gel. The band for the mixture of N36 and C34 (lane 3) was located in the upper portion of the gel and corresponded to that of 6HB [18]. Lanes 4 and 5 showed the results for T1 and T3, respectively, at equimolar concentrations to N36 and C34. Although a band of 6HB was still obtained with these triplexes, there was also unbound C34 at a lower position. When the concentration of T3 was increased to 5 times (lane 6) or10 times (lane 7) that of C34, the color intensity of the 6HB band became lighter, and the difference in color intensity between the 6HB and C34 bands was more prominent than at the equimolar concentration (lane 5). T1 showed similar results to T3 (lanes 8–10).
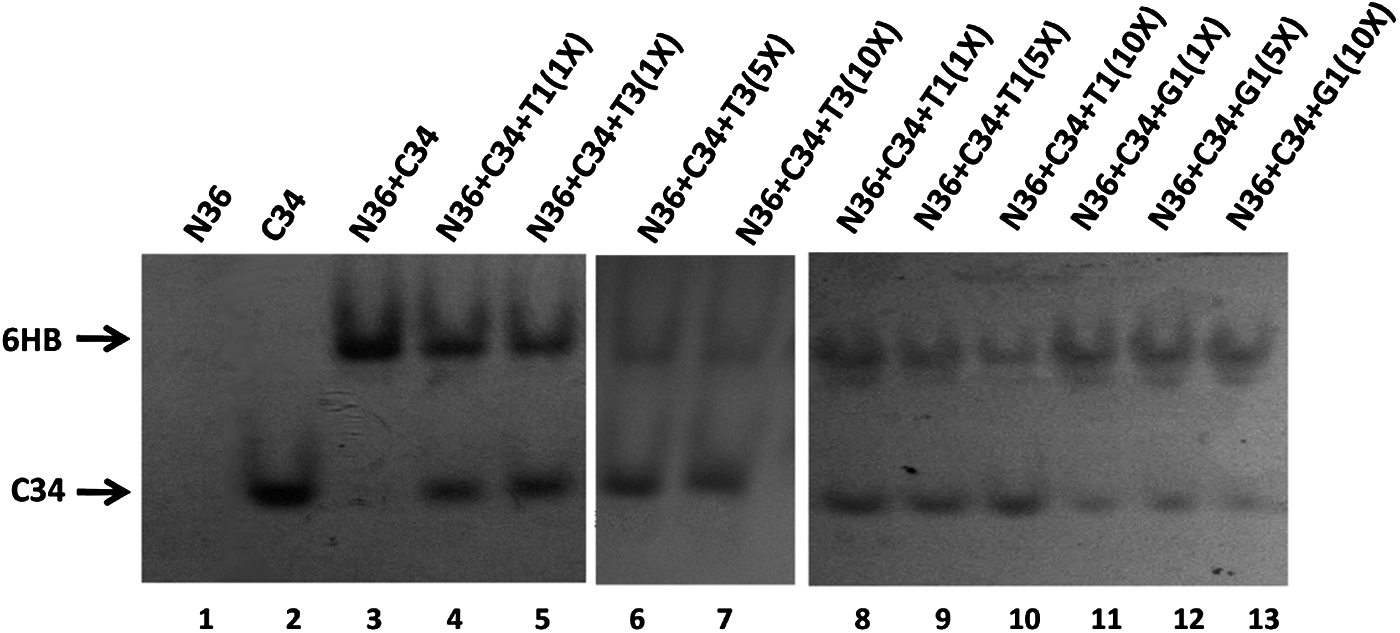
Inhibition of the formation of HIV-1 glycoprotein 41 (gp41) 6-helical bundle (6HB) by triplex inhibitors [native polyacrylamide gel electrophoresis (N-PAGE)]. For lanes 1–5, N36, C34, T1, or T3 was incubated with an equimolar concentration of 20 μM. For lane 6 and 7, T3 was incubated with concentrations of 100 and 200 μM, respectively. For lanes 8–10, T1 was incubated with concentrations of 20, 100, and 200 μM, respectively. For lanes 11–13, G1 was incubated with concentrations of 20, 100, and 200 μM, respectively.
Taken together, these results indicate that T1 and T3 interfere with the formation of 6HB between N36 and C34 in a concentration-dependent manner. This result may be interpreted to indicate that the anticell fusion and antipseudovirus activities of T1 and T3, as the formation of a stable 6HB region, play critical roles in the fusion course of HIV-1 with cellular membranes.
Interaction of triplex inhibitors with the pocket domain of the NHR deep pocket
A FRET-based inhibitory assay was performed to explore the interaction between the triplex molecules and the primary pocket contained in the HIV-1 gp41 NHR. As shown in Fig. 6, T1 and T3 interacted with the deep pocket of the gp41 NHR with IC50 values of 0.42±0.77 and 1.74±0.47 μM, respectively. These IC50 values were comparable to that of CP2 (0.86±0.11 μM), an unlabeled control peptide that interacts with the pocket domain of the gp41 NHR [27]. This result further verifies the anti-HIV-1 mechanism of the triplexes. Specifically, the triplexes may prevent HIV-1 gp41 6HB formation by interacting with the pocket domain on the gp41 envelope protein, thereby inhibiting HIV-1-cell membrane fusion.
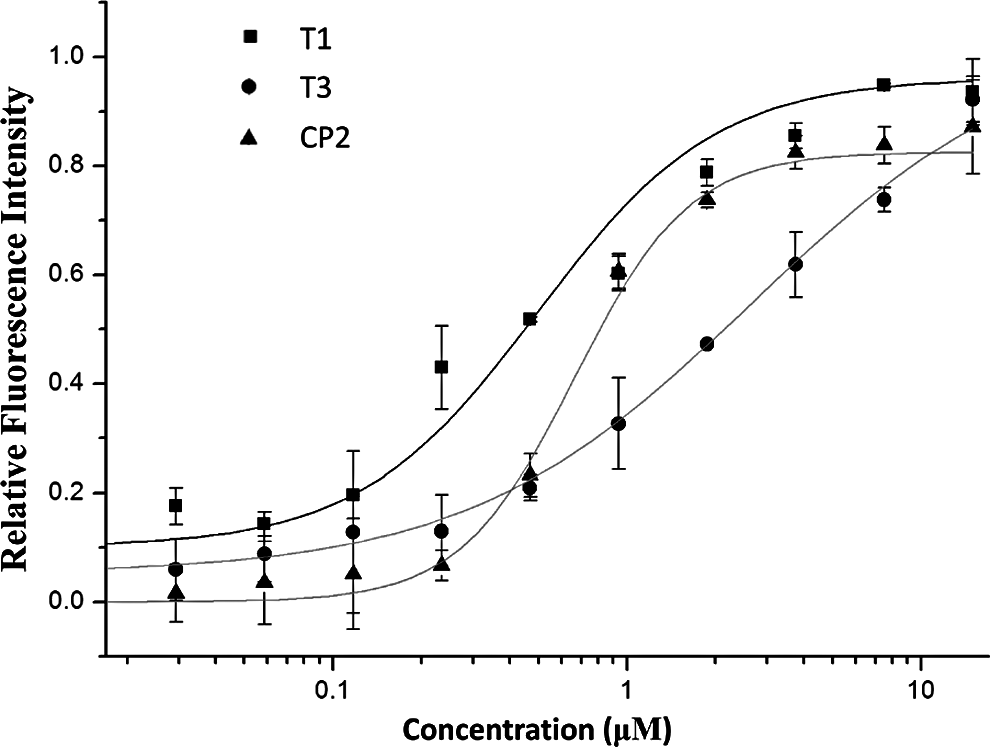
Competitive inhibition curves for the binding of T1, T3, and CP2 with the deep pocket of the gp41 N-terminal heptad repeat. Data were derived from the results of three repeated experiments and are expressed as the means±standard deviations.
Discussion
In this report, DNA triplexes modified with hydrophobic groups were designed, and their bioactivities as HIV-1-cell fusion inhibitors were evaluated. Triplex-based inhibitors demonstrated differences compared to previously reported duplex- and quadruplex-based complexes, although all of which possessed ordered DNA helices and hydrophobic modifications.
In general, the DNA triplex structure is less stable compared with quadruplex and duplex structures of the same chain length. Therefore, to fulfill the thermal stability requirement, the DNA triplex inhibitors were designed with much longer helix lengths (30 bp for T1 and T2, and 24 bp for T3 to T5) than those of the quadruplex- or duplex-based inhibitors (mostly 4–6 or 7–9 bp, respectively). Further extension of the helix length of the duplex-based inhibitor would decrease its anti-HIV-1 activity; thus, designing a duplex inhibitor with a long helix is not advisable [14]. For comparison, the duplex molecule D1 (Table 1) with 30 bp showed a lower activity (IC50=11.5±2.0 μM) than previously reported duplexes. However, triplex T1, which displayed the same pyrimidine-purine oligonucleotide chains (O1 and O2) as D1 but with an additional chain (O3) to form the triplex structure, showed a higher activity (IC50=1.8±0.7 μM), possibly due to its increased charge density compared to D1. The higher activity of the triplex-based inhibitors compared to the corresponding duplex-based inhibitors suggests that the triplex structure might be preferred when designing a long helical inhibitor.
Triplexes T1 to T5 were designed with different numbers of hydrophobic groups at both ends of the helix. Previous studies of duplex-based inhibitors have indicated that the two hydrophobic groups in the target site-interacting positive portion of the structure are sufficient to generate the inhibitory activity at low micromolar concentrations [14,15]. However, the case was different for the triplex-based inhibitors, as decreasing the number of end hydrophobic groups from three (T3) to two (T4) greatly decreased the inhibitory activity. This result might be ascribed to the higher negative charge density of the triplex compared to the duplex or to the higher ratio of hydrophobic groups to charge density of T3 compared to T4 (3:3 for T3 vs. 2:3 for T4, number of hydrophobic groups: number of ODN chains). Furthermore, introducing more than one hydrophobic region to one ODN always results in improved inhibitory activity for the duplex- and quadruplex-based inhibitors. Therefore, it is possible that maintaining the ratio of the number of hydrophobic groups to the negative charge density in the positive portion of the structure is important for all three categories of helix-based HIV-1 inhibitors.
Earlier research reported that quadruplex-based inhibitors target the V3 loop and the CD4-binding site on HIV-1 gp120 [3,13]. However, this work and our previous article have demonstrated that triplex- and duplex-based inhibitors interact with the primary pocket of the gp41 NHR to inhibit the formation of HIV-1 gp41 6HB. Owing to laboratory restrictions, we did not evaluate the interaction of triplex-based inhibitors with gp120, but rather compared the inhibition of gp41 6HB formation between the quadruplex and triplex inhibitors. As shown in Fig. 5, a classical quadruplex-based inhibitor with sequence 5′-d(DMT-TGGGAG)-3′ (G1, lanes 11–13) had a weaker effect on inhibiting the 6HB formation than triplex T1 or T3. Moreover, the inhibitory effect of G1 did not increase with increasing concentration. Although the details remain to be elucidated, these results indicate that the main targets of duplex-, triplex-, and quadruplex-based inhibitors might be different. This possibility could be attributable to their significant differences in helix length and net charge.
To date, DNA duplex- [14,15], triplex-, and quadruplex-based [3–13] HIV-1 fusion inhibitors have been described. The combination of hydrophobic groups and helical DNA in these inhibitors can be varied as long as a proper balance is maintained between the negative charge and the number of hydrophobic moieties within the structure. DNA helix-based inhibitors may be crucial in the field of anti-HIV-1 drug discovery, as they display disparate structures from those of existing anti-HIV drugs. Further research should elucidate the differences in functional mechanisms among duplex-, triplex-, and quadruplex-based inhibitors. Strategies to increase the thermal stability or to facilitate structural assembly, especially for triplex- and quadruplex-based inhibitors, are also needed.
In summary, we have designed novel hydrophobic group-modified DNA triplexes and evaluated their bioactivities as HIV-1-cell fusion inhibitors. The helix structure and presence of sufficient numbers of hydrophobic regions were essential to ensuring the antifusion activity. N-PAGE and FRET-based assay results demonstrated that these inhibitors interact with the primary pocket of the gp41 NHR, thereby inhibiting the formation of HIV-1 gp41 6HB.
Footnotes
Acknowledgments
This work was supported, in part, by grants from the Beijing Natural Science Foundation (7132154), the National Natural Science Foundation of China (21102177, 81273434, 81271830), and the National Science and Technology Major Project of China (2012ZX09301003).
Author Disclosure Statement
No competing financial interests exist.
References
Supplementary Material
Please find the following supplemental material available below.
For Open Access articles published under a Creative Commons License, all supplemental material carries the same license as the article it is associated with.
For non-Open Access articles published, all supplemental material carries a non-exclusive license, and permission requests for re-use of supplemental material or any part of supplemental material shall be sent directly to the copyright owner as specified in the copyright notice associated with the article.