
Abstract
Development of locked nucleic acid (LNA) gapmers, antisense oligonucleotides used for efficient inhibition of target RNA expression, is limited by nontarget-mediated hepatotoxicity. Increased binding of hepatocellular proteins to toxic LNA gapmers may be one of the mechanisms contributing to LNA gapmer-induced hepatotoxicity in vivo. In the present study, we investigated the protein binding propensity of nontoxic sequence-1 (NTS-1), toxic sequence-2 (TS-2), and severely highly toxic sequence-3 (HTS-3) LNA gapmers using human protein microarrays. We previously demonstrated by the transcription profiling analysis of liver RNA isolated from mice that TS-2 and HTS-3 gapmers modulate different transcriptional pathways in mice leading to hepatotoxicity. Our protein array profiling demonstrated that a greater number of proteins, including ones associated with hepatotoxicity, hepatic system disorder, and cell functions, were bound by TS-2 and HTS-3 compared with NTS-1. However, the profiles of proteins bound by TS-2 and HTS-3 were similar and did not distinguish proteins contributing to severe in vivo toxicity. These results, together with the previous transcription profiling analysis, indicate that the combination of sequence-dependent transcription modulation and increased protein binding of toxic LNA gapmers contributes to hepatotoxicity.
Introduction
T
Although these chemical modifications advanced pharmacological properties, they imposed a significant risk of side effects. Prolongation of the activated partial thromboplastin time and complement activation were observed in cynomolgus monkeys and/or humans following administration of the PS oligodeoxynucleotide ISIS 2302, and these effects are considered to associate with increased protein binding [6,7]. In fact, modification with a PS backbone unexpectedly resulted in increased affinity for cell surface, intracellular, and plasma proteins, preventing ASOs from rapid renal clearance and contributing to systemic exposure [1,8,9]. The interaction of PS oligodeoxynucleotides with proteins appeared to be decreased in oligonucleotides with modifications at the 2′ position [1,6], and this might contribute to improve the tolerability of ASOs. In contrast, LNA-modified ASOs (LNA gapmers) show profound hepatotoxicity in some instances. Swayze et al. demonstrated that multiple, but not all, LNA gapmer sequences targeting TNFRSF1A-associated via death domain (TRADD), apolipoprotein B, and phosphatase and tensin homolog increased plasma bilirubin and transaminase (AST and ALT) levels and histopathological changes in mice, including hepatocyte necrosis/apoptosis and increased mitoses [10]. These hepatotoxic effects were not observed in mice dosed with corresponding 2′-MOE-modified ASOs [10]. Since the control LNA gapmer, which did not modulate TRADD mRNA reduction, also induced hepatotoxicity in mice, this toxicity was considered to be independent of target [10]. Recently, Burdick et al. demonstrated that TGC and/or TCC nucleotide motifs contribute to LNA gapmer-induced hepatotoxicity in mice. The sequences containing the TCC and/or TGC motifs in LNA gapmers had a higher propensity for binding mouse hepatocellular proteins [11].
In the present study, we investigated proteins binding to LNA gapmers and oligodeoxynucleotides using human protein microarrays (ProtoArray™; Life Technologies). These high-density microarrays contain 9480 unique and full-length human proteins, including kinases, phosphatases, GPCRs, nuclear receptors, and proteases, spotted in duplicate on a 1 × 3-inch nitrocellulose-coated glass slide. To the best of our knowledge, this is the first attempt to utilize the protein microarrays to investigate the interaction of LNA gapmers with human proteins, and so, we performed preliminary experiments to optimize the experimental conditions. We selected three different sequences of LNA gapmers, nontoxic sequence-1 (NTS-1), toxic sequence-2 (TS-2), and highly toxic sequence-3 (HTS-3), labeled them with biotin at 3′end, and investigated their protein binding properties. TS-2 and HTS-3 contain TCC/TGC motifs, while NTS-1 does not have the toxic motif sequence. NTS-1-dosed mice did not show evidence of hepatotoxicity in the 2-week repeated high-dose study, whereas hepatic histopathological changes, such as increased cell death and mitoses, with elevated levels of serum ALT, AST, ALP, and GLDH, were observed in the mice after 2-week administration of TS-2 [12]. HTS-3 was considered to be more severely toxic than TS-2 because it was lethal in mice after a single dose [12]. In addition, we also investigated the proteins binding to phosphodiester (PE) or PS backbone corresponding NTS-1, TS-2, and HTS-3 sequences of oligonucleotides and compared results with those for the LNA gapmers.
Materials and Methods
Biotin-labeled LNA gapmers and oligodeoxynucleotides and their sequences
The chosen sequences chemically modified to have a PS backbone, and the 3LNAs-8DNAs-3LNAs gapmer designs are shown hereafter. Uppercase and lowercase indicate LNA and DNA residues, respectively.
NTS-1: 5′-TAAtcgtcgatACC-3′
TS-2: 5′-TAAtgctcgatCCC-3′
HTS-3: 5′-TCAgtgcatccTTG-3′
These LNA gapmers were labeled with biotin using a 15 atom tetraethylene glycol (TEG) spacer arm at 3′-end and were obtained from BioSpring. Corresponding oligodeoxynucleotides of NTS-1, TS-2, and HTS-3 sequences with either a PE (PE-NTS-1, PE-TS-2, PE-HTS-3) or PS (PS-NTS-1, PS-TS-2, PS-HTS-3) backbone were also modified with biotin-TEG at 3′-end and were purchased from integrated DNA technologies.
All the oligonucleotides were dissolved in nuclease-free distilled water (Life Technologies) for the protein microarray experiments.
Protein microarray experiments
The present study utilized ProtoArray control protein microarray v5.0 (Life Technologies) to determine the blocking conditions and ProtoArray human protein microarray (Life Technologies) to determine the probing conditions and investigate the protein–oligonucleotide interaction. Control protein microarrays contain only the positive (eg, Alexa anti-mouse antibody) and negative control [eg, bovine serum albumin (BSA)] proteins printed in the same format as the full-content protein microarrays (Life Technologies). Full-content protein microarrays contained 9480 human glutathione s-transferase (GST)-tagged proteins associated with protein kinases, transcription factors, membrane proteins, nuclear proteins, signal transduction, secreted proteins, cell communication, metabolism, and cell death, expressed in Sf9 insect cells and spotted in duplicate (Life Technologies). Control protein microarrays and full-content human protein microarrays were used according to the manufacturer's instruction for the profiling of small molecule–protein interactions with minor modifications.
In brief, these arrays were equilibrated at 4°C for 15–30 min before experiments. They were incubated with the small-molecule interaction (SMI) assay buffer [50 mM Tris HCl (pH7.5), 5 mM MgSO4, 0.1% Tween 20, and 1× Synthetic Block (Life Technologies)], with or without 10 μg/mL calf thymus DNA (Life Technologies), prepared using nuclease-free (deionized) water (Qiagen), for 1 h at 4°C with gentle agitation at 50 rpm. Next, 125 μL of SMI assay buffer, with or without calf thymus DNA, containing the biotin-labeled LNA gapmers (NTS-1, TS-2, and HTS-3) or corresponding oligodeoxynucleotides of NTS-1, TS-2, and HTS-3 sequences with a PE or PS backbone, was overlaid on the arrays, covered with LifterSlip (Thermo Scientific), and incubated for 90 min at 4°C. Arrays were washed five times for 5 min with SMI assay buffer without calf thymus DNA. Proteins bound by oligonucleotides were detected after incubation with Streptavidin-Alexa Fluor 647 Conjugate (Life Technologies) for 60 min at 4°C with gentle agitation. Arrays were washed five times for 5 min with SMI assay buffer without calf thymus DNA, dipped into the nuclease-free (deionized) water for a few seconds, and dried by centrifugation at 1,500 rpm for 2 min at room temperature. Arrays were shipped to Life Technologies for the scanning service. After the microarrays were scanned with an Axon 4000B fluorescent scanner (Molecular Devices), Genepix Pro 6.0 (Molecular Devices) image analysis software was used to determine pixel intensities for each spot on the microarray. Data were then analyzed using ProtoArray® Prospector ver. 5.2 (Life Technologies) software. This program calculates several values to evaluate signal significance. One of these values is the Z-Score, which provides a measure of the signal strength of a specific protein feature relative to the other human protein features. Other calculated values include the Z-factor, which measures the signals of individual protein features relative to the negative controls on the array (signal-to-noise ratio), and coefficient of variation (CV) for the signal intensities from the duplicate spots of each protein printed on the array www.lifetechnologies.com/us/en/home/life-science/protein-biology/protein-assays-analysis/protein-microarrays.html).
Results
Optimization of experimental conditions
We performed preliminary experiments to determine the optimal blocking reagent and probing concentrations to identify interactions between proteins and LNA gapmers. Biotin-labeled NTS-1 (LNA gapmer), representing a negative control compound (compound 1a in Table 1 in the previous manuscript [11]), was used in our preliminary experiments. We referred to the previous literature reported by Stansfield et al., where protein microarray experiments were performed to identify protein interactions with metal-modified oligodeoxynucleotides (50 mers), and the manufacturer's instruction for the small-molecule compounds [13].
The number of spots for each BSA, buffer, and GSTs (GST1-4) is 384, 192, and 96, respectively, and a weighted average calculation was used to calculate the average intensity of negative control spots.
BSA, bovine serum albumin; GST, glutathione s-transferase; LNA, locked nucleic acid; NTS-1, nontoxic sequence-1; SMI, small-molecule interaction.
Control protein microarrays were utilized to optimize the blocking condition for the LNA gapmers. Stansfield et al. added calf thymus DNA (10 μg/mL) into the blocking solution. We investigated whether calf thymus DNA (10 μg/mL), in addition to SMI assay buffer, would reduce the background signal intensity. The probing concentration of 25 μM was selected according to the manufacturer's recommendations for small-molecule compounds (personal communication, Life Technologies). Calf thymus DNA increased the average fluorescence intensity of negative control spots (BSA, buffer, and GSTs) with and without the addition of NTS-1 at 25 μM (Table 1). Therefore, the SMI assay buffer without calf thymus DNA was selected for the blocking solution.
Next, we used full-content protein microarrays to determine the appropriate concentration of LNA gapmers. Since NTS-1 at 25 μM significantly increased the fluorescence intensities of negative control spots, the full-content protein microarrays were probed at 1 and 5 μM. Threshold criteria of a Z-factor >0.5, a Z-score >3, and a CV from the two replicates on the array <0.5 (50%) are generally used to define positive spots (hits) (personal communication, Life Technologies). However, due to the high background at 5 μM, the highest Z score at 5 μM was over 2.67 (data not shown). At 1 μM, 266 spots were identified as hit proteins (data not shown). Since NTS-1 represents a negative control LNA gapmer (compound 1a in Table 1 and Fig. 4 in the previous manuscript [11]), we expected to identify fewer positive spots (25–50 positive spots at maximum). Therefore, we performed an additional experiment and probed full-content protein microarrays with biotin-labeled NTS-1 at 10, 50, and 250 nM. Spots on the negative control array without any test articles generally showed fluorescence intensity <500 (personal communication, Life Technologies). However, in our experiment on a negative control array without the addition of biotin-labeled NTS-1, 1769 spots (∼19% of 9480 spots on the array) showed comparably high fluorescence intensity (>500) (footnote in Table 2). Therefore, in addition to the threshold criteria using a Z-factor (>0.5), a Z-score (>3), and a CV (<0.5), the following criteria were used to define a hit:
LNA gapmer-bound proteins were identified if a protein met all the threshold criteria given next:
(1) Z-factor >0.5.
(2) Z-score >3.
(3) CV from the two replicates on the array <0.5 (50%).
(4) Neg Sig Used <500. This criterion resulted in removing 1769 spots.
(5) Pos Sig Used >1,000.
(6) Ratio of Pos Sig Used to Neg Sig Used >10.
The percentage in the parenthesis was the rate of hits in 9480 proteins printed on the array at each probing concentration.
Average signal value from 9480 positive spots.
Average signal value from negative control spots, such as BSA and buffer.
CV, coefficient of variation.
(1) Fluorescence intensity from a negative control array without probing (Neg Sig Used) <500
(2) Fluorescence intensity from the array probed with biotin-labeled oligonucleotide (Pos Sig Used) >1,000
(3) Ratio of Pos Sig Used to Neg Sig Used >10
Considering the average fluorescence intensity of negative control spots on the arrays probed with biotin-labeled NTS-1 and the number of hits at 10 nM (38 hits), 50 nM (100 hits), and 250 nM (223 hits) (Table 2), concentrations of 10 and 50 nM were selected to investigate the interaction of biotin-labeled LNA gapmers with human proteins.
Number of proteins binding to toxic LNA gapmers was greater than for the nontoxic LNA gapmer
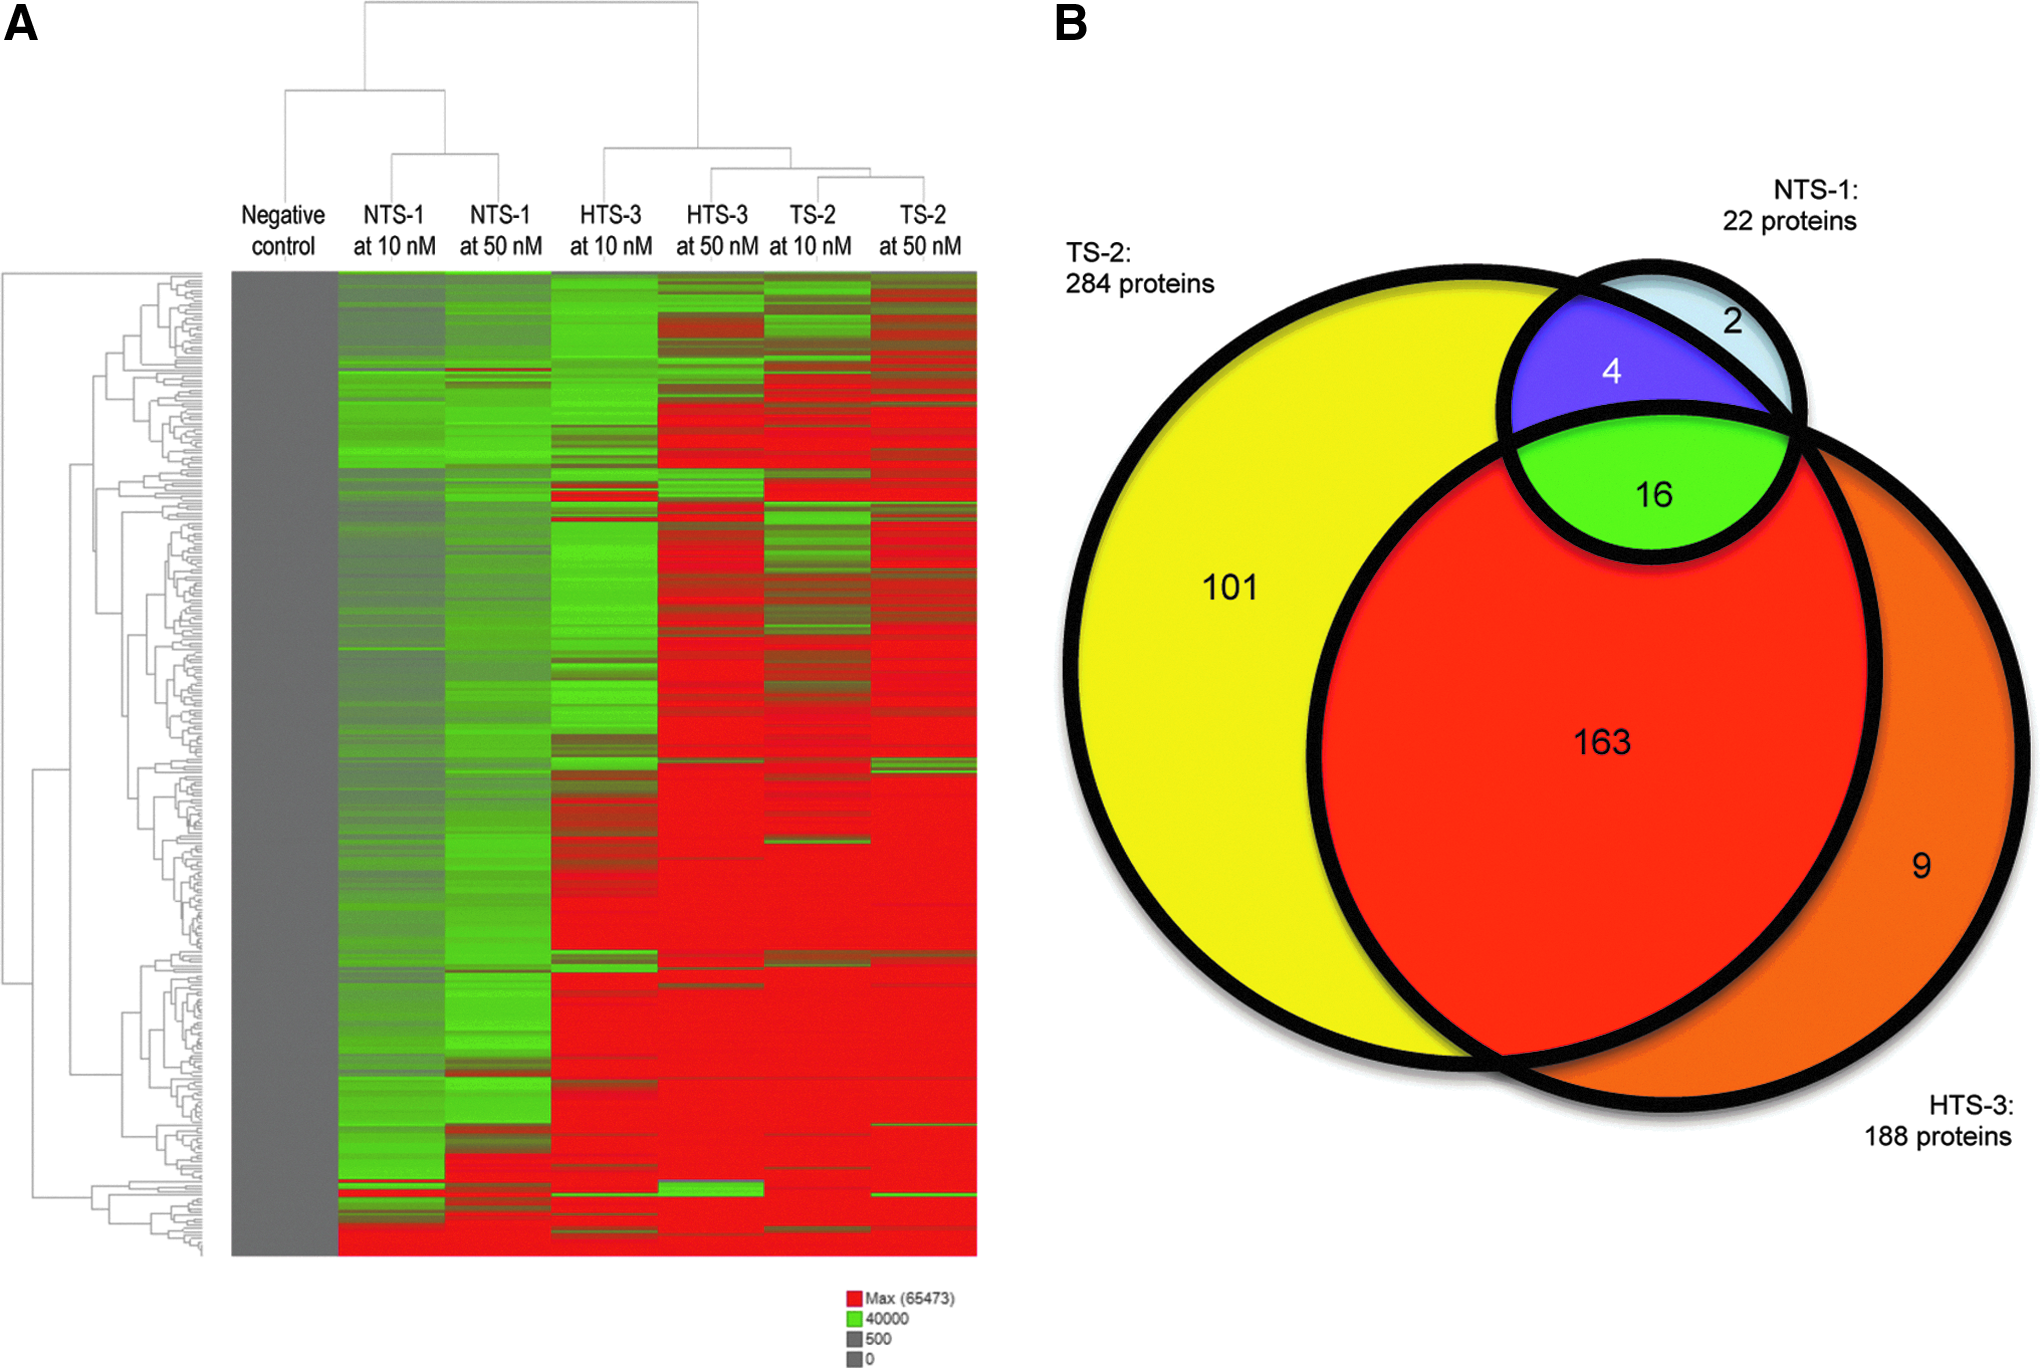
Using the experimental conditions determined in the preliminary studies, the interaction of biotin-labeled nontoxic (NTS-1), toxic (TS-2), and severely toxic (HTS-3) LNA gapmers (10 and 50 nM) with human proteins was investigated using full-content protein microarrays. In contrast to the preliminary study (Table 2), only 58 spots (∼0.6% of 9480 spots on the array) were removed based on this criteria of Neg Sig Used <500 (Table 3). This reduced background level caused an increase in number of hits for NTS-1 both at 10 nM (161 hits) and 50 nM (201 hits) (data not shown). Given that NTS-1 is thought to be the negative control LNA gapmer and considering the fluorescence intensity of protein spots on full-content protein microarrays probed with NTS-1 (Table 3), we decided to increase the cutoff value of Pos Sig Used to 40,000. The number of hits for each LNA gapmer at 10 and 50 nM using this cutoff value is summarized in Table 4. Common hits at 10 and 50 nM were identified to be specific proteins binding to each LNA gapmer. Proteins binding to NTS-1 (22 hits) were less than TS-2 (284 hits) and HTS-3 (188 hits) (Fig. 1A, Table 4, and Supplementary Table S1; Supplementary Data are available online at www.liebertpub.com/nat). An unsupervised clustering analysis using Spotfire software (http://spotfire.tibco.com/) on NCBI accession identifier and fluorescence intensity of hits discriminated among nontoxic NTS-1, toxic TS-2, and severely toxic HTS-3 (Fig. 1A). Only 16 proteins bound both nontoxic and toxic LNA gapmers, and unique 163 proteins bound only toxic LNA gapmers (TS-2 and HTS-3) but not nontoxic NTS-1 (Fig. 1B).
HTS-3, highly toxic sequence-3.
LNA gapmer-bound proteins were identified if a protein met all the threshold criteria given next:
(1) Z-factor: >0.5.
(2) Z-score: >3.
(3) CV from the two replicates on the array: <0.5 (50%).
(4) Neg Sig Used <500.
(5) Pos Sig Used: >40,000.
The percentage in the parenthesis was the rate of common hits for 10 and 50 nM in the number of hits at 10 nM of each LNA gapmer.
TS-2, toxic sequence-2.
The NCBI accession number and fluorescence intensity of proteins binding NTS-1, TS-2, and HTS-3 were analyzed using ingenuity pathway analysis (IPA, www.ingenuity.com/) to determine the subcellular location (cytoplasm, extracellular space, nucleus, and plasma membrane) and protein function (cytokine, enzyme, growth factor, ion channel, kinase, ligand-dependent nuclear receptor, peptidase, phosphatase, transcription regulator, translation regulator, and transporter) (Table 5 and Supplementary Table S1). IPA annotated 20 of 22 hits, 277 of 284 hits, and 185 of 188 hits for NTS-1, TS-2, and HTS-3, respectively. Many of the hits for NTS-1 (11 proteins, 55%), TS-2 (128 proteins, 46%), and HTS-3 (81 proteins, 44%) were located in the nucleus. The number and ratio of cytoplasmic proteins binding to TS-2 (71 proteins, 26%) and HTS-3 (49 proteins, 26%) were much greater compared with NTS-1 (1 protein, 5%). TS-2 and HTS-3 showed more variety than NTS-1 in terms of protein function. We also investigated the association of hits for the LNA gapmers with hepatotoxicity or cell functions using IPA (Table 6). A greater number of proteins associated with hepatotoxicity, hepatic system disorder, and selected cell functions (eg, protein synthesis, RNA post-transcriptional modification, post-translational modification) bound to TS-2 and HTS-3 compared with NTS-1. Among hits associated with hepatotoxicity, hepatic system disorder, and selected cell functions, many were common to both TS-2 and HTS-3 (Table 6).
The locations and functions, including “unknown” and “other,” are categorized by IPA.
IPA, ingenuity pathway analysis.
Protein names shown in italics were identified to bind to both nontoxic and toxic LNA gapmers, and protein names shown with underline were identified to bind to only toxic LNA gapmers, but not nontoxic LNA gapmers. Number in parenthesis indicates the number of proteins associated with the selected cell function.
A PS backbone contributes to increased protein binding to oligodeoxynucleotides
We also investigated protein binding differences for PE-NTS-1, PE-TS-2, PE-HTS-3, PS-NTS-1, PS-TS-2, and PS-HTS-3 labeled with biotin at 50 nM using full-content protein microarrays. Using the threshold criteria of a Neg Sig Used <500, a Pos Sig Used >40,000, a Z-factor >0.5, a Z-score >3, and a CV from the two replicates on the array <0.5 (50%), the SUB1 homolog (S. cerevisiae) (SUB1) was identified to be the only hit for PE- NTS-1, PE-TS-2, and PE-HTS-3 (Table 7). In contrast, there are 171, 319, and 209 hits for PS-NTS-1, PS-TS-2, and PS-HTS-3, respectively. IPA was used to annotate these hits. Similar to the toxic LNA gapmers TS-2 and HTS-3, hits for PS-NTS-1, PS-TS-2, PS-HTS-3 showed the variety of location and types (Supplementary Table S1). Interestingly, the number of hits with the PS-NTS-1 sequence was greater than with the nontoxic LNA gapmer, NTS-1 (Table 8). However, the number of hits for corresponding PS-TS-2 and PS-HTS-3 was similar to toxic LNA gapmers TS-2 and HTS-3 (Table 8). When hits for PS-NTS-1, PS-TS-2, and PS-HTS-3 were compared with ones for their corresponding LNA gapmers at 50 nM, there were 44, 214, and 127 common hits for the sequence of NTS-1, TS-2, and HTS-3, respectively. Twenty-six hits were identified for all sequences of LNA gapmers and PS oligodeoxynucleotides (Supplementary Table S2), suggesting that these proteins may preferentially associate with the oligonucleotide backbone.
Protein array experiment using PE oligonucleotides was performed on the different day of PS oligonucleotides.
LNA gapmer-bound proteins were identified if a protein met all the threshold criteria given next:
(1) Neg Sig Used <500.
(2) Pos Sig Used >40,000.
(3) Z-factor >0.5.
(4) Z-score >3.
(5) CV from the two replicates on the array <0.5 (50%).
Homo sapiens SUB1 homolog (S. cerevisiae) (SUB1), mRNA, Accession ID: BC010537.1.
Homo sapiens SUB1 homolog (S. cerevisiae) (SUB1), mRNA, Accession ID: BC010537.1 and NM_006713.2.
PE, phosphodiester; PS, phosphorothioate.
LNA, LNA gapmers; bPS DNA, PS oligodeoxynucleotide.
Discussion
Increased binding of cellular proteins to toxic LNA gapmers may be one of mechanisms contributing to LNA gapmer-induced hepatotoxicity in vivo [11]. In the present study, we developed a method for profiling human protein interactions with LNA gapmers using ProtoArray microarrays (Life Technologies) and investigated identified proteins binding to nontoxic (NTS-1), toxic (TS-2), and severely toxic (HTS-3) LNA gapmers. The probe concentrations selected in the present study may need further optimization, but the stringent threshold criteria used in the present study removed the bulk of nonspecific proteins binding to LNA gapmers. Our results demonstrated that TS-2 (284 hits) and HTS-3 (188 hits) exhibit more binding to human proteins compared with NTS-1 (22 hits). Many proteins binding for TS-2 and/or HTS-3 are associated with hepatotoxicity, hepatic system disorders, and cell functions and were present with both TS-2 and HTS-3. We also found that the PS backbone substitution in oligonucleotides contributes to an increase in protein binding, compared to unmodified oligonucleotides with a PE backbone. However, considering that only some proteins are common between LNA gapmers and PS oligonucleotides of each sequence, sequence rather than PS backbone, may be more responsible for the protein binding of toxic LNA gapmers.
Considering that many spots had a fluorescence intensity >500 (10 nM, Table 3) on protein microarrays probed with NTS-1, it is likely that the probe concentration needs to be further optimized. To mitigate this in the present study, we increased the cutoff value for Pos Sig Used to 40,000. In addition, positive proteins for each LNA gapmer were called only if they were positive at both 10 and 50 nM. These stringent criteria were used to minimize the number of nonspecific proteins binding to LNA gapmers.
To compare the protein interaction with nontoxic and toxic LNA gapmers, we used three different sequences. We previously reported that repeated administrations of NTS-1 at 25 mg/kg did not induce liver toxicity in mice, whereas TS-2 at 25 mg/kg resulted in hepatotoxicity after repeated administrations for 2 weeks [12]. In the TS-2-administered mice, hepatic changes were characterized by necrosis of hepatocytes and mixed cell infiltrates primarily around the central vein. Centrilobular hepatocyte hypertrophy, increased mitoses, and single-cell necrosis or apoptosis were also present in mice administered TS-2. The serum ALT (79 fold), AST (10 fold), ALP (1.9 fold), and GLDH (26 fold) levels were increased only in the TS-2 group. In contrast, no microscopic liver changes or effects on clinical chemistry parameters were observed in mice administered NTS-1. A single dose of HTS-3 at 25 mg/kg was lethal in mice at 48 h postadministration [12]. Severe centrilobular necrosis was noted where histopathology samples were obtained >24 h after a single administration, and therefore, liver toxicity was identified as the most likely cause of animal death (unpublished Pfizer results). TS-2 and HTS-3 contain TCC/TGC motifs, associated with hepatotoxicity [11], but NTS-1 does not have either of these motifs. It was demonstrated that sequences containing the TCC and/or TGC motifs in LNA gapmers had a higher propensity for binding mouse hepatocellular proteins [11].
The number of human proteins binding nontoxic NTS-1 (22 hits) was less than with toxic TS-2 (284 hits) and severely toxic HTS-3 (188 hits) sequences (Fig. 1 and Table 4). Only 16 proteins were common across all LNA gapmers, and 163 proteins were identified in common between TS-2 and HTS-3. Compared with the nontoxic LNA gapmer, both toxic LNA gapmers showed greater binding to cytoplasmic proteins (Table 5). These results suggest that the binding to cytoplasmic proteins may be the common feature of toxic sequences. However, the number of individual proteins bound by toxic LNA gapmers does not determine the severity of toxicity because HTS-3 showed fewer bound proteins compared with TS-2. IPA indicated that a greater number of proteins associated with selected cell functions (eg, hepatotoxicity, hepatic system disorder, protein synthesis, RNA post-transcriptional modification, post-translational modification) were bound to TS-2 and HTS-3 compared with NTS-1 (Table 6). Among hits associated with hepatotoxicity, hepatic system disorder, and selected cell functions, many of them were common across TS-2 and HTS-3 (Table 6). This observation of common proteins bound by TS-2 and HTS-3 indicate that another undetermined feature influences severity of the observed hepatotoxicity.
We also compared the protein interaction with corresponding PE and PS oligodeoxynucleotides of NTS-1, TS-2, and HTS-3 sequences at 50 nM. Similar to the previous literature showing oligonucleotides containing the PS backbone increased the interaction with plasma proteins [14,15], PS-NTS-1, PS-TS-2, and PS-HTS-3 bound a greater number of proteins compared with PE oligodeoxynucleotides. Interestingly, PS-NTS-1 appeared to bind a greater number of proteins compared with the corresponding LNA gapmer (NTS-1) (Table 8). This indicates that the introduction of LNA motifs into an oligonucleotide with a PS backbone at both ends reduced the number of bound proteins. However, this effect was not observed for TS-2 and HTS-3, suggesting that this may be a sequence-specific attribute.
Additional follow-up investigations such as a competition experiment using unlabeled oligonucleotides and binding experiments with selected proteins are needed to confirm the binding specificity. It would also be helpful to profile multiple sequences for each toxicity class to help separate sequence-based effects from those driving toxicity. Affinity capture experiments using total and fractionated liver tissue lysate collected from different species (mouse, rat, monkey, and human) will contribute to evaluation of the species difference of protein interaction with ASOs.
We previously demonstrated that a toxic LNA gapmer (TS-2) and a severely toxic LNA gapmer (HTS-3) modulate different transcriptional pathways in mice leading to hepatotoxicity using the transcription profiling analysis of liver RNA isolated from mice [12]. Disruption of Clathrin-mediated endocytosis pathway may be an initiating event for TS-2-induced hepatotoxicity in mice, whereas transcription changes associated with DNA damage may precede the impaired Clathrin-mediated endocytosis in mice dosed with HTS-3. Our protein microarray profiling analysis reported here, together with the previous transcription profiling analysis, indicate that both sequence-dependent transcription modulation and increased protein binding of toxic LNA gapmers may be important in in vivo hepatotoxicity observed with LNA gapmers. Further analysis is required to understand the relationship between transcription modulation caused by toxic LNA gapmers [12] and increased protein binding of toxic LNAs observed in the present study.
Footnotes
Acknowledgments
This study was supported by the funding from Pfizer Drug Safety Research and Development. The authors gratefully acknowledge Petra Koza-Taylor, Srinivasa Mantena, Robert Stanton, Denise Robinson-Gravatt, Jiri Aubrecht, Bill Mounts, Maryann Whitley, Andrew Burdick, and Brett Hollingshead (Pfizer, Inc.) for their advice on the data analysis and critique of the manuscript; Lisa Freeman-Cook, Thien Dinh, Edward Nolan, Heath Balcer, Carla Pots, Joshua Davis, Guene Lynne Thio, and Thomas Gainer (Life Technologies) for their technical and analytical support, and Tomomi Kiyota (University of Nebraska Medical Center) for his assistance with editing of figures.
Author Disclosure Statement
S.K.-K., L.W., A.R., N.M. are employees of Pfizer, Inc. and, as such, may also hold Pfizer stocks.
References
Supplementary Material
Please find the following supplemental material available below.
For Open Access articles published under a Creative Commons License, all supplemental material carries the same license as the article it is associated with.
For non-Open Access articles published, all supplemental material carries a non-exclusive license, and permission requests for re-use of supplemental material or any part of supplemental material shall be sent directly to the copyright owner as specified in the copyright notice associated with the article.