
Abstract
The effects of repeated complement activation in cynomolgus monkeys after chronic antisense oligonucleotide (ASO) treatment were evaluated by using ISIS 104838, a representative 2′-O-methoxyethyl (2′-MOE) modified ASO. The treatment was up to 9 months with a total weekly dose of 30 mg/kg, given either as daily [4.3 mg/kg/day, subcutaneous (s.c.) injection] or once weekly [30 mg/kg, either as s.c. injection or 30-min intravenous (i.v.) infusion]. Acute elevations of complement split products (Bb and C3a) and a transient decrease in C3 occurred after the first dose and were drug plasma concentration dependent. However, with repeated complement activation after chronic ASO treatment, there were progressive increases in basal (predose) levels of Bb and C3a, and a sustained C3 reduction in all treated groups. There was also a progressive increase in C3d-bound circulating immune complex (CIC) that was considered secondary to the C3 depletion. Evidence of vascular inflammation was observed, mostly in the liver, kidney, and heart, and correlated with severe C3 depletion and increases in plasma IgG and IgM. Vascular inflammation was accompanied by increased C3 and IgM immunereactivity in the affected vasculatures and endothelial activation markers in serum. In summary, repeated complement activations in monkeys lead to a sustained decrease in circulating C3 over time. The concomitantly increased inflammatory signals and decreased CIC clearance due to impairment of complement function may lead to vascular inflammation after chronic ASO treatment in monkeys. However, based on the known sensitivity of monkeys to ASO-induced complement activation, these findings have limited relevance to humans.
Introduction
D
One common alteration for 2′-MOE ASOs is an acute but transient activation of the alternative pathway (AP) of complement in monkeys at higher doses (usually >10 mg/kg) [2,3]. Activation of the complement cascade by 2′-MOE ASOs in monkeys presents a challenge in drug development with regard to the relevance of this finding to humans, as monkeys have been shown to be uniquely susceptible to this effect [4,5]. Clinical monitoring for complement activation in subjects in clinical trials involving dozens of independent 2′-MOE ASOs, as well as some first-generation full PS ASOs, has demonstrated a general absence of clinically significant activation of AP after short-term intravenous (i.v.) infusion or subcutaneous (s.c.) injection [4,6–10]. This includes some clinical trials that achieved plasma Cmax levels that are comparable to those at which AP activation was observed in monkeys. Thus, although complement activation is clearly present in monkey toxicology studies, it has not been observed in clinical trials after short-term i.v. infusion or s.c. injection.
The conditions that are necessary for AP activation by 2′-MOE ASOs in monkeys have been described, and the acute effects of activation are well understood [2,3]. Activation of this pathway by ASOs results from the reversible interaction of the ASO with complement factor H protein, the regulatory element of the AP [2]. This interaction interferes with the inhibitory function of factor H and allows the complement proteolytic cascade to proceed. The greater sensitivity of monkeys for AP activation has been studied, is attributed to biochemical differences in the regulatory potency of factor H protein between species, and is possibly related to differences in the gene sequence between human and monkey proteins [4]. It is also noted that cynomolgus and rhesus monkeys, the two most common laboratory animal species used in the nonclinical assessment of ASOs, appear to be uniquely susceptible to ASO-mediated AP activation among other laboratory animals as well.
Although the acute effects related to complement activation in monkeys have been well studied, the fact that complement activation occurs with each dose administration has received little attention and the implications of chronic, repeated complement activation in a monkey toxicology study have not been well studied. In 13-week monkey studies, the dose response, plasma concentration response, and the magnitudes of increases in the split productions (Bb or C3a) are essentially the same after the first and last dose (Ionis internal data). However, changes in the time course and the magnitude of complement activation have been noted with longer durations of treatment (ie, >6 months). A consequence of activation after each dose is a decrease in the circulating levels of intact complement plasma proteins, in addition to the increases in the basal levels of split products over time. Specifically, concentrations of intact C3 and C5 are decreased by proteolytic degradation each time the pathway is activated [2]. Levels of these proteins remain decreased until new protein is synthesized by the liver. Decreased circulating levels of complement factors have potential for detrimental effects to the overall function of the complement system and to its role in innate immune surveillance and clearance of immune complexes.
This article specifically examines the systemic effects of chronic, repeated complement activation on the kinetics of complement split products (C3a and Bb) and the circulating level of C3 in cynomolgus monkeys by a representative 2′-MOE-modified ASO. Complement assessment was performed at multiple times over a 9-month treatment period after a fixed dose of 30 mg/kg/week was administered by different dose routes and dose regimens. Plasma and tissue concentrations of the ASO were also compared among the different dose regimens. Changes in complement pathway activation and function over time have implications for routine clinical pathology and histopathology parameters that are important to understand in interpreting overall study results. A preliminary assessment of additional serum biomarkers was conducted to assess the impact of complement activation in monkeys.
Materials and Methods
Test material
ISIS 104838 is a 20-nucleotide PS ASO with the sequence
Animals
The monkey study was conducted at an Association for Assessment and Accreditation of Laboratory Animal Care (AAALAC) accredited facility that has an Animal Welfare Assurance issued by the Office of Laboratory Animal Welfare (OLAW), is registered with the United States Department of Agriculture (USDA), and has an Institutional Animal Care and Use Committee (IACUC) that is responsible for compliance with applicable laws and regulations regarding the use of laboratory animals. This study and related analyses were not conducted in compliance with the Food and Drug Administration (FDA) Good Laboratory Practice (GLP) regulations for Nonclinical Laboratory Studies; however, applicable standard operating procedures and sound scientific practices were followed. Fifteen male and 15 female Chinese origin cynomolgus monkeys (age 4–6 years old) were individually housed in cages in a temperature- and humidity-monitored environment, providing a 12-h light/dark cycle. Animals were fed twice daily with ad libitum access to water at any time. The study protocol was approved by IACUC at the Testing Facility before dose administration.
Study design
Animals were divided into four dose groups (n = 6–8 per group) and administered with PBS (Group 1) or a total weekly dose of 30 mg/kg ISIS 104838, given as either daily (Group 2) or a once-weekly s.c. injection (Group 3) or a 30-min i.v. infusion (Group 4) for up to 9 months (see detail design in Table 1). The 30 mg/kg weekly dose was selected to achieve target toxicities. Subcutaneous doses were rotated among six sites: one site on the exterior portion of each thigh and four separate sites on the back. One site on each dosing day and dosing site was recorded. The initial dose administration was designated as day 1, with subsequent days consecutively numbered. Monkeys were evaluated daily for clinical signs, body weights were measured, and qualitative food consumption was determined weekly. No adverse clinical observations were found in monkeys that finished the scheduled treatment. Mild decreases in body weight (∼4.5%–9%) were observed in the daily and weekly s.c. treatment groups, and lower body weight gain (∼2% increase) was observed in the weekly i.v. group compared with the control (∼16% increase). The food consumption was mostly normal with the exception of selected unscheduled early termination animals. Overall, the repeated treatment was better tolerated in the weekly treatment groups, whereas higher incidences of moribundity and/or mortality were observed in the daily s.c. group (Group 2) and animals were terminated on day 196. The animals from Groups 1, 3, and 4 were terminated as scheduled on day 276 after 9 months of treatment. Clinical pathology evaluations, for example, hematology, coagulation, serum chemistry, and urinalysis, were conducted at selected intervals throughout the study duration to monitor for general toxicity. Analyses specific to complement activation and immune response included periodic evaluation of plasma complement C3 and split products (Bb and C3a), C3d-bound circulating immune complex (CIC-C3d), factor H, total serum IgG, IgM, and cytokines/chemokines. At the termination of each group, surviving animals were weighed and anesthetized followed by exsanguination and necropsy. Selected tissues/organs were weighed, preserved, and processed to hematoxylin and eosin (H&E)-stained sections for histological examination. Selected plasma and tissue toxicokinetics analyses were also conducted.
Animals from Group 2 (daily s.c.) were terminated on day 196 due to toxicity and animals from Groups 1, 3, and 4 were terminated on day 276.
i.v., intravenous; s.c., subcutaneous.
Immunohistochemistry analysis of complement C3 and immunoglobulins
Liver, kidney, and heart from three monkeys in each group were selected based on the microscopic findings for immunohistochemistry (IHC) staining for complement C3, IgG, and IgM. In addition, the last injection site from the three selected control, daily s.c., and weekly s.c. animals was evaluated for complement C3. Briefly, slide-mounted tissue sections were deparaffinized and reacted with primary antibodies at an ambient temperature for 60 min. The following antibodies were used: goat anti-human C3c (Quidel, San Diego, CA), goat anti-monkey IgG-HRP (Bethyl Laboratories, Montgomery, TX), and goat anti human IgM-HRP (Bethyl Laboratories). For C3c immunostaining, tissues were incubated with secondary rabbit-anti-goat IgG-HRP (Jackson ImmunoResearch, West Grove, PA) antibody for 30 min after primary antibody addition. Primary or secondary antibody binding was visualized by using DAB substrate (Vector Laboratories, Burlingame, CA) followed by hematoxylin counterstaining. The dilution rate of each primary antibody was as follows: C3c (2.5 μg/mL; 1:8,000), IgG (1 μg/mL, 1: 1,000), and IgM (2 μg/mL, 1:500), respectively. Negative controls (normal liver) and positive controls (normal lymph node) were used for each of the reagents. The result of IHC staining was expressed by using a five-grade scale: negative, minimal (+), mild (++), moderate (+++), and severe (++++). Grading of IHC staining took into account the intensity of staining, the cellular location of staining, and the relative percentage of positive cells. This method was used for each component of the vasculature (endothelium, intima, connective tissue, mononuclear cells) to arrive at the final scoring.
Measurement of complement activation in plasma
Plasma samples for complement split product analyses were collected from all available animals on days 1, 120, 176, and 267 (except for the daily s.c. animals, they were collected on day 192) at predose, and at 1, 4, 8, and 24 h postdose. Levels of Bb and C3a were measured with MicroVue EIA kits from Quidel Corporation (San Diego, CA). Plasma samples for C3 concentrations were collected on days 1, 176, and 267 at predose and at 8, 24, 72, and 168 h postdose, except for the daily s.c. group, in which samples were collected on days 1, 176, and 192 at predose and at 8 and 24 h postdose. In addition, the plasma C3 samples were also collected on day 85, at 24 h postdose, for all four groups. The time course samples, up to 24 h postdose on days 1 and 267, from the control and weekly s.c. groups were also selected for plasma factor H analysis, and plasma samples collected at various time points were used for CIC-C3d analysis; these assays were conducted at Complement Laboratory, National Jewish Health (Denver, CO). Factor H and C3 protein levels were measured by radial immunodiffusion as previously described [11]. The polyclonal antibodies for factor H (A312) and C3 (A304) were purchased from Quidel Corporation. Pooled control cynomolgus monkey plasma, with an established normal range, was used for both assays. CIC-C3d was measured by a sandwich enzyme immunoassay (EIA; Quidel Corporation). The data for Bb, C3a, C3, and factor H were expressed as % of the day 1 predose level (baseline) of the individual animal before calculating for means and standard deviation (SD).
Measurement of serum immunoglobulin (IgG and IgM)
Quantitative immunoassays for measuring circulating monkey IgG and IgM were performed by using enzyme-linked immunosorbent assay (ELISA) kits from Alpha Diagnostic International (San Antonio, TX). The IgG and IgM ELISAs were based on specific binding of monkey IgG or IgM to antibodies immobilized on the microtiter well, and they were conjugated to horseradish peroxidase (HRP) enzyme for detection. The data for IgG and IgM were expressed as % of the day 1 baseline (prestudy) of the individual animal before calculating for means and SD.
Measurement of serum biomarkers
Serum biomarkers, including cytokines/chemokines [such as monocyte chemoattractant protein-1 (MCP-1) and macrophage inflammatory protein-1β (MIP-1β)] and endothelial cell activation markers [such as vascular cell adhesion molecule 1 (VCAM-1) and von Willebrand factor (vWF)], were measured by Myriad RBM (Austin, TX) by using the HumanMAP® Antigens (v 1.6) panel that has partial cross-reactivity with cynomolgus monkey.
Toxicokinetics of ISIS 104838 in plasma and tissue
Plasma samples for ISIS 104838 concentration analysis were collected on days 1 and 176, at 1, 4, 8, and 24 h, either after s.c. injection or from the start of the 30-min i.v. infusion. Liver and kidney cortex was collected at necropsy for ASO tissue concentrations. ISIS 104838 was measured in plasma by using an ELISA-based method, whereas concentrations in tissues were measured by using capillary gel electrophoresis.
Measurement of anti-drug antibody in monkey plasma
An ELISA method was developed by Ionis Pharmaceuticals, Inc. to detect antibodies that were directed against specific 2′-MOE ASOs in monkey serum or plasma. A cut point was generated by using prestudy baseline O.D. values (mean +1.64 SD) from all ISIS 104838-treated animals. If the sample O.D. is greater than cut point, then the sample is considered screen positive. The screen-positive samples were further evaluated in a confirmatory assay in similar procedures, using serum with and without free drug preincubation. If the sample O.D. inhibition is ≥50% or is reduced below the cut point with free drug preincubation, then the sample is confirmed positive for anti-drug antibody (ADA). If the inhibition is <50%, then the sample is reported as negative. Only samples from ISIS 104838-treated groups were tested for ADA. Data were expressed as the incidence of the confirmed positive ADA response.
Results
Tissue and plasma drug concentrations after up to 9 months of treatment
Drug concentrations in the liver and kidney cortex were measured to compare total systemic exposure among the groups. Consistent with the fact that each group received the same total weekly dose (30 mg/kg/week), similar kidney concentrations were found in all three treatment groups, although a slightly higher liver concentration was found in the weekly s.c. group as compared with the daily s.c. or weekly i.v. infusion groups (Table 2).
Expressed as mean ± SD.
SD, standard deviation.
As expected, plasma drug concentration on days 1 and 176 was dose- (4.3 mg/kg/dose vs. 30 mg/kg/dose) and route- (s.c. vs. i.v.) dependent, with the highest plasma Cmax found in the weekly i.v. infusion group (30 mg/kg/dose), followed by the weekly s.c. (30 mg/kg/dose) group, and then the daily s.c. (4.3 mg/kg/dose) group (Table 3). Importantly, there were slight increases in predose (trough) levels (collected before the next dose) in all ISIS 104838-treated groups after 6 months of treatment, with the highest level found in the daily s.c. group (predose levels on day 176 were 2.5, 0.3, and 0.14 μg/mL for daily s.c., weekly s.c., and weekly i.v. groups, respectively). This was attributed to the difference of the 1-day versus 7-day interval between doses. On the other hand, plasma drug clearance was found to be the most rapid with i.v. infusion after 6 months of treatment, with plasma concentrations of 2.8, 5.9, and 0.8 μg/mL at 24 h postdose for the daily s.c., weekly s.c. and weekly i.v. groups, respectively. As a result, plasma concentrations for the daily s.c. group ranged between ∼2.5 and 9 μg/mL (mean trough to Cmax concentration), demonstrating a more consistent and continuous weekly exposure to ISIS 104838 that was relative to either of the weekly dose groups.
Values are mean ± SD.
BLQ, below the lower limit of quantitation (LLOQ = 0.5 ng/mL or 0.0005 μg/mL).
Transient reduction of circulating factor H after single and repeat treatment
As mentioned earlier, 2′-MOE ASO-induced complement activation in monkeys is due to a transient interaction between the 2′-MOE ASO and factor H, which leads to dysregulation of the AP. The time course of factor H levels after single and repeated doses of ISIS 104838 was evaluated by using samples from control and weekly s.c. animals on days 1 and 267 (Fig. 1). A transient reduction of circulating factor H was found in ISIS 104838-treated animals on day 1, with a maximum mean reduction of 35% from baseline at 8 h postdose. Factor H levels gradually recovered to normal range by 48–72 h postdose. This profile for factor H paralleled the day 1 C3 profile, as described next, and the clearance of the 2′-MOE ASO from the circulation. Predose factor H levels were slightly elevated (112% of day 1 predose) on day 267 for the weekly s.c. animals; however, the magnitude of the postdose change for factor H was comparable to that seen on day 1. No change in factor H levels was found in the control group after either single or repeated treatment with PBS.

Time-course changes of plasma factor H levels on days 1 and 267 after single and repeated s.c. treatment of ISIS 104838 at 30 mg/kg/week. Plasma samples from the control and weekly s.c. groups were collected on days 1 and 267 at indicated time points; factor H levels were measured by using RID as described in the Materials and Methods sections. Expressed values are the mean ± SD of the individual animal percentage change in factor H level compared with day 1 predose. RID, radial immunodiffusion; s.c., subcutaneous; SD, standard deviation.
Comparing the complement activation profiles after single and repeated 2′-MOE ASO treatment
The differences in plasma concentration profiles related to route and frequency of the dose described earlier correlated with the complement activation profile. Complement activation after ISIS 104838 treatment was monitored by measuring the time course for complement split products (Bb and C3a) and circulating C3 levels in the plasma after the first dose and then at ∼3-month intervals. The kinetics of these markers of complement activation did change over time. On day 1, the production of Bb and C3a was also dose- and route dependent (Fig. 2A). The increase of each split product was the greatest in monkeys given ISIS 104838 by 30-min i.v. infusion, which was up to a 17.5- and 47-fold increase versus baseline (day 1 predose) for Bb and C3a at 1 h postdose, respectively, and correlated well with the highest plasma Cmax with this regimen. In the weekly s.c. group (30 mg/kg each dose), the increases for Bb and C3a were only about 5.5- and 3.9-fold, respectively. Notably, there was no treatment-related increase in complement split products over controls observed in the daily s.c. group (4.3 mg/kg/dose) on day 1. The changes in Bb and C3a in the once-weekly s.c.- and i.v.-treated animals were transient, with plasma levels mostly returning to predose levels by 24-h postdose. Coincident with the increase in the C3a split product, there were also transient decreases in plasma C3 levels after day 1 dosing. Up to 12% and 24% transient decreases in C3, as compared with predose levels, were observed in the once-weekly s.c. and i.v. infusion groups, respectively, with the nadir occurring between 8 and 24 h postdose, and recovery by 72 h postdose.
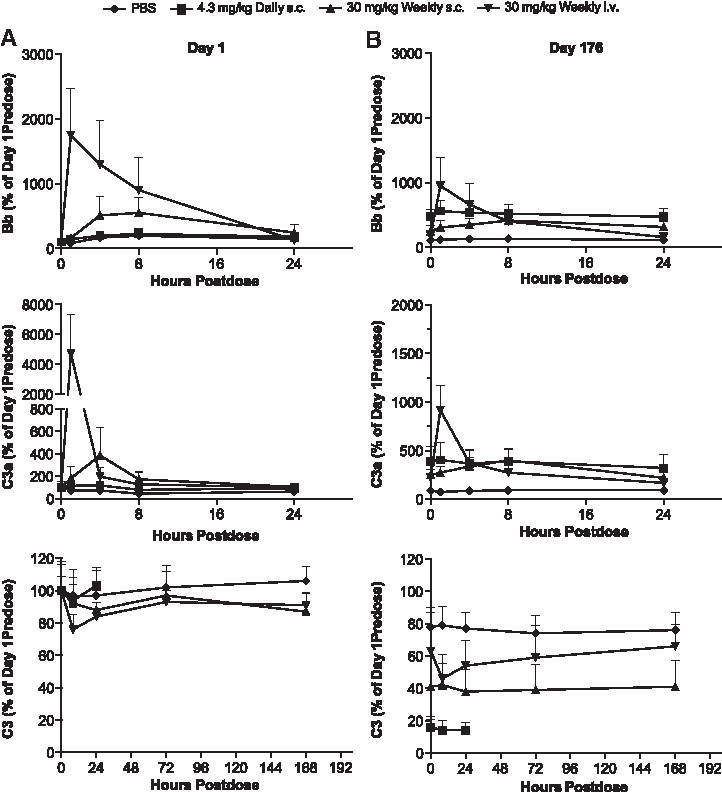
Time-course changes of complement split products (Bb and C3a) and circulating C3 on days 1 and 176 after a single or repeated treatment of ISIS 104838. Plasma samples from control (♦), daily s.c. (■), weekly s.c. (▲), and weekly i.v. infusion (▼) groups were collected on day 1
There were several differences in the kinetic profiles of the complement factors after 6 months of repeated treatment compared with day 1 (Fig. 2B). Although transient postdose changes were still observed, the magnitudes of increases in peak Bb and C3a levels and C3 reduction were less in the weekly s.c. and i.v. infusion groups. There was also a tendency for higher predose Bb and C3a levels relative to both concurrent controls and the day 1 predose levels (baseline) in all ISIS 104838-treated animals, but they were the most evident in the daily s.c. group. The predose C3a levels on day 176 were about 3.9-, 2.5-, and 2.2-fold of the baseline for the daily s.c., weekly s.c., and weekly i.v. infusion groups, respectively. Similar increases in predose Bb levels on day 176 were also observed, with a slightly higher magnitude in the daily s.c. animals (4.8-fold of baseline). The increases in complement split products for the daily s.c. animals were sustained over 24 h (∼3- to 6-fold of baseline), which translates into essentially continuous complement activation with the daily dose regimen.
Chronic treatment also caused a sustained decrease in plasma C3 level over time, presumably due to the repeated complement activation associated with 2′-MOE ASO (Fig. 3). By day 176, the mean predose C3 levels were reduced to ∼18%, 41%, and 61% of baseline for the daily s.c., weekly s.c., and weekly i.v. infusion groups, respectively. The decreases in C3 were mostly stabilized over the remaining course of the study for all groups except for a slight further reduction in the weekly i.v. group. The most severe and rapid C3 reduction seen in the daily s.c. group was correlated with the continuous complement activation occurring with daily dosing, as indicated by the Bb and C3a split products, compared with the more transient activation in each of the weekly dose regimens. The rate of C3 reduction was also faster in the weekly s.c. group as compared with the weekly i.v. group. The mean C3 level for the weekly s.c. group remained less than 50% of the baseline during the last 3 months of treatment, whereas the mean C3 level for the weekly i.v. group had just reached ∼50% of the baseline at 9-month termination.

Sustained decrease in C3 after repeated treatment of ISIS 104838 for up to 9 months. Plasma C3 levels were measured at the indicated time points. Samples were collected predose, except that day 85 samples were collected at 24 h postdose. Last sample collection for the daily s.c. group was on day 192, and for all other groups it was on day 267. Expressed values are the mean ± SD of the individual animal percentage change from the day 1 predose value for C3.
Plasma ASO concentrations that were determined up to 24 h postdose on day 176 were used to predict plasma drug profiles over the 7 days postdose for the once-weekly s.c. and i.v. infusion groups using WinNonlin, whereas the changes for the daily s.c. group over a 1 week period were predicted by repeating the profile determined from the first 24 h postdose (Fig. 4A). The differences in kinetic profiles for C3a on day 176 correlated with the plasma drug profiles in each group (Fig. 4B). The continuous daily exposure of ISIS 104838 at a relatively low plasma concentration (2–9 μg/mL at 4.3 mg/kg dose) was still able to trigger complement activation as indicated by the elevated C3a levels after 6 months of treatment. These data strongly suggest that 2′-MOE ASO-induced complement activation in monkeys depends not only on drug plasma Cmax but also on the duration/frequency of drug exposure.
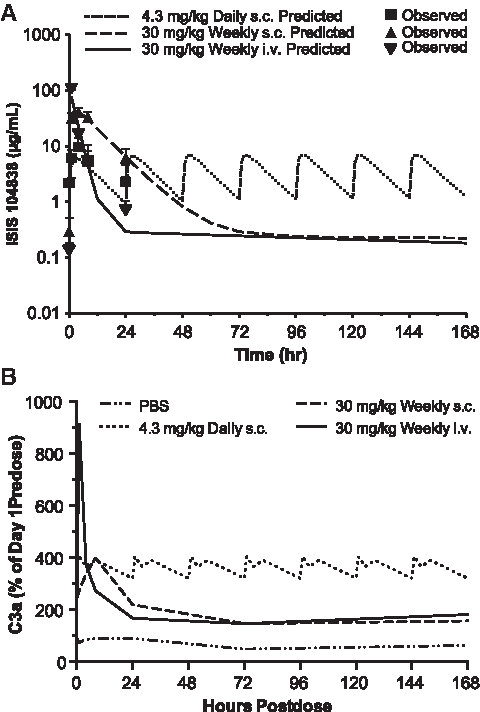
Modeling of the complete weekly plasma exposure of ISIS 104838 and its correlation with the C3a profiles after 6 months of repeated treatment.
C3 depletion was correlated with increases in CICs
Sustained reduction in C3 levels could impair overall complement function, which includes clearance of CICs. The levels of C3d-associated CICs were measured at study termination in each group (Fig. 5). The highest CIC-C3d level was found in the daily s.c. group, which had the greatest C3 reduction. Lower magnitudes of CIC-C3d elevations were found in the weekly s.c. and i.v. groups at 9 months, in which there was less C3 reduction compared with the daily s.c. group. The time-course changes of CIC-C3d in correlation with plasma C3 level over 9 months were also characterized in samples from the weekly s.c. group. There was a gradual increase in CIC-C3d that correlated with progressive depletion in C3 over the 9-month treatment period (Fig. 6).

Correlations of plasma CIC-C3d and C3 levels after up to 9 months of treatment of ISIS 104838. Plasma samples were collected 24 h postdose before the terminal necropsy (day 192 for daily s.c. group and day 267 for all other groups), and they were used to measure the circulating CIC-C3d and C3 by ELISA and RID methods, respectively. Expressed values are the mean ± SD of CIC-C3d (μg IgG Eq/mL) and C3 (% of day 1 predose). CIC, circulating immune complex; ELISA, enzyme-linked immunosorbent assay.
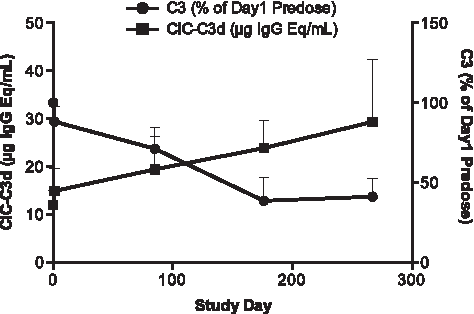
Time-course changes of plasma CIC-C3d versus C3 levels during 9 months of treatment for weekly s.c. animals. Detailed time-course profiles of CIC-C3d (■) and C3 (●) were illustrated by using samples from the weekly s.c. group collected at day 1 predose, and 24 h postdose of days 1, 85, 176, and 267. Expressed values are the mean ± SD of CIC-C3d (μg IgG Eq/mL) and C3 (% of day 1 predose).
Complement and immunoglobulin deposition were confirmed in monkeys with severe C3 depletion by IHC staining
Liver, kidney, and heart (all groups) and injection site (PBS, daily, and weekly s.c. groups only) sections from three animals per group were evaluated for complement C3 and IgM by IHC (Table 4). Staining for C3 in mononuclear cells and/or vascular/perivascular areas in liver, kidney, and heart was consistently increased in ISIS 104838-treated groups relative to controls (Fig. 7 A, B). Immunoreactivity for IgM was increased in the tunica intima and media of arteries, as well as in mononuclear cells scattered around the vascular/perivascular regions of heart, liver, and kidney, and it was more evident in the daily and weekly s.c. groups (Fig. 7C, D). The IgM staining in the renal glomerulus was also observed in all groups, including controls. There were similar findings for IgG in liver, kidney, and heart, but the staining was also seen in the control animals, particularly in liver (data not shown). Overall, based on the IHC results from these selected animals, the intensity of staining for IgM deposition was roughly correlated with the magnitude of circulating complement C3 depletion.

Representative liver C3 and IgM immunohistochemistry staining from control and weekly s.c. (30 mg/kg) monkeys. Liver sections from selected animals (three animals each group) were stained for the presence of C3
N/A, not available; injection site (skin) was not collected for the 30 mg/kg weekly i.v. group.
+, minimal; ++, mild; +++, moderate; PBS, phosphate-buffered saline.
Inflammatory lesions were found in monkeys with significant immune complex deposition
Histopathological examination of H&E-stained sections revealed increased infiltration by mononuclear and mixed inflammatory cell populations into vascular/perivascular areas that are accompanied by thickening of tunica intima/media in the heart, kidney, and liver in ISIS 104838-treated animals (Table 5). The changes tended to be more severe in the daily s.c. group (ranging from mild to moderate) and generally involved multiple organs (Fig. 8). Animals with vascular/perivascular inflammation had C3 levels reduced to 24%–60% of baseline at scheduled termination and correlated with the IHC staining for IgM deposition on the vasculature walls. Glomerulopathy, which was characterized as hypercellular glomeruli and thickened mesangium and/or glomerular basement membranes, was found in all ISIS 104838-treated groups, with the weekly s.c. group having the greatest incidence and severity (6/8 animals with minimal to mild changes). Overall, there were lower incidences of vascular and glomerular findings observed in the weekly i.v. infusion group compared with the daily and weekly s.c. groups.

Representative liver H&E staining from control and daily s.c. (4.3 mg/kg) monkeys. Liver H&E staining showed extensive mixed cellular infiltrates into the portal triad circumscribing bile ducts and blood vessels from one representative daily s.c. (4.3 mg/kg) monkey
+, minimal; ++, mild; +++, moderate.
Increase in ADA response in monkey plasma after repeated treatment
Immunogenicity response of ISIS 104838 in monkeys was evaluated by using an ELISA assay (Table 6). None of the animals were confirmed ADA positive at prestudy. An increased incidence was observed across groups after 3–9 months of treatment, where 3/4, 4/7, and 2/6 animals had a confirmed ADA-positive response at the time of termination from available animals in the daily s.c., weekly s.c., and weekly i.v. infusion groups, respectively. A delayed onset of ADA positivity was noted in the weekly i.v. group.
Animals from Group 2 (4.3 mg/kg daily/s.c.) were terminated on day 196 (∼7 months of treatment) due to toxicity and animals from Groups 1, 3, and 4 were terminated on day 276 (9 months of treatment).
ADA, anti-drug antibody.
Increases in inflammatory markers observed after chronic treatment
Evaluation of serum samples with the HumanMAP panel demonstrated mild but time-dependent increases in inflammatory markers, such as MCP-1 and MIP-1β. Those increases were the most evident for the daily s.c. group (∼3-fold over baseline), followed by the once-weekly s.c. (∼1.6-fold) and weekly i.v. infusion groups (1.1- to 1.4-fold) (Fig. 9). Similar mild increases were also observed for interleukin (IL)-18, TNF-RII, and IL-1rα (data not shown). Total circulating IgG and IgM was also measured at similar time points (Fig. 10). Time-dependent increases in serum IgG and IgM were observed in all ISIS 104838-treated groups. As with the inflammatory markers, the greatest changes were present in the daily s.c. group, especially for IgM. The group mean levels were about 3.6- and 2.7-fold above baseline for IgG and IgM, respectively, for this group at termination (day 196). Comparable IgG and IgM levels were found in the once-weekly s.c. and i.v. infusion animals, with increases of 2.6- to 2.8-fold above baseline for IgG and 1.8- to 1.9-fold above baseline for IgM at termination (day 276). The changes in inflammatory cytokine/chemokine and total immunoglobulin levels were also reflected in the increased weight of lymphoid organs (Fig. 11). Consistent with the other findings, spleen and inguinal lymph node weight increases were the greatest in the daily s.c. animals. Organ weight increases were similar between the once-weekly s.c. and i.v. infusion groups, except that slightly higher inguinal lymph node weight was found in the weekly s.c. group, which likely reflects the localized route of administration.
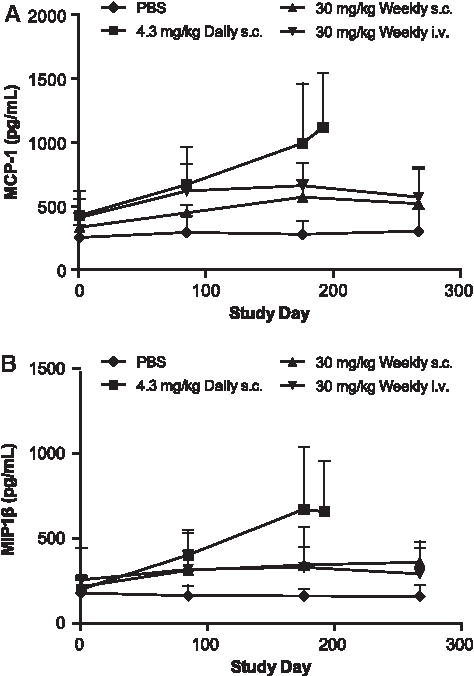
Increases in circulating MCP-1 and MIP-1β levels in monkeys treated with ISIS 104838 for up to 9 months. Serum samples from control (♦), daily s.c. (■), weekly s.c. (▲), and weekly i.v. infusion (▼) groups were collected at prestudy and 48 h postdose on days 85, 176, and 267 (except 24 h postdose on days 85, 176, and 192 for the daily s.c. group). MCP-1
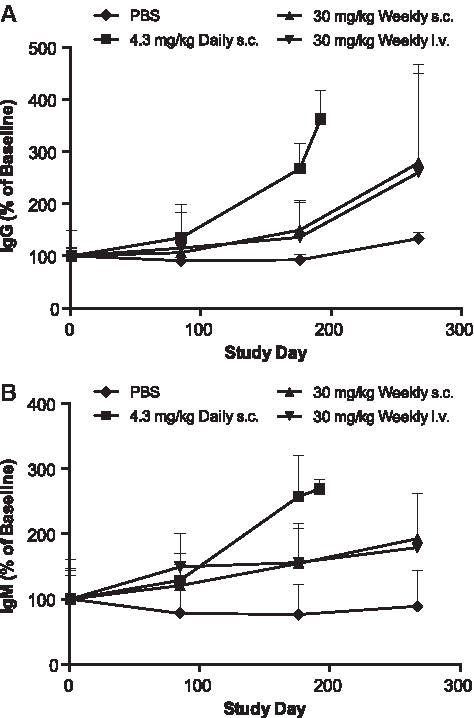
Increases in circulating IgG and IgM levels in monkeys treated with ISIS 104838 for up to 9 months. Serum samples from control (♦), daily s.c. (■), weekly s.c. (▲), and weekly i.v. infusion (▼) groups were collected at prestudy and 48 h postdose on days 85, 176, and 267 (except 24 h postdose on days 85, 176, and 192 for daily s.c. group), and they were analyzed for total IgG
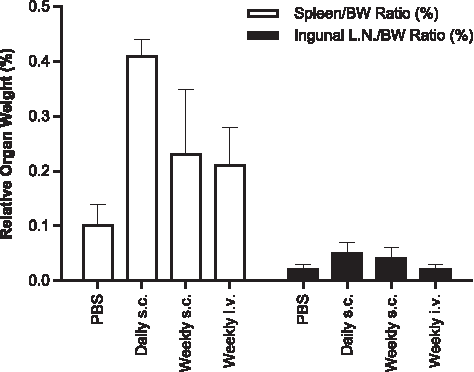
Increases in spleen and ingunal lymph node weights in monkeys after up to 9 months of treatment with ISIS 104838. The daily s.c. group was terminated on day 196 and the control, weekly s.c., and weekly i.v. infusion groups were terminated on day 276. Expressed values are the mean ± SD of organ weight/body weight ratios.
There was also evidence of endothelial cell activation, with increased VCAM-1 and vWF, after chronic treatment with ISIS 104838. These changes were mostly comparable across the ISIS 104838-treated groups, but occurred earlier and with greater magnitude in the daily s.c. group, especially for VCAM-1 (Fig. 12). This effect is possibly due to the C3 depletion and subsequently re-distribution of the immune complexes onto the endothelium layer of the vasculature wall.
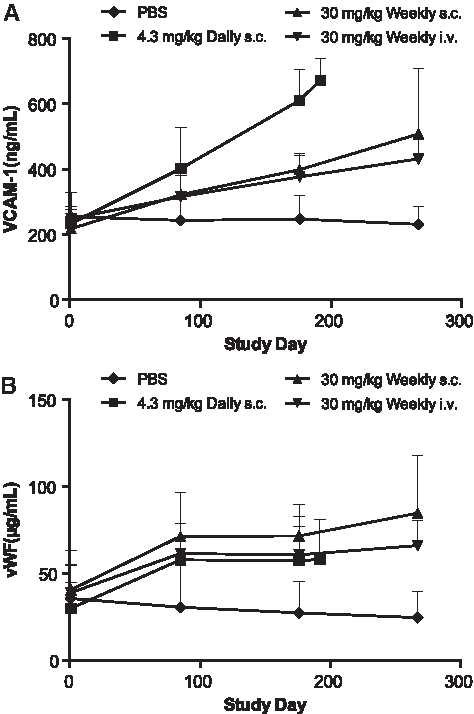
Increases in serum endothelial activation markers VCAM-1 and vWF after up to 9 months of treatment with ISIS 104838. Serum samples from control (♦), daily s.c. (■), weekly s.c. (▲), and weekly i.v. infusion (▼) groups were collected at prestudy and 48 h postdose on days 85, 176, and 267 (except 24 h postdose on days 85, 176, and 192 for daily s.c. group). VCAM-1
Discussion
Activation of the AP by 2′-MOE ASOs in monkeys is mediated through nonspecific interactions between the polyanionic ASO and factor H [2]. The inhibitory effect on factor H is transient, and no sustained changes in protein function or level in plasma were found. However, there were long-term effects on the kinetics of plasma C3 and the complement split products after chronic ASO treatment in monkeys. This included a progressive decline in plasma C3 and a gradual increase in predose (trough) levels of Bb and C3a.
After a single high dose (≥10 mg/kg) of a 2′-MOE ASO, the decline in plasma C3 level reflected a typical proteolytic degradation and generation of the split products [2]. Complete reversal of decreased C3 concentration requires several days for resynthesis of normal protein levels. After chronic once-weekly 2′-MOE ASO-mediated complement activation, resynthesis of C3 is incomplete; so plasma C3 concentrations do not return to baseline or control levels before the next weekly dose. The sustained decrease in circulating C3 was attributed to the direct effect of the 2′-MOE ASO on AP activation and not due to the inhibition of C3 protein production, as there was no reduction in liver C3 mRNA levels after 9 months of treatment, nor was there any evidence of activation of the classical complement pathway (data not shown). Notably, the reduction in circulating C3 was also reversible with cessation of treatment (Ionis, unpublished data). The gradual increase in predose (trough) C3a and Bb levels over time were likely due to insufficient clearance of the split products between dose intervals, or possible persistent low-grade complement activation after prolonged 2′-MOE ASO treatment.
The extent of the sustained C3 reduction in monkeys is dependent not only on the dose but also on the duration/frequency of the drug exposure. In this study, daily s.c. administration of 4.3 mg/kg/day actually accelerated the process of C3 reduction and was associated with the highest predose levels of split products C3a and Bb after repeated treatment, even though there was no serologic evidence of activation after the first dose. These data suggested a possible change of threshold for activation with increased frequency of dosing/duration of exposure. On the other hand, the once-weekly 30 mg/kg/week 30-min i.v. infusion group had a slower progression of C3 reduction, compared with the daily and once-weekly s.c. groups. This was most likely related to the more rapid clearance of ISIS 104838 from the circulation with the i.v. route of administration and thus, a more transient activation of the AP.
The acute effects secondary to ASO-mediated complement activation in monkeys have been well described [3,12,13]. However, the potential effects secondary to chronic repeated complement activation on individual complement proteins and the overall function of the pathway have received little attention. Complement C3 deficiency can impair either of the primary functions of the complement cascade: innate immune surveillance or clearance of immune complexes [14,15]. The complement system plays an important role in protecting the host from microbial infections [16–18]. This impairment of innate immune surveillance due to C3 deficiency could become an issue in monkey studies where the animals are not pathogen free.
Another possible sequela to complement deficiency is impaired clearance of CIC. CICs are usually removed from circulation via the mononuclear phagocytic system (MPS), primarily in the liver and spleen. Impairment of CIC clearance can lead to deposition outside the MPS and cause local inflammation and tissue damage [19,20]. The complement system facilitates the clearance of CIC by increasing their solubility, thereby preventing immunoprecipitation, deposition, and accumulation in peripheral tissues [21,22]. The complement also facilitates clearance by opsonization with C3 fragments (such as C3b), thereby enhancing the binding of CIC to complement receptor type 1 (CR1) on primate erythrocytes, which then transports the complexes to the MPS to be processed and cleared [23,24]. If CICs are not cleared by these pathways, the insoluble complexes can bind to and interact with vascular endothelium in various peripheral tissues, especially renal glomeruli, leading to activation of endothelial cells and possibly initiation of the inflammatory cascade [21]. There are considerable data supporting a possible link between depletion of C3, impairment of the CIC clearance, and mediation of vascular pathology [25–27]. A potential connection between impaired CIC clearance and increased risk of vascular injury is further supported by the prevalence of vasculitis or glomerular sclerosis in humans with genetic or acquired deficiencies in various complement factors [14,26,27].
Other inflammatory signals may also attribute to the vascular lesion with 2′-MOE ASO treatment. Repeated complement activation could trigger secondary vascular inflammation through the production of potent proinflammatory agents such as C3a and C5a [28,29]. Increased plasma concentrations of inflammatory cytokines or chemokines, such as IL-6 and MCP-1, have also been observed after 2′-MOE ASO administration and likely contribute to downstream secondary inflammatory responses seen with this class of ASO [12]. It is also possible that increased vascular inflammatory signaling is related to CIC and complement split products with repeated complement activation, although a role for direct 2′-MOE ASO-mediated inflammatory effects cannot be excluded [30–32].
A correlation between decreased plasma C3 and increased CIC concentrations has been demonstrated in the current study where plasma concentrations of C3d-labeled immune complexes were measured in monkeys after 30 mg/kg ISIS 104838 given s.c. once weekly for up to 9 months. Plasma C3 declined progressively and correlated with a gradual increase in plasma CIC-C3d levels. Elevated CIC-C3d and total immunoglobulin levels were observed in all ISIS 104838-treated groups, with the highest levels present in the daily s.c. animals that had the most rapid and severe C3 depletion. There was increased immunoreactivity for IgM and C3 on vascular endothelium in the current study and elevated plasma biomarkers for endothelial activation such as VCAM-1 and vWF and inflammatory chemokines, including MCP-1 and MIP-1β. Histopathologic evaluation confirmed an increased incidence of thickening of the tunica intima/media and vascular/perivascular inflammatory cell infiltrates, especially in the s.c. (daily and weekly) groups that had the more severe and prolonged C3 depletion and CIC elevation. These data support a functional connection between C3 depletion and the potential for increased vascular activation and inflammation. There were minimal vascular changes in the weekly i.v. infusion group, even though the C3 and CIC-C3d levels were comparable to the weekly s.c. group at the end of the 9-month treatment. This was likely due to the slower progression of C3 depletion in the i.v.-dosed animals, whereby they were subject to a relatively shorter period of hypocomplementemic conditions compared with the s.c.-treated animals. There was also evidence of an increase in immunogenicity response for ADA after chronic treatment of ISIS 104838. There has not been any neutralizing capacity of the ADAs induced by ASO based on our experience, and it does not appear to have much impact on tissue accumulation and drug efficacy.
Although the nature and the mechanism of this ADA is still being investigated, it did not appear to be correlated with the vascular injury present in animals after treatment with ISIS 104838, as some strongly positive animals had no evidence of vascular inflammation.
Complement activation by 2′-MOE ASOs has two defining characteristics: First, activation is selective for the AP, and second, monkeys appear to be uniquely sensitive. Complement activation is not observed in rodents, rabbits, or dogs after ASO administration (Ionis, internal data). Humans are also less sensitive to ASO-induced complement activation compared with monkeys, as illustrated by the in vitro complement assay in monkey and human serum [5].
To date, there has been no occurrence of clinically relevant treatment-associated AP activation in human subjects after s.c. injection or short-term i.v. infusion at clinically relevant doses with 2′-MOE ASOs as well as some first-generation full PS ASOs [4,6–10]; this is, in part, due to the fact that plasma drug levels in the clinical studies remain below the threshold levels required for activation in monkeys. However, this is not the only explanation, as the plasma Cmax in some oncology trials for 2′-MOE ASOs were comparable to the threshold for AP activation in monkeys, but no meaningful increases in Bb, C3a, or C5a were observed [4,33,34]. The only cases of treatment-related complement activation in the clinic were with two first-generation full PS ASOs (ISIS 5132 and ISIS 3521), where patients were given the maximum tolerated doses of up to 24 or 30 mg/kg via a continuous 24-h i.v. infusion for oncology indications [35,36]. The cause of the complement activation in these two cases was likely due the continuous 24-h i.v. infusion route, as no clear evidence of dose-related complement activation with ISIS 3521 was observed in a separate trial when administered via 2-h i.v. infusion with a total weekly dose up to 18 mg/kg/week (up to 6 mg/kg/day, three times a week) [8].
In summary, 2′-MOE ASO-mediated complement activation is a common effect at high doses in nonclinical monkey studies. Chronic repeated complement activation causes sustained C3 depletion and results in a number of secondary effects, including reduced CIC clearance, increased C3 and IgM deposition in tissues, and increased inflammation in various organs and vascular beds. Despite the sensitivity of monkeys to complement activation, no clear evidence of treatment-related activation has been found in humans after short-term i.v. infusion or s.c. injection with numerous 2′-MOE ASOs in clinical development. Monkeys remain the preferred pharmacologically relevant species for toxicity evaluation of 2′-MOE ASOs in general due to sequence homology and similar pharmacokinetic profiles with humans [37], so a better understanding of the mechanisms for complement activation and its associated secondary changes are critical to make an informed interpretation of findings in nonclinical toxicology evaluations. Even so, 2′-MOE ASO-induced complement activation in monkeys appears to have little implication on clinical safety assessment, as humans appear to be less susceptible to such activation.
Footnotes
Author Disclosure Statement
Authors affiliated with Ionis Pharmaceuticals, Inc. are or have been employees and shareholders of the company that is submitting this article.