
Abstract
To investigate the pharmacokinetics (PKs) and pharmacodynamics (PDs) for ION-353382, an antisense oligonucleotide (ASO) targeting scavenger receptor class B type I (SRB1) mRNA, using alpha-2-macroglobulin (A2M), murinoglobulin double-knockout (DKO), and wild-type mice. Wild-type and DKO homozygous mice were administered a single subcutaneous injection of ION-353382 at 0, 5, 15, 30, and 60 mg/kg. Mice were sacrificed at 72 h with plasma and organs harvested. Both liquid chromatography–mass spectrometry (LC-MS) and enzyme-linked immunosorbent assay (ELISA) were used to determine ASO exposure with real-time PCR for SRB1 expression. Immunohistochemistry was evaluated to explore hepatic uptake of ASOs. The total plasma protein binding and profiling was assessed. Finally, two-dimensional gel electrophoresis identified protein expression differences. PK exposures were comparable between wild-type and DKO mice in plasma, liver, and kidney, yet a near twofold reduction in EC50 was revealed for DKO mice based on an inhibitory effect liver exposure response model. Total plasma protein binding and profiling revealed no major dissimilarities between both groups. Plasma proteome fingerprinting confirmed protein expression variations related to A2M. Histological examination revealed enhanced ASO distribution into hepatocytes and less nonparenchymal uptake for DKO mice compared to wild-type mice. Knocking out A2M showed improved PD activities without an effect on total plasma and tissue exposure kinetics. Binding to A2M could mediate ASOs to nonproductive compartments, and thus, decreased binding of ASOs to A2M could potentially improve ASO pharmacology.
Introduction
A
A2M participates in numerous functions, yet two major roles have been described in detail, including its role as a broad spectrum proteinase inhibitor and as a shuttle carrier for both proteins and small molecule ligands. A2M is composed of a signature bait region, rich in thiolesters as a highly diverging unconserved stretch of amino acids, which are sequence-dependent recognition sites for A2M ligands [4]. Numerous A2M bait regions have been elucidated and are well characterized in rat, monkey, human, and other species [5]. Diverse proteases cleave varying lengths of the bait region, which activate and change the A2M conformation forming an irreversible steric trapping complex. Proteases complexed to A2M are enzymatically active, but are sterically trapped and incapable of binding to their desired target.
A2M is activated by its ligand to expose receptor binding sites allowing uptake by the A2M receptor. A2M is then recognized and binds to macrophage receptors such as the low-density lipoprotein-related receptor, with eventual endocytosis and delivery to endosomes and lysosomes enhancing elimination and maintaining circulating plasma levels (∼2–4 mg/mL) in mice [6]. While A2M makes up only a very small fraction of plasma proteins, upregulation and/or downregulation of A2M in circulation and extravascular space have been linked to immunological abnormalities [7–9], tissue inflammation, Alzheimer disease [10,11], and numerous cytokine-related diseases [12]. In several instances, A2M has proven exceedingly useful as a direct clinical biomarker for numerous disorders [13–15].
Our interest in A2M is in regard to its effect on the pharmacokinetics (PKs) and pharmacodynamics (PDs) of antisense oligonucleotides (ASOs) because it is generally believed that protein binding and shuffling play an important role on tissue distribution, including the target compartment [16,17]. RNA targeted drug development using ASOs is recognized as a broad and diverse platform spanning multiple therapeutic areas for numerous rare disease, cardiovascular, neurological, and metabolic disorders. Over three decades of exhaustive research has established ASOs into a more mature, efficient, and well-accepted technology with several successful commercialized products to date [18].
Currently, the RNase H1 degradation pathway is the most advanced and well understood in vivo mechanism for cleavage of targeted RNA, yet significant other ASO mechanisms have been described and utilized spanning multiple targets and organs [19–21]. Optimizations to the base pair chemistries of ASOs have given rise to increased tolerance and significantly enhanced potency, offering less frequent dosing regimens, access to multiple routes of administration, and reduced undesirable side effects [22]. Currently, ASO development is evolving with numerous preclinical and advanced stage clinical programs offering great promise for unmet clinical needs.
From a development perspective, oligonucleotides have been shown to have pervasive and tight binding interactions with proteins [23], and plasma proteins such as A2M may bind to ASOs with high affinity. Thus, knocking out A2M could potentially alter organ, suborgan, and subcellular uptake, directly affecting the PK and PD properties of ASOs. As such, the biodistribution, uptake, and clearance mechanisms using an A2M and murinoglobulin double-knockout (DKO) model could alter the pharmacological response of ASOs and are worthy of investigation.
As an internal tool research compound, ION-353382 a 5-10-5, 20-mer methoxyethyl (MOE) gapmer composed of a phosphorothioate backbone targeting scavenger receptor class B type I (SRB1) mRNA is evaluated in this study. SRB1 protein is widely expressed in the liver as a high-density lipoprotein (HDL) receptor and has high affinity toward a wide variety of lipid-like ligands and mediates lipid uptake playing a crucial role in metabolism processes [24]. Thus, functional changes of SRB1 activity using ASOs to inhibit mRNA expression may affect HDL, cholesterol, lipoproteins, and numerous other ligands.
Herein, in the current work, we explore comprehensive PK/PD-related investigations for ASOs using an A2M and murinoglobulin DKO murine model. Our research aims to provide a detailed account into describing the effect of A2M knockout on the PK/PD of ION-353382 targeting SRB1 administrated as a single dose. Our investigations include (1) evaluating plasma Ctrough and liver and kidney distribution kinetics, (2) describing pharmacological differences using an inhibitory effect liver exposure response model, (3) hepatic uptake differences by immunohistochemistry (IHC), (4) describing the degree of total plasma protein binding and protein binding profiling, (5) confirming no significant differences in total protein, albumin, histidine-rich glycoprotein (HRG), and immunoglobulins, and finally, (6) plasma proteome fingerprinting.
Materials and Methods
Materials
Sodium phosphate dibasic, triethylammonium bicarbonate, phenol:chloroform:isoamyl alcohol 25:24:1, Tris(hydroxymethyl)aminomethane, ethylenediaminetetraacetic acid, 2-mercaptoethanol, H2O, acetonitrile, ethanol, triethylamine, hexafluoroisopropanol, and hematoxylin were purchased from Sigma-Aldrich (St. Louis, MO). Tween-20 was purchased from Promega Corporation (Madison, WI). MSD blocker A, MSD read buffer T (4×) with surfactant, and MSD gold streptavidin plate were purchased from Meso Sale Discovery (Rockville, MD). Strata-X 33 μm polymeric and protein precipitation plates were purchased from Phenomenex (Torrance, CA). Phosphate-buffered saline (PBS), express superscript qPCR supermix universal, rox reference dye, express superscript mix, RiboGreen, purelink pro RNA purification kit, gene expression qPCR kit, simplyblue safestain, DNase I, and alexa-488 were purchased from Invitrogen (Carlsbad, CA).
MSD probes and qPCR primer probe set were purchased from Integrated DNA Technologies (Coralville, IA). Xbridge column (50 × 2.1 mm, 2.5 μm) was purchased from Waters (Milford, MA). Size exclusion column (300 × 4.6 mm, 3 μm) was purchased from Sepax Technologies, Inc. (Newark, DE). Nanosep 30K omega centrifugal filters were purchased from Pall Corporation (Ann Arbor, MI). Surfact-amps 80, 10% and Tris-buffered saline (TBS) were purchased from Thermo Scientific (Rockford, IL). ReadyStrip IPG strips, equilibration buffers I and II, iodoacetamide, 30% glycerol solution, protein standard plugs, overlay agarose, precast gel criterion 8%–16% Tris–HCl, Tris–glycine sodium dodecyl sulfate (SDS) running buffer 10×, and Bradford total protein assay were purchased from Bio-Rad (Hercules, CA). Proteinase K and DAB Chromagen were purchased from Dako (Carpinteria, CA). Protein Blocking Solution was obtained from Innovex Biosciences (Richmond, CA). Secondary antibody: goat anti-rabbit IgG (HRP) was purchased from Jackson ImmunoResearch Laboratory (West Grove, PA). Xylene and ethyl alcohol were purchased from BBC Biochemical (Mount Vernon, WA). Murine-specific albumin enzyme-linked immunosorbent assay (ELISA) kit was purchased from Bethyl Laboratories (Montgomery, TX). Murine-specific Immunoglobulin G, M, and A kits were purchased from eBioscience (San Diego, CA). HRG ELISA kit was purchased from Cloud-Clone Corporation (Houston, TX).
MAM−/−MUG1−/− DKO breeding and routine colony testing
C57BL/6-DKO murine-alpha-2-macroglobulin (MAM)−/− and murinoglobulin (MUG1)−/− mice were obtained from the University of California, San Francisco. DKO mice were generated by recombinant DNA construct vectors targeting the MUG and MAM/MUG genes and were electroporated into embryonal stem cell lines, pups were genotyped, and HE/HE pairs were mated followed by screening for homozygous strains [25,26]. Both male and female breeders were setup as exclusive (HO/HO×HO/HO), and (WT/WT×WT/WT) matings. Breeders and pups were screened by A2M plasma concentrations. Whole blood and plasma were collected from mice at 5 weeks of age and centrifuged using a 5415C Microcentrifuge to collect plasma (Eppendorf, Hamburg, Germany).
An ELISA specific for murine A2M was performed using a singleplex assay on the luminex platform using a polyclonal sheep anti-A2M capture antibody. The standard curve range was from 8.9 to 6,500 ng/mL, samples were diluted before analysis. Western blotting was used to confirm the 165-kDa MAM subunit and 180-kDa MUG1 subunit. A Hyg qPCR assay as a TaqMan qPCR targeting the selection cassette as a surrogate was used for genotyping using the following MAM primer probe sequences: hygqF821:5′CCGCAAGGAATCGGTCAAT3′, hygqR878: 5′GATCAGCAATCGCGCATATG3′, hygqprobe: 5′ [Vic]CACTACATGGCGTGATT[MGB]3′, and apob qPCR assay as an endogenous control using mApobqFe26:5′CGTGGGCTCCAGCATTCTA3′, mApobqRe26:5′CTGCCTTTGCGTCCTTGAG 3′, mApobqpe26: 5′ [6Fam] AGCCAATGGTCGGGC [MGB] 3′ sequences, respectively. The A2M colony was maintained at Charles Rivers Laboratories (Hollister, CA) before delivery at IONIS Pharmaceuticals.
In vivo study design
All animals and procedures conducted in the study were in compliance and approved by the IONIS Pharmaceuticals Institutional Animal Care and Use Committee (Protocol: P-0214-100019). A total of 40 mixed gender C57BL/6 mice, including 20 WT/WT and 20 MAM/MUG1 DKO homozygous mice aged 6–10 weeks and weighing 18–25 g, were used. Baseline characteristics at study initiation are listed in Table 1. Dosing solutions of ION-353382 a 5-10-5 methoxyethyl (MOE) ASO targeting SRB1 were formulated in sterile saline at 1, 3, 6, and 12 mg/mL.
Standard deviation of the average.
Statistically significant, P < 0.001.
ION-353382 was administered as a single subcutaneous dose to the nape of the neck at 5, 15, 30, and 60 mg/kg using saline as a dosing vehicle control with a dose volume of 5 mL/kg. A total of 10 treatment groups were used. Mice were fasted overnight before dosing, while allowed water ad libitum continuously, and fed 3 h postdose while maintained in standard cages. Following 72 h after dosing, mice were euthanized by terminal cardiac puncture and cervical dislocation, with whole blood collected and stored into K2EDTA-containing tubes followed by centrifugation at 2,000g for 10 min at 4°C to separate plasma. Liver, kidneys, lung, muscle, and heart from each mice were harvested and flash frozen in liquid nitrogen and stored at −80°C before analysis.
Plasma and tissue exposure kinetics in DKO mice
Plasma Ctrough levels at 72 h were evaluated for both WT/WT and HO/HO groups using enhanced chemiluminescence (ECL)-ELISA. A calibration curve was setup from 0.5 to 100 ng/mL. Stock capture probe for ION-353382, 5′BioTeg AeAkGeGeAkAeGeTkmCeAe, k = cEt BNA (3); e = MOE (7), was diluted to 25 nmol in 10× SSPE buffer, and 100 μL was added to 25 μL of each plasma sample and standard into a 96-well PCR plate, sealed, and heated at 70°C for 30 min followed by cooling at room temperature 21°C for 15 min and cooled to 6°C for 15 min to complete hybridization. At the same time, an MSD gold streptavidin-coated 96-well plate was blocked using 1.5 g of blocker A dissolved in 50 mL of PBS with 150 μL added to each well and incubated at 21°C for 60 min. Next, the MSD plate was rinsed for two cycles with 10 mM phosphate buffer pH 7.4, 150 mM NaCl, 0.05% Tween-20 (PBS-T) washing buffer.
Samples from the PCR plate were mixed 6–8 times, and 50 μL was transferred to the MSD plate in duplicate and allowed to immobilize on the plate using shaking at 500 rpm at 21°C for 30 min. Plates were then rinsed for two cycles. A preheated detector probe for ION-353382, 5′-TkGxAemCxTkGeAfAfGemCk-[Spacer]-(NH2)-3′, k = cEt BNA (3); e = MOE (3); f = 2′ − F (2); x = deoxy (2), was prepared at 2 nmol, and 50 μL of was added to each well incubated using shaking at 500 rpm at 21°C for 30 min. Plates were rinsed for four cycles, and 150 μL of MSD read buffer was added to each well. Plates were read on a Sector PR 2400 MSD system (Meso Sale Discovery).
For tissue exposure kinetics, the liver and kidney were weighed to 50 mg and diluted in 450 μL of homogenization buffer (20 mM Tris pH 8, 10 mM EDTA, 0.1 M NaCl, 0.5% NP40) and broken up by homogenization. A calibration curve was prepared from 0.05 to 100 μmol using ION-353382. Samples were basified with 300 μL of NH4OH, extracted with 800 μL of phenol/chloroform/isoamyl alcohol (25:24:1), and centrifuged at 13,000g for 4 min to separate aqueous and organic layers. Aqueous supernatants were removed and an additional back extraction was performed.
Following the liquid–liquid extraction, solid phase extraction (SPE) was performed. SPE plates were equilibrated with 2 mL of acetonitrile followed by 2 mL of 1 M triethylammonium bicarbonate (TEAB). Samples were loaded onto the cartridges followed by a rinse with 2 mL of 0.1 M TEAB, 2 mL of H2O, 2 mL of 2% NH4OH (in 5% acetonitrile, 0.1 M TEAB), and 2 mL of 10% acetonitrile in 0.1 M TEAB. Samples were eluted with 1.5 mL of 70% acetonitrile in 0.1 M TEAB and run through a protein precipitation plate. Finally, samples were dried down under nitrogen and reconstituted to 140 μL with 100 μmol EDTA prior for liquid chromatography–mass spectrometry (LC-MS) analysis.
An Agilent 1100/1200 HPLC system consisting of a 1,100 quaternary pump, column over, and autosampler coupled to a single quadrupole mass spectrometer (Agilent 6130; Wilmington, DE) was used. An XBridge column (50 × 2.1 mm, 2.5 μm) was used for chromatographic separation (Waters). The column temperature was maintained at 55°C with mobile phase A consisting of 5 mM TriButAA in 20% acetonitrile and mobile phase B consisting of 5 mM TriButAA in 90% acetonitrile. A flow rate of 0.30 mL/min was used at 22% B initially while ramping to 80% to 6 min and held for 1.5 min; over a period of 0.2 min the gradient returned to initial conditions and was held for one additional minute. Negative polarity electrospray ionization was used with a scan time of 2–8 min using a scan window of 1,200–2,100 m/z with a spray voltage of 4 kV and 35 psig of sheath gas flow, 12 L/min, 335°C drying gas flow using a capillary voltage of −150 V. Select ion monitoring was performed for the −5 charge state, and chromatograms were analyzed using Agilent ChemStation software.
SRB1 mRNA knockdown in liver and other tissues
Approximately 100 mg of liver, kidney, heart, jejunum, and quadriceps was placed into 1.5 mL Eppendorf vials with the addition of an equal amount of ceramic pulverizing beads followed by the addition of 1.2 mL of Invitrogen lysis buffer containing 1% betamercaptoethanol. Samples were pulverized using a Precellys 24 high-throughput tissue homogenizer for 30 s to uniformity (Bertin Corp, Rockville, MD), and 300 μL was transferred to a 2.0 mL deep 96-well plate followed by addition of 300 μL of 70% ethanol to each. Plates were then vortexed for 2 min, and 100 μL of lysate was added to the PureLink Pro 96 total RNA Purification Filter Plate. Samples were covered with Airpore tape sheets and centrifuged for 2 min at 3,000g. The flow through was discarded, and 500 μL of wash buffer I was added to each well of the filter plate and centrifuged at 3,000g for 2 min with the flow through discarded, then DNase I at 40 U per 80 μL/well was added with incubation at room temperature for 15 min, followed by 500 μL of wash buffer I.
Plates were recentrifuged for 2 min at 3,000g, and 750 μL of wash buffer II (17.5 mL was buffer II +70 mL of ethanol) was added to each well, samples were recentifuged and an additional 750 μL of wash buffer II and centrifugation was performed followed by a longer duration of 5 min to dry the filter. A new 96-well plate was used, and purified RNA was eluted with 100 μL of RNase-free H2O. Samples were quantitated using RiboGreen, prepared by 55 μL of RiboGreen +17.5 mL of TE1X and 170 μL was added to 10 μL of sample into a clear bottom 96-well plate. A standard curve was also prepared from combined sample RNA from 1.56 to 200 ng/mL.
Plates were read using a fluorescence excitation/emission wavelength of 500/525 nm using a SpectraMax Gemini XPS plate reader with SoftMax Pro v5.4 (Molecular Devices, Sunnyvale, CA). RiboGreen data were used to normalize RNA values, and corresponding samples were diluted to 25 ng/mL. A qPCR master-mix was prepared with the addition of 800 μL of express superscript qPCR supermix, 20 μL of 10 μM forward SRB1 primer, 20 μL of 10 μM reverse SRB1 primer, 20 μL of 5 μM probe, 32 μL of ROX reference dye, 160 μL of express superscript mix for one step qPCR, and 388 μL of RNase-free H2O. Individual reactions were setup into the 96-well plate using 2 μL of sample RNA combined with 18 μL of master-mix per well. A standard cycling program was used with an initial hold at 50°C for 15 min followed by denaturation at 95°C with a 2-min hold, and 40 cycles of 95°C for 15 s and 60°C for 1 min using a StepOnePlus Real-Time PCR system and with v2.3 software (Applied Biosystems, Carlsbad, CA). Corresponding cycle threshold (Ct) values normalized by RiboGreen were used to evaluate SRB1 expression in liver, kidney, heart, lung, jejunum, and quadriceps. Percent SRB1 RNA inhibition compared to the saline control was determined across all dose groups.
Inhibitory effect liver exposure response PD model
Phoenix Build 6.4.0.768 WinNonlin was used for PD modeling and simulation (Certara, St. Louis, MO). Data set assembly was constructed using animal number, time (h), dose (mg/kg), liver concentration (μg/g), percent mRNA inhibition compared to saline control (%), and knockout status (WT/WT, or HO/HO). The data set was then imported into an inhibitory effect sigmoid maximum effect (Emax) PD model, whereby effect C = 0 is Emax and effect at C = infinity is E0, using the following equation:
whereby E = % saline inhibition in liver, E0 = lowest%saline inhibition, C = liver concentration, γ = hill coefficient, and EC50 = concentration required for 50% inhibition. Uniform weighting using initial parameters/bounds with Nelder–Mead minimization was used, and EC50 values for both WT/WT and HO/HO cohorts were compared.
Immunohistochemistry
Formalin fixed paraffin sections of murine liver were cut and sectioned at 4 μm, and slides were dried overnight in an oven set to 50°C. The slides were then deparaffinized with xylene treatment for 10 min followed by 100% ethyl alcohol for 10 min, 95% ethyl alcohol for 6 min, and rinsed with water for 2 min. Endogenous peroxidase was quenched placing the slides in 3% hydrogen peroxide for 15 min. Slides were then rinsed with 1× TBS for 5 min and treated with Proteinase K for 5 min at room temperature. Slides were rinsed again with TBS and blocked with protein blocking solution for 20 min at room temperature. Slides were rerinsed with TBS, and primary antibody (Rabbit anti-ASO Antibody) was added at 1:10,000 and incubated overnight at 4°C. Slides were rerinsed with TBS and goat anti-rabbit secondary antibody was added at 1:200 dilution, and incubated for 30 min at room temperature (RT). Slides were rerinsed with TBS, and DAB Chromagen was applied for 5 min at RT, rinsed in H2O for 3 min, and counterstained by hematoxylin incubation for 30 s, followed by a H2O rinse for 1 min, acid alcohol rinse for 1 s, H2O rinse for 3 min, 95% ethyl alcohol for 2 min, 100% ethyl alcohol for 3 min, and xylene for 2 min.
Total plasma protein binding and protein binding profiling
An ultrafiltration method with a nuclease-dependent hybridization ELISA was used to determine total protein binding differences between sample types. The degree of plasma protein binding differences was evaluated using ION-353382 at both 5 and 150 μg/mL in WT/WT and HO/HO fresh plasma. Nanosep (30K) filters were pretreated with 300 μL of 0.5% Tween-80 and incubated at room temperature for 15 min followed by centrifugation at 12,000g for 10 min to minimize nonspecific binding. Retained volume was removed by rinsing the membrane twice with 300 μL of H2O, followed by the addition of 300 μL of a 300 μg/mL aqueous solution of ION-420476 as a separate ASO with no cross-reactivity to ION-353382 to further minimize nonspecific binding. Filters were incubated at room temperature for 10 min and centrifuged at 12,000g for 10 min.
Recovery testing was performed to correct for any nonspecific binding and evaluated at 250 ng/mL, and three aliquots of 300 μL of ION-353382 were placed into three pretreated filters and centrifuged at 12,000g for 7 min. Ultrafiltrate (filtered) samples were collected in addition to the initial samples and assayed by ECL-ELISA to obtain percent recovery. Two concentrations, including both 5 and 150 μg/mL of ION-353382, were prepared in 1.2 mL of whole plasma from WT/WT and HO/HO mice. Spiked oligonucleotide did not exceed 1.5% of the plasma volume, and plasma pH was near physiological levels between 7.3 and 7.5. Samples were incubated at 37°C for 30 min for binding, and three aliquots of 300 μL were placed in three pretreated filters and centrifuged at 12,000g for 7 min for collection of ∼20% of initial plasma volume ∼60 μL of filtrate. Aliquots of ultrafiltrates and initial plasma were assayed by ECL-ELISA to quantitate% bound and unbound ASO in samples. For total plasma protein binding, ECL-ELISA was performed with the same method as detailed for tissue exposure kinetics.
Protein binding profiling was performed by size exclusion chromatography (SEC) using ION-407988 (alexa-488 fluorescently labeled version of ION-3553382) to interact with proteins present in nontreated WT/WT and HO/HO plasma. The high-performance liquid chromatography (HPLC) and detector components included a G1332A 1100 series degasser, G1311A 1000 series quaternary pump, G1367A 1100 series autosampler, G1321A 1200 series fluorescence detector, G1315A 1100 series diode array, and a G1316 1100 series column compartment, all acquired from Agilent Technologies (Wilmington, DE). Background endogenous fluorescence was obtained by incubating 50 μL of plasma with 50 μL of PBS, in addition to a separate sample of 0.5 μm of Alexa-488-labeled ASO in PBS to determine the retention time of the label.
To study the protein binding characteristics of the ASO between samples, 50 μL of a 1.0 μM of ION-407988 was spiked into 50 μL of both WT/WT and HO/HO plasma. In addition, to study the ASO binding displacement, a nonlabeled ASO (ION-353382) was prepared and 25 μL of a 2.0 μM solution was added to 25 μL of a 2.0 μM solution of ION-407988, both spiked into 50 μL of plasma. All samples were incubated at 37°C for 30 min before analysis by HPLC-SEC. An isocratic method was setup using a flow rate of 1.0 mL/min with PBS as the mobile phase using an (300 × 4.6 mm, 3 μm) SEC column, with a 25 μL injection volume and a 20-min runtime. Fluorescence excitation/emission wavelengths were set to 495/519 nm, with endogenous background fluorescence of plasma samples subtracted out of the chromatogram to explore ASO-protein binding interactions.
Total protein, albumin, immunoglobulins, and HRG quantitation
Total protein content from WT/WT and HO/HO samples (n = 7 each) was assayed using a Bradford Total Protein Assay with samples diluted to fit a curve range of 1.5–10 μg/mL using an absorbance wavelength of 595 nm. Albumin, Immunoglobulin G, M, and A, and HRG were assayed by murine-specific ELISA kits.
Plasma proteome fingerprinting by isoelectric focusing and SDS-PAGE
The same volume (60 μL) from WT/WT and HO/HO murine plasma samples was mixed with 180 μL of binding buffer followed by albumin/IgG removal. A 200 μL diluted mixture containing 50 μL of depleted plasma was added to 150 μL of two-dimensional rehydration media per sample and loaded onto a 11-cm ReadyStrip IPG for separation between pH 3 and 10 for 16 h. Isoelectric focusing was performed by a rapid ramp at 200 V for the first step, followed by a gradual ramp to 8,000 V to 1 h and maintained, followed by a hold at 1,500 V using a Protean i12 IEF Cell (Bio-Rad). Following isoelectric focusing, the second dimension SDS-polyacrylamide gel electrophoresis (PAGE) was prepared using a precast 8%–16% Tris-HCl gel of dimensions 13.3 × 8.7 cm (width × length) and run at 150 V constant for 110 min using a Bio-Rad model PWSPL-4 electrophoresis power supply. The gel was then stained by coomassie blue staining using SimplyBlue SafeStain with imaging acquired by an ImageQuant LAS 4000 system (GE Healthcare Bio Sciences, Marlborough, MA). Relevant bands were excised and characterized by LC-MS based on coverage, number of unique peptides, molecular weight, and isoelectric point.
Statistical analysis
Statistical significance between samples was evaluated using analysis of variance and Student's t-test. Mean of replicate measurements (n = 4) per group with corresponding standard deviation values was used to plot the figures. Sample group differences less than P < 0.05 were determined as statistically significant.
Results
Plasma and tissue PKs
Plasma trough ASO concentrations were determined by ECL-ELISA, while liver and kidney ASO concentrations were determined by LC-MS at 72 h following single s.c. dose administration of ION-353382. Log transformed plasma Ctrough values are listed in Fig. 1A, with error bars representing the standard deviation from (n = 4) animals. Plasma concentrations of ASO spanned from a range of 1.8–22.2 ng/mL across dose groups. A dose-dependent uptake and ASO exposure in plasma were observed across the 5, 15, 30, and 60 mg/kg dose cohorts. Slopes from the linearized log-transformed Ctrough values were 1.02 and 0.69 for WT/WT and HO/HO type, respectively, with coefficient of determination (R2) values (>0.99). Dose-proportional plasma Ctroughs were observed for WT/WT, while slightly less than dose proportional in HO/HO mice.

Plasma
Exposure of ASO in tissue, including both liver and kidney evaluations, is described in Fig. 1B and C. Dose-dependent uptake was observed for groups across the dose range. Concentrations of ASO in the liver spanned a range from 2 to 16 μg/g, with higher exposure levels in kidney ranging from 7 to 33 μg/g across dose groups. Log transformations of liver uptake revealed slightly less than, but near dose proportional liver uptake, with slopes of 0.84 and 0.80, (R2 > 0.99), for WT/WT and HO/HO mice, respectively. The same assessment in kidney revealed less than dose proportional kidney exposure with slopes of 0.50 and 0.55, (R2 > 0.98), for WT/WT and HO/HO, respectively. Kidney to liver ratios were between 2 and 5 across dose groups, and ratios between groups were superimposable and near identical with no statistically significant differences.
PD effect following ASO treatment
PD effect was evaluated by measuring SRB1 mRNA knockdown in both WT/WT- and HO/HO-derived organs and comparing treated animal expression to the saline dosed control. Following treatment, the PD effect of ASOs was significantly different across various tissues, including the liver, heart, kidney, quadriceps, jejunum, and lung (Fig. 2). Control saline mRNA expression levels are listed with a dashed bar representative of 0% target knockdown (no effect). Clear differences between tissues were observed with the most evident effect in liver, in addition to notable knockdown in the kidney and heart, with minimal effect in the jejunum and lung. A dose-dependent PD effect was observed in the liver ranging from 16% to 93% inhibition of target expression. By expression levels alone, statistically significant differences (P < 0.01 to P < 0.05) were observed between WT/WT and HO/HO mice, with 1.3-, 1.7-, 2.0-, and 1.9-fold enhanced efficacies for the HO/HO subtype at dose levels of 5, 15, 30, and 60 mg/kg.
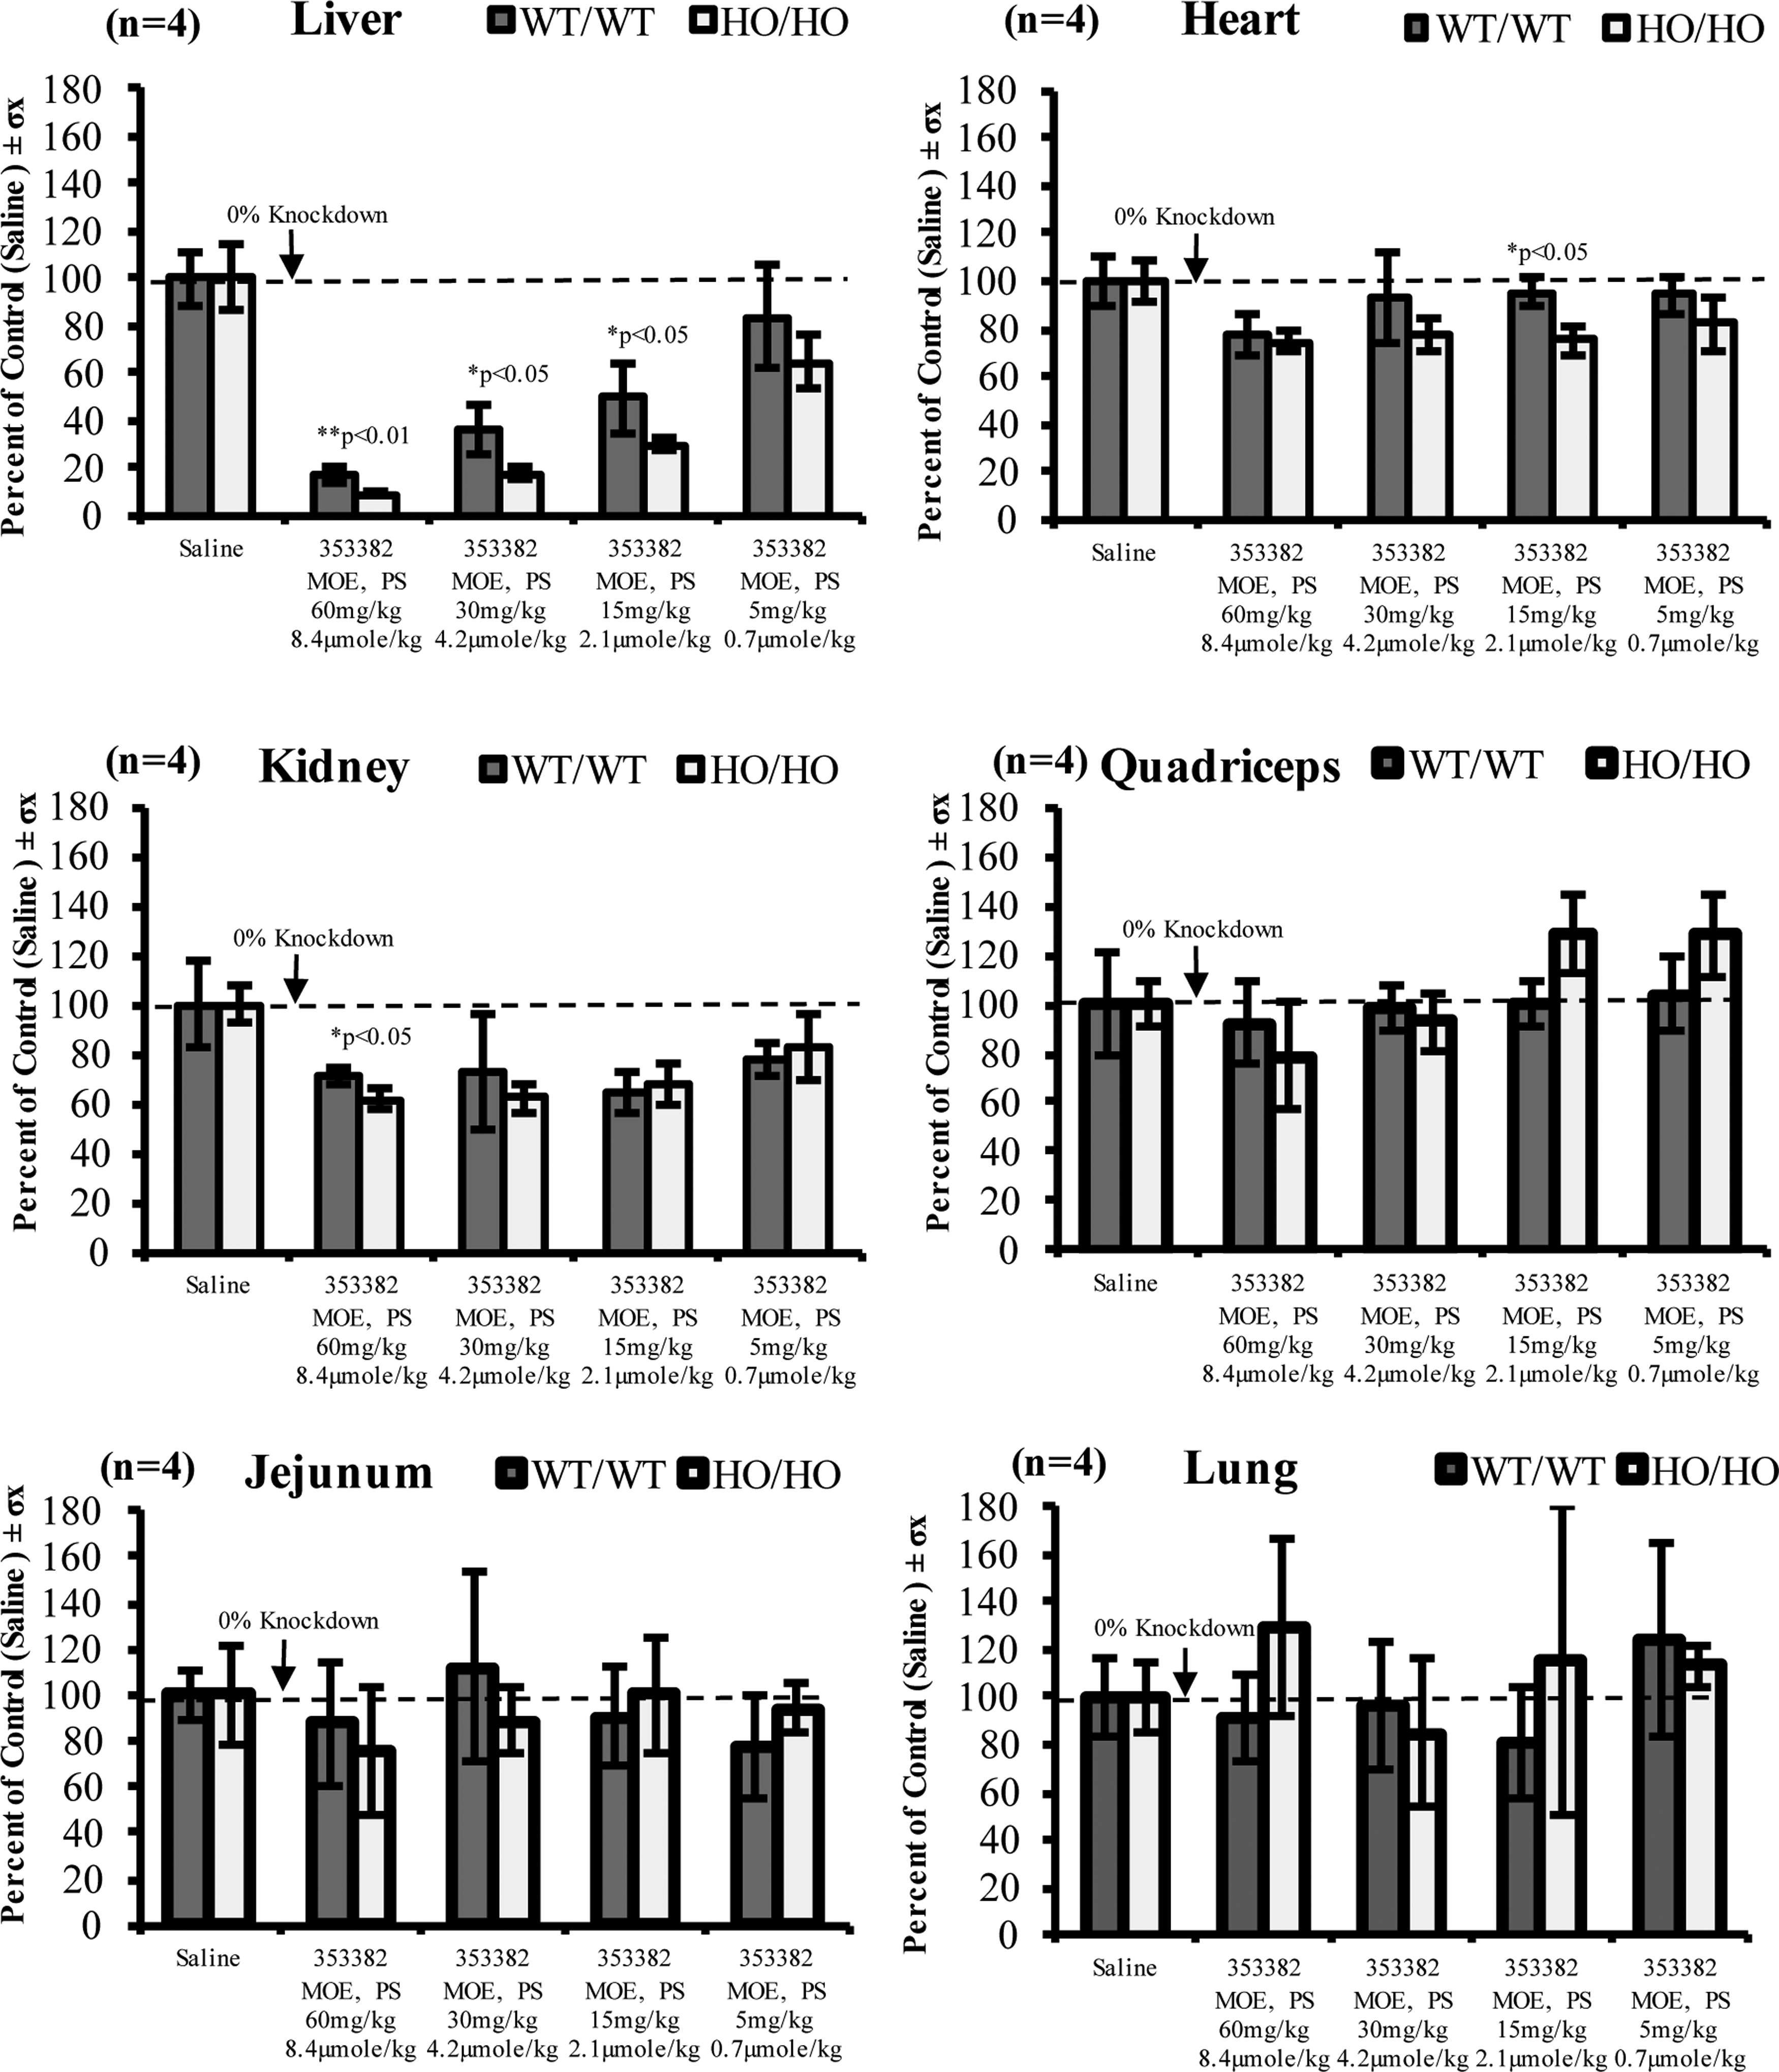
PD effect of ION-353382 in liver, heart, kidney, quadriceps, jejunum, and lung across dose groups comparing SRB1 expression as a percentage of the control (saline dosed) group in both WT/WT and HO/HO mice at 72 h. PD, pharmacodynamic; SRB1, scavenger receptor class B type I.
In addition, at higher ranging dose groups, ION-353382 was more efficacious in 4/4 other minor tissues for HO/HO mice. A more subtle pattern of improved PD for HO/HO mice was evident across all other tissues and at the 15 mg/kg dose in the heart, and 60 mg/kg dose in kidney, HO/HO had statistically significant improved PD differences compared to WT/WT (P < 0.05). Kidney, heart, quadriceps, jejunum, and lung knockdown across dose groups was from 17% to 39%, 5% to 25%, 0% to 22%, 0% to 25%, and 0% to 20%, respectively. Using an inhibitory effect liver exposure response PD model revealed a near 2.0-fold enhanced efficacy (P < 0.05) for HO/HO mice with simulated liver EC50 values equivalent to 5.49 ± 0.95 and 2.85 ± 0.33 (Fig. 3). Model parameters are listed in Table 2.

Inhibitory effect liver exposure response PD model for ION-353382 targeting SRB1. Liver concentration is plotted on the x-axis, while percent inhibition compared to saline control is plotted on the y-axis to obtain simulated and predicted EC50 values for both WT/WT and HO/HO.
Statistically significant, P < 0.05.
γ, hill coefficient; E0, lowest%saline inhibition; EC50, concentration required for 50% saline inhibition.
Immunohistochemistry
IHC was performed to evaluate ASO distribution in the mouse liver of both WT/WT and HO/HO mice. Clear morphology related to the liver is observed, including the presence of nonparenchymal cells, hepatocyte nuclei, cytoplasm contents, and gap junctions. ASOs can be observed as traveling through the cell to cell boundaries through the membrane, and by 72 h, ASO uptake is complete. Nonparenchymal cell ASO uptake was saturated for both WT/WT and HO/HO as revealed by a much darker staining pattern; however, nonparenchymal uptake for HO/HO was not as profound as WT/WT type. The majority of ASO distributed to the cytoplasm in a classical dose-dependent uptake. By qualitative assessment, greater ASO distribution was observed for HO/HO type (Fig. 4).
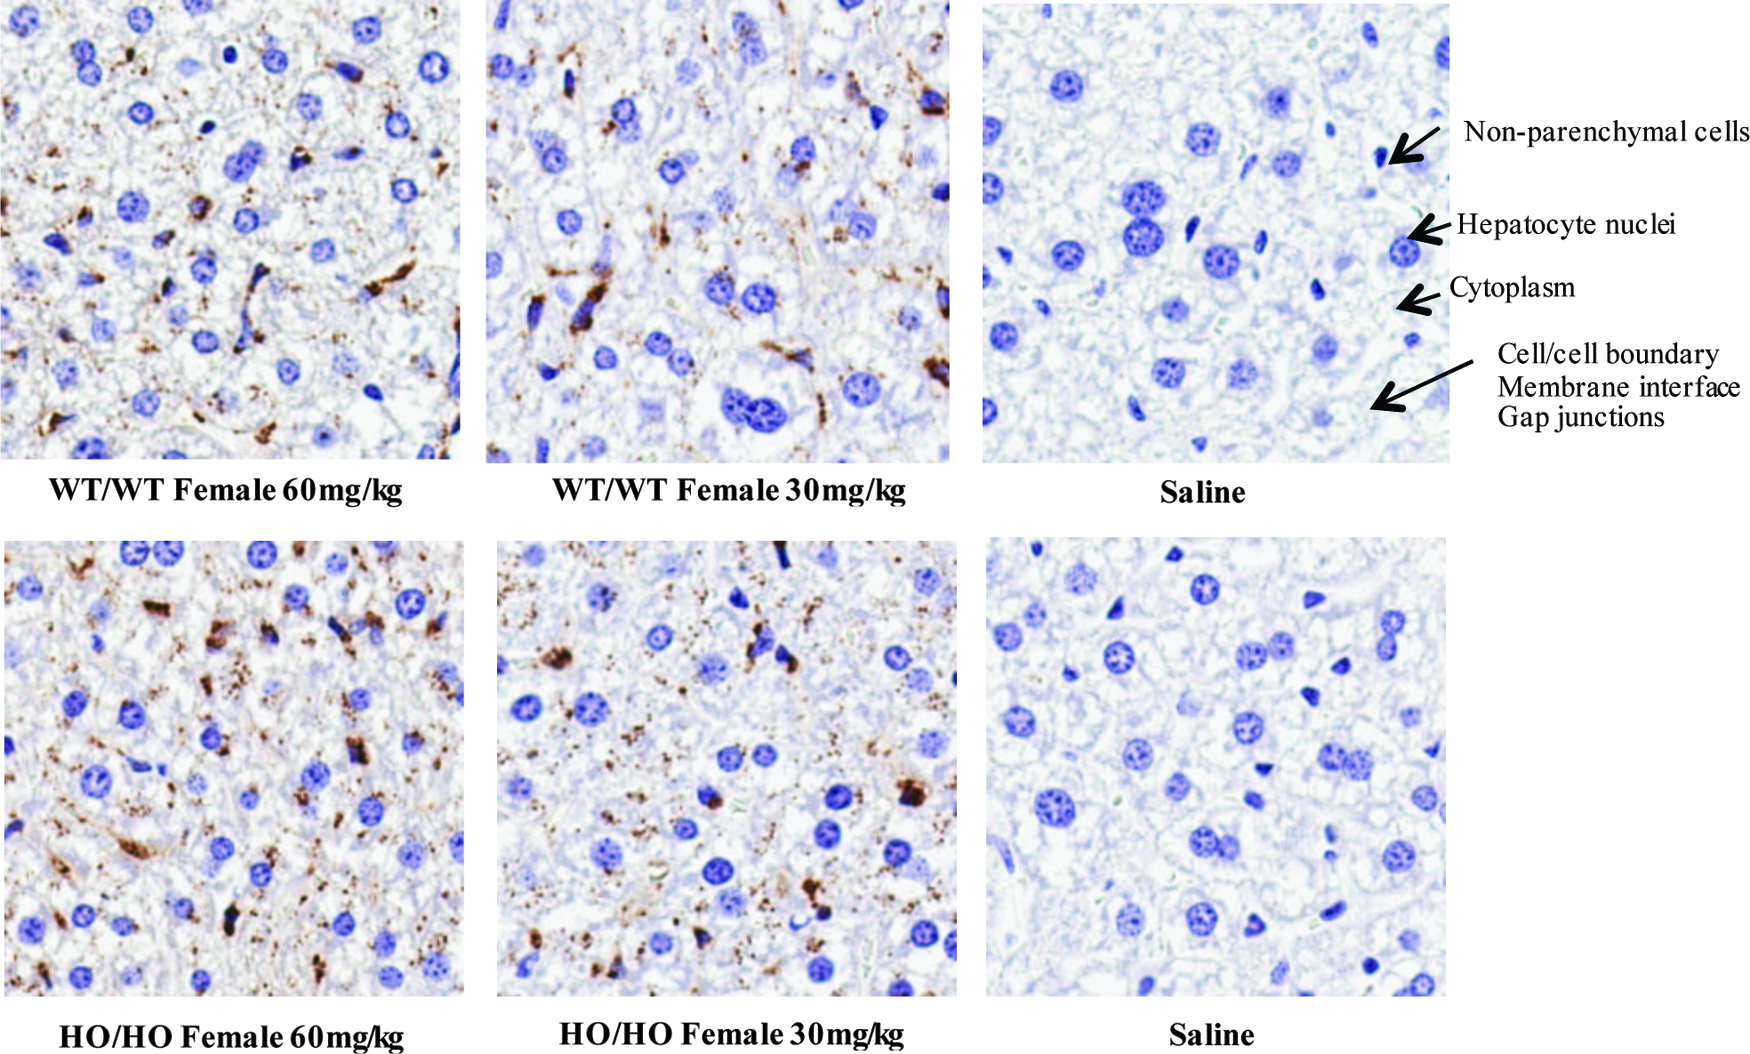
IHC staining of ASO in mouse liver depicting ION-353382 uptake and retention. Mice were injected with both 30 and 60 mg/kg with evaluation at 72 h comparing both WT/WT and HO/HO type. ASO, antisense oligonucleotide; IHC, immunohistochemistry.
Total plasma protein binding and protein binding profiling
Ultrafiltration combined with ECL-ELISA was used to determine the extent of plasma protein binding in vitro using age- and gender-matched samples. The standard curve and QC samples were well within ±20% of nominal values. Recovery was 98.6% ± 0.08% (n = 3) calculated as the ultrafiltrate concentration (ng/mL) divided by the initial total concentration (ng/mL) × 100%, whereby the ultrafiltrate concentration refers to the filtered sample and the initial total concentration refers to the initial total concentration. The extent of in vitro protein binding of ION-353382 in WT/WT and HO/HO plasma from triplicate samples was comparable and highly bound (98.4 ± 0.01, 98.4 ± 0.21) at the 150 μg/mL level, and (98.3 ± 0.09, 98.5 ± 0.14) at 5 μg/mL for WT/WT and HO/HO, respectively (Table 3).
Ultracentrifugation using a 30K molecular weight filter with ECL-ELISA was used. Recovery was determined to be 98.6% ± 0.08% (n = 3).
Plasma protein binding profiling by SEC using Alexa-488-labeled ASO revealed similar and near identical protein binding profiles between WT/WT and HO/HO plasma (Fig. 5). Following incubation of fluorescently labeled ASO in plasma, a clear left shift to a higher molecular weight was observed, as the protein bound complex. The addition of 0.5 μM of nonfluorescently labeled ASO (ION-353382) slightly displaced the complex to different extents with a 4%–8% displacement in WT/WT and HO/HO plasma. Free noncomplexed ASO was determined to be between 7.5% and 15.7% by peak area.
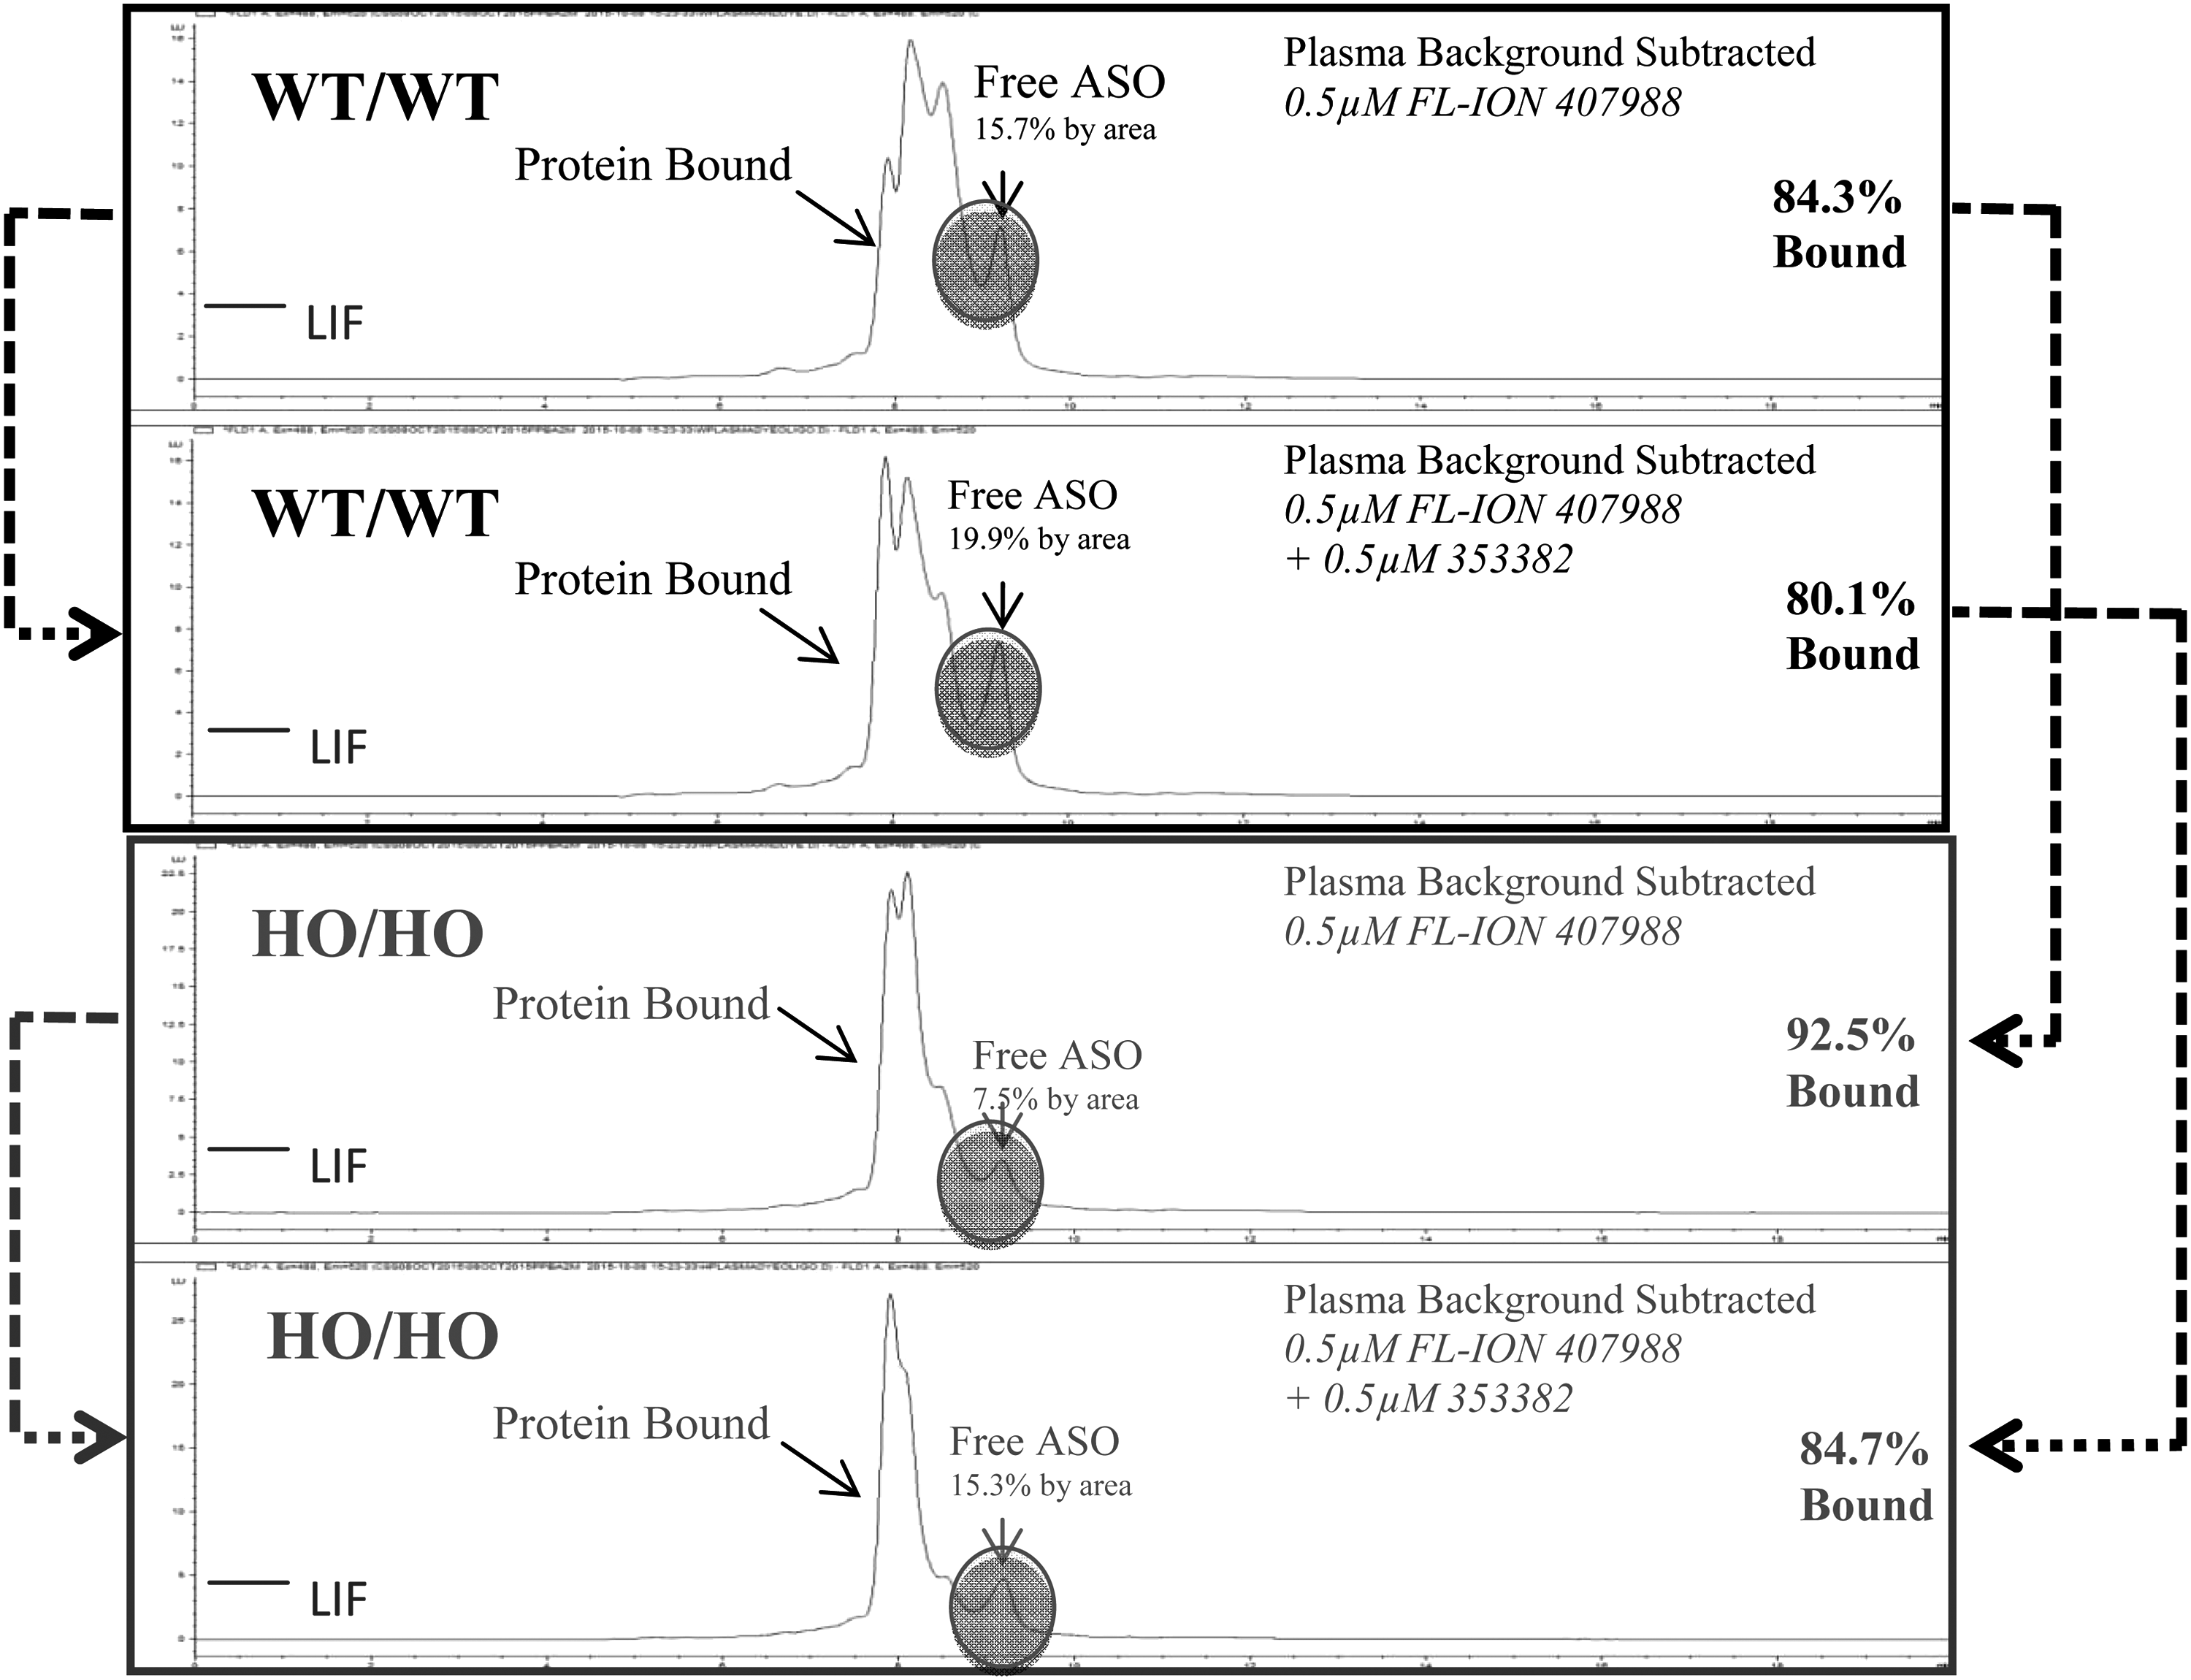
Plasma protein binding profiling using high-pressure liquid chromatography with size exclusion. A 0.5 μm solution of Alexa-488-labeled ASO was incubated with plasma to reveal the degree of binding differences between nontreated WT/WT and HO/HO samples. The addition of 0.5 μm of ION-353382 was used to displace protein-bound ASO.
Total protein, albumin, Ig, and HRG evaluation
Total protein was determined by Bradford Assay while albumin, immunoglobulins (G, M, and A), and HRG were assayed by murine-specific ELISA. Total protein concentration in plasma samples (n = 7 per type) was similar and comparable (54.6 ± 20.7 and 50.4 ± 13.4 mg/mL) between WT/WT and HO/HO mice (Table 4). Total albumin was also comparable (46.5 ± 7.5 and 39.8 ± 9.8 mg/mL) between WT/WT and HO/HO. Total IgG was determined to be 107 ± 8.74 and 116 ± 11.00 μg/mL, total IgM was 21.48 ± 9.49 and 21.74 ± 9.67, total IgA was 12.64 ± 5.27 and 18.24 ± 9.07, and HRG was 19.1 ± 2.2 and 9.39 ± 1.35, each for WT/WT and HO/HO, respectively, at (n = 7) samples per type.
Values are listed as the mean ± standard deviations, CD1 murine plasma was used as a positive control, DKO/WT is the ratio of results obtained from DKO homozygous mice to wild type.
DKO, double knockout; HRG, histidine-rich glycoprotein.
Plasma proteome fingerprinting
By two-dimensional gel electrophoresis, using isoelectric focusing in the first dimension followed by SDS-PAGE in the second dimension, a clear separation of major plasma proteins was observed. Major banding patterns between sample types were observed (Fig. 6). The presence of significant isoforms near a molecular weight range of 150 kDa at a near physiological isoelectric pH was confirmed to be A2M isoforms. Bands representing ID1–3 were A2M related, and ID4 was identified as transferrin precursor. More minor differences between expression levels of much smaller protein and peptides can also be observed as outlined.

Plasma proteome fingerprinting by isoelectric focusing and SDS-PAGE using immunodepleted (albumin and IgG) plasma from saline dosed WT/WT and HO/HO mice. Bands 1–4 were excised and identified by LC-MS characterization based on overall score, including coverage amount, unique peptides, molecular weight, and isoelectric point. SDS-PAGE, sodium dodecyl sulfate–polyacrylamide gel electrophoresis.
Discussion
ASOs offer significant advantages as a modern therapeutic delivery platform and continue to mature for various targets in numerous preclinical and clinical development programs [27]. To be effective, ASOs must be well absorbed, distributed, and ultimately transported into productive compartments to reach the target site of action such as the cytoplasm and nucleus. Yet ASO delivery is challenging in many ways as a significant portion of ASO distributes to the nonproductive compartments and is endocytosed into lysosomes and endosomes, where it is hydrolyzed and metabolized before reaching the intended target.
Clearly defined mechanisms for ASO uptake have persisted as a major challenge, and in vitro systems are often limited in their ability to predict in vivo outcomes often with poor correlation [28–33]. Seemingly major discrepancies exist with unclear outcomes, yet we suspect and confirm hepatocyte surface proteins such as A2M could be involved in major shuttling events related to productive and/or nonproductive uptake [34]. A significant amount of studies have comprehensively described the PKs and biodistribution of ASOs, yet insight into mechanistic differences related to major serum protein knockout models is lacking. Therefore, we sought to evaluate the hypothesis that knocking out A2M may alter the ASO transport process effecting the suborgan distribution leading to variable pharmacology.
Within this work, we did confirm and establish a useful DKO model with a near 1,000-fold difference in A2M plasma protein expression levels. We initiated a successful study to explore the PK/PD differences between wild-type and DKO mice. Comparable plasma Ctroughs between subsets were observed with near dose proportional exposure for wild-type and slightly less than dose proportional uptake for homozygous mice, which could be indicative of uptake differences to other compartments. ASO exposures in liver and kidney were nearly overlapping for each tissue type in both sets of mice, with consistent kidney to liver ratios ranging from ∼2 to 5, with dose proportional liver exposure and less than dose proportional kidney exposure. Clearly a large amount of ASO was distributed to the kidney, whereby transporter saturation at the higher dose range (30 and 60 mg/kg) may explain less than dose proportional uptake.
From our study and from previous work, clearly tissue exposure is the major driving force of ASO pharmacology, yet subcellular tissue exposure into productive compartments could be considered the ultimate influencing factor driving activity. Collectively, these phenomena have led to significant investment and heavy emphasis into synthetic approaches to improve ASO backbone chemistry, which enhance tissue PK and improve PD activity [35]. Currently underway are several ASO development programs, which emphasize receptor-specific mediated delivery. Triantennary N-acetylgalactosamine (GalNAc3)-ASO conjugates have been used to specifically target the asialoglycoprotein receptor (ASGPR), which is highly expressed on hepatocytes [36], offering a very effective uptake mechanism leading to substantially enhanced clinical efficacies.
We looked at the effect of A2M knockout on the pharmacological response in vivo, and based on our findings, we suspect the presence of A2M contributes to increased shuttling of ASOs toward a more rapid endocytotic clearance pathway. By SRB1 expression levels, a significantly enhanced efficacy was observed for homozygous mice, with near twofold enhanced activities corresponding to EC50 values in the liver of roughly 2.8 and 5.5 μg/g for homozygous and wild-type mice, respectively. Moreover, exploring deeper into other tissues, the effect on SRB1 expression between other tissue types was less profound, yet a similar pattern is observed. Since SRB1 expression is greatest in the liver, it was not to our surprise that knockdown was not as great in other tissues by single dose at the dose levels used.
As ASOs bind to plasma proteins tightly (>90%), knocking out A2M could directly facilitate subcellular uptake by reducing the complex formation offering altered uptake and internalization processes. These binding differences could offer more selective uptake and A2M recognition causing internalization and endocytosis with delivery to endosomes and lysosomes eliminating ASO before reaching their desired target. Because of this possibility, we sought to place a significant emphasis into evaluating total plasma protein binding, yet great ASO binding (∼98%) for both subsets was observed.
We also explored any protein binding profile differences using a fluorescently labeled ASO to study ASO-protein binding in plasma, yet no significant protein binding profiling differences were observed. As confirmed by this study, the tight binding of protein to ASOs suggests and emphasizes the role of protein–protein binding and shuttling events on the hepatocyte surface (such as the A2M receptor), which could seemingly facilitate and/or route ASO uptake. To this effect, these binding mechanisms and ASO uptake are a saturable process, which may contribute to nonlinear PK exposure in tissues. Ultimately, hepatic uptake of ASOs has competing mechanisms, which give rise to diverse intracellular trafficking into multiple suborgan compartments [32].
Seemingly large polyanionic ASOs such as ION-353382 (7,164 kDa) may not freely diffuse across the lipid bilayer of hepatocytes, but require protein-binding interactions on the cell surface for uptake. Since A2M is a lower capacity protein making up only a small part of the complex serum proteome, between 2% and 10% of total protein content, knocking out this protein may not significantly alter total protein binding, but may influence A2M receptor recognition and clearance. Following ASO uptake, early sorting endosomes, late endosomes, and multivesicular bodies, lysosomes, golgi complex, and the endoplasmic reticulum contribute to the complex trafficking of ASOs [37]. We propose that altering the cell uptake and dynamic trafficking mechanisms by the absence of A2M receptor can influence the endocytosis and consequential downstream trafficking events evident in our pharmacological findings. Major plasma protein compositions apart from A2M were seemingly comparable between DKO and wild-type subsets, and proteome fingerprinting confirmed the major expression differences related to A2M isoform expression.
Histological examination in the liver from other murine studies using similar ASOs reveals that 6 h after subcutaneous administration most ASOs are on the cell–cell boundaries traversing through the membrane, and by 24-h, the majority of uptake is complete. Nonparenchymal cells as a much more compact space are saturated with ASOs while the majority of ASOs distribute into the cytoplasm, as a much bulkier space capable of holding more cargo. Based on our histological findings, a qualitative difference in subhepatic distribution may be seemingly related to A2M knockout and could be associated to suborgan uptake saturation processes. It was evident that the kupffer cells were rapidly saturated for both the wild-type and homozygous subsets, yet qualitative differences in the distribution and accumulation of ASOs were observed. We suspect it is possible that the greater nonparenchymal kupffer cell accumulation for wild-type mice could accelerate the clearance of ASOs before reaching productive compartments, while in contrast a greater distribution into the cytoplasm for the homozygous subset is closer to target.
Shuttling more ASO toward nonproductive compartments causes poor intracellular trafficking, and the ability of the ASO to reach its intended target is hindered. Ultimately, higher resolution studies such as matrix-assisted laser desorption ionization imaging and select microscopic techniques are required to deduce more critical details into suborgan/cellular distribution. Additional investigations with other ASO chemistries, including modern targeted conjugates, may be useful to elucidate models to further predict the role of A2M in the PK/PD of various ASOs. Structure activity relationships may be explored to reduce A2M binding to more effectively bypass nonproductive uptake pathways and increase potency of ASOs. Targeted delivery approaches have been used to reduce nonproductive uptake pathways for ASOs while enhancing receptor-specific mediated uptake. This effect may reduce A2M-ASO interactions and restrict shuttling of ASO into productive uptake pathways.
For hepatocyte-targeted delivery of ASOs using GalNAc3 conjugation strategies, ASOs have demonstrated stronger binding to ASGPR as a greater affinity receptor compared to A2M. We compare this as a competition for ASOs regarding binding to A2M and ASGPR present within hepatocytes. Based on internal data, we have explored a separate set of experiments using GalNAc3-conjugated ASOs to investigate pharmacological differences related to the A2M wild-type and DKO studies with unconjugated ASOs. For the vast majority of treatment groups, (4 out of 5 subsets), pharmacological differences between wild-type and DKO mice were not statistically significant. This observation suggests that GalNAc3-conjugated ASOs have reduced affinity to A2M as involved in mediating ASOs to the endocytotic pathways. GalNAc3-conjugated ASOs have a competition at the site of uptake within hepatocytes, whereby more ASOs are shuttled to productive uptake pathways, by ASGPR-mediated delivery for both groups. Hence, modern targeted conjugation strategies reduce the effect of A2M binding and shuttling involvement on ASOs. Based on this combined knowledge, it may be better possible to enhance the design of ASOs to reduce A2M binding effects, reducing A2M receptor binding, and offer greater promise in improving suborgan PKs and overall potency.
Conclusions
It was observed that the absence of A2M facilitates productive ASO uptake in vivo as demonstrated in our PK/PD findings. All DKO mice were viable, healthy, phenotypically normal, and capable of breeding. Our experiments established and confirmed several in vitro and in vivo findings regarding the relationship between A2M and ASO uptake. In addition, it was shown that both wild-type and homozygous mice exhibited no significant PK differences following single-dose ASO administration, yet the homozygous subtype exhibited twofold enhanced pharmacological activity in the liver. IHC staining in mouse liver revealed less profound nonparenchymal kupffer cell uptake for homozygous mice with minor qualitative differences in ASO distribution. No major protein binding differences between groups were observed. Two-dimensional gel electrophoresis revealed banding differences with differing protein expression levels related to A2M isoforms.
Our investigations depict A2M as an important plasma protein involved in ASO transport, which influences subcellular uptake and distribution of ASOs. Taken together, the results of this work provide valuable insight and reveal the applicability of this model to screen other ASOs with alternate chemistries for evaluating mechanistic differences in uptake, and for design of ASOs with reduced binding to A2M.
Footnotes
Acknowledgments
The authors kindly thank Ethan Weiss of the University of California San Francisco for providing the double-knockout mice and for project support; Ezio Petrella, Alex Perieteanu, and Colin Barry of SGS Pharmaceuticals for their assistance with immunoassays and protein characterizations; Andrea Benoit and Rajeev Dhawan of Charles River Laboratories for breeding and colony confirmations; Xiaokun Xiao and Gene Hung of Ionis Pharmaceuticals for their support with histology assessments; Robert Saunders of Ionis Pharmaceuticals for his administrative assistance. They would like to acknowledge and thank Donna Sipe and the vivarium staff for animal husbandry. They would also like to thank Tracy Reigle of Ionis Pharmaceuticals for her kind support and help with graphics and formatting.
Author Disclosure Statement
All authors are employees of Ionis Pharmaceuticals, Carlsbad, California.