
Abstract
Efficient short interfering RNA (siRNA)-mediated gene silencing requires selection of a sequence that is complementary to the intended target and possesses sequence and structural features that encourage favorable functional interactions with the RNA interference (RNAi) pathway proteins. In this study, we investigated how terminal sequence and structural characteristics of siRNAs contribute to siRNA strand loading and silencing activity and how these characteristics ultimately result in a functionally asymmetric duplex in cultured HeLa cells. Our results reiterate that the most important characteristic in determining siRNA activity is the 5′ terminal nucleotide identity. Our findings further suggest that siRNA loading is controlled principally by the hybridization stability of the 5′ terminus (Nucleotides: 1–2) of each siRNA strand, independent of the opposing terminus. Postloading, RNA-induced silencing complex (RISC)–specific activity was found to be improved by lower hybridization stability in the 5′ terminus (Nucleotides: 3–4) of the loaded siRNA strand and greater hybridization stability toward the 3′ terminus (Nucleotides: 17–18). Concomitantly, specific recognition of the 5′ terminal nucleotide sequence by human Argonaute 2 (Ago2) improves RISC half-life. These findings indicate that careful selection of siRNA sequences can maximize both the loading and the specific activity of the intended guide strand.
Introduction
T
RNAi is initiated when the pathway proteins recognize RNA duplexes with the characteristic siRNA structure, ∼19 internal base pairs and 2 nt 3′ overhangs [6,8]. Either strand from the duplex can be processed and loaded into Ago2 to form the mature RNA-induced silencing complex (RISC) [9]. The quantity of intended RISC formed and its activity determine the efficacy of a siRNA in silencing its target. While generally only one siRNA strand (the guide strand) can target a specific mRNA, in systems where targets exist for both siRNA strands, both strands can silence [3,10]. Even in the absence of a specific target, loading and function of the unintended strand (the passenger strand) can result in significant nonspecific off-target effects [11,12]. Thus, to achieve maximal activity and specificity of silencing, it is essential to design siRNAs for loading and activity of only the intended guide strand. To do so requires an understanding of how to control (1) selection and loading of the guide strand and (2) the half-life and activity of RISC. Concomitantly, these same design rules should be applied to minimizing the loading and activity of the passenger strand, thereby achieving maximal functional asymmetry, which we define as the ratio of the silencing activities of the siRNA strands.
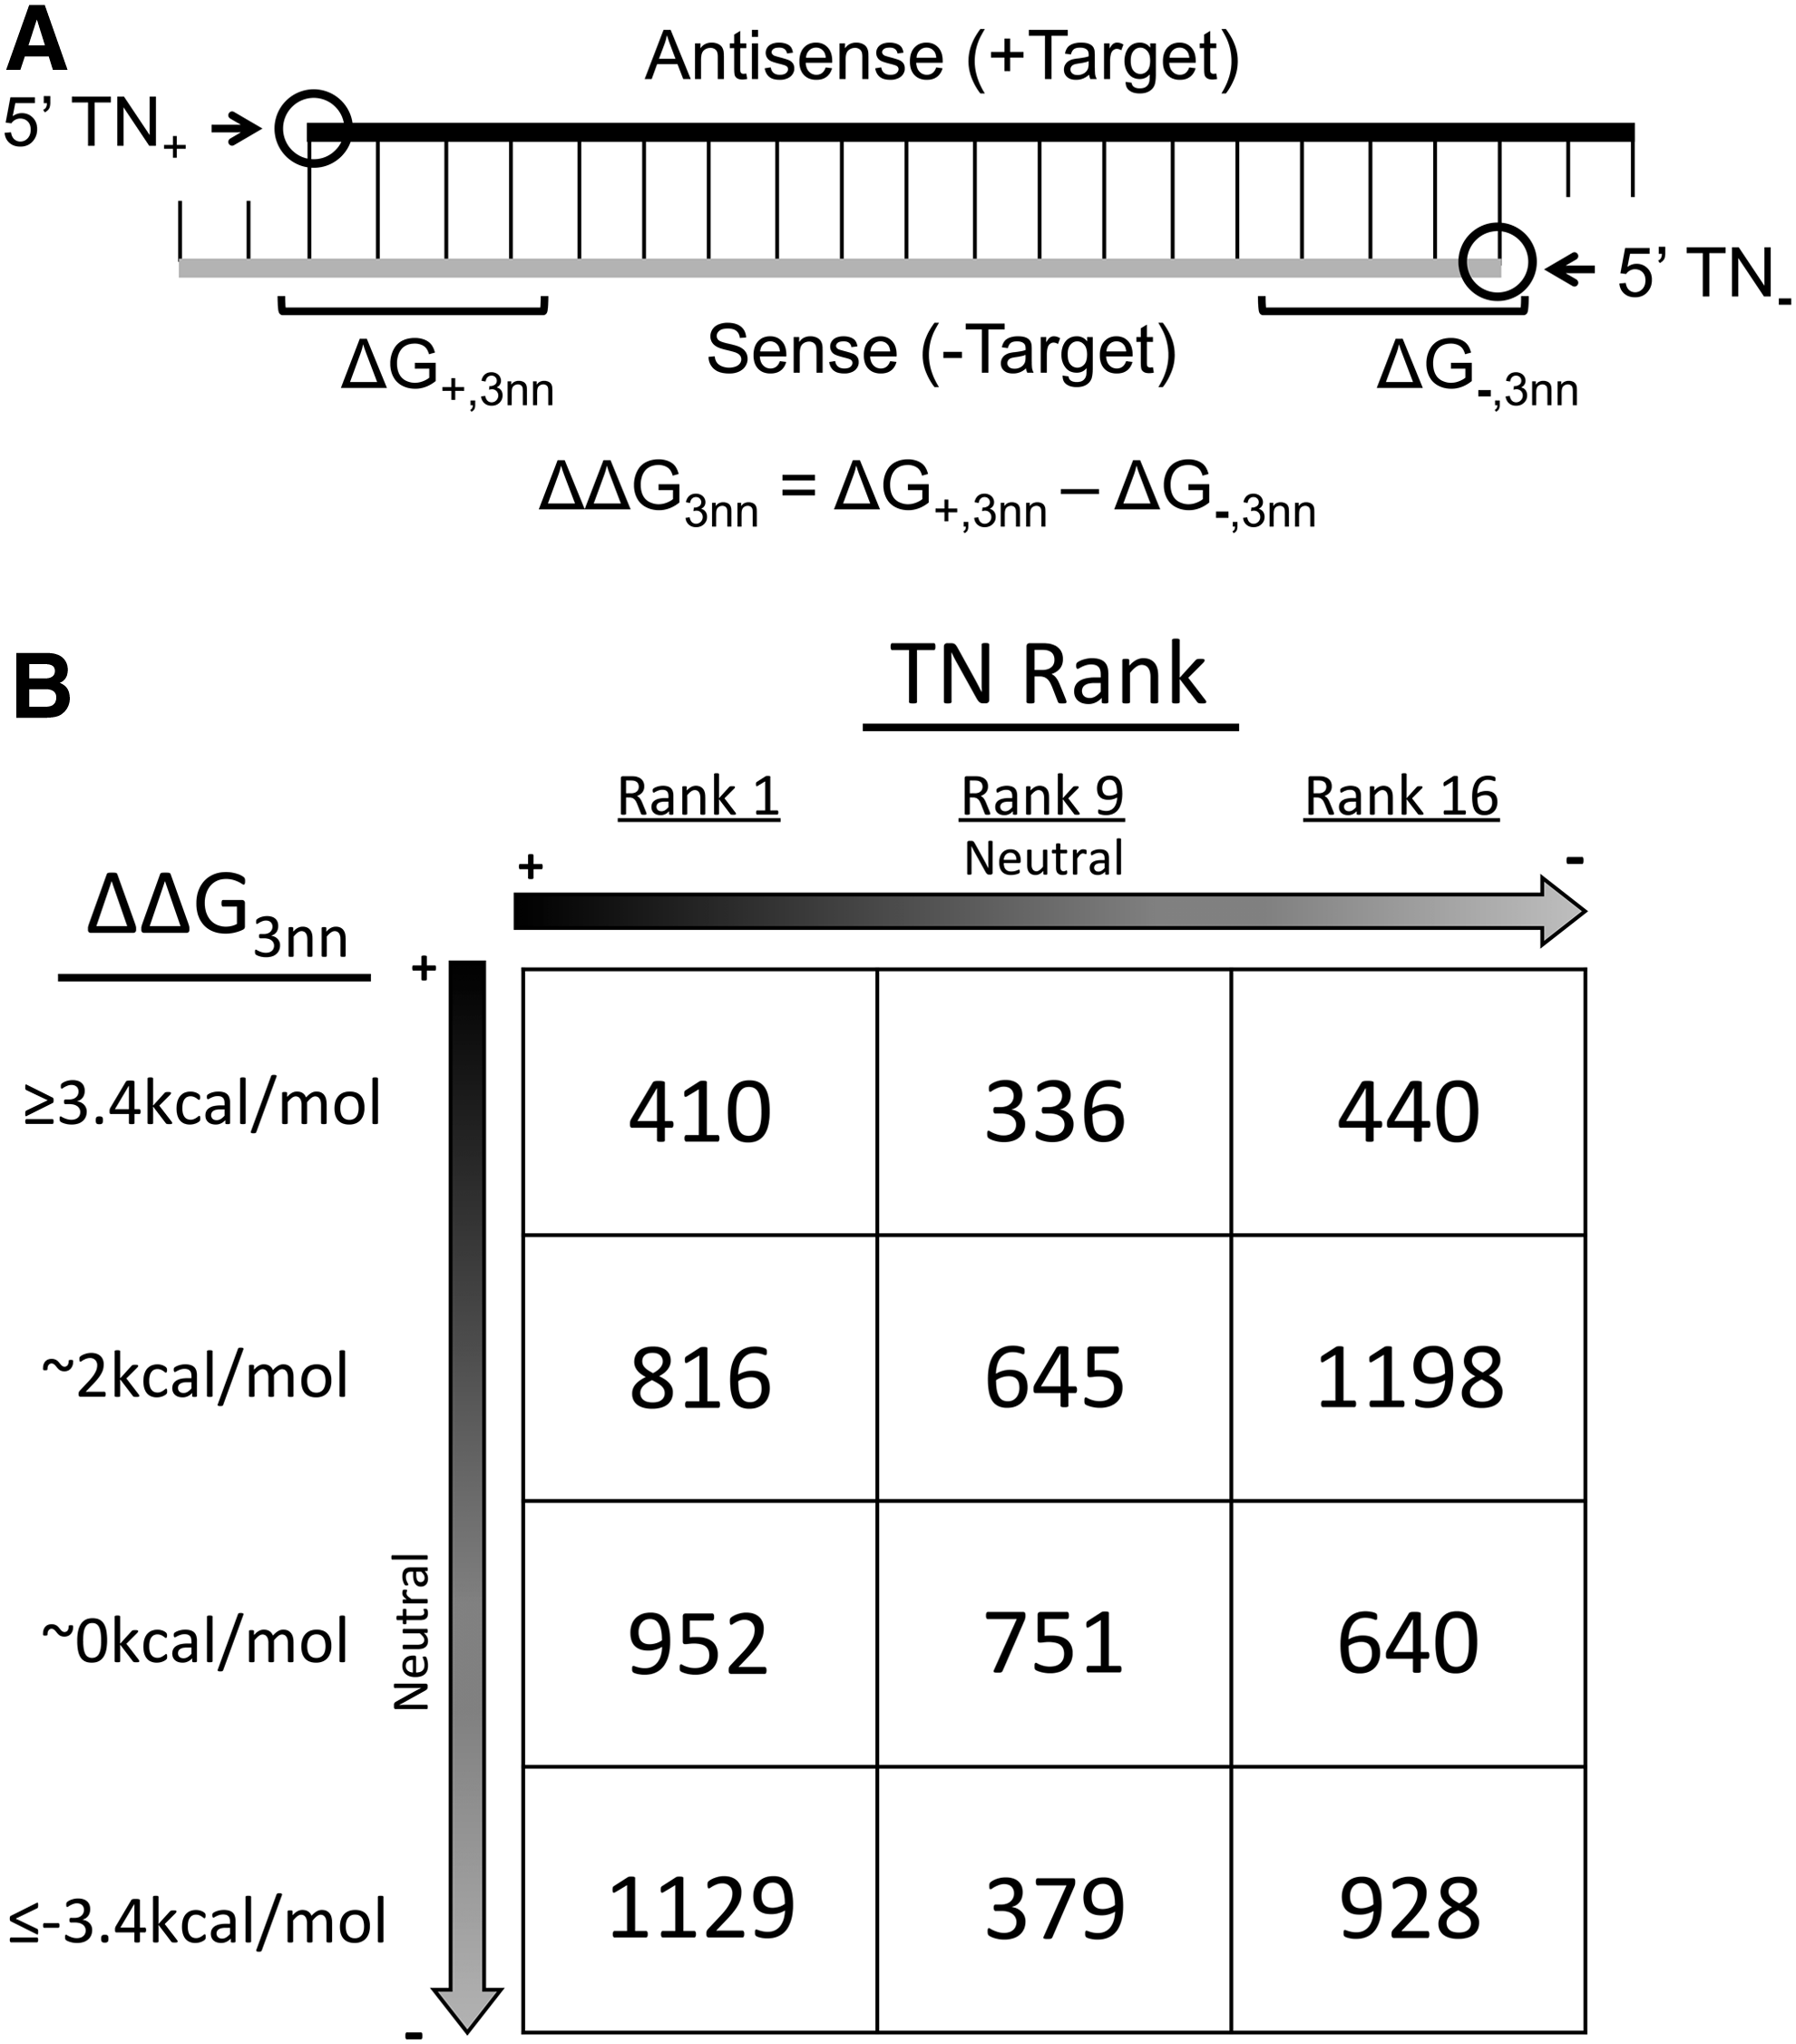
The concept of asymmetry has been essential to designing siRNAs since their initial structure (double-stranded) and their functional form (single-stranded) were determined [13]. Factors that differentiate between the two siRNA strands have been investigated, with the objective of determining how the RNAi pathway proteins identify the guide and passenger strand of each siRNA. The first feature discovered for predicting siRNA asymmetry was relative terminal hybridization stability (ΔΔG) (Fig. 1A) [13], which captures the relative stability of the duplex structures at the siRNA termini. ΔΔG was shown to predict the functional asymmetry of siRNAs [13,14] and their directional binding by proteins of the RNAi pathway [15,16]. In our prior work, we classified siRNA asymmetries according to the 5′ terminal nucleotide (TN) on each strand (TN Rank) (Fig. 1A and Table 1) [17–19], showing this feature to be more predictive of siRNA activity than ΔΔG.
Characteristics of PKR-targeting siRNAs.
5′

Arrow denotes TN Ranks predicted to favor greater antisense (+) strand activity (black) or favor greater sense (−) strand activity (gray). TN, terminal nucleotide.
However, using activity as the readout minimizes the degree to which identified features can be linked to specific steps in the RNAi mechanism. Our goals in the present study were to understand whether TN Rank and ΔΔG predict siRNA strand selection in addition to activity and to quantify the degree to which strand selection determines the final activity of a siRNA strand. Our results showed that both TN Rank and ΔΔG predict asymmetric strand loading, although less accurately than predicting siRNA functional asymmetry. While the influence of TN on strand activity is principally postloading, presumably through interactions between the guide strand and Ago2, hybridization stability, particularly at the 5′ terminus, influences both strand selection and post-loading events (e.g., interactions with the mRNA target). The findings presented in this study increase our understanding of siRNA structure–function relationships and can be useful in the selection of active and specific siRNAs.
Materials and Methods
Cell culture and transfection
HeLa cells were maintained in DMEM High Glucose (cat# 11965-092; Life Technologies) supplemented with 10% FBS (cat# 16000-044; Life Technologies) and 1% Pen-Strep (cat# 15240062; Life Technologies) and incubated at 37°C and 5% CO2 in a humidified incubator. Before transfection, cells were plated at 15,000 cells/well in 96-well plates or 350,000 cells/well in 6-well plates in media without Pen-Strep for 24 h. Forward transfections were performed with Lipofectamine 2000 (cat# 11668019; Life Technologies) at a final concentration of 2.33 μg/mL, based on final well volume. Lipoplexes were prepared as per the manufacturer's instructions in Opti-MEM (cat# 31985-070; Life Technologies); siRNA and plasmid concentrations are specified for each experiment.
Nucleic acids
Protein Kinase R (PKR)-targeting siRNAs were ordered from Dharmacon as duplexes, designed with a 19-bp antisense strand targeting the PKR gene and 3′ uridine dinucleotide overhangs. siRNA sequences are listed in Supplementary Table S1; Supplementary materials are available online at www.liebertpub.com/nat. siRNA nearest-neighbor energy parameters were obtained from the DINAMelt Web Server [20,21] and used to calculate relative terminal hybridization stabilities (Fig. 1A and Supplementary Table S1). All DNA primers for this study were ordered from Integrated DNA Technologies.
For the luciferase experiments, the PKR gene was PCR amplified from pET28a-PKR [22] (kindly provided by Dr. Philip C. Bevilacqua) and subcloned into the psiCHECK2-AS34a vector [23] (Addgene No. 37099) in the forward (psiCHECK2-PKR+) or reverse (psiCHECK2-PKR−) direction using Clontech In-Fusion cloning (Supplementary Fig. S1). Plasmids were verified by Sanger sequencing. Primers used for cloning and sequencing are listed in Supplementary Table S2.
Primers for stem-loop reverse transcription quantitative polymerase chain reaction (RT-qPCR) were designed and prepared according to published specifications [24], with a constant hairpin region and a 6 nt overlap with the amplification target. All sequences used are listed in Supplementary Table S3. qPCR was performed with a sequence-specific forward primer and a universal reverse primer. All primers were verified by spiking in known quantities of siRNA and verifying amplification efficiency. Standard curves were generated for each siRNA sequence to account for variation in the amplification efficiency of each siRNA-specific primer set.
Dual-Luciferase assay
HeLa cells were seeded in a 96-well plate at 15,000 cells/well in 100 μL of media 24 h before transfection. After 24 h, the media was changed, and both the PKR and nontargeting siRNAs were diluted in Opti-MEM and cotransfected with 40 ng/well of either the (+) or (−) psiCHECK2-AS34a plasmid, using 0.35 μL/well of Lipofectamine 2000 for a total transfection volume of 50 μL. Serial dilutions of PKR siRNAs ranging from 3.2 to 10,000 pM were transfected in duplicate, and transfections were performed twice for each siRNA. The PKR siRNA was diluted in a nontargeting siRNA to maintain total siRNA concentration at 10,000 pM per well. 24 h post-transfection, the media was aspirated, replaced with 79 μL of Dulbecco's PBS (cat# 14040133; Invitrogen), and lysed using 79 μL of Dual-Glo Luciferase Reagent (cat# E2940; Promega). After incubating at room temperature for 15 min on a rocker, 150 μL of the solution was transferred to a solid white 96-well plate, and firefly activity was measured using a Synergy H4 microplate reader (Biotek). Seventy five microliters of Dual-Glo Stop & Glo Reagent (cat# E2940; Promega) was added, and after a 10 min incubation period, Renilla activity was measured. Relative siRNA activity was determined by subtracting background, dividing Renilla signal by the firefly luciferase signal within a well, and then normalizing the ratio to the ratio from a well treated with a nontargeting siRNA. Values of 0 and 1 indicate complete silencing and no silencing, respectively. IC50 values were determined by fitting data to the following equation,
using least-square regression, where X is the concentration of targeting siRNA and Y is the relative siRNA activity.
Stem-loop RT-qPCR
HeLa cells were plated in a 6-well plate and transfected after 24 h with 10 nM PKR siRNA and 10 nM of a nontargeting siRNA (internal standard). siRNA-Ago2 coimmunoprecipitation was similar to the procedure described [25], with several exceptions. Immunoprecipitations were scaled down to 400 μg of cell lysate; cell lysate protein concentrations were determined using Bradford assay (cat# 5000201; Bio-Rad) with a BSA standard. Immunoprecipitation of Ago2 was performed with 3.375 μg of Ago2 Antibody (Clone 11A9 cat# SAB4200085-200UL; Sigma-Aldrich) prebound to 25 μL of Protein G magnetic beads (cat# S1430S; NEB). Proteinase K Digestion Buffer was also supplemented with ∼400 μg/mL tRNA (cat# 10109541001; Roche), to act as a carrier, and Ago2-bound RNAs purified using Direct-zol RNA Purification Kit according to the manufacturer's protocol (cat# R2051; Zymo Research).
The protocol for RT-qPCR quantification was developed based on published methods [24,26,27]. Stem-loop primers were folded by heating to 95°C for 10 min, ramping to 75°C over 10 min, then holding at 75°C, 68°C, 65°C, 62°C, and 60°C for 30 min each, before ramping to 4°C over 2 h. RNA samples were heated to 65°C for 5 min and snap cooled on ice for 5 min immediately before reverse transcription. Pulsed reverse transcription reactions were assembled with 1× First-Strand Buffer, 10 mM DTT, 0.25 mM dNTP mix, 20 U Superscript III (cat# 18080044; Life Technologies), 0.2 U of SUPERaseIn (cat# AM2696; Ambion), and 1 nM stem-loop primer in 20 μL with 1 μL of purified RNA and cycled as follows: 16°C for 30 min followed by 60 cycles of 30°C for 30 s, 42°C for 30 s, and 50°C for 1 s, and reverse transcriptase was then heat inactivated at 85°C for 5 min. qPCRs were assembled with 300 nM of a siRNA-specific forward primer, 300 nM universal reverse primer, 1× IQ SYBR Green Supermix (cat# 170882; Bio-Rad), and 1.8 μL of cDNA in a 25 μL reaction. qPCR cycling was performed as follows: 95°C for 10 min followed by 40 cycles of 95°C for 10 s and 60°C for 10 s on a MyiQ Thermocycler (Bio-Rad). (+) siRNA strand, (−) siRNA strand, and internal standard siRNA strand were reverse transcribed and quantified separately (Supplementary Table S4). Amplification specificity was verified by performing stem-loop RT-qPCR on samples that were transfected with a siRNA that was not complementary to the stem-loop primers. Control PCRs were performed on all samples following reverse transcription in the absence of reverse transcriptase. No amplification that interfered with quantification was observed in any PCR control.
Statistical methods
Linear regression analysis was performed in python with the pandas and statsmodels packages, using an ordinary least square regression. Briefly, 1- and 2- factor models were built with either siRNA IC50 values or siRNA loading into Ago2 as the response variable and correlated with TN Rank and ΔΔG3nn (double-stranded analyses) or with TN and ΔG (single-stranded analyses). P values for 1-factor model were used to test if the slope was nonzero. 2-factor models were built using either (1) TN Rank with ΔΔG3nn or (2) TN and ΔG at each position along the duplex using P values to test if the slope of the ΔΔG3nn or ΔG parameter was nonzero. A Bonferroni correction was applied to P values to correct for multiple comparisons. All other statistical analyses were performed using GraphPad Prism 6, with the exception of ΔAICc, which was calculated using RStudio with the AICcmodavg package. ΔAICc and Akaike weights were used to compare linear regression models. Akaike weights provide relative probabilities that one model better fits the data. ΔAICc and Akaike weights contain a correction for models with different numbers of variables, allowing direct comparison among models. When an additional variable is added to a model and the Akaike weight favors the new model, the variable is providing new explanatory information.
Results
TN Rank and ΔΔG3nn influence siRNA functional asymmetry in cultured HeLa cells
Our previous work described the importance of TN Rank (Table 1) and ΔΔG3nn (Fig. 1A) in predicting siRNA activity [18]. The set of siRNAs chosen to investigate TN Rank and ΔΔG3nn was selected to possess favorable, neutral, and unfavorable rankings of the two features, with favorable referring to a characteristic that would be associated with higher silencing of the siRNA against its target mRNA, in this case PKR (Fig. 1B) [18]. In this study, we wished to determine if these parameters could also predict siRNA functional asymmetry, as the most highly active and specific siRNAs will have functional asymmetries highly biased in favor of the intended guide strand.
We initially measured the activity of each siRNA strand using a luciferase reporter assay where the full-length coding sequence of PKR [hereafter the (+) target, targeted by the (+) strand of each siRNA] or the full-length complement sequence of PKR [hereafter the (−) target, targeted by the (−) strand of each siRNA] was cloned as a fusion product downstream of the Renilla luciferase gene (Supplementary Fig. S1). siRNA strand IC50 values were determined by cotransfecting HeLa cells with one of the plasmids and one of the PKR-targeting siRNAs. Functional asymmetry was calculated as the ratio of IC50 values for each pair of complementary strands (Fig. 2A). Two siRNA strands, PKR816(−) and PKR928(+), did not display any measurable activity (Supplementary Fig. S2); for these siRNAs, functional asymmetry was estimated assuming an IC50 of 10 nM, the highest concentration tested, for the inactive strand. Examining our results for both TN Rank and ΔΔG3nn, we find that, as we found with predicting strand activity, TN Rank is a stronger predictor of functional asymmetry than ΔΔG3nn (Fig. 2B, C), with the information provided by ΔΔG3nn improving the correlation, but being insufficient to provide a significant correlation alone (Fig. 2C, D). The importance of the ΔΔG3nn is most evident for sequences with intermediate TN Rank, where positive ΔΔG3nn sequences favor (+) strand activities, while negative ΔΔG3nn sequences favor (−) strand activities (Fig. 2A).
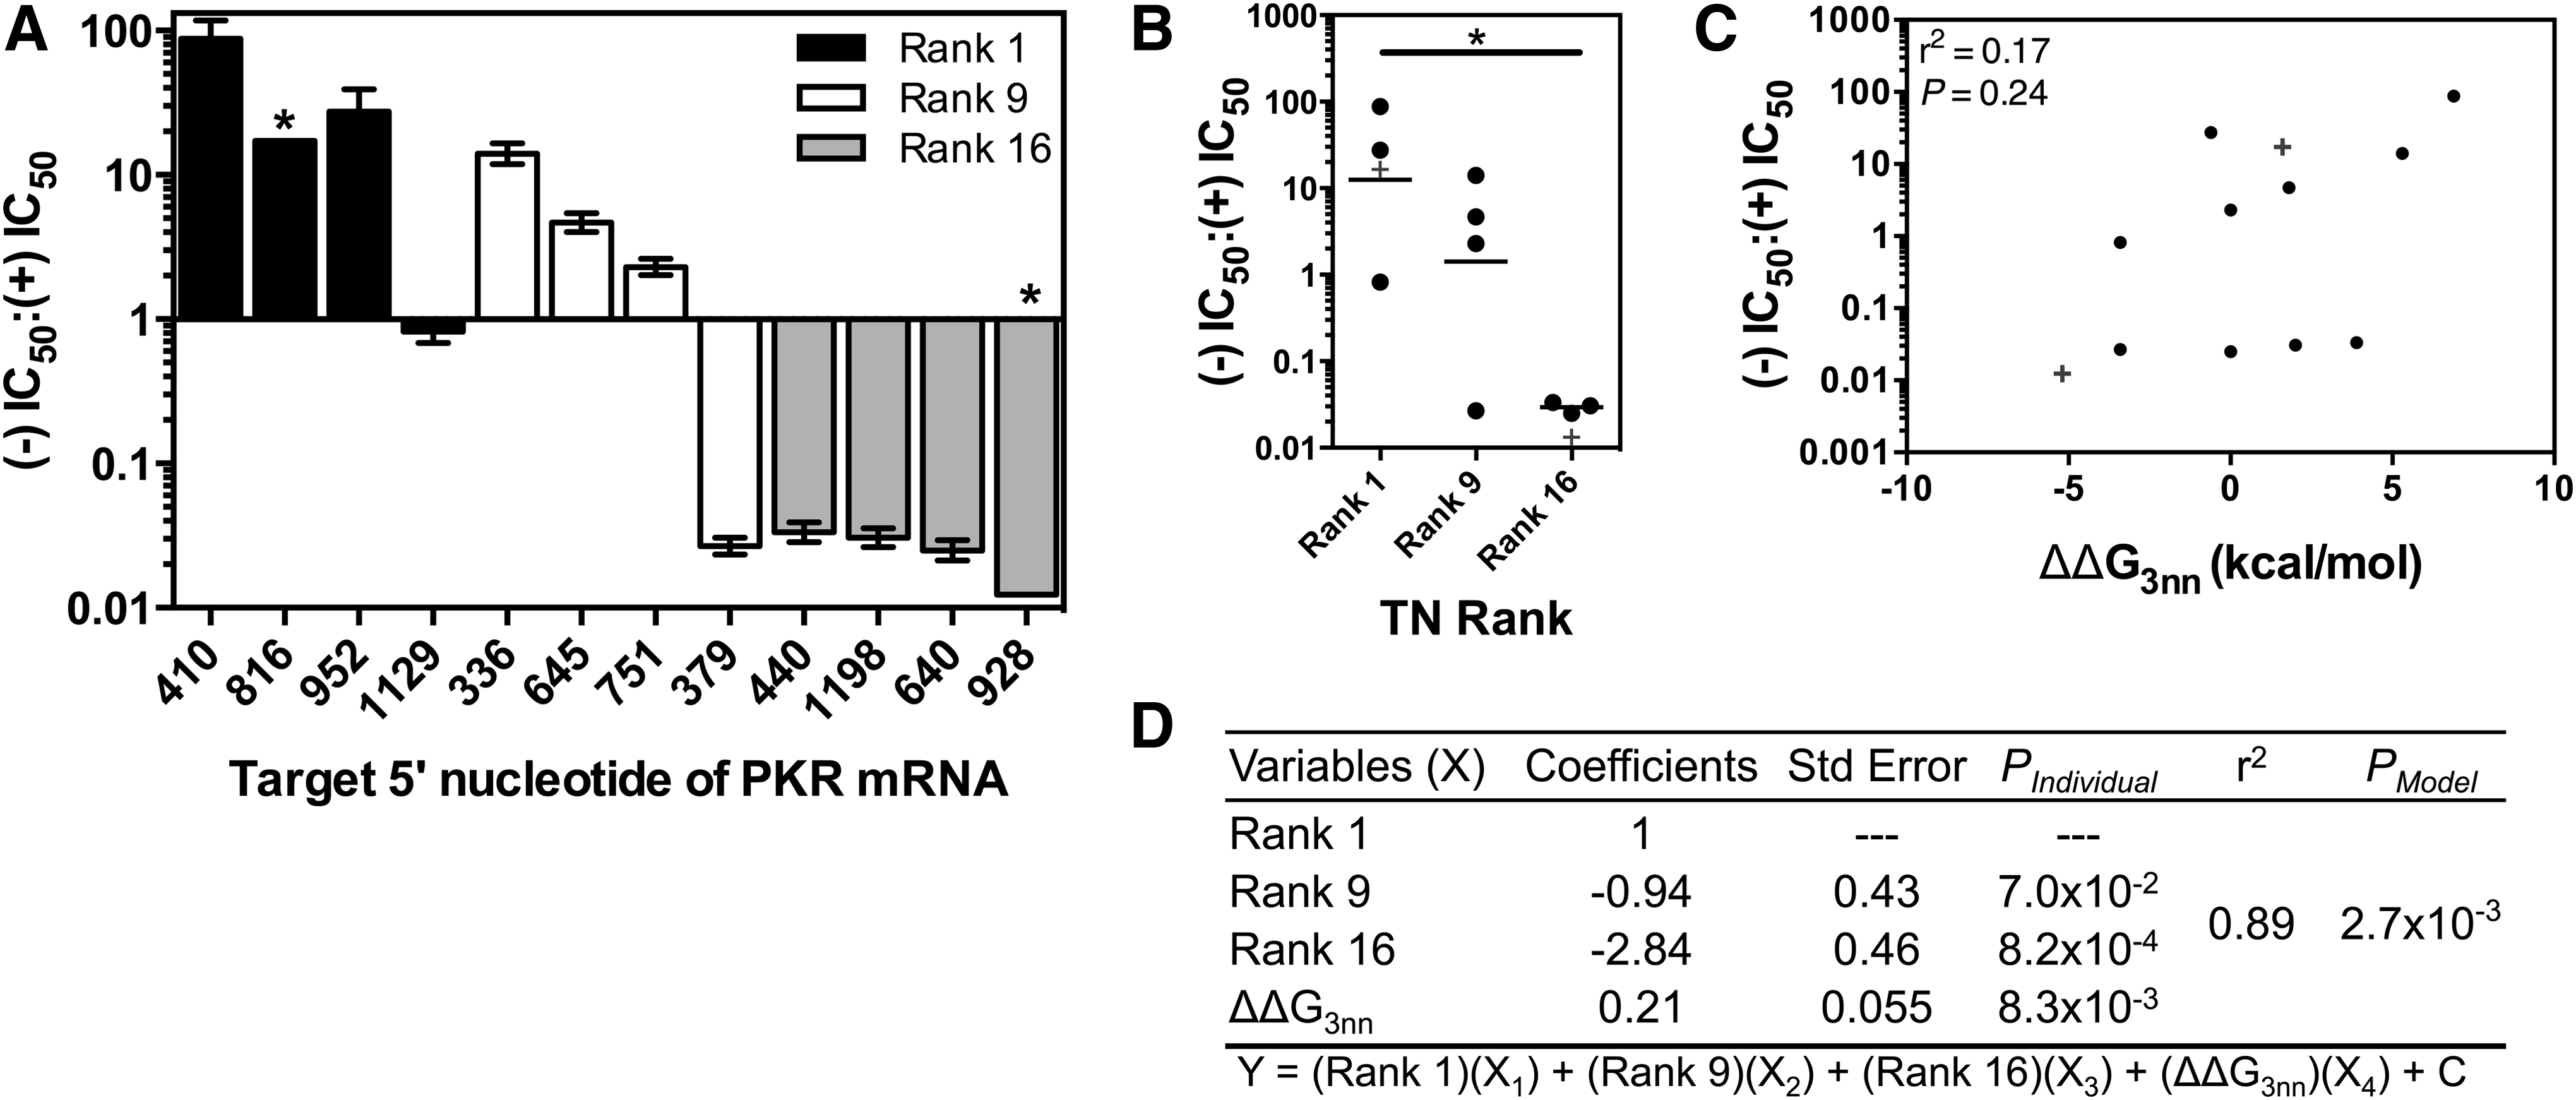
siRNA Functional Asymmetry.
Asymmetric strand loading of siRNA strands
To better understand the steps of the mechanism that, on aggregate, result in functional asymmetry, we measured siRNA strand loading into Ago2 by transfecting HeLa cells with our siRNA of interest for 24 h, immunoprecipitating Ago2, and then measuring its associated RNA by stem-loop RT-qPCR. We observed that TN Rank correlated with siRNA asymmetric strand loading (Fig. 3A, B). ΔΔG3nn was not correlated with siRNA asymmetric strand loading (similar to its lack of correlation with functional asymmetry) (Fig. 3C). In this case, however, it provided considerably less predictive information when combined with TN Rank (Fig. 3D) than it did for relative strand activity, as shown by the relative differences in Akaike weights for the combined 2-factor models and their respective single factor models (i.e., a smaller difference in Akaike weights indicates a smaller gain in model information content; Table 2).

siRNA Asymmetric Strand Loading.
RISC, RNA-induced silencing complex; TN, terminal nucleotide.
For a number of siRNAs, we observed differences in the relative loadings and relative activities. PKR1129, which exhibited symmetrical strand activity (P = 0.24, extra sum-of-squares F test), had asymmetric strand loading (P = 0.02, two-tailed t-test) in line with its TN Rank. Interestingly, it is the (−) strand of PKR1129 that has an unexpectedly high activity compared to the other sequences with a 5′ G and similar loading [PKR410(−) and PKR952(−); Supplementary Fig. S3A, B]. This is presumably because this sequence has a ΔΔG3nn strongly in favor of the (−) siRNA strand, which may partially offset its unfavorable 5′ nucleotide. In addition, sequences PKR336, PKR379, and PKR440 displayed symmetrical strand loadings and asymmetric activities (Figs. 2A and 3A). As with PKR1129, these siRNAs have large ΔΔG3nn values (either highly positive or negative), suggesting that ΔΔG3nn may significantly influence siRNA function only after exceeding a threshold magnitude.
A direct comparison of siRNA strand loading with its activity demonstrates that while siRNA loading and activity are correlated, multiple strands diverge significantly from the trend (Supplementary Fig. S4). These findings suggest some modulation of activity post-siRNA loading. Furthermore, the change in Akaike weights between the individual factors (TN Rank and ΔΔG3nn) and the combined model indicates that TN Rank and ΔΔG3nn are complementary predictors of functional asymmetry (Table 2). In comparison to activity, ΔΔG3nn adds less complementary information to the prediction of asymmetric strand loading (Table 2), indicating that ΔΔG3nn contains information more relevant to postloading events. For clarity, as we discuss post-loading events, we will use RISC-specific activity to refer to the enzymatic characteristics of a mature RISC that are independent of the amount of RISC generated.
RISC-specific activity
Because RISC-specific activity is a feature of the siRNA after the separation of the two siRNA strands, we analyzed the behavior of the individual siRNA strands independent of their complements (Fig. 4). Likewise, in lieu of TN Rank and ΔΔG3nn, we examined TN (U, A, C, G) and the energies of all nearest-neighbor pairs (ΔG(x)–(y)nt) along the length of the duplex (Fig. 5). While similar, the nucleotide preferences for loading (A>U>C>G) (Supplementary Fig. S3D) are different from those for activity (U>A>C>G) (Supplementary Fig. S3C), indicating that TN impacts RISC-specific activity, as others have previously observed [28]. However, TN alone does not account for all of the observed variation in activities; for instance, siRNAs with a 5′ A displayed similar loading but varied substantially in their activities (Fig. 4).
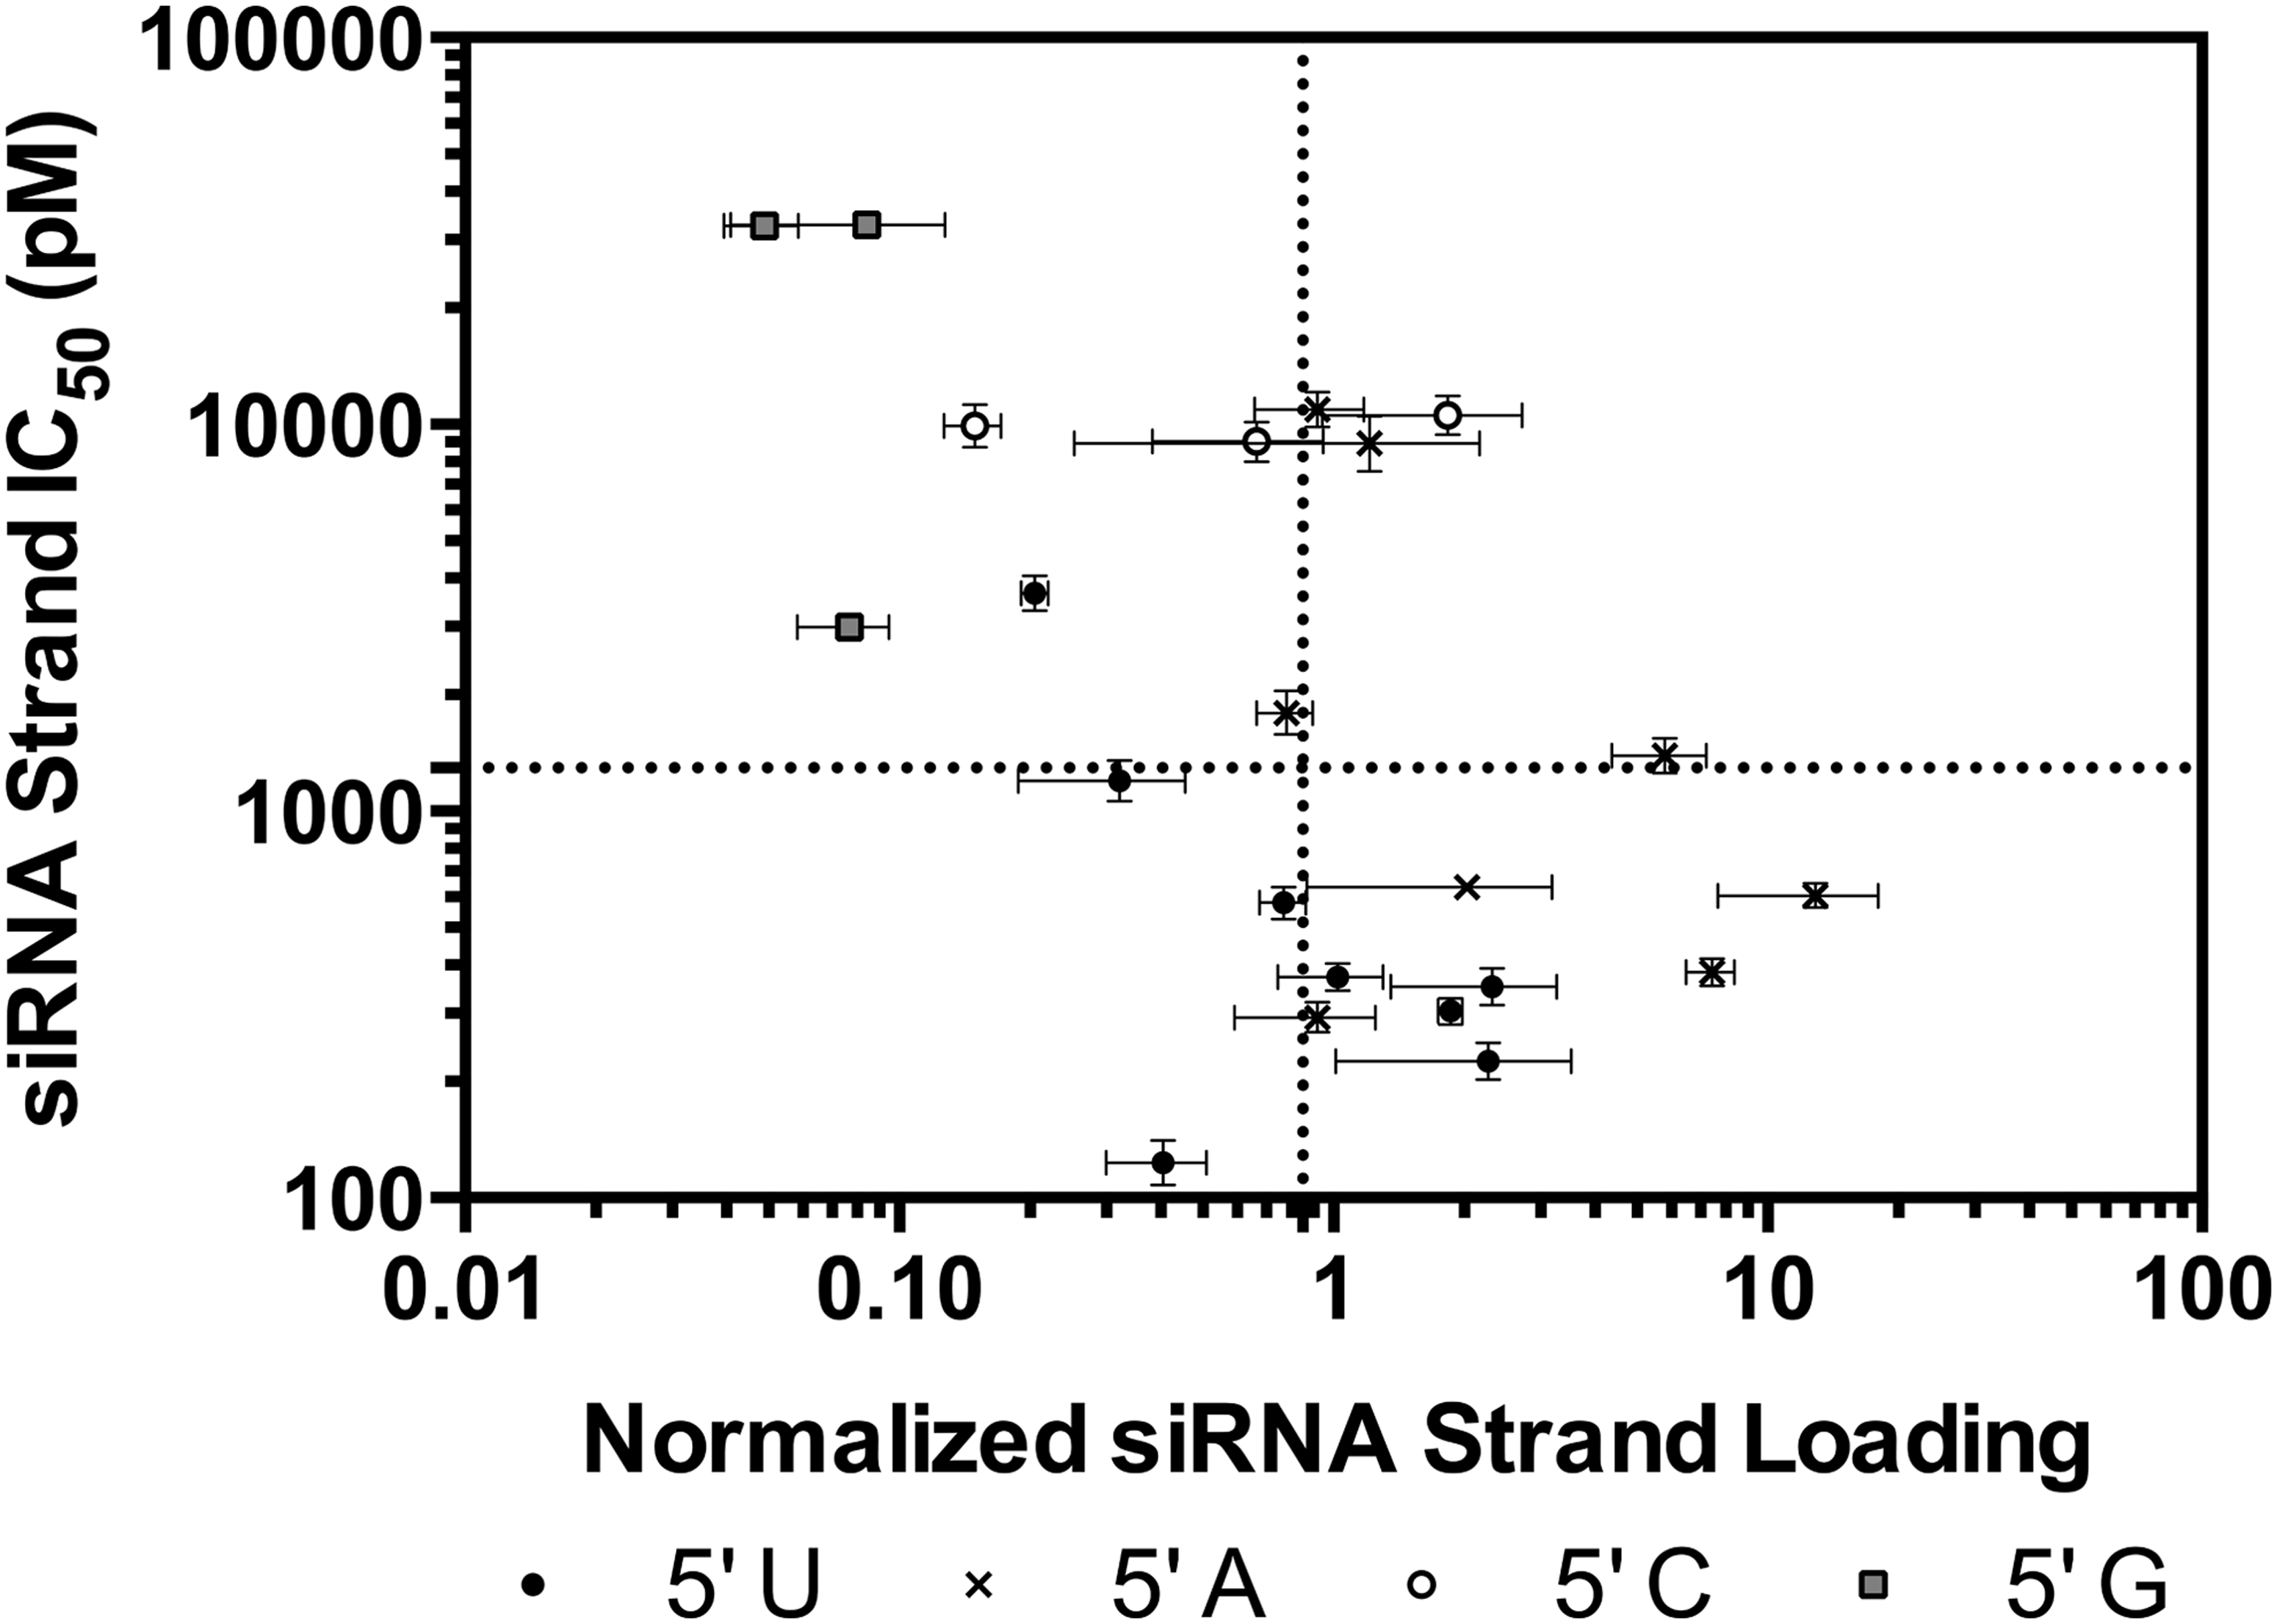
Correlation of siRNA strand activity with Ago2 loading. X values are fitted IC50 values; n = 4; error bars are ±1 SD. Y values are the normalized average siRNA loading; n = 3; error bars are ±1 SD. Dotted lines represent the median of each data set. siRNA, short interfering RNA. Ago2, Argonaute 2.
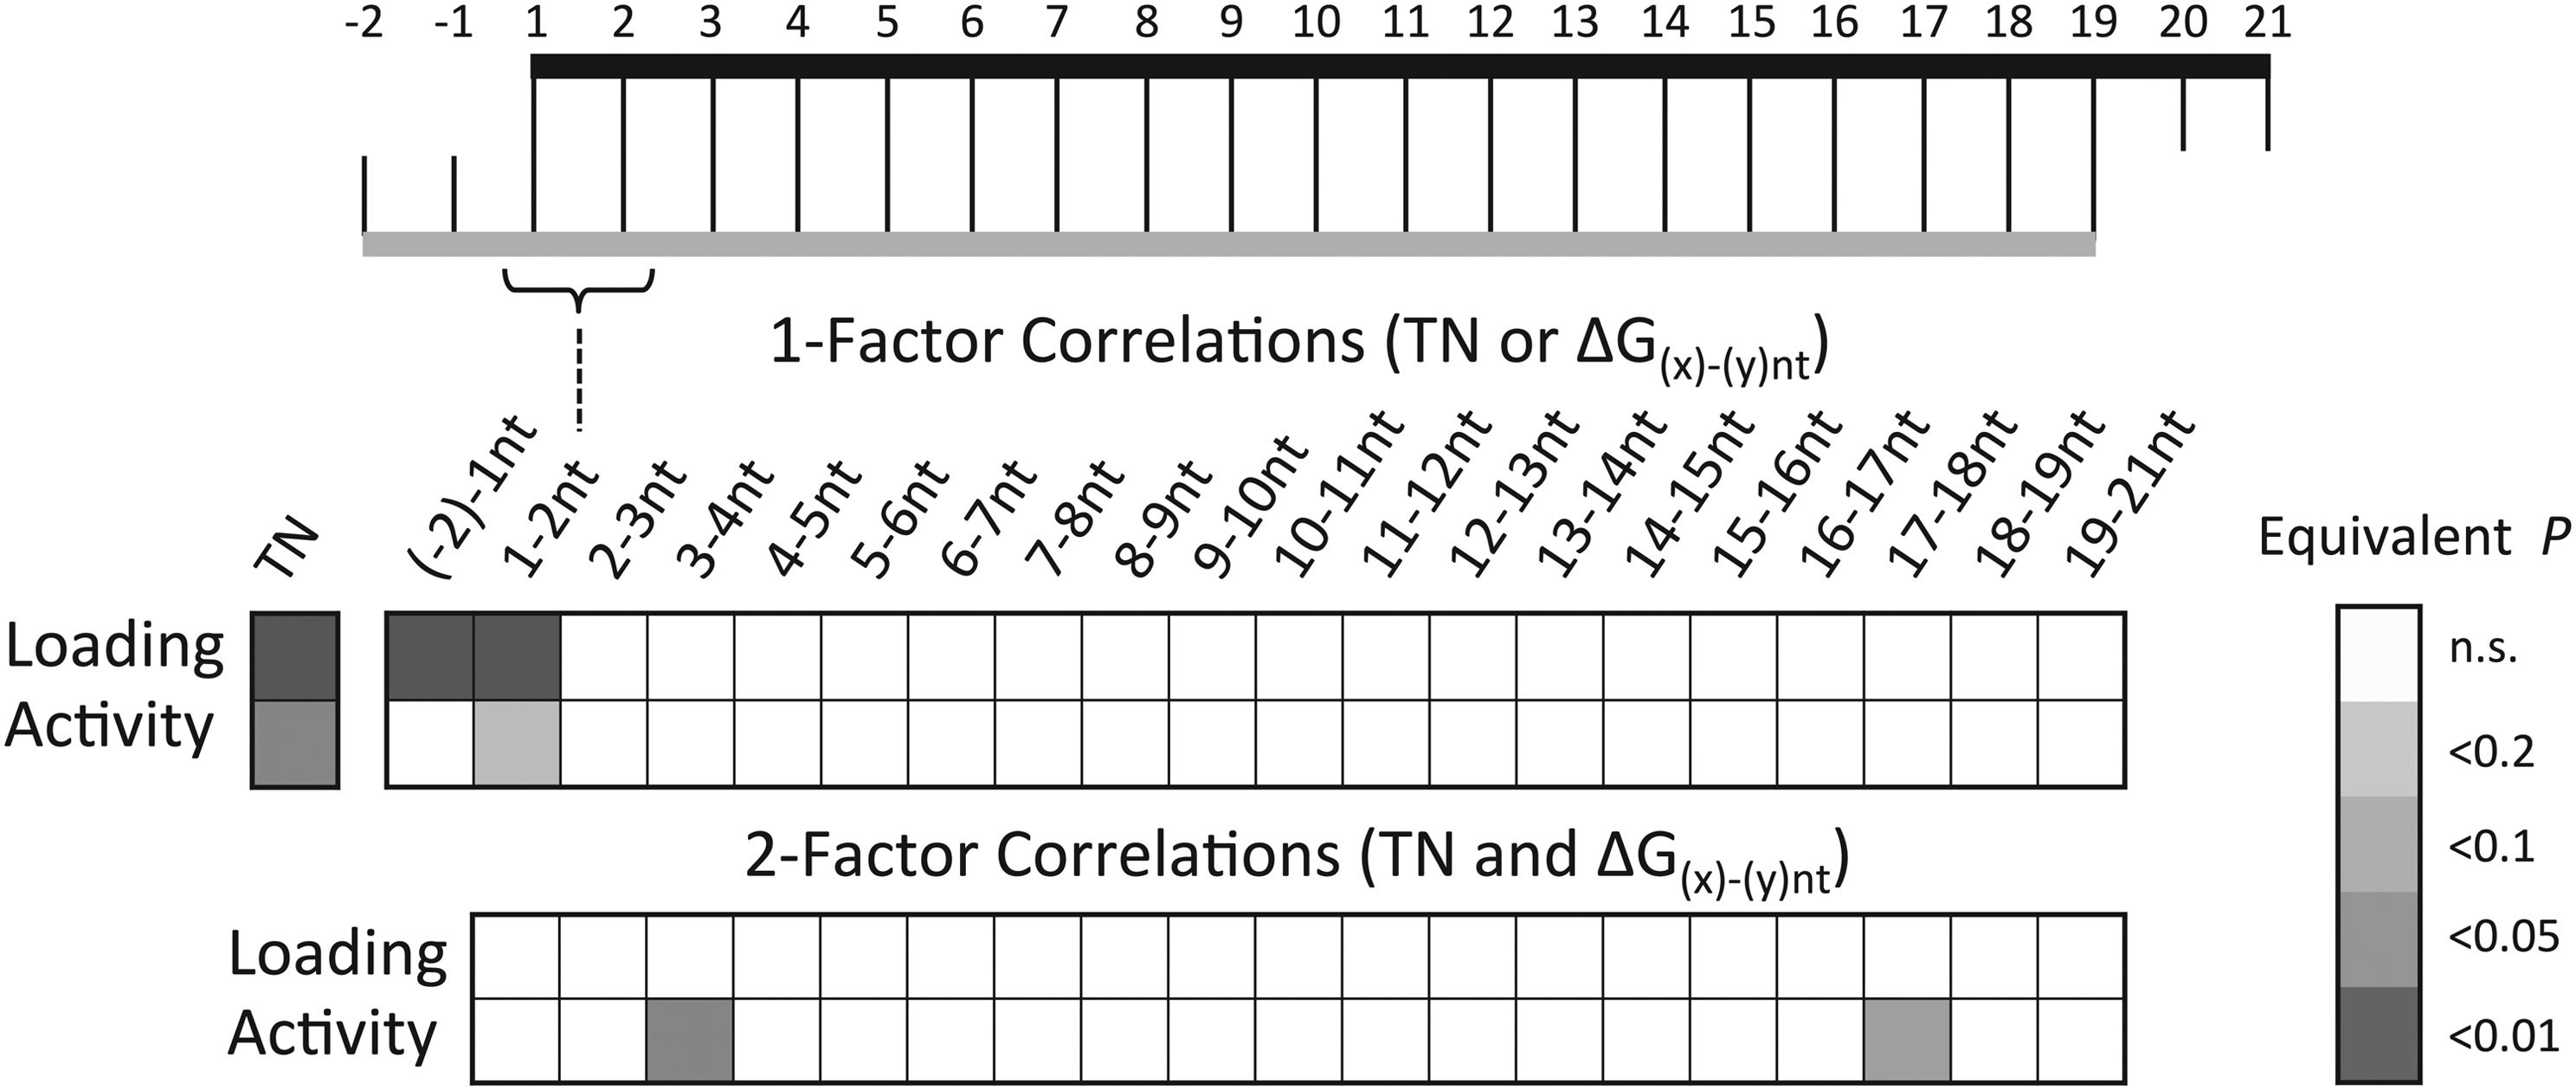
Evaluation of siRNA loading and activity predictors. 1-factor and 2-factor correlations of siRNA loading and activity with TN and ΔG(x)–(y)nt along the length of the duplex. 2-factor correlations use TN as one variable and a ΔG(x)–(y)nt value as the other. Significance in these correlations indicates that the variable predicts loading or activity independent of TN. A Bonferroni correction was applied to correct for multiple comparisons. Regression statistics for 1-factor and 2-factor models are listed in Supplementary Tables S5 and S6, respectively. siRNA, short interfering RNA; TN, terminal nucleotide.
To identify regions of the siRNA duplex important for controlling RISC-specific activity, we correlated loading and activity with the TN and ΔGs along the length of the duplex, looking for regions in the duplex important for siRNA activity, but not important for RISC loading (Fig. 5). We found that only the nearest-neighbor parameters surrounding the TN, ΔG(−2)–1nt, and ΔG1–2nt correlated with activity (Fig. 5). To decouple the effects of the TN sequence from ΔG, we used multiple linear regression and reevaluated the correlation between ΔG and both siRNA loading and activity. We found that ΔG3–4nt and ΔG17–18nt were only predictive of siRNA activity not loading (Fig. 5). This indicates that RISC-specific activity is improved for sequences with weaker (less negative) ΔG3–4nt and stronger (more negative) ΔG17–18nt. These ΔG values are included in the calculation of ΔΔG3nn and likely contribute to its utility in predicting siRNA activity.
Discussion
Designing siRNAs for maximal function requires the double-stranded structure to efficiently enter the RNAi pathway such that it can be easily processed to RISC loaded with the correct single strand. It is therefore critical to understand how the RNAi pathway proteins sense specific features of siRNA duplexes that differentiate the two siRNA strands. siRNA functional asymmetry was first characterized in Drosophila lysates and attributed to the difference in ΔΔG4nn [13]. Many Argonaute proteins contain an additional structure that preferentially binds 5′ TNs [29]. Our previous work sought to explain how these two terminal features contribute to siRNA activity [18,19]. In this study, we showed how TN Rank and ΔΔG3nn contribute to siRNA functional asymmetry and asymmetric strand loading. Furthermore, we have shown that, in cultured HeLa cells, functional asymmetry is modulated both before and after siRNA loading, with TN Rank and ΔΔG3nn exerting influence at different stages of the mechanism.
Functional asymmetry and asymmetric strand loading were not perfectly correlated, indicating additional modulation of siRNA activity post-siRNA loading (Supplementary Fig. S4). Our top-down analysis identified free energies at two positions, ΔG3–4nt and ΔG17–18nt, to be predictive of siRNA activity, but not siRNA loading (Fig. 5). Mature RISC splits siRNA-target mRNA interactions into five domains, the 5′ anchor (Nucleotide: 1), the seed region (Nucleotides: 2–8), the central region (Nucleotides: 9–12), the 3′ supplemental region (Nucleotides: 13–16), and the 3′ tail (Nucleotides: 17–21) [30]. The preference for weaker thermodynamic stability through nucleotides 1–4 of the siRNAs is well established [13,31–33]; our findings suggest that weaker hybridization in this region leads to greater RISC-specific activity (Fig. 5), in agreement with findings that high stability in the seed region decreases RISC turnover [34]. RISC-mRNA interactions beyond the 3′ supplemental region have been shown to be dispensable for target cleavage or in some cases even deleterious [28,30]. We contend that the preference for a stronger ΔG17–18nt is also important in maintaining a stable interaction between RISC and its target, similar to base pairs in the 3′ supplemental region [30].
After delivery of the siRNA to the cell cytoplasm, efficient guide strand loading requires nucleotide-independent phosphorylation of the siRNA 5′ TNs [35], outcompeting native miRNAs for binding to Ago2 [36,37], conformational changes within Ago2 facilitated by HSP90 and potentially other proteins [10,38–41], and cleavage and removal of the passenger strand [42,43]. We observed a large variation in the total amount of Ago2 loading even among siRNA strands with the same TN (Supplementary Fig. S3B). In analyzing other characteristics for their ability to predict loading, we found ΔG(−2)–1nt and ΔG1–2nt of the 5′ end of the guide strand to be the most predictive features of siRNA strand loading (Fig. 5). Interestingly, there was no correlation between siRNA strand loading and the ΔG values near the 3′ terminus (i.e., Nucleotides 17–21), suggesting that the interactions of Ago2 are primarily with the 5′ ends of siRNAs. Thus, parameters based on relative strand properties (e.g., TN Rank and ΔΔG) are less useful in predicting absolute siRNA strand loading and activity than in predicting relative strand activities and loadings.
The established binding preferences for the Ago2 nucleotide specificity loop (U>A>C>G) match the order of siRNA activities in our data (Supplementary Fig. S3C), but differ from the loading preferences we observed (A>U>C>G) (Supplementary Fig. S3D). This suggests that 5′ TN affects RISC-specific activity, presumably through differences in RISC half-life [28], similar to what was observed in Drosophila Ago1 [44]. The correlation of siRNA loading with the 5′ terminal ΔG(−2)–1nt and ΔG1–2nt indicates that siRNA loading is controlled, in part, by the 5′ terminal duplex energy (Fig. 5), although TN remains a significant predictor of siRNA strand loading because of its collinearity with the ΔG(−2)–1nt and ΔG1–2nt terms. Recently, sensing of siRNA strand thermodynamics was proposed to occur through Ago2 MID domain interactions with the phosphate backbone of the first four nucleotides of the siRNA guide strand [45], sensing the accessibility and single-strand character of weakly base paired termini [45]. Collectively, our findings agree with this model, but suggest that the first and second nucleotides of the siRNA guide strand are the most significant in determining total strand loading (Fig. 5). siRNA design algorithms should thus account for relative siRNA features (TN Rank and ΔΔG) to ensure correct strand selection and absolute strand features (TN and ΔG) to ensure high strand loading and RISC-specific activity.
While our experiments and analysis could not cover the entire siRNA feature space, the number of siRNAs tested was large enough to identify regions of the siRNA that explain some of the differences between activity and loading. 5′ C and 5′ G sequences are underrepresented in our individual siRNA strands; thus, a more comprehensive set of siRNAs could potentially have provided more insight into how features beyond the 5′ TN influence siRNA behavior both pre- and postloading. Nonetheless, the parameters identified indicate that it is possible to design siRNAs with the goal of high loading, high activity, or both.
Conclusion
Taken together, our findings suggest that siRNA loading and activity are partially independent, allowing for an additional degree of freedom in siRNA selection and design. The behavior of siRNA strands is strongly dependent on the 5′ nucleotide, but the duplex hybridization energies have a second order effect on both siRNA loading and RISC-specific activity. Specifically, ΔG(−2)–1nt and ΔG1–2nt are predictive of siRNA loading, and ΔG3–4nt and ΔG17–18nt are predictive of RISC-specific activity. Finally, we have shown that siRNA functional asymmetry is a result of many competing factors that ultimately control the activity of each siRNA strand. A more accurate understanding of the interplay among these factors will lead to better siRNAs.
Footnotes
Acknowledgments
The authors thank Professor Philip C. Bevilacqua for providing the PKR plasmid, Professor Judy Lieberman for the psiCHECK2-AS34a plasmid provided through Addgene (Plasmid #37099). We would also like to thank the members of the Cellular and Biomolecular Engineering Laboratory for their technical and intellectual support, in particular Sarah Thorwall. Financial support for this work was provided, in part, by the Michigan State University, the National Science Foundation (CBET 1510895 and 1547518), and the National Institutes of Health (GM079688, GM089866, and CA176854).
Author Disclosure Statement
No competing financial interests exist.
References
Supplementary Material
Please find the following supplemental material available below.
For Open Access articles published under a Creative Commons License, all supplemental material carries the same license as the article it is associated with.
For non-Open Access articles published, all supplemental material carries a non-exclusive license, and permission requests for re-use of supplemental material or any part of supplemental material shall be sent directly to the copyright owner as specified in the copyright notice associated with the article.