
Abstract
Antisense oligonucleotide (AON) therapy is emerging as a potential treatment strategy for neurodegenerative diseases, such as spinal muscular atrophy, Huntington's disease, and amyotrophic lateral sclerosis. AONs function at the cellular level by, for example, direct interference with the expression of gene products or the molecular activation of neuroprotective pathways. However, AON therapy faces a major obstacle limiting its clinical application for central nervous system (CNS) disorders: the blood–brain barrier. Systemic administration of AONs leads to rapid clearance and breakdown of its molecules in the periphery. One way to overcome this obstacle is intracerebroventricular (ICV) delivery of the therapeutics directly to cerebrospinal fluid (CSF). Given the particular molecular structure of oligonucleotides, the (pharmaco) kinetic and distribution pattern of these compounds in the brain are yet to be clarified. In this study, 2′OMePS oligonucleotide delivered through ICV into CSF reached the most key structures in the brain. The distribution of this oligonucleotide differed when comparing specific brain structures and cell groups. After 48 h post-infusion, the distribution of the oligonucleotide reached its maximum and was found intracellularly in many key brain structures. These findings help understanding the kinetic and distribution pattern of 2′OMePS oligonucleotide in the brain and will direct more rational and effective use of ICV drug delivery and unleash its full therapeutic potential in managing CNS diseases.
Introduction
A
For several central nervous system (CNS) disorders such as spinal muscular atrophy [9] and peripheral nervous system disorders such as amyotrophic lateral sclerosis [10], AON therapy has recently entered clinical phase showing promising results. However, AON therapy faces a major obstacle for clinical application: the blood–brain barrier [8]. With growing attention on local drug delivery, cerebrospinal fluid (CSF) is of special importance as a carrier for substances in the CNS. CSF crosses and reaches all structures within the brain parenchyma. The extent to which the AON carried by CSF penetrates the brain parenchyma and its stability are important concerns. Besides, little is known about the intracerebral distribution, time course of cellular uptake, and washout of intracerebroventricular (ICV) administered AONs. Among oligonucleotides that are being used for therapy, 2′OMePS are known as “second generation” oligonucleotides. These compounds are resistant to degradation by cellular nucleases, hybridize specifically to their target mRNA, and are relatively easy to be synthesized [11]. Owing to their specific features, it is likely that they benefit from a specialized uptake mechanism.
Thus far, several studies [12–17] have addressed oligonucleotide distribution in CNS of mammals. However, none reports the distribution pattern beyond 48 h post-infusion. Intrathecal (IT) delivery has also been applied as another local drug delivery method. Although it might be effective for disorders in which the pathology is in the spinal cord, polyQ disorders mainly occur in the brain and cerebellum [18]. Therefore, ICV administration seems to be more suitable than IT for polyQ disorders.
CSF pathways are of paramount importance for the distribution of the drugs delivered through ICV. The major pathway describes the CSF route in the craniocaudal direction from the lateral ventricles to the third ventricle through the foramina of Monro and through the aqueduct of Sylvius into the fourth ventricle, where it leaves the ventricle through the foramina of Magendie and Luschka into the subarachnoid space [19]. In addition, a CSF minor pathway has also been described, by which the CSF passes through the ventricular ependyma, interstitial, and perivascular spaces towards perineural lymphatic channels [20]. Based on these, we hypothesized that after ICV infusion, the AON follows the CSF pathways and is distributed in a time/distance-dependent manner. Here we aimed to investigate tissue and cell-type distribution of a fluorescent-labeled oligonucleotide (with a random sequence) after ICV infusion. Over a time period from 3 h to 1 week, we studied tissue penetration, retention, and cellular uptake of this oligonucleotide in wild-type adult mice.
Materials and Methods
Subjects
Eighteen FVB/NJ wild-type, 9 months old male mice from the Central Animal Facility of Maastricht University (Maastricht, the Netherlands) were used in this study. Animals were housed individually under a 12 h reversed day/night cycle (light from 7 pm till 7 am) with access to water and food ad libitum. Room temperature (RT, 21°C ± 2°C), humidity (60% ± 10%), and air exchange (16 times per hour) were automatically controlled. The Animal Experiments and Ethics Committee of Maastricht University had approved all experimental procedures. Mice were randomly allocated in six experimental groups, three mice per group. Each group was sacrificed at one of the following time points after infusion of the oligonucleotide: 3, 6, 12, 24, 48 h, and 1 week. Selection of time points was based on previous studies [12–14].
Fluorescently labeled oligonucleotide
A Cy3-labeled fully 2′-O-methyl phosphorothioate-modified oligonucleotide with the sequence Cy3-C*UG UGG UC*C* UC*C*UGG was used. Oligonucleotides were synthesized and provided by BioMarin Nederland B.V. (Leiden, the Netherlands). Oligonucleotides were prepared under aseptic conditions in a laminar flow hood and were micro-filtered. Upon arrival at the test site, storage was continued at 5°C ± 3°C until the day of use. Before administration, oligonucleotides were dissolved in 1% phosphate-buffered saline (PBS) with a pH of 7.4.
Stereotaxic surgery and oligonucleotide administration
All mice were implanted with a cannula (www.plastics1.com/Cannula-Infusion-Systems.php). Surgical procedures were described previously [21]. In brief, general anesthesia was achieved by administering isoflurane 3%–5% for induction and 1.5%–2% for maintenance. Anesthetized mice were positioned and fixed in a stereotactic frame (Stoelting Co, Wood Dale, IL).
A small burr hole was drilled into the skull at the calculated anatomic target (AP: −0.5, ML: 1.0 (right), DV: −1.7 from bregma). The cannula was inserted at the target and fixed with dental cement (OptiBond® All-In-One, Kerr Dental, Bioggio, Switzerland). Finally, mice were placed in a padded Makrolon™ cage and were left for recovery for 2 weeks.
Fifty micrograms of oligonucleotide was infused in 5 μL of saline using a 10 μL Hamilton infusion pump. Infusion was conducted through the guide cannula using a 26-gauge needle connected to the syringe through flexible polyethylene tubing. Infusions took place over 5 min and the needle remained in place for an additional 5 min.
Perfusion and tissue collection
Three, 6, 12, 24, 48 h, and 1 week after infusion, mice were deeply anesthetized and perfused transcardially with ice-cold PBS, pH 7.4, followed by 4% paraformaldehyde in PBS, pH 7.4. The brains were removed and post-fixed overnight in PBS containing 20% sucrose. Complete left (contralateral) hemisphere was cut into nine series of sagittal sections on a cryostat with a thickness of 30 μm.
Fluorescent immunohistochemistry and microscopy
Immunohistochemistry was performed using antibodies raised against neuronal nuclear antigen (NeuN), glial fibrillary acidic protein (GFAP), and DNA staining (Hoechst).
Two series of brain sections were processed immunohistochemically for either Hoechst/GFAP or Hoechst/NeuN. In brief, after blocking with 1% donkey serum, sections were incubated with the primary antibody (either NeuN or GFAP diluted at 1:100 and 1:1,000, respectively) overnight at 4°C. For the secondary antibody, Alexa 488 was used, diluted 1:100, and incubated for 1.5 h at RT. For nuclear DNA staining, all the slides were incubated for 30 min at RT with Hoechst (1:1,000). Slides were cover-slipped with 80% glycerol in TBS.
To assess the distribution of Cy3-labeled oligonucleotide, sections were photographed using a computerized microscopy system (Stereo Investigator, Microbrightfield Bioscience, Williston, VT). The distribution of oligonucleotide was mapped using a computer-assisted video microscope equipped with a stage position digitizer. For the macro pictures, using a digitizing tablet, the contours of the section were entered at low magnification (4 × ) and selected structures were mapped at higher magnification. For analysis of cell-type distribution, double-stained sections were evaluated using a spinning disk confocal microscope (DSU; Olympus, BX50, Tokyo, Japan).
Results
Distribution of the oligonucleotide was evaluated after a single ICV infusion at six time points, ranging from 3 h to 1 week by inspection of the immunohistochemically stained sections. All three animals in each group were evaluated separately and a consistent pattern of distribution was found among all subjects.
After administration, a rapid spread of the oligonucleotide in the ventricular system was observed at 3 h postinfusion (Fig. 1A). Moreover, the oligonucleotide was located in the parenchyma of the regions surrounding the ventricles. There was no difference between the ipsilateral and contralateral hemispheres. The oligonucleotide was found around the ventricles and cisterns (Fig. 1A) such as striatum, diencephalon, and cerebellar cortex. Shortly after infusion, the oligonucleotide was distributed evenly throughout the structures surrounding the ventricles, without apparent differences between white and gray matters. For instance, intense oligonucleotide-Cy3 fluorescence was visible in the corpus callosum at this time point. Of note, within the third and fourth ventricles (Fig. 1A), choroid plexus was stained with labeled oligonucleotide.

Low-power photomicrographs taken from sagittal brain sections of mice infused with labeled oligonucleotide and perfused at different post-infusion time points
At 6 h postinfusion, the intensity of the labeled oligonucleotide around the ventricles and cisterns was reduced and a more punctate rather than diffused pattern across the brain was identified. At this time point, a thin layer of labeled oligonucleotide was visible around the brain, possibly in the subarachnoid space. Moreover, the blood vessels were distinguishable in the ventral regions of the brain (Fig. 1B). Some of the structures that were highly labeled after 3 h post-infusion still showed high fluorescence, namely the cerebellum, diencephalon, striatum, and tectum.
At 12 h post-infusion, a more punctate pattern of labeled oligonucleotide across the brain was observed. The cerebellum, diencephalon, and tectum became less intense, and a more intense fluorescence was seen in the frontal areas of the brain. The hippocampal formation and olfactory bulbs (OBs) showed intense signal density (Fig. 1C). The hippocampus and dentate gyrus showed low levels of fluorescence after 12 h, with higher intensities in the pyramidal layer of CA3 and less in the granular layer.
By 24 h post-infusion, the punctate pattern was more evident. At this time point, within the hippocampus the CA1 neurons showed the highest fluorescence presence.
At 48 h post-infusion, the dentate gyrus was intensely labeled with oligonucleotide, in both the granular and pyramidal layers (Fig. 1E). Moreover, at this time point, extensive brain penetration and marked cellular uptake were observed.
The last time point analyzed—1 week—was marked by decreased fluorescent Cy3 intensity. The hippocampal formation was clearly labeled, particularly the granular layer of the dentate gyrus and the pyramidal cells in the CA1 (Fig. 1F).
Of note, the distribution pattern of the oligonucleotide changed in the hippocampal formation over time. At 3 h, fiber tracts and white matter (stratum radiatum and molecular layers mainly) were more visible, and by 48 h, cell bodies showed increased fluorescence (Fig. 1).
The OB showed high signal density at 12, 24, and 48 h post-infusion time points (Fig. 1C–E). Some parts of the neocortex, such as the somatomotor, somatosensory, and visual cortices, did not show any labeled oligonucleotide over different time points (Fig. 1A–F).
Cellular uptake of the oligonucleotide
The labeled oligonucleotide was mainly in the interstitial spaces at 3 h postinfusion. This extracellular diffused pattern started to change at 6 and 12 h post-administration of labeled oligonucleotide (Figs. 1 and 2). By 1 week, extracellular space was devoid of fluorescence and the oligonucleotide was visible in the cytoplasm (Figs. 3–5).

Low-power photomicrographs taken from sagittal brain sections of mice containing the hippocampal formation, thalamus, and striatum that were infused with labeled oligonucleotide. Figures show the distribution of labeled oligonucleotide after 12 h
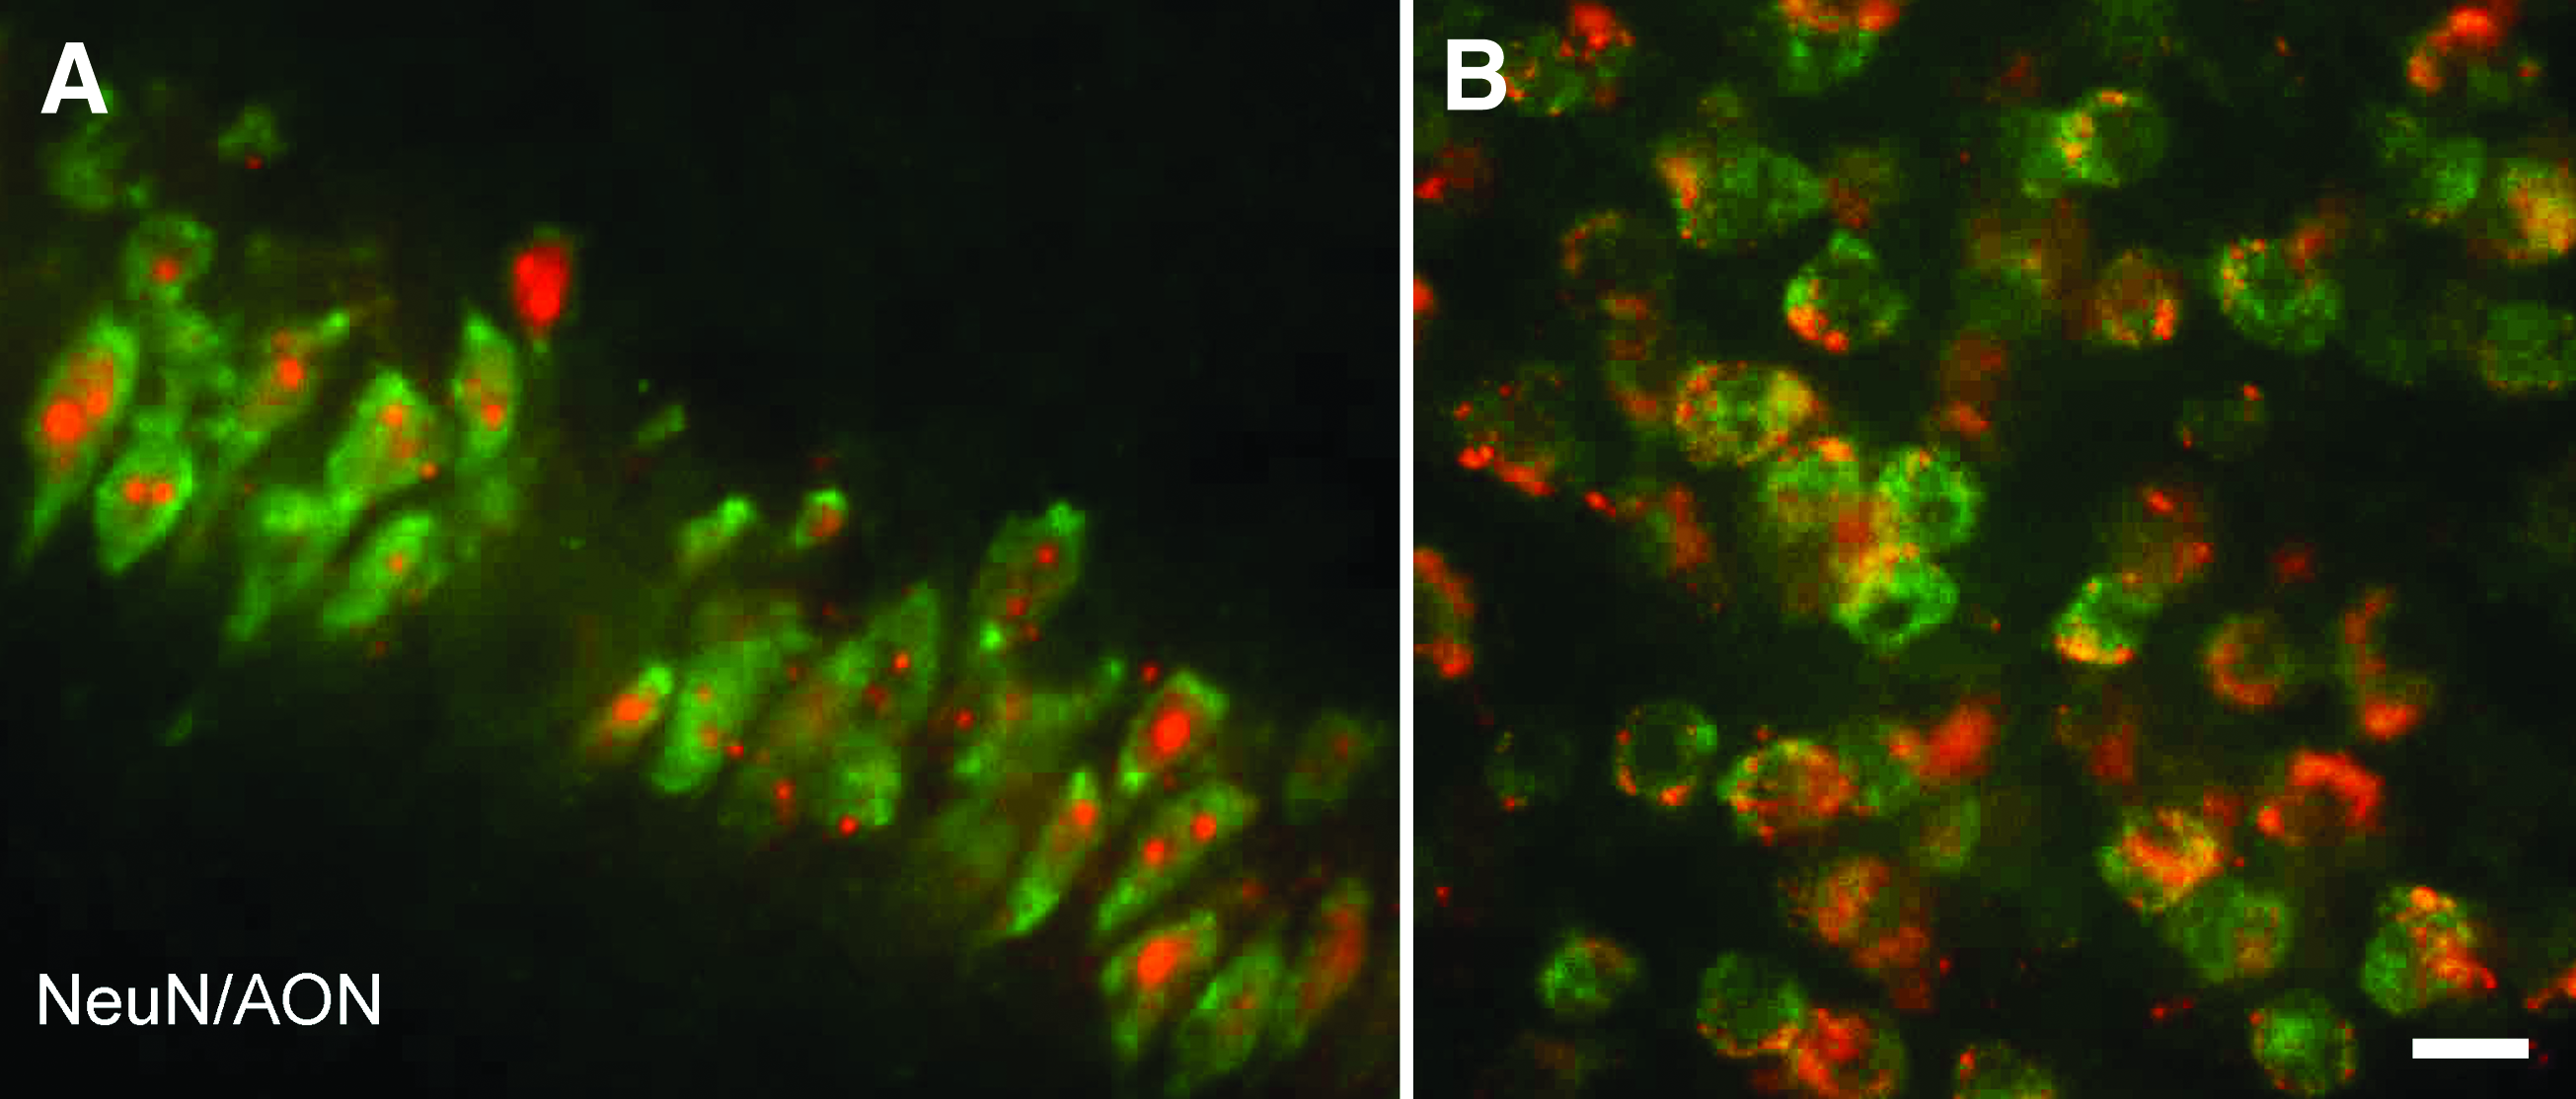
High-power confocal photomicrographs taken from sagittal brain sections of mice containing the CA1 region of the hippocampus
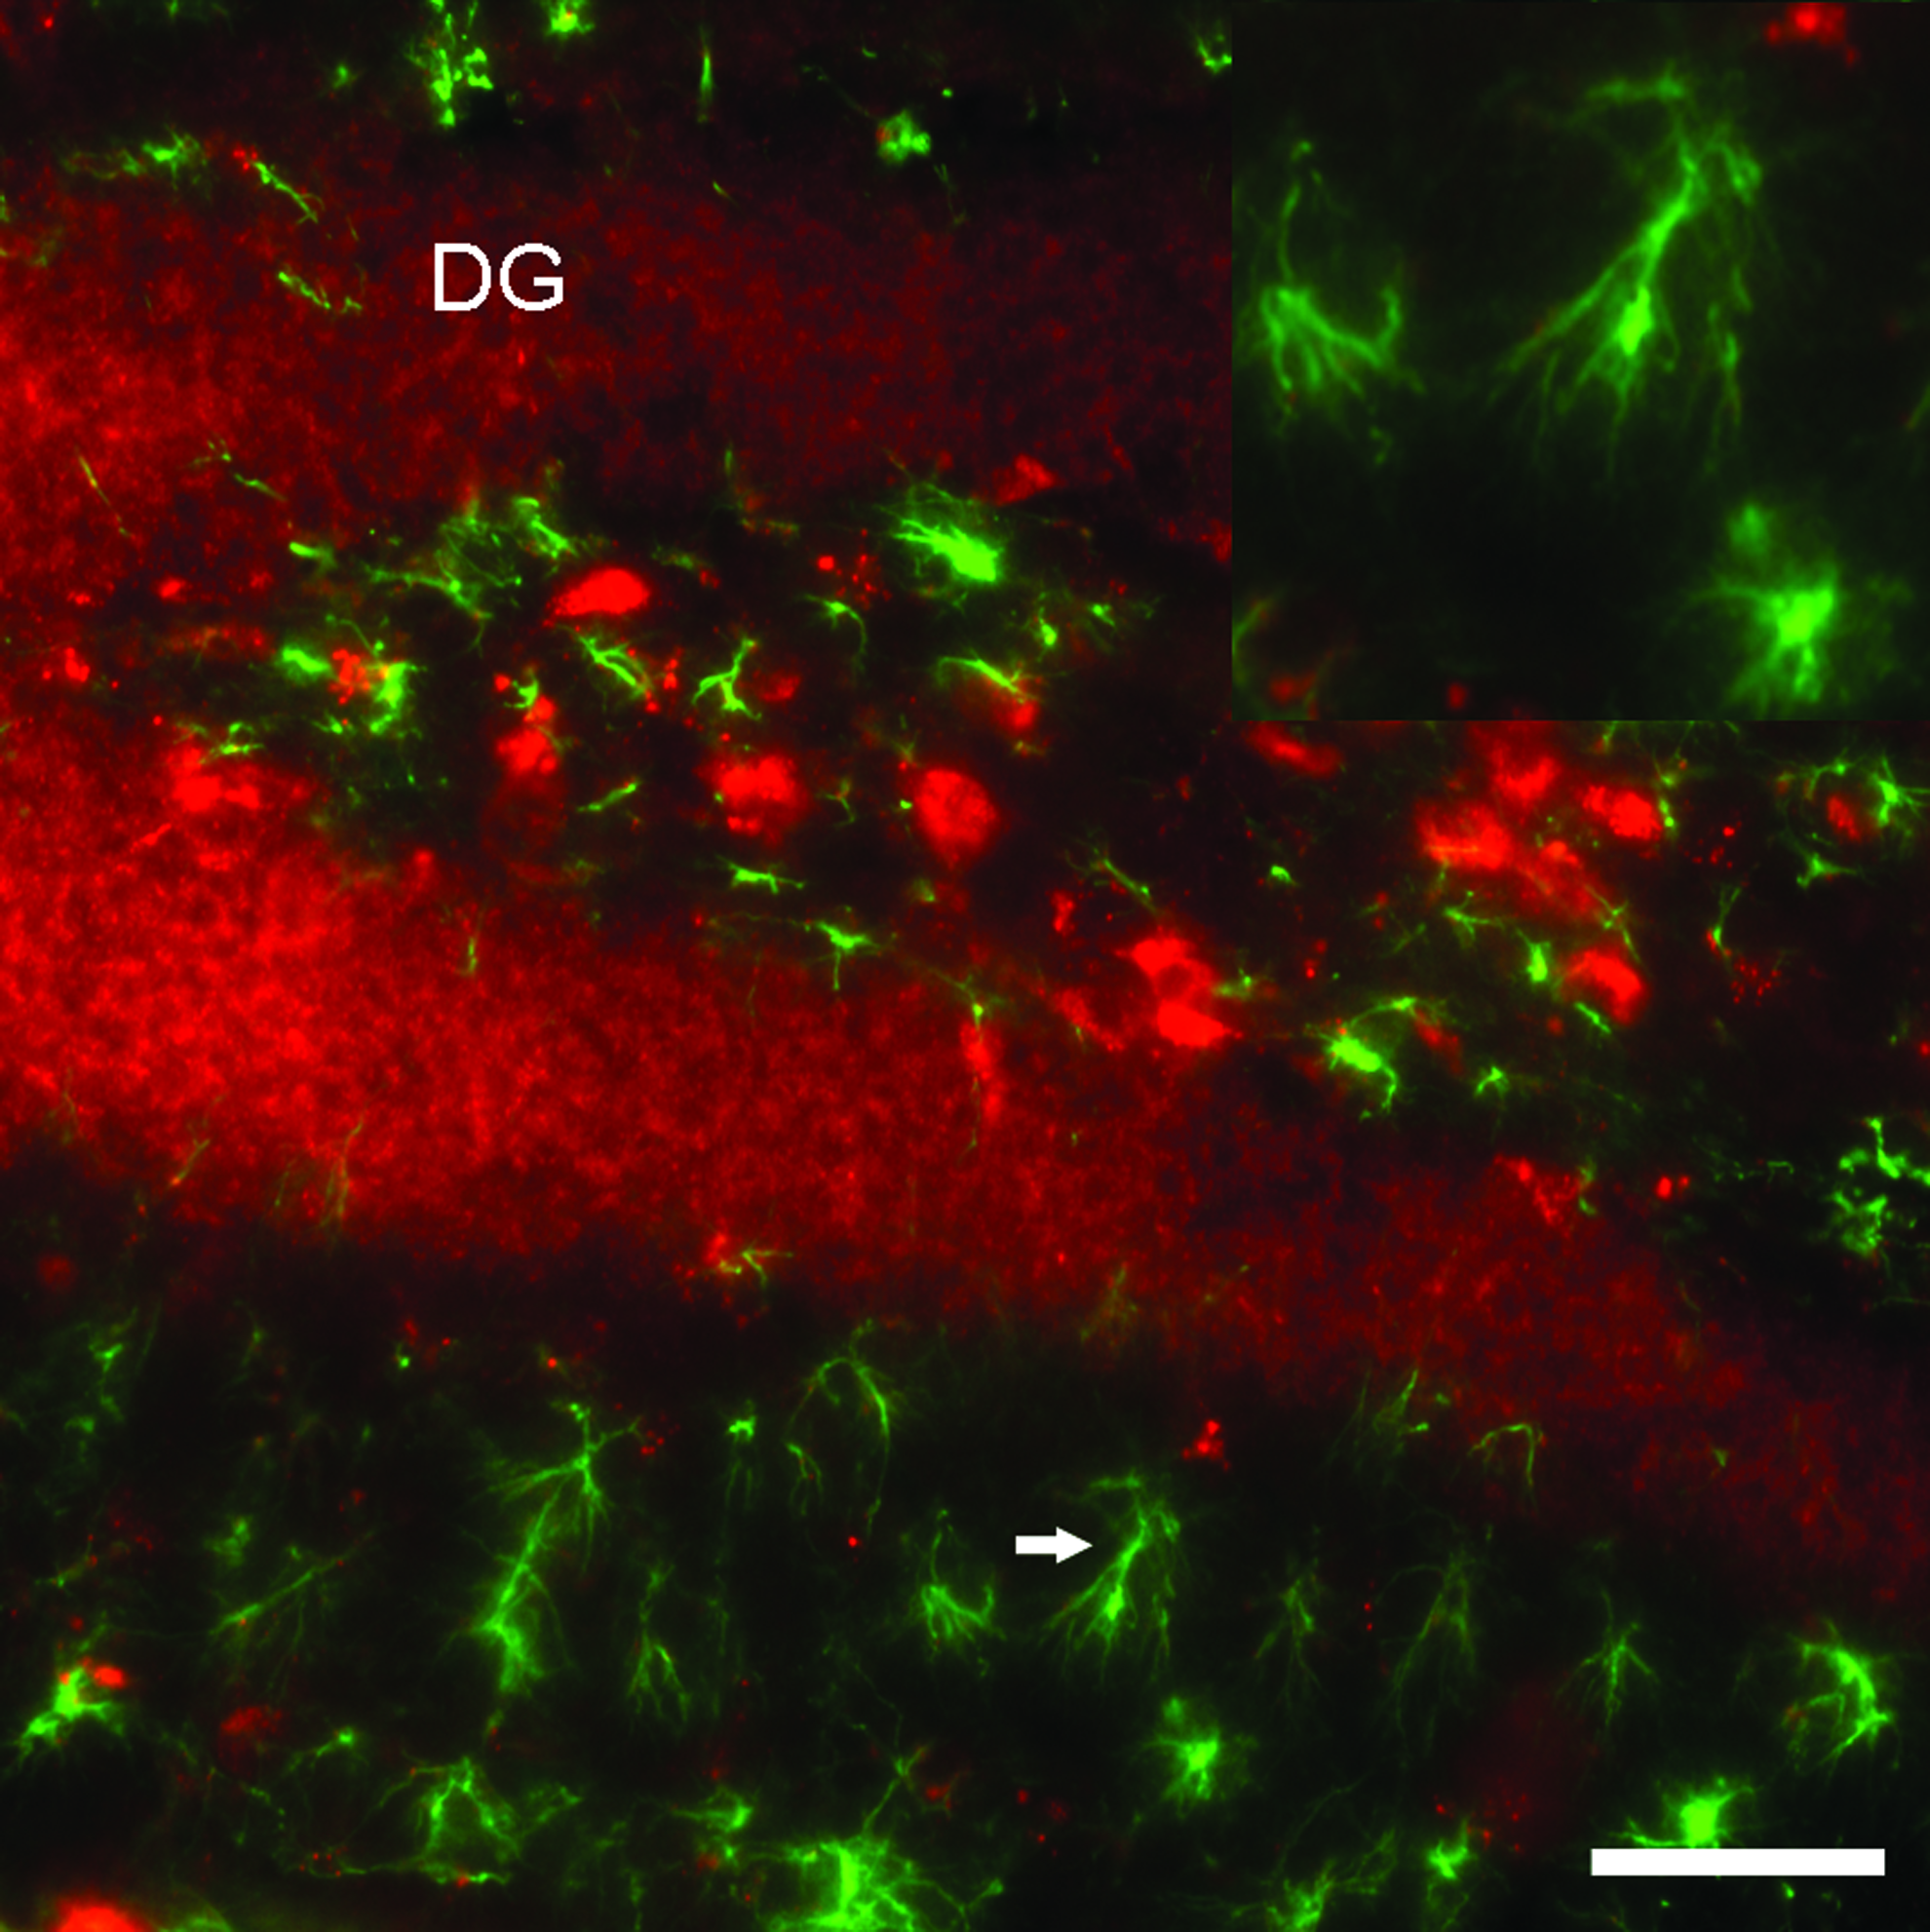
High-power confocal photomicrograph taken from a sagittal brain section of a mouse containing the hippocampus and dentate gyrus at 48 h post-infusion stained for GFAP. Figures show the absence of intracellular-labeled oligonucleotide in the astrocytes, whereas the granular cell layer is densely labeled with oligonucleotide. The inset shows a higher magnification of an astrocyte, which is indicated by an arrow. Scale bar = 50 μm. DG, dentate gyrus; GFAP, glial fibrillary acidic protein. Color images available online at www.liebertpub.com/nat
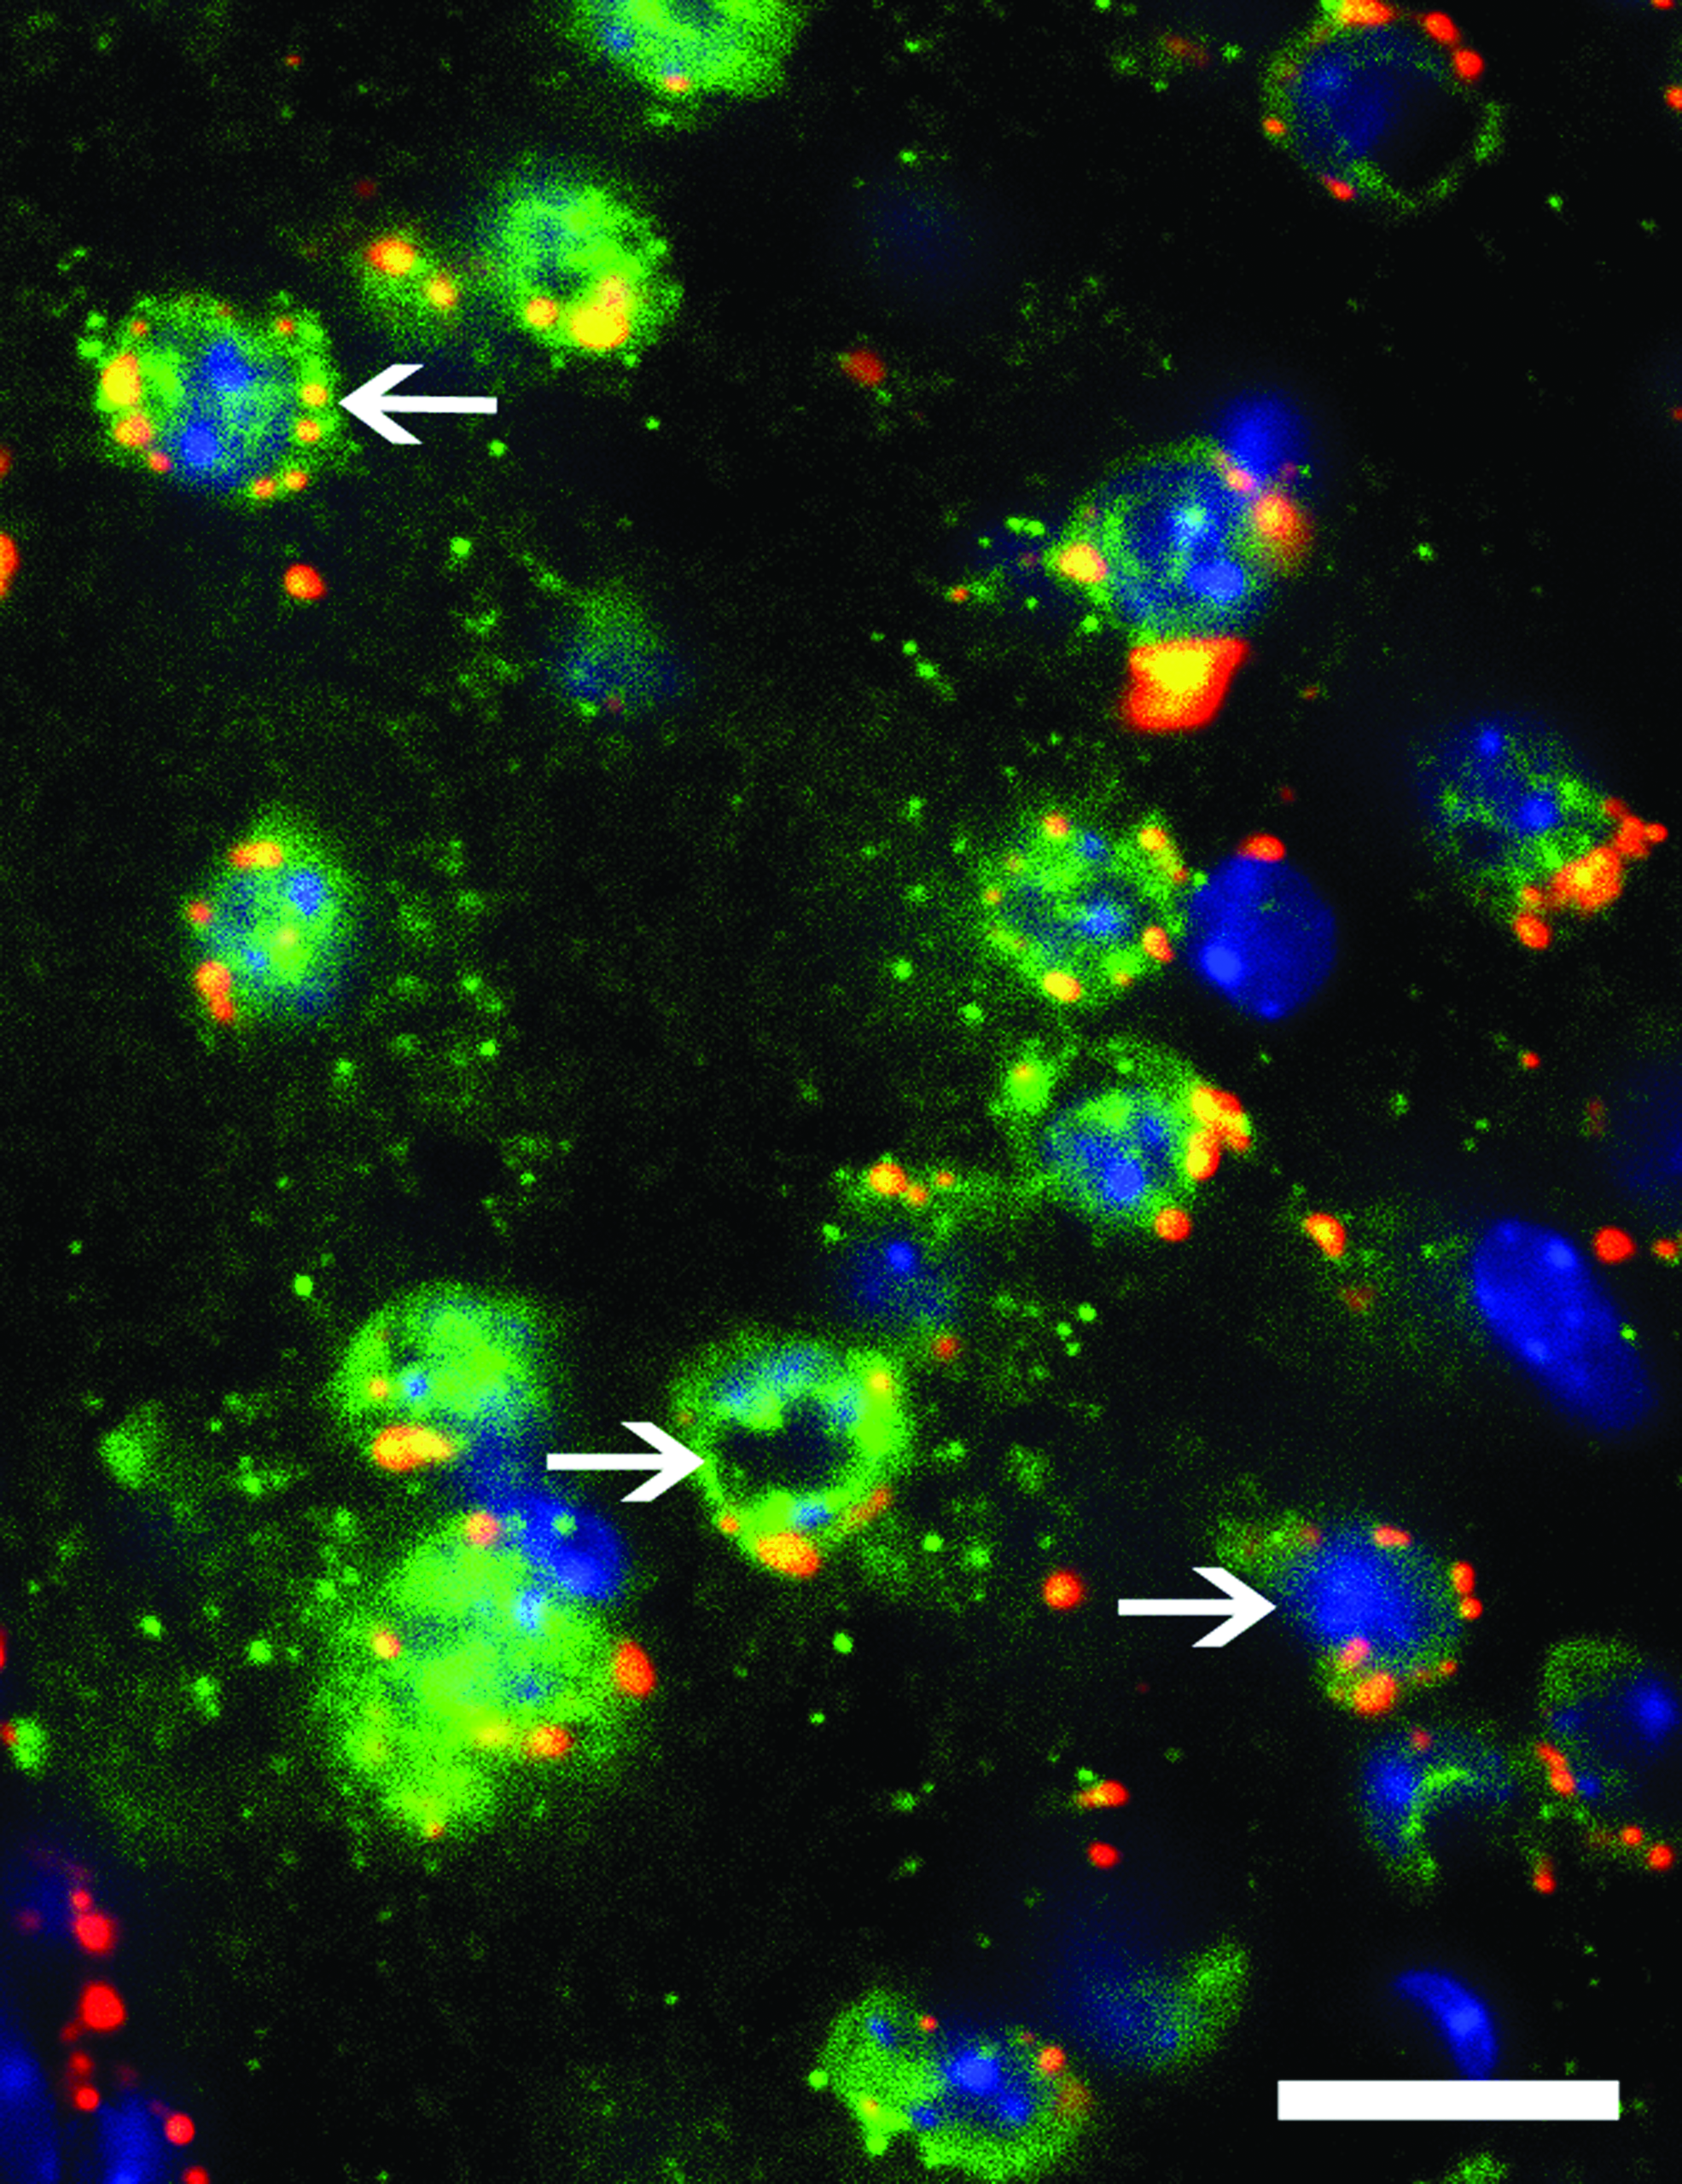
High-power confocal photomicrograph taken from a sagittal brain section of a mouse containing the striatum stained for NeuN and Hoechst 1 week post-infusion with labeled oligonucleotide. The arrows show punctate cytoplasmic distribution of the oligonucleotide; scale bar = 20 μm. Color images available online at www.liebertpub.com/nat
Labeled oligonucleotide was taken up preferentially by neurons, as indicated by double staining with neuronal and glial-specific antibodies (Figs. 3 and 4). The absence of colocalization (oligonucleotide and GFAP) was consistent in all structures of interest and across all animals and time points. At 24 h post-infusion, the extracellular distribution of oligonucleotide started to become less apparent, and the oligonucleotides were found inside the cells, specifically in the hippocampus and the dentate gyrus (Fig. 2B). Forty-eight hours post-infusion was characterized by enhanced neuronal uptake of the labeled oligonucleotide (Figs. 3B and 5).
Over time, the oligonucleotide was mainly found in the cytoplasm, and less often in the nucleus, shown by the colocalization of NeuN with oligonucleotide, whereas the oligonucleotide was not colocalized with Hoescht (Fig. 5). Moreover, the oligonucleotide observed in the cytoplasmic region was more punctate (Figs. 3 and 5).
Discussion
We found that after ICV administration of a 2′-O-methyl PS oligonucleotide, it distributed through CSF bulk flow. The oligonucleotide moves from the injection site in the lateral ventricle and circulates along the natural fluid passages and pools to be finally absorbed into the brain venous system. The distribution of oligonucleotide was different for specific brain structures and cell groups, and the ICV delivery route was an effective and easy way for oligonucleotide to spread from the injection site (in the ventricles) to the regions along the pathway of CSF drainage.
As we hypothesized, this study demonstrates that there is a time-dependent distribution of oligonucleotide across the brain, shown by a sequential and progressive uptake of oligonucleotide. Up to 12 h after infusion, the oligonucleotide appeared to be diffused homogeneously mainly in the extracellular space of the structures close to the ventricles. Infused oligonucleotide may bind to components of the extracellular matrix such as laminin and fibronectin [22,23], which might explain why in earlier time points the oligonucleotide is mainly found extracellularly. Over time, the oligonucleotide's distribution pattern became more intracellular (Fig. 3A, B).
It has been a matter of discussion whether bolus administration or continuous infusion is better to reach a desirable therapeutic level of the drug. Some studies show that after bolus injection into the lateral ventricle, oligonucleotide is rapidly cleared out. They suggest continuous delivery to assure penetration into the subependymal brain tissue [13,24]. In contrast, we demonstrated an extensive distribution and marked cellular uptake after bolus administration, showing that a single ICV infusion is an efficient method of delivery. This is in line with some earlier studies as well [25].
After ICV infusion, the oligonucleotide should cross the ependymal cell layer of the ventricular system to enter the brain parenchyma. This is shown as high signal gradient from the ependyma towards surrounding tissue around the ventricles at 3 h post-infusion (Fig. 1A). The infused oligonucleotide circulates along CSF flow and pools to be finally absorbed into the brain venous blood [26]. In line with this, we observed that the oligonucleotide was cleared into the brain vasculature, shown by an intense fluorescent labeling in the endothelium of small vessels by 6 h after infusion (Fig. 1B). Thereafter, the labeled blood vessels kept on being more visible while extracellular space was getting clear over time. Meanwhile, the oligonucleotide started to appear increasingly intracellular specifically in the striatum and the neocortex.
In line with older studies [17], we also observed that shortly after infusion, the labeled oligonucleotide did not reach regions remote from the ventricles. Seemingly, the CSF minor pathway, which is slower than the major CSF pathway, carries the oligonucleotide from the ventricular system towards the subarachnoid space through the brain parenchyma.
Among all time points, 48 h post-infusion seems to be a milestone in distribution of the oligonucleotide after ICV infusion. At this time point the areal distribution of the oligonucleotide reaches its maximum, whereas signal density starts reducing probably because of washout. Besides, key structures such as the cerebellum, striatum, hippocampus, OBs, and tectum (superior and inferior colliculi) show highest signal density.
Besides investigating the distribution pattern within a comprehensive time frame, we also explored the uptake of the oligonucleotide by neurons and glial cells. NeuN/GFAP immunostainings (Figs. 3 and 4) showed that the oligonucleotide is preferentially taken up by neurons. As reported previously [15], some oligonucleotides tend to be preferentially taken up by neurons, probably because of the specific chemical composition of these molecules. The pattern of oligonucleotide distribution was punctate, mainly in the cytosol, in line with similar studies [12].
Similar to previous findings [15], we found unlabeled areas in the cells, which colocalize with the nuclear DNA stained with Hoescht (Fig. 5). Possibly, the nuclear membrane prevents this oligonucleotide entering the nucleus. In contrast, some have demonstrated that the sine qua non of antisense activity appears to be nuclear localization [11]. The specific oligonucleotide used in this study seems not to enter the nucleus. This observation might raise concern, because the nucleus is the site of action for some AONs. Although this is valid for some approaches, such as exon skipping [27], it is not a mandatory criterion for the effectiveness of all antisense approaches. For instance in mutant Htt lowering strategies, such concerns become dispensable [28]. Another concern raised with the labeled oligonucleotide is that the labeling might alter the chemical properties and kinetic of the oligonucleotide. Using AON labeled with Cy3, some studies have shown therapeutic effects in cancer, in which AON was found in the nucleus [29–33], showing that the Cy3 label neither impairs the AON to enter the nucleus nor its effectiveness.
Close to the corpus callosum in the somatomotor, somatosensory, and visual cortices, there were hardly any labeled oligonucleotide, suggesting that white matter would act like a barrier for oligonucleotide to cross. Interesting enough and in line with the work of Szklarczyk and Kaczmarek [15], the adjacent white matter, that is, the cingulum and corpus callosum, serves as a barrier for oligonucleotide to spread, shown by the less intense red dye in the cortex above the corpus callosum (Figs. 1 A–F).
In this study, we used ICV bolus infusion as a delivery method, which has several advantages over systemic delivery. As such, it results in immediate desirable compound concentration in the CSF, and peripheral organs do not influence the pharmacokinetic of the compound [12]. It has been shown that after an intravenous injection of radiolabeled AON, its concentration in the brain is significantly lower than in other tissues, for example, up to 1,000-fold lower than in the kidney and liver [16]. Based on previous publications, no difference has been reported for male and female mice in responding to AON therapy [34]. Therefore, we did not expect gender-induced difference in oligonucleotide's pharmacokinetic between male and female mice. Thus only male mice were used in this study.
The penetration observed here suggests the possibility of targeting both leptomeningeal and intraparenchymal diseases. Nonetheless, it should be noted that we only examined a single oligonucleotide with a particular sequence, chemistry, and dosing regimen. Therefore, these finding should be interpreted carefully when generalizing to other types of oligonucleotides. Although the oligonucleotide labeling was performed with a highly reliable method, additional validation is needed to verify that these findings are not because of distribution of the Cy3 label rather than the labeled oligonucleotide.
Conclusion
Our results indicate that oligonucleotide delivered through ICV into the CSF reaches the most key structures in the brain. These findings enlighten the kinetic and distribution pattern of oligonucleotide in the brain and will direct more rational and effective use of ICV drug delivery and unleash its full therapeutic potential in managing CNS diseases.
Footnotes
Acknowledgment
Financial support for this study was provided by the Netherlands Organization for Health Research and Development (ZonMW) to Y.T.
Author Disclosure Statement
No competing financial interests exist.