
Abstract
Rhabdomyosarcoma (RMS) is a soft tissue sarcoma and is most frequently found in children. In RMS, there are two major subtypes, that is, embryonal RMS and alveolar RMS (ARMS). ARMS has exclusively the worse prognosis and is caused by formation of the chimeric PAX3-FOXO1 gene. Regarding cancer, the Warburg effect is known as a feature of cancer-specific metabolism. Polypyrimidine tract-binding protein 1 (PTBP1), a splicer of pyruvate kinase muscle (PKM) mRNA, is a positive regulator of cancer-specific energy metabolism. We investigated the expression and effects of muscle-specific miR-1 and miR-133b on RMS cells (RD, KYM-1, Rh30, and Rh41) from the view of energy metabolism and regulation of the chimeric gene. As a result, downregulated miR-1 and miR-133b/upregulated PTBP1 were found in RMS cell lines as well as in RMS clinical cases. Ectopic expression of either miR in both types of RMS cells induced autophagic cell death through silencing of PTBP1. Interestingly, we validated that miR-133b also knock downed PAX3-FOXO1. Moreover, we found that PAX3-FOXO1 positively regulated the PKM2-dominant expression through enhanced expression of PTBP1. These findings suggest that the miR-1 and miR-133b/PTBP1 axis and miR-133b/PAX3-FOXO1/PTBP1 axis contributed to the maintenance of cancer-specific energy metabolism.
Introduction
R
The Warburg effect is a cancer-specific energy metabolism [8]. In this regard, glycolysis is mainly achieved by the expression of pyruvate kinase muscle (PKM) isoforms, which are rate-limiting glycolytic enzymes. PKM has two isoforms, that is, PKM1 and PKM2, which are produced by alternative splicing of transcripts of the PKM gene [9] (Supplementary Fig. S1; Supplementary Data are available online at www.liebertpub.com/nat). PKM1 promotes the TCA cycle; and PKM2, the glycolytic pathway. Alternative splicing of transcripts of the PKM gene is performed mainly by polypyrimidine tract-binding protein (PTBP1), a member of the heterogeneous nuclear ribonucleoprotein (hnRNP) family. PTBP1 is closely associated with the expression of PKM2, because PTBP1 splices the mRNA of the PKM gene such that PKM2 mRNA, having exon 10 but lacking exon 9 of the PKM gene, is produced [10,11]. So, the glycolytic phenotype is achieved by increasing the expression of PKM2. Therefore, it was not surprising that we found the expression levels of PTBP1 and PKM2 to be elevated in tumor samples from the patients and in RMS cancer cell lines compared with those from normal tissues and cell lines, respectively. Based on these findings, we focused on microRNAs (miRNAs) silencing PTBP1, which we earlier designated as PTBP1-associated miRNAs [12]. MiRNAs are a class of small noncoding transcripts that regulate gene expression by inhibiting the translation of mRNAs by binding to them [13,14]. Moreover, there are many reports about a relationship between miRNAs and cancer [15–17]. Among the PTBP1-associated miRNAs, miR-124 shows an antitumor effect through the silencing of PTBP1 in colorectal cells [18]; and the expression of the antitumor miR-1 and miR-133 is limited to muscle tissue [19–21]. Most studies on miRNA in RMS reported so far were focused on miR-206. MiR-206 inhibits the growth and promotes the differentiation of RMS both in vitro and in vivo [22–25]. Moreover, miR-206 is available as a biomarker of RMS [7,26]. Then, we investigated the effects of muscle-specific miR-1 and miR-133b in RMS cells from the view of energy metabolism and regulation of the chimeric PAX3-FOXO1.
In this study, we demonstrated that the expression levels of muscle-specific miR-1 and miR-133b were downregulated in RMS cells and that the ectopic expression of miR-1 and miR-133b in RMS cells showed an antitumor effect by inducing autophagic cell death through the silencing of PTBP1. Interestingly, miR-133b also directly downregulated the PAX3-FOXO1 chimeric gene in ARMS cells. Moreover, the knockdown of PAX3-FOXO1 reduced the expression of PTBP1, resulting in the PKM1-dominant expression. Thus, we demonstrated that miR-1 and miR-133b, which are muscle-specific miRNAs, functioned as tumor suppressor miRs through lessening of the glycolytic phenotype by downregulating the expression of PTBP1 and the PAX3-FOXO1 chimeric gene and that the PTBP1-associated miRs/PAX3-FOXO1 network acting in sarcoma-specific energy metabolism was crucial to the maintenance of tumor cell growth and played a central role in sarcoma-specific energy metabolism.
Materials and Methods
Cell culture and cell viability
Human ERMS cell lines (RD and KYM-1) and ARMS cell lines (SJ-Rh30 [Rh30] and SJ-Rh41 [Rh41]) were used. ERMS cell lines were obtained from the JCRB (Japanese Collection of Research Bioresources) Cell Bank. ARMS cell lines were provided by Hosoi et al. The medium used to culture human ERMS cell line RD was Eagle's minimal essential medium; that for human ERMS cell line KYM-1, a 1:1 mixture of Dulbecco's modified Eagle's medium and Ham's F12 medium; that for human ARMS cell lines Rh30 and Rh41, RPMI-1640 medium. All media were supplemented with 8% (v/v) heat-inactivated fetal bovine serum (Sigma-Aldrich Co., St. Louis, MO) and 2 mM
Transfection experiments
All cells were seeded in six-well plates at a concentration of 0.5 × 10⁵ per well (10%–30% confluence) on the day before transfection. The mature type of miR-1 and miR-133b (mirVana™ miRNA mimic; Ambion, Foster City, CA), antagomiR-1 and antagomiR-133b (mirVana™ miRNA inhibitor; Ambion) or siRNAs for PTBP1 and PAX3-FOXO1 (siR-PTBP1 [12] and siR-PF2 [27], respectively; Invitrogen, Carlsbad, CA) were used for the transfection of the cells, which was achieved by using cationic liposomes, Lipofectamine™ RNAiMAX (Invitrogen), according to the manufacturer's lipofection protocol. The nonspecific control RNA (HSS, Hokkaido, Japan) sequence was 5′-GUAGGAGUAGUGAAAGGCC-3′, which was used as a control for nonspecific effects [28]. The sequence of the mature type of miR-1 used in this study was 5′-UGGAAUGUAAAGAAGUAUGUAU-3′; that of miR-133b, 5′-UUUGGUCCCCUUCAACCAGCUA-3′; that of siR-PTBP1, 5′-AUCUCUGGUCUGCUAAGGUCACUUC-3′; and that of siR-PF2, 5′-UGAAUUCUGAGGUGAGAGG-3′. The effects manifested by the introduction of miR-1, miR-133b, and siRNAs into the cells were assessed at 48 h or 72 h after the transfection.
Inhibitor agents
An autophagy inhibitor, 3-methyladenine (3-MA), was obtained from Calbiochem (San Diego, CA) and free-radical scavenger N-acetyl-
Western blotting
Whole cells were homogenized in chilled lysis buffer comprising 10 mM Tris-HCl (pH 7.4), 1% NP-40, 0.1% deoxycholic acid, 0.1% SDS, 150 mM NaCl, 1 mM EDTA, and 1% protease inhibitor cocktail (Sigma-Aldrich Co.) and stood for 20 min on ice. After centrifugation at 13,000 rpm for 20 min at 4°C, the supernatants were collected as whole-cell protein samples. Protein contents were measured with a DC protein assay kit (Bio-Rad, Hercules, CA). Ten micrograms of lysate protein was separated by SDS-PAGE using 10.0% or 12.5% polyacrylamide gels, and electroblotted onto a PVDF membrane (PerkinElmer Life Sciences, Inc., Boston, MA). After blockage of nonspecific binding sites for 1 h with 5% nonfat milk in phosphate-buffered saline (PBS) containing 0.1% Tween 20 (TBS-T), the membrane was incubated overnight at 4°C with primary antibodies. The next day, the membrane was then washed three times with TBS-T, incubated further with secondary antibodies at room temperature for 1 h, and then washed three times with TBS-T. The immunoblots were visualized by use of Amersham ECL Plus Western Blotting Detection Reagents (GE Healthcare, Buckinghamshire, United Kingdom). Primary antibodies used were as follows: anti-PTBP1, LC3B, GAPDH, FOXO1 (Cell Signaling Technology, Inc., Danvers, MA); anti-PKM1 or PKM2 (Novus Biologicals); and anti-PAX3 (R&D systems, Minneapolis, MN). Horseradish peroxidase (HPR)-conjugated goat anti-rabbit and horse anti-mouse IgG (Cell Signaling Technology) were used as secondary antibodies. Glyceraldehyde-3-phosphate dehydrogenase (GAPDH) was used as an internal control.
Real-time reverse transcription-polymerase chain reaction
Total RNA was isolated from cultured cells or tumor tissues by using a NucleoSpin microRNA isolation kit (TaKaRa, Otsu, Japan). RNA concentrations and purity were assessed by UV spectrophotometry. RNA integrity was checked by formaldehyde gel electrophoresis. To determine the expression levels of miR-1 and miR-133b, we conducted quantitative RT-PCR (qRT-PCR) by using TaqMan MicroRNA Assays (Applied Biosystems) and THUNDERBIRD Probe qPCR Mix (TOYOBO Co., Ltd., Osaka, Japan) according to the manufacturer's protocol. RNU6B was used as an internal control. For determination of the expression levels of PTBP1, PAX3-FOXO1, and GAPDH mRNAs, total RNA was reverse-transcribed with a PrimeScript RT reagent kit (TaKaRa). Real-time PCR was then performed with primers specific for them by using THUNDERBIRD SYBR qPCR Mix (TOYOBO). The primers for PTBP1, PAX3-FOXO1, and GAPDH were the following: PTBP1-sense, 5′-ATC AGG CCT TCA TCG AGA TGC ACA-3′ and PTBP1-antisense, 5′-TGT CTT GAG CTC CTT GTG GTT GGA-3′; PAX3-sense, 5′-GAG ACT GGC TCC ATA CGT CC-3′ and FOXO1-antisense, 5′-TGA ACT TGC TGT GTA GGG ACA G-3′; GAPDH-sense, 5′-TCT AGA CGG CAG GTC AGG TCC ACC-3′ and GAPDH-antisense, 5′-CCA CCC ATG GCA AAT TCC ATG GCA-3′. RNU6B and GAPDH were used as internal controls. The relative expression levels were calculated by the ΔΔCt method.
Luciferase reporter assay
Searching the TargetScan 7.1 database (www.targetscan.org/) to find algorithm-based binding sites of miR-1 or miR-133b, we found the predicted binding site to be at position 45–51 for miR-1 and at 1031–1038 for miR-133b in the 3′UTR of PTBP1 mRNA and at positions 4073–4078 and 5384–5389 for miR-133b in the 3′UTR of FOXO1 mRNA. The sequence region containing the putative binding sequence of miR-1 or miR-1-133b was inserted into a pMIR-REPORT™ Luciferase miRNA Expression Reporter Vector (Applied Biosystems) according to the manufacturer's protocol. Moreover, we made other pMIR constructs, one encompassing a mutated seed sequence for miR-1 (wild type, CAUUCCA; mutant, CAGGACA) and the other, for miR-133b (PTBP1: wild type, GGACCAAA; mutant, GGCAAAAA/FOXO1(4073–4078): wild type, GACCAAA; mutant, GUGGAAA/FOXO1(5384–5389): wild type, GACCAA; mutant, GUGGAA) by using a PrimeSTAR® Mutagenesis Basal Kit (TaKaRa). The mutation of the vector was confirmed by sequence analysis. pRL-TK Renilla Luciferase Reporter vector (Promega) was used as an internal control vector. RD and Rh30 cells were seeded into 96-well plates at a concentration of 0.5 × 10⁴ per well on the day before the transfection. The cells were cotransfected with reporter vector (0.01 μg/well each) and 20 nM miR-1, miR-133b or nonspecific noncoding siRNA (Dharmacon, Tokyo, Japan). Luciferase activities were measured at 24 h after cotransfection by using a Dual-Glo Luciferase Assay System (Promega) according to the manufacturer's protocol. Luciferase activities were reported as the firefly luciferase/Renilla luciferase ratio.
ATP assay
RD and Rh30 cells were collected at 72 and 48 h after the transfection with miRs or siR-PTBP1. ATP production was measured with an ATP Determination Kit according to the manufacturer's instructions (Invitrogen). ATP production was normalized to cell numbers.
Electron microscopic study
Rh30 cells treated or not with miR-1, miR-133b (20 nM), or siR-PTBP1 (5 nM) were harvested and rinsed with PBS. The cells were then fixed for 2 h with 2% paraformaldehyde and 2.5% glutaraldehyde in 0.2 M phosphate buffer (pH 7.4, PB), rinsed in PB, and postfixed in 2% osmium tetroxide for 2 h. After having been washed with PB, the cells were progressively dehydrated by passage through a 10% graded series of 30%–100% ethanol and then cleared in QY-1 (Nissin EM, Tokyo, Japan). Thereafter, they were embedded in Epon 812 resin (TAAB Laboratories Equipment, Reading, United Kingdom), and thin sections (70 nm thickness) were prepared. Finally, the sections were stained with uranyl acetate and lead citrate and examined by transmission electron microscopy with a Hitachi-7650 (Hitachi, Tokyo, Japan), operating at 80 kV.
Lactate assay
Rh30 cells were collected at 48 h after transfection. Lactate was measured with an L-Lactate Assay Kit according to the manufacturer's instructions (Cayman Chemical Company, Ann Arbor, MI). Lactate production was normalized to the number of cells.
Human tumor xenograft model
Animal experimental protocols were approved by the Committee for Animal Research and Welfare of Gifu University. BALB/cSLC-nu/nu (nude) mice were obtained from Japan SLC (Hamamatsu, Japan). Human RMS Rh30 cells were inoculated at 2.0 × 10⁶ cells/100 μL per site into the back of each mouse. The inoculation day was set as day 0. At 10 days after inoculation, we confirmed the engraftment of the tumors. After miR-1, miR-133b, or control RNA (0.2 nmol/1 administration) in 50 μL of Opti-MEM had been incubated with 1 μL of Lipofectamine RNAiMAX, the mixture was injected into the tumor two times per week. Each group contained three mice. In the cases in which the tumors had disappeared, we stopped the injections. The tumor volume was calculated by the following formula: 0.5236 L1 (L2)2, where L1 is the long axis and L2 is the short axis of the tumor. This formula was described in a previous report [29,30].
Patients and samples
This study was approved by the Institutional Review Board of Kyoto Prefectural University of Medicine. Informed consent was received from the healthy volunteers and the parents of patients. Patients were identified on the basis of histological examination of tumor specimens. Patient characteristics are summarized in Supplementary Table S1. Human total RNA master panel II (Clontech) as RNA of normal human tissues and skeletal muscle (SKM) cell total RNA (ScienCell Research Laboratories) as RNA of SKM cell were used for tissue distribution.
Statistics
Statistical significances of differences were evaluated by performing the two-sided Student's t-test. In the case of the volume of the tumors xenografted into mice, the data were compared by using the Mann–Whitney U-test. In the analyses of the clinical samples, we performed statistical analysis using Pearson's correlation coefficient and TDIST function of Excel. A P value <0.05 was considered to be statistically significant.
Results
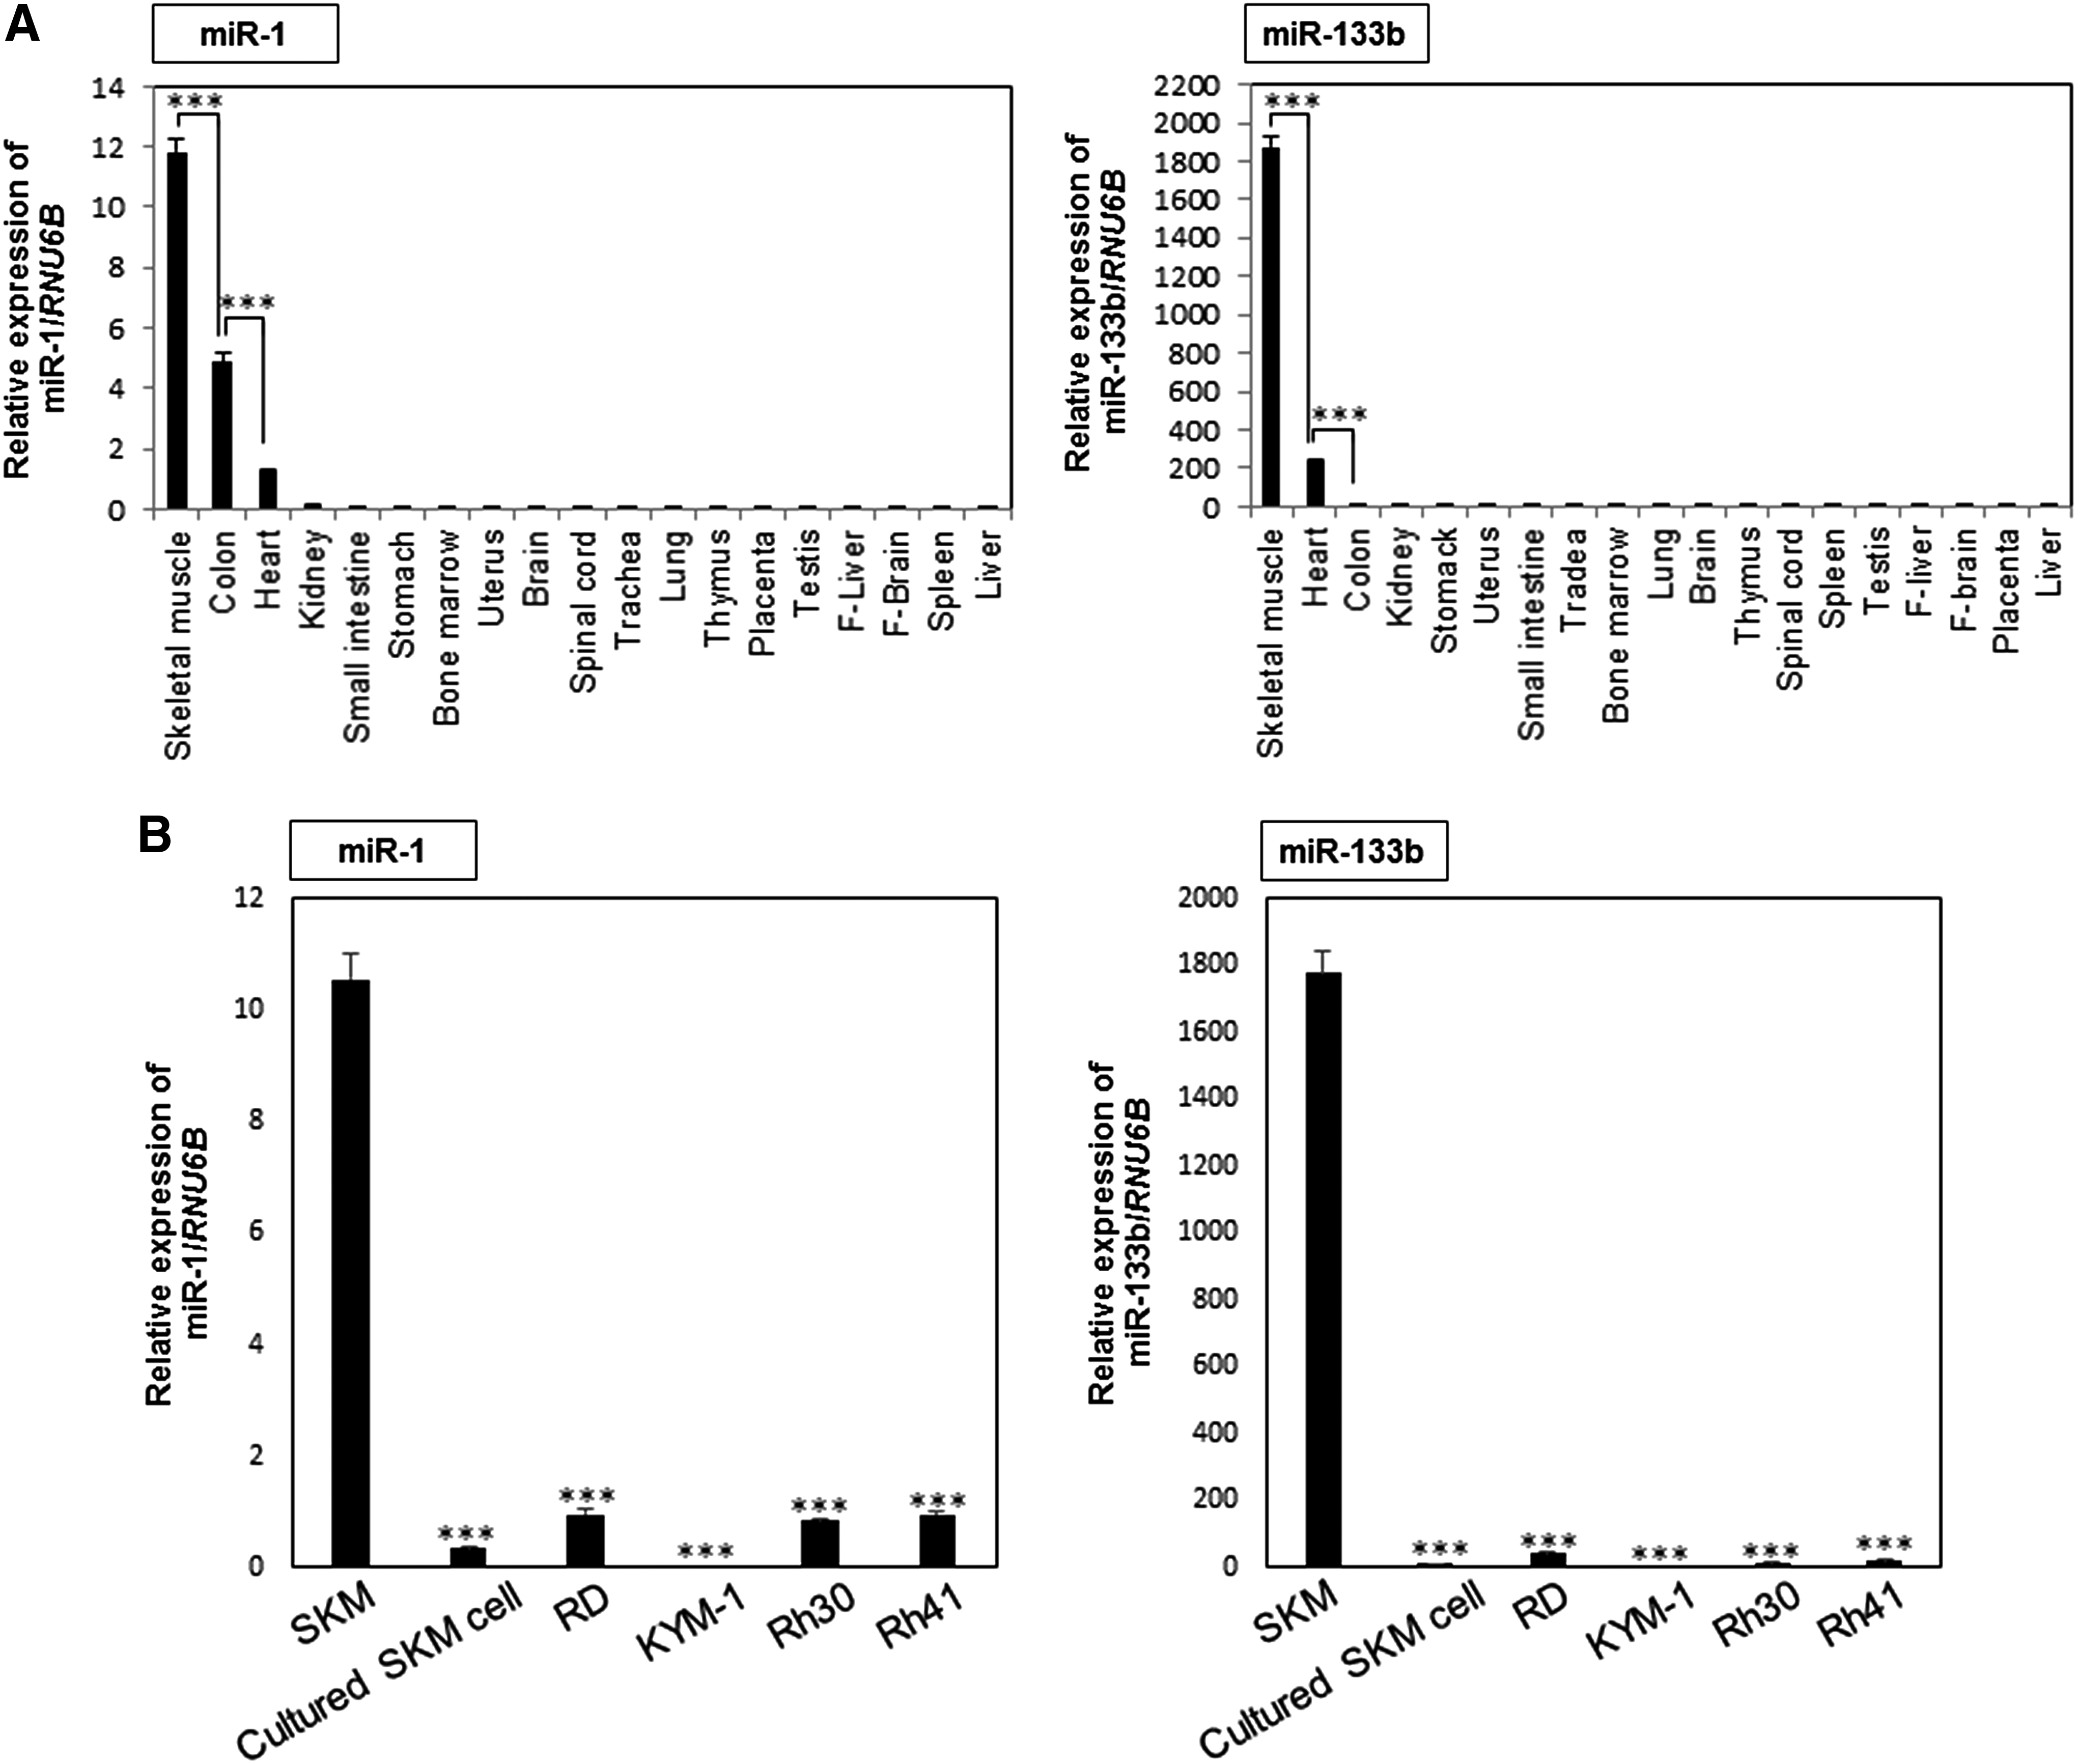
Muscle-specific miR-1 and miR-133b were downregulated in RMS cells
First, we examined the expression profiles of miR-1 and miR-133b in normal tissues. As a result, their expression levels were found to be quite high in the SKM tissue (Fig. 1A). Next, we examined the expression profiles of miR-1 and miR-133b in the 4 RMS cell lines by using RNA from ERMS cell lines (RD and KYM-1), ARMS cell lines (Rh30 and Rh41), SKM tissue, and cultured SKM cells as controls. The expression levels of miR-1 and miR-133b were markedly decreased in RMS cell lines compared with those in the SKM tissue sample (Fig. 1B). The levels of miR-1 and miR-133b in cultured SKM cells were also downregulated, as in the RMS cell lines tested. From these results, we considered that the cultured SKM cells were downregulated in their levels of miR-1 and miR-133b owing to proliferation. These findings suggest that miR-1 and miR-133b were negatively associated with the growth of SKM cells.
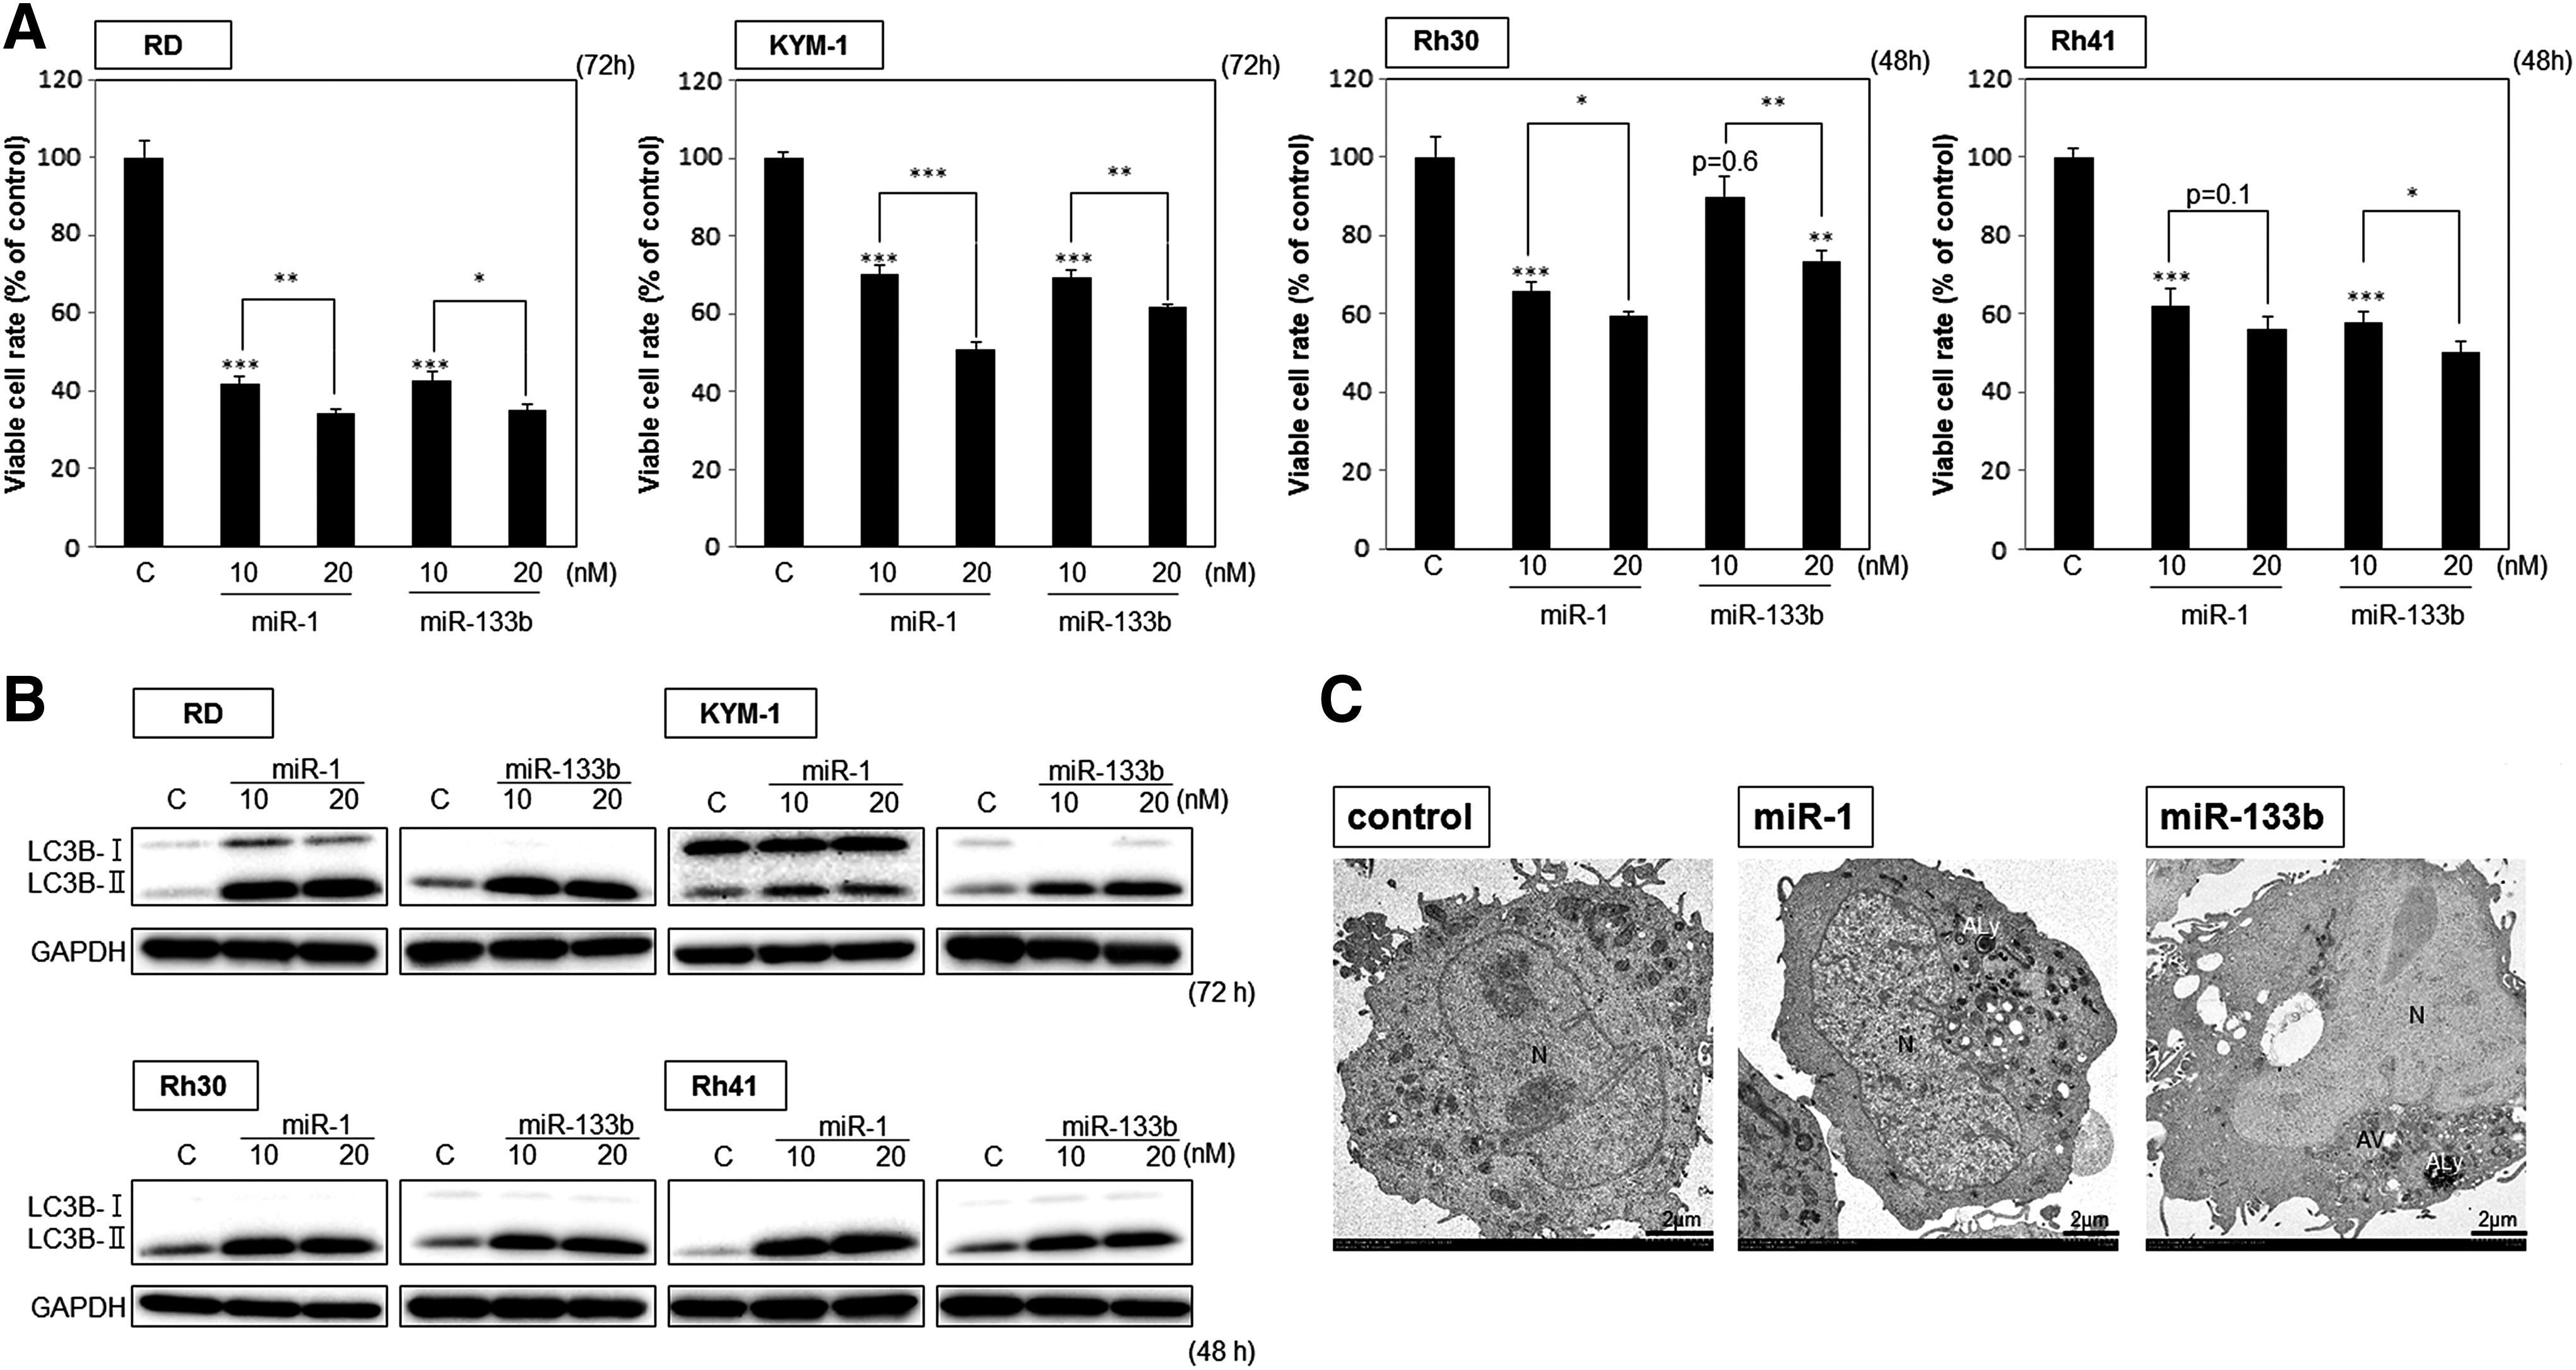
Transfection with miR-1 or miR-133b induced autophagic cell death in RMS cells
To examine the effect of miR-1 and miR-133b on the growth of RMS cell lines, we transfected RD, KYM-1, Rh30, and Rh41 cells with either miR-1 or miR-133b. As shown in Fig. 2A, the growth of all cell lines was significantly inhibited at a 10 nM concentration of either miR. Western blot analysis showed that the transition of LC3B-I to -II [31,32] was remarkable after the transfection of all cell lines tested (Fig. 2B), thus suggesting autophagy. The morphological study by electron microscopy clearly indicated autophagy in the transfected cells (Fig. 2C). Therefore, we confirmed this cell death through autophagy by using the autophagy inhibitor 3-MA [33]. 3-MA significantly canceled the autophagic cell death that had been induced by transfection of RD or Rh30 cells with miR-1 or miR-133b (Fig. 2D). In addition, we considered that the free radical scavenger NAC would cancel the autophagy elicited by miR-1 or miR-133b. NAC significantly canceled it, based on results of the reduced transition from LC3B-I to -II (Fig. 2E). These findings suggest that miR-1 and miR-133b functioned as tumor suppressor genes and that their increased expression induced autophagic cell death by free oxygen radicals in RMS cells.
PTBP1 was a direct target of miR-1 and miR-133b in RMS cells
Earlier, we reported that miRNAs can function to silence PTBP1, which modulates the expression of PKM1 and PKM2 by splicing the PKM mRNA; and so we designated such miRNAs as PTBP1-associated microRNAs. MiR-1 and miR-133b are PTBP1-associated miRNAs. As shown in Fig. 3A, the protein expression level of PTBP1 was significantly downregulated by transfection of all RMS cell lines with miR-1 or miR-133b, as estimated by western blot analysis. Interestingly, the protein expression profiles of PKM isoforms indicated a switch from the PKM2-dominant to the PKM1-dominant isoform, thus decreasing the PKM2/PKM1 ratio, by 48 or 72 h after the transfection. As shown in Fig. 3B, the results of the luciferase reporter assay indicated PTBP1 to be a direct target of both miR-1 and miR-133b. Furthermore, the treatment with antagomiR-1 or -133b significantly canceled the growth inhibition elucidated by miR-1 or miR-133b, respectively, and reversed the reduction in the expression level of PTBP1 protein (Fig. 3C). Based on these results, we concluded that miR-1 and miR-133b silenced PTBP1 and induced the switching of PKM isoforms from PKM2 to PKM1.
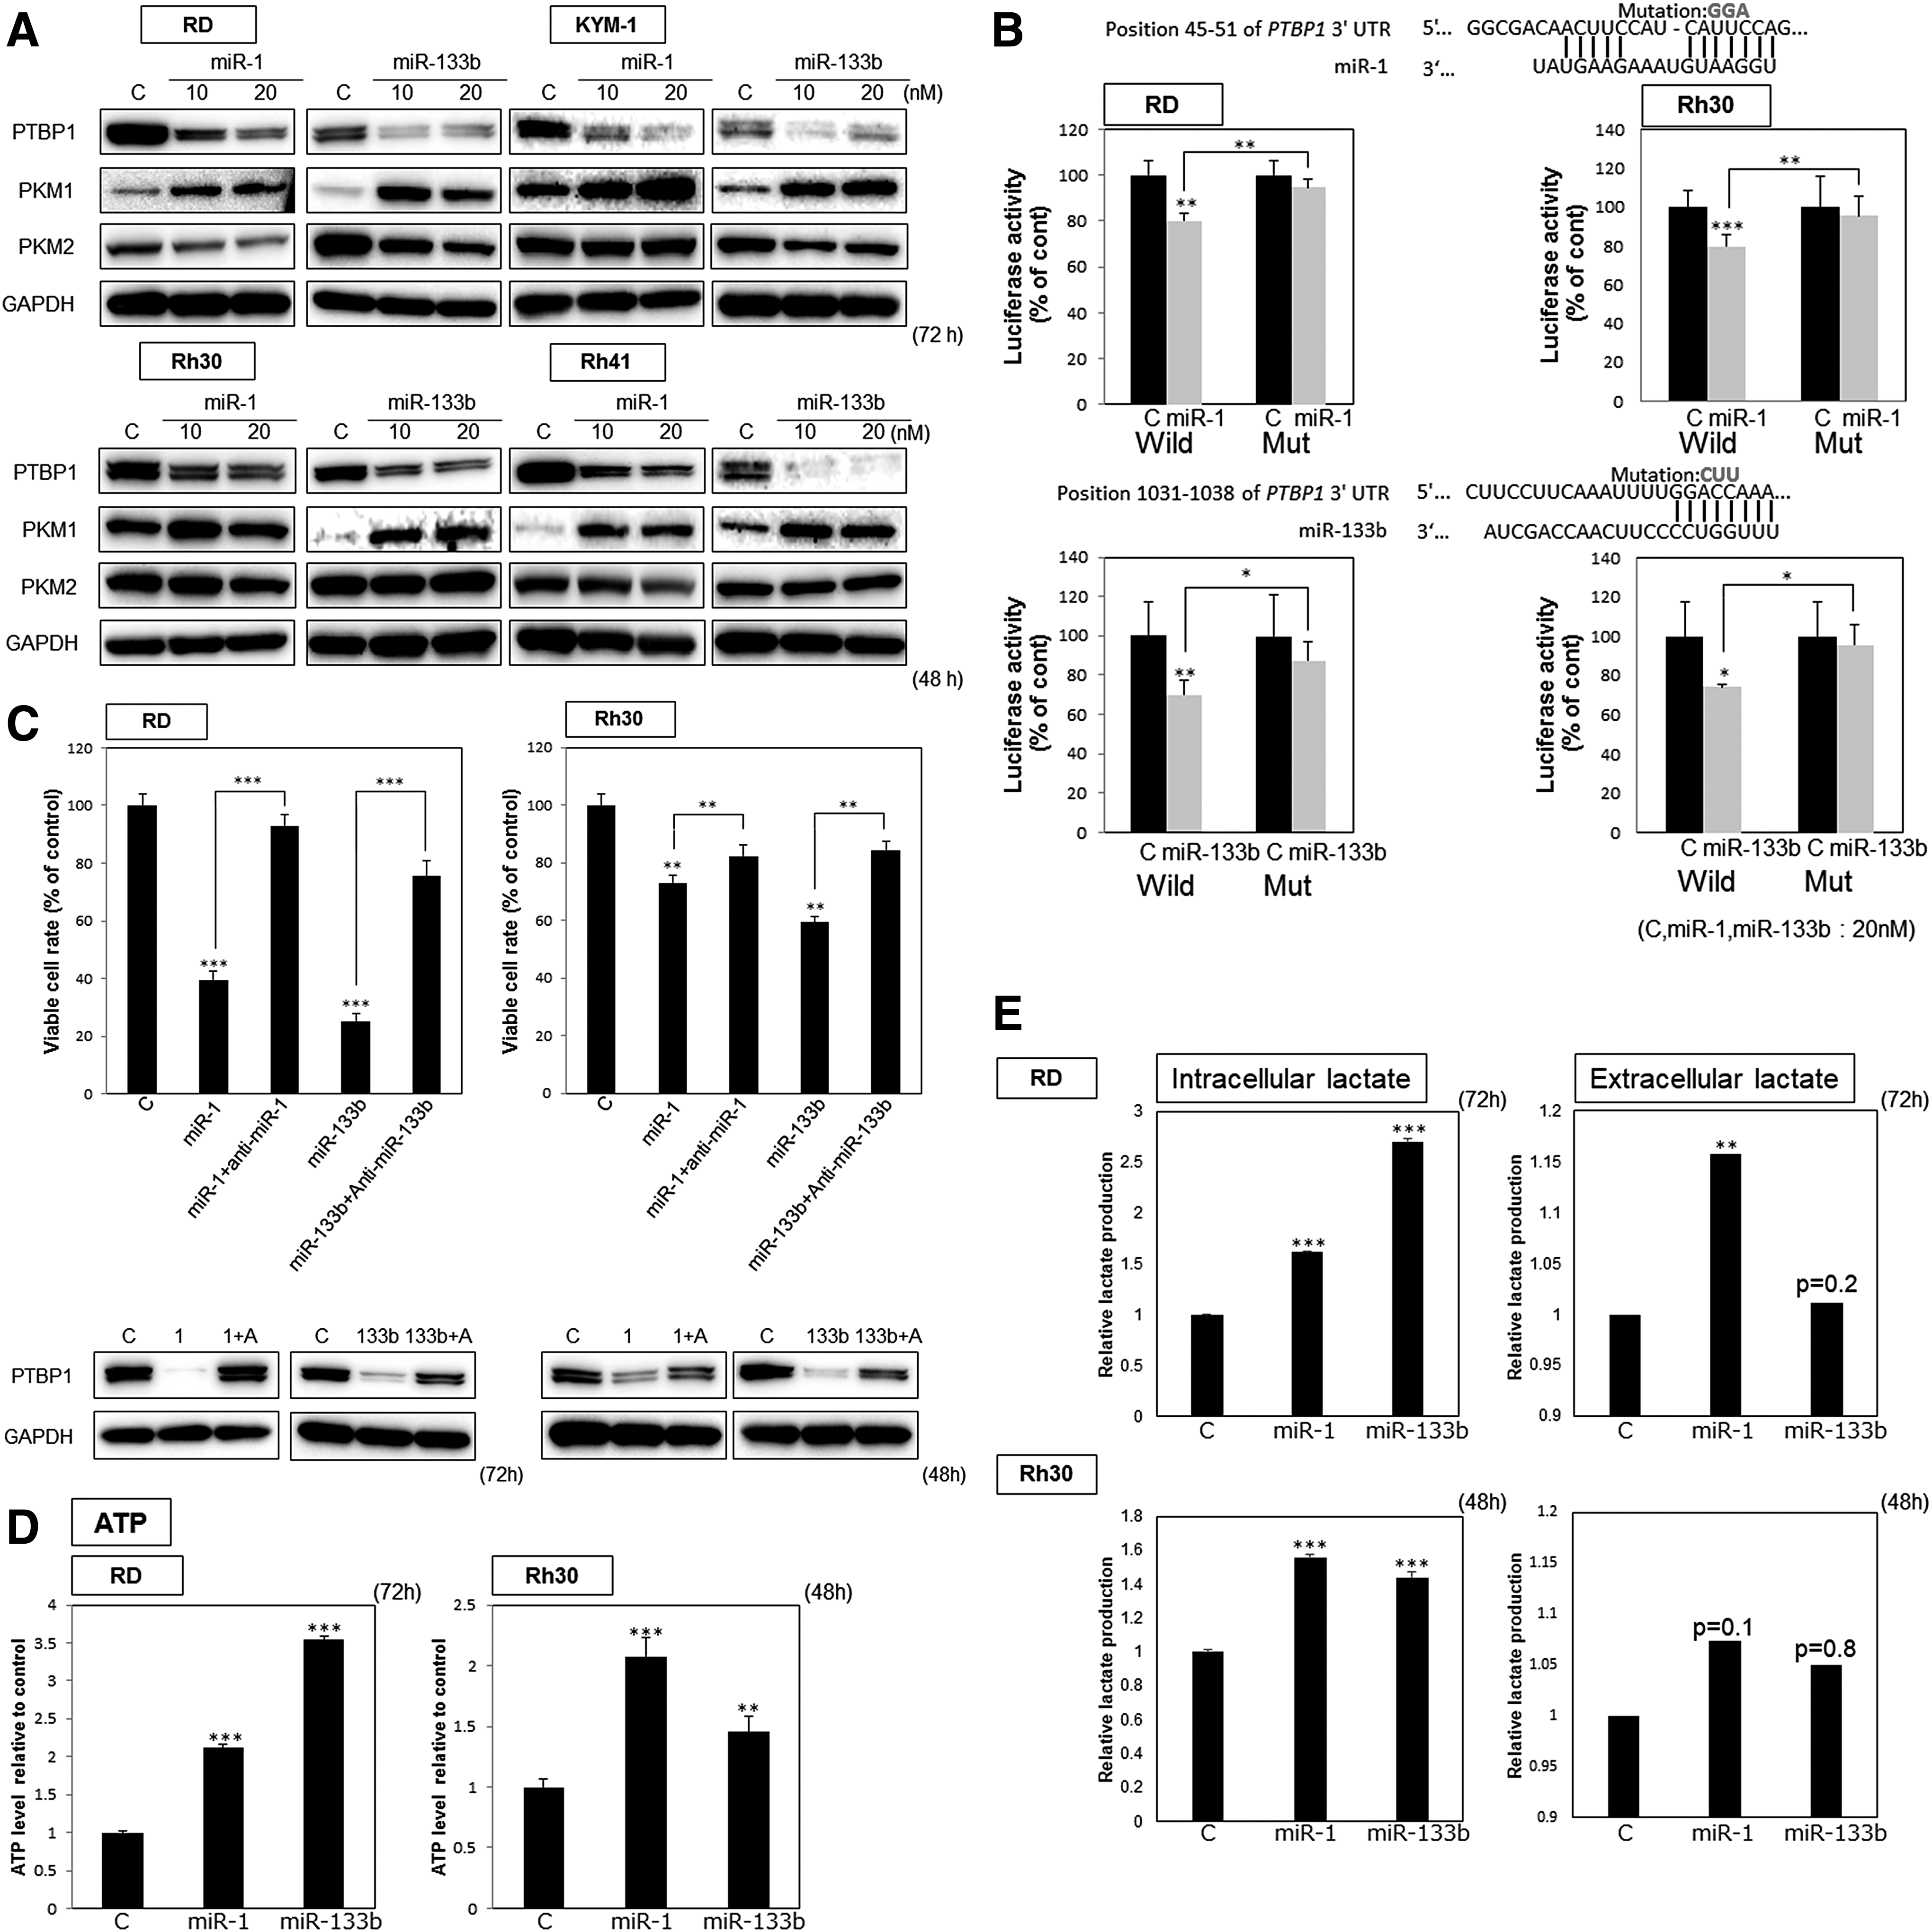
MiR-1 and miR-133b increased the intracellular ATP and lactate levels in RMS cells
We concluded that miR-1 and miR-133b downregulated PTBP1 and induced switching PKM isoforms from PKM2 to PKM1, resulting in growth inhibition. The ectopic expression of miR-1 and miR-133b also caused elevation of the intracellular ATP level (Fig. 3D), as well as that of the intracellular lactate level too (Fig. 3E).
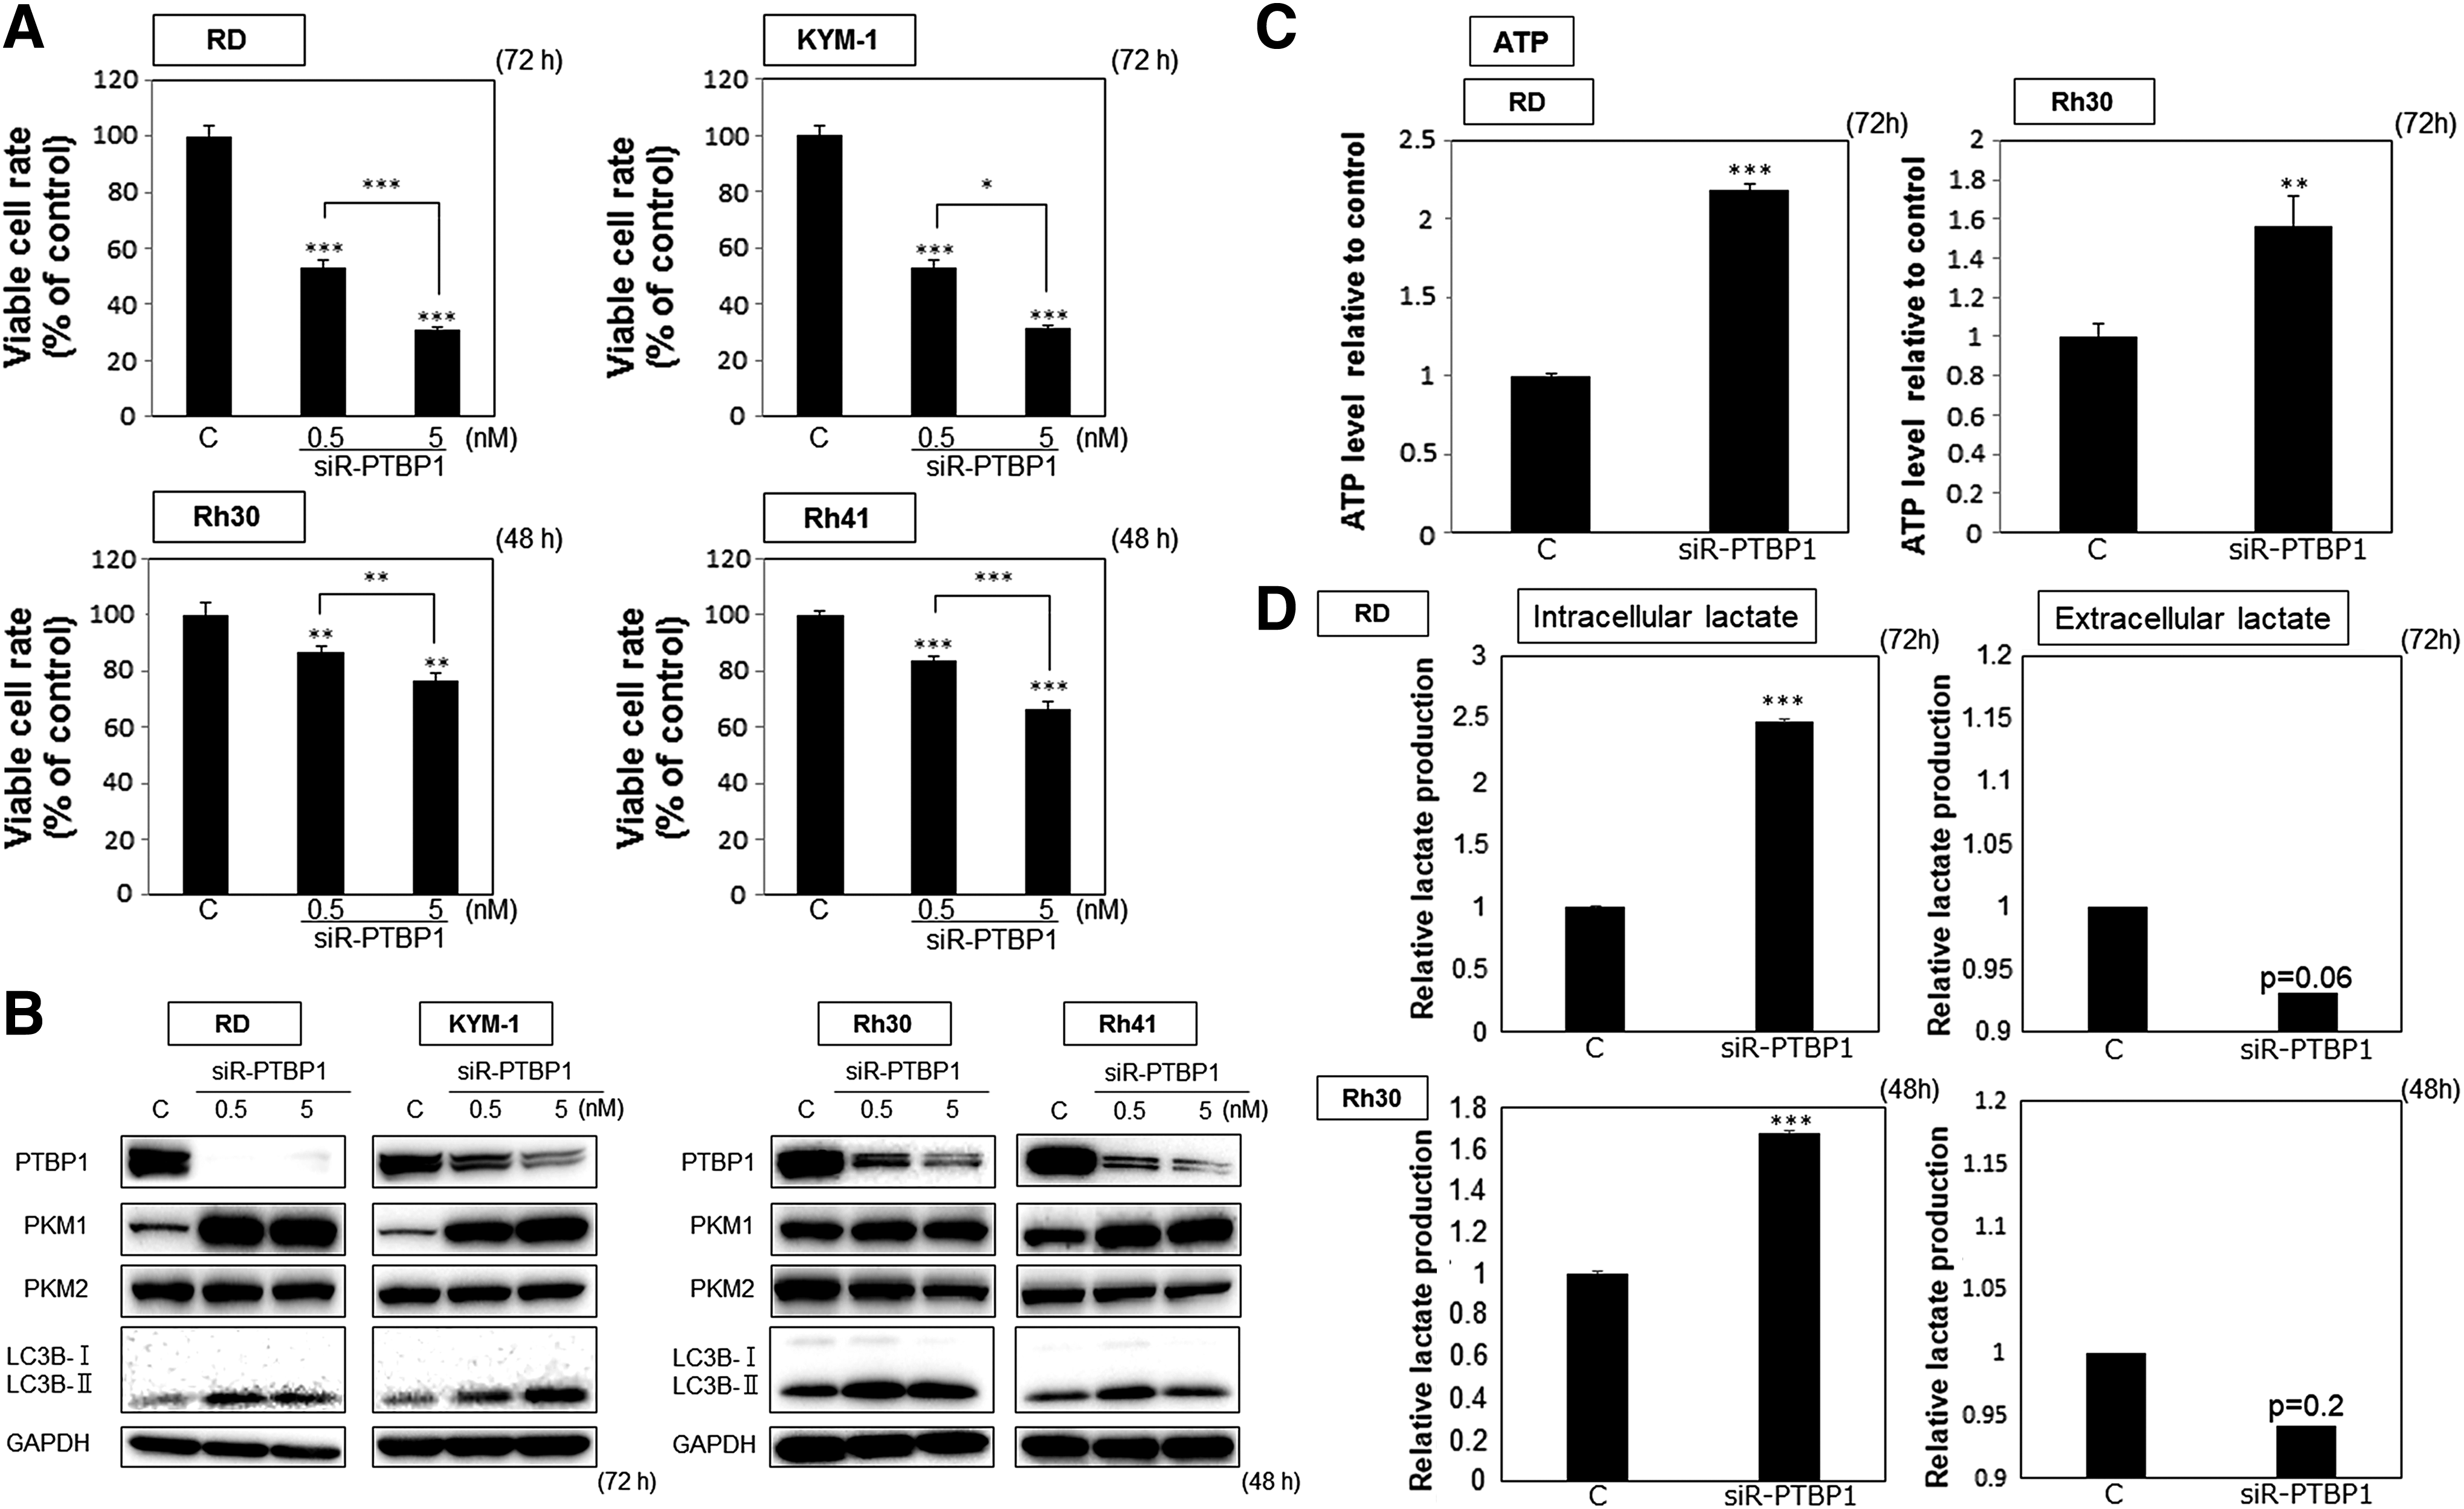
Gene silencing of PTBP1 also induced autophagic cell death in RMS cells
To test the function of PTBP1, which is a direct target of miR-1 and miR-133b, we silenced PTBP1 expression by using the siRNA for PTBP1, siR-PTBP1. The gene silencing of PTBP1 resulted in a marked growth inhibition in all RMS cell lines tested (Fig. 4A). Also, the switching from PKM2 to PKM1 was found (Fig. 4B), which change was similar to that observed in the case of transfection with miR-1 or miR-133b (Fig. 3A). Then, we also measured ATP and lactate levels to confirm the change in energy metabolism. Similarly, the ectopic expression of siR-PTBP1 induced an increase in both intracellular ATP (Fig. 4C) and lactate (Fig. 4D) levels. Biochemically, the LC3B-I to -II transition was also remarkable in all RMS cell lines at the same time (Fig. 4B). The morphological study by electron microscopy indicated typical autophagosomes and autolysosomes in the cells transfected with siR-PTBP1 (Fig. 4E). These data taken together demonstrated the induction of autophagy by the silencing of PTBP1, a result very similar to that observed for the ectopic expression of miR-1 or miR-133b. Moreover, we performed an experiment using the autophagy inhibitor 3-MA. As with transfection with miR-1 or miR-133b, 3-MA significantly reversed the decrease in the number of viable RD or Rh30 cells caused by transfection with siR-PTBP1 (Fig. 4F). Finally, we performed an experiment using a free radical scavenger, NAC. NAC significantly canceled the autophagy elicited by siR-PTBP1, based on the result of reduced transition from LC3B-I to -II (Fig. 4G). Taken together, these findings suggested that miR-1 and miR-133b may have perturbed sarcoma-specific energy metabolism, in part, through silencing PTBP1 in RMS cells, thus leading to growth inhibition by autophagic cell death caused by free radicals.
Effects of PTBP1 knockdown on cell growth
PAX3-FOXO1 chimeric mRNA is a direct target of miR-133b in ARMS cells
The increased expression of miR-1 and miR-133b showed a cell growth suppression effect by autophagic cell death through impairment of sarcoma-specific energy metabolism. Next, we examined the effects of miR-1, miR-133b, and siR-PTBP1 on the ARMS-specific chimeric gene PAX3-FOXO1.
First, we examined the mRNA expression levels of PAX3-FOXO1 in all four RMS cell lines. As a result, Rh30 and Rh41 cells, but not RD or KYM-1, expressed the PAX3-FOXO1 mRNA (Fig. 5A). Next, we examined the protein expression levels of PAX3-FOXO1 in the samples of Rh30 and Rh41 cells transfected with miR-1, miR-133b, or siR-PTBP1. Interestingly, the protein expression levels of PAX3-FOXO1 were decreased in the samples of either cell type that had been transfected with miR-133b or siR-PTBP1 (Fig. 5B). Importantly, the protein expression levels of FOXO1 were decreased in the samples of all RMS cell lines transfected with miR-133b (Fig. 5C). Therefore, these findings raised the possibility that FOXO1 was a direct target of miR-133b in RMS cell lines. Then, we investigated as to whether miR-133b directly bound with the 3′UTR region in FOXO1. From the TargetScan database, we could not obtain any evidence that miR-133b directly binds to FOXO1. However, microRNA can bind to the 3′UTR of targeting mRNA through matching 6mers in seed sequences [34]. So, we researched the predictive 3′UTR sequence for miR-133b in FOXO1. Interestingly, we found two regions where miR-133b could possibly bind to FOXO1. Then, we performed the luciferase reporter assay. As shown in Fig. 5D, the results of the luciferase reporter assay indicated FOXO1 to be a direct target of miR-133b. Furthermore, the treatment with antagomiR-133b significantly canceled the miR-133b-induced lowering of the protein expression level of FOXO1 and PAX3-FOXO1 in RD and Rh30 cells (Fig. 5E). Based on these results, we concluded that miR-133b silenced FOXO1 and PAX3-FOXO1.
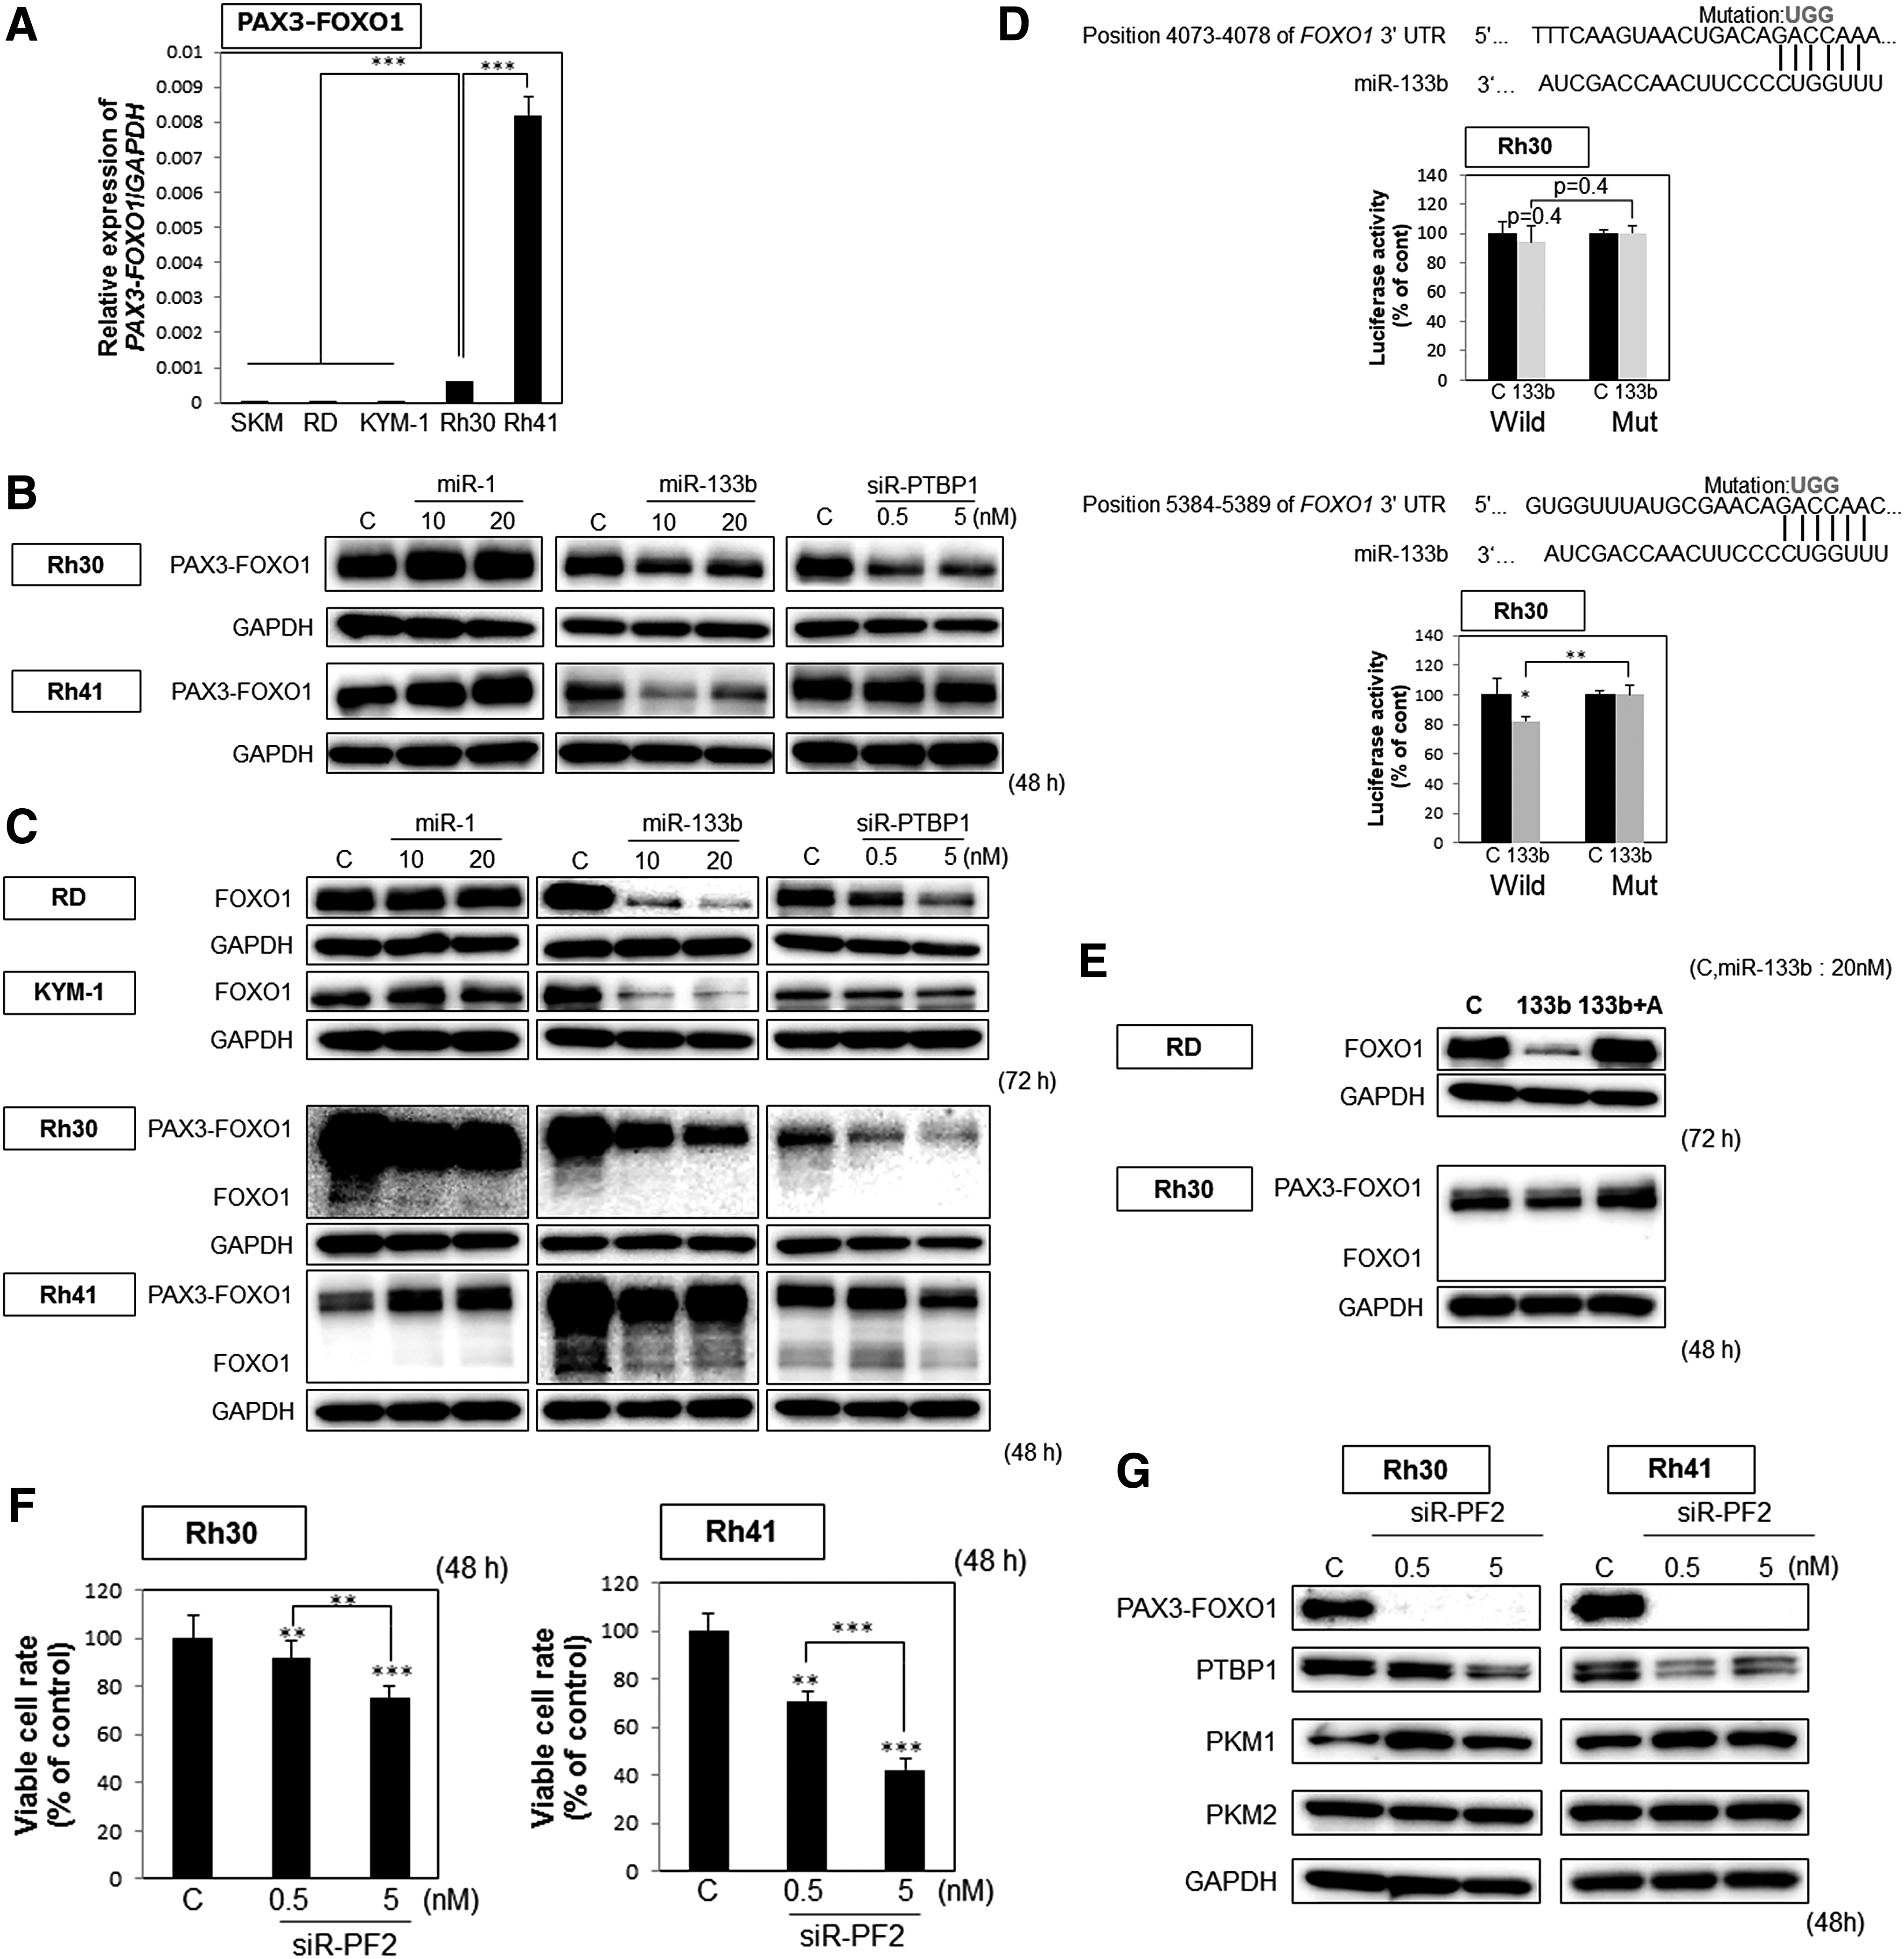
Silencing of PAX3-FOXO1 by siR-PF2 affected sarcoma-specific energy metabolism through downregulation of PTBP1
To test the function of PAX3-FOXO1, we silenced PAX3-FOXO1 expression by using the siRNA for PAX3-FOXO1, siR-PF2 [27]. The gene silencing of PAX3-FOXO1 resulted in a marked growth inhibition in ARMS cell lines (Fig. 5F) with siR-PF2 used at extremely low concentrations. Furthermore, we examined the protein expression of genes related to sarcoma-specific energy metabolism in the samples of ARMS cells transfected with siR-PF2. Interestingly, the protein expression levels of PTBP1 were significantly decreased in both cells (Fig. 5G), and the levels of PKM1 were increased in both. These findings suggest that PAX3-FOXO1 contributed to activation of sarcoma-specific energy metabolism at the upstream of PTBP1.
MiR-1 and miR-133b showed tumor growth suppressor effects on Rh30 cell xenografted tumor model mice
To examine the tumor growth suppressing effect of miR-1 or miR-133b in vivo, we inoculated ARMS Rh30 cells subcutaneously into nude mice. At 12 days after the inoculation, we sorted the animals into three groups and injected a solution containing control or miR-1 or miR-133b around the tumors. As a result, a significant suppression of tumor growth was observed in the group injected with either miR-1 or miR-133b, and western blot analysis using the tumor samples showed results similar to those obtained in vitro (Fig. 6A–C and Supplementary Fig. S2). These findings indicate that miR-1 and miR-133b exhibited tumor growth suppressing effects, in part, through downregulation of PTBP1 even in vivo.

The expression levels of PTBP1 were inversely correlated with those of miR-133b in clinical RMS samples
We investigated the expression levels of miR-1, miR-133b, and PTBP1 in four clinical ERMS samples and seven clinical ARMS samples. As a result, the mRNA levels of PTBP1 in clinical RMS samples were inversely correlated with those of miR-133b (R2 = 0.4023, P < 0.05; Fig. 6D, Supplementary Table S1). There was a tendency between miR-1 and PTBP1, however, there was no significant difference (R2 = 0.2456, P = 0.1). These findings suggest that the downregulation of miR-1 and miR-133b in the clinical RMS patients may have increased PTBP1 expression in them.
Discussion
Most cancer cells dominantly express PKM2 and thereby perform glycolysis dominantly even in the presence of enough oxygen. The promotion of glycolysis in cancer cells results in antication of the pentose phosphate pathway and release of lactate [35]. Earlier we found that the modulation of the PKM isoform pattern (PKM2 > PKM1) is maintained by the effect of the splicers [12]. Among the PKM splicers, PTBP1 is a chief player, which is highly expressed in tumor tissues and various kinds of cancer cell lines [36]. As a result, the overexpression of PTBP1 in cancer cells enables them to express PKM2. We also found that the expression of PTBP1 is regulated by tissue-specific miRNAs (PTBP1-associated microRNAs). Among them, miR-1 and miR-133b exhibit especially high expression in oxygen-demanding SKMs; and their action results in the silencing of PTBP1, leading to the dominant expression of PKM1, which enables cells to use oxidative phosphorylation. Such a profile of PKM isoforms is limited to brain and muscle tissues [12], which, among all organs, especially require glucose as an ATP source. However, presently, we demonstrated a shift in dominance from PKM1 to PKM2 in the cancerous tissues from organs requiring glucose such as the brain and SKM, as well as from the RMS cell lines tested. Thus, we concluded that the switching from PKM1 dominance to PKM2 dominance in energy metabolism could contribute to carcinogenesis in RMS cells.
In the present study, we demonstrated that miR-1 and miR-133b, which are expressed at extremely high levels in the SKM tissue, compared with those in the other organs, were, however, significantly downregulated in the sarcoma cells. These results clearly indicate an association of miRs with carcinogenesis and pathogenesis in RMS. First, miR-1 and miR-133b functioned as antioncogenes and played a negative role in the regulation of PKM isoform expression through silencing of the PKM splicer PTBP1, resulting in the shift in dominance from PKM2 to PKM1. Importantly, the ectopic expression of miR-133b in the RMS cells downregulated not only PTBP1 but also chimeric PAX3-FOXO1 gene expression. On the contrary, the silencing of PAX3-FOXO1 led to PKM isoform switching from PKM2 dominant to PKM1 dominant through decreased expression of PTBP1. The reason is because PAX3-FOXO1 regulates c-Myc, a growth-related gene and a regulator of multiple metabolic pathways [36]. C-Myc regulates alternative splicing of PKM isoforms by directly controlling the expression of PTBP1 [37–40]. Then, we verified the relationship between c-Myc and PAX3-FOXO1. As a result, the expression of c-Myc was downregulated after transfection with siR-PF2 used to silence PAX3-FOXO1 (Supplementary Fig. S3). Finally, the expression of PTBP1 decreased. Detailed examinations indicated that miR-133b bound to a region in the 3′UTR of FOXO1. The triangle networks among miR-133b (PTBP1-associated miRNAs), PTBP1, and chimeric PAX3-FOXO1 were thus established (Fig. 7). We showed a decrease in PTBP1 expression after the transfection with PAX3-FOXO1-silencing siR-PF2.

Schematic diagram showing the mechanism of growth inhibition by the ectopic expression of miR-133b in Rh30 cells.
Impairment of this triangle network induced autophagic cell death, which may commonly occur when sarcoma-specific energy metabolism is impaired. An experiment using NAC made clear that this autophagic cell death was induced by the production of free radicals through switching from PKM2 as the dominant isoform to PKM1. An inverse relationship between miR-133b and PTBP1 expression levels was also found in the clinical samples.
Based on previous research, it was reported that miR-1 and miR-133a inhibit growth and induce differentiation of RMS cells [41]. However, this report did not show the pathway or identify the target genes of miR-1 and miR-133a in RMS cells. In our study, the pathway and targeting gene of miR-1 and miR-133b, to allow them to function to inhibit growth of RMS cells, were clarified. However, the pathway by which miR-1 and miR-133 induce the differentiation of RMS cells remains clear. In SKM, this pathway for differentiation induced by miR-1 and miR-133 is clear [42]. Therefore, it is possible that the pathway operating in SKM may also be similar to that in RMS cells. These findings strongly suggest that the maintenance of glycolysis-based energy metabolism in RMS cells is especially crucial for tumor development. In the current study, we also demonstrated that the driver gene, chimeric PAX3-FOXO1, contributed to proliferation at least, in part, through positive regulation of the PTBP1/PKMs axis and suppression of differentiation [27,43]. We first demonstrated that one of the downstream target genes of chimeric PAX3-FOXO1 could be the sarcoma-specific energy metabolism-related gene, possibly PTBP1; because the silencing of PAX3-FOXO1 extremely downregulated the expression of PTBP1. When silencing of PTBP1 induced the switching from PKM2 dominant to PKM1 dominant, the intracellular ATP levels were elevated. However, the intracellular lactate levels were also increased. In light of the results of metabolism [44], we can understand that the elevated lactate levels may reflect the further increase in glycolysis even in the case of decreased levels of PKM2, to allow cell survival [44] (Supplementary Fig. S4). RMS cells transfected with miR-1, miR-133b, or siR-PTBP1 exhibited the shift from PKM2 to PKM1; however, due to residual PKM2, glycolysis would be further activated, leading to increased lactate levels.
In a previous study of ours, miR-133b also showed an antitumor effect through targeting PTBP1 in colorectal tumors [36]. We consider that replacement therapy using miR-133b might be more useful for treatment of RMS, which originated from a glucose-demanding organ, than for colorectal cancer; because we showed that miR-133b targeted not only PTBP1 but also ARMS-specific chimeric PAX3-FOXO1.
Further study will be needed to clarify more clearly the relationship between PKM isoform switching and sarcoma-specific energy metabolism, and also that between chimeric PAX3-FOXO1 and sarcoma-specific energy metabolism.
Footnotes
Acknowledgment
This work was supported by a GSK Japan Research Grant and Grant-in-aid for scientific research from the Ministry of Education, Science, Sports, and Culture of Japan (YA-24659157).
Author Disclosure Statement
No competing financial interests exist.
References
Supplementary Material
Please find the following supplemental material available below.
For Open Access articles published under a Creative Commons License, all supplemental material carries the same license as the article it is associated with.
For non-Open Access articles published, all supplemental material carries a non-exclusive license, and permission requests for re-use of supplemental material or any part of supplemental material shall be sent directly to the copyright owner as specified in the copyright notice associated with the article.