
Abstract
The potential of QT prolongation of ten 2′-O-methoxyethyl-modified (2′-MOE) antisense oligonucleotides (ASOs) was evaluated retrospectively via exposure/response (ER) analysis using data from Phase 1 clinical studies in healthy subjects. All Phase 1 studies were double-blind, placebo-controlled, single and multiple ascending dose studies designed to assess the safety, tolerability, pharmacokinetics (PK), and pharmacodynamics of the ASOs in healthy subjects. The active doses in these studies ranged from 50 to 450 mg administered by subcutaneous (SC) injection in single and multiple ascending dose cohorts. Two of the ten studies also included 2-h intravenous (IV) infusions up to 600 mg. Electrocardiogram (ECG) measurements were performed at baseline and selected time points (including Tmax). The correlation between QTcF intervals corrected for baseline (ΔQTcF) and the mean time-matched placebo (ΔΔQTcF) with PK plasma exposure when available was evaluated using a linear mixed-effects approach. There was no evidence for QTc prolongation associated with increasing plasma concentrations in healthy subjects, including exposures with treatment up to 450 mg administered SC or 600 mg by IV infusions, and concentrations that are 4–20 times the Cmax of the therapeutic dose, as assessed by both ΔQTcF and ΔΔQTcF. The ER analysis of the relationship between drug plasma concentration and ΔΔQTcF showed that the slope of the regression line was close to zero, and the upper bound of the 90% confidence interval at twice the mean observed (or predicted) Cmax (2 × Cmax) of the clinical therapeutic dose (ie, the highest clinically relevant plasma concentration) was well below 10 ms for all 10 compounds evaluated. Therefore, no concentration-dependent effect on QT prolongation was observed for any one of the ten 2′-MOE ASOs evaluated in Phase 1 studies. These results confirmed that 2′-MOE ASOs, as a chemical class, do not cause QT prolongation at clinically relevant dose levels.
Introduction
A
As a platform of therapeutics, 2′-O-methoxyethyl (2′-MOE)-modified ASOs have unique physicochemical properties, which differentiate them from small-molecule drugs and large protein drugs, in that ASOs are hydrophilic, highly water soluble, and polyanionic, with molecular weight in the range of 6,000–8,000 Da. The pharmacokinetics (PK) of 2′-MOE ASOs are remarkably similar across sequence and animal species, which makes their PK in humans highly predictable [3–6]. Following subcutaneous (SC) administration, 2′-MOE ASOs are rapidly absorbed into the systemic circulation, with peak plasma levels observed within a few hours after dosing. After reaching Cmax, plasma concentrations decline in a multiphasic manner with an initial, relatively fast disposition phase that dominated the plasma clearance followed by a slower elimination phase, with apparent terminal elimination half-life of 2–4 weeks. Plasma Cmax and area under curve (AUC) were dose dependent over the studied SC dose range with low to modest intersubject variability. Mean plasma concentrations decreased >90% from the Cmax by 24 h after SC injections. Attributed to this initial rapid and nearly complete distribution phase, there was no accumulation at Cmax or AUC after repeated SC doses, although having exhibited long terminal elimination half-lives. ASOs in this chemical class are highly bound to plasma proteins (>95% in man) and are broadly distributed to many tissues following parenteral administrations with the highest accumulation in the kidney and liver, but poorly distributed to skeletal muscle and heart, and do not cross the blood–brain barrier [6–8].
ASOs in this chemical class (2′-MOE-modified ASOs) are metabolized by ubiquitous nucleases and have not been reported to be substrates, inhibitors, or inducers of cytochrome P450 enzymes in vitro or in vivo, and thus are not expected to interact with small molecules that are predominately cleared through oxidative metabolic pathways [9]. In addition, 2′-MOE-modified ASOs are not substrates or inhibitors of uptake or efflux membrane transporters (eg, OATP, OAT, and MDR1), some of which transporters can be involved in the absorption, disposition, and excretion of certain drugs [10]. Several clinical studies have examined the PK drug–drug interaction potential of 2′-MOE-modified ASOs with a number of small-molecule drugs and antineoplastic agents, and no metabolic based drug–drug interactions have been observed to date [9,11].
2′-O-methoxyethyl-modified ASOs have demonstrated a lack of inhibition of human ether-a-go-go-related gene (hERG) channel current and no effect on cardiovascular function has been reported in both hERG assay and animal telemetry studies, suggesting a lack of interaction with extracellular or intracellular domains of the hERG channel, apparently due to their large molecular size and multiple negative charges [12]. No clinically significant QT prolongation related to 2′-MOE ASOs has also been observed in the clinic. A recent publication on custirsen, a 4-13-4 2′-MOE gapmer ASO, showed no effect on QT intervals based on PK/QT data in a Phase 1 dose-escalation study with dose up to 640 mg administered via 2-h intravenous (IV) infusion and plasma concentrations up to 90 μg/mL [13]. In addition, lack of QT effects of another 2′-MOE ASO, mipomersen, was demonstrated in both a Phase 1 dose-escalation study and a formal thorough QT (TQT) study [13]. Furthermore, studies with mipomersen showed that the exposure/response (ER) correlation analyses in the Phase 1 dose-escalation study and the TQT study are in good agreement, suggesting that the ER analysis in Phase 1 dose-escalation studies for 2′-MOE gapmer ASOs can be predictive of QT effect, as expected from a TQT study [14]. This finding is consistent with recent studies showing that TQT studies can be replaced with the ER analysis of the relationship between plasma drug concentration and ΔΔQTcF from Phase 1 dose-escalation studies [15,16] and the recently published ICH Final Concept Paper E14 [17].
Based on the similarities of 2′-MOE ASOs in terms of physicochemical properties, PK, and a lack of effect on hERG channel or QT prolongation in animal models, and the findings of the lack of effect on QT intervals in the clinic reported for two 2′-MOE ASOs, it is unlikely that other 2′-MOE ASOs of the same chemical class would have positive effect on QT prolongation. To further confirm these findings and draw a definitive conclusion, a retrospective analysis was performed to evaluate the effects of 2′-MOE ASO treatment on cardiac safety, based on ER analyses of ten 2′-MOE ASOs that had completed Phase 1 clinical studies in healthy subjects conducted by Ionis Pharmaceuticals, Inc. between 2003 and 2014, and results of this analysis are summarized in this article.
Materials and Methods
Oligonucleotides
The 10 ASOs included in this retrospective PK-QT analysis are phosphorothioate oligonucleotides with 17 or 20 nucleotides in length, and 2′-MOE sugar modifications on both the 3′- and 5′-ends of the molecules (underlined) (Table 1). In addition, all the cytosines of the compound were modified to contain a 5-methyl group (5-methylcytosine). These ASOs were formulated in sterile water for injection (200 mg/mL) and were provided by Ionis Pharmaceuticals, Inc. The molecular targets for these ASOs are listed in Table 1, all reside in the liver.
Underlines denoted 2′-MOE sugar modifications on both the 3′- and 5′-ends of the molecules.
MW, molecular weight.
Statement of regulatory approval for the human work performed
All studies were performed according to the amended Declaration of Helsinki, and all patients provided written informed consent.
Phase 1 dose-escalation clinical studies
The Phase 1 studies conducted for the 10 aforementioned 2′-MOE ASOs were double-blind, placebo-controlled, dose-escalation studies, designed to assess the safety, tolerability, PK, and pharmacodynamics of single dose (SD) and multiple doses (MDs) of the ASOs in healthy subjects.
The dose levels in these studies ranged from 50 to 450 mg administered via SC injection (two studies also included 2-h IV infusion up to 600 mg), evaluated sequentially with 3:1 or 4:1 randomization to active ASO treatment or placebo, in the SD and MD cohorts (Table 2). Subjects enrolled in the MD cohorts typically received a loading dose on alternate days during the first week (Days 1, 3, and 5) and then once a week for the next 3–5 weeks. Two of the ten studies (ISIS 301012-CS1 and ISIS 329993-CS1) also included 2-h IV infusion cohorts, in addition to the SC administration cohorts. A total of 527 subjects enrolled in these 10 Phase 1 studies; 400 of the 527 subjects received active ASO treatment, while 127 subjects received placebo (Table 2). Baseline demographics for all included clinical studies are summarized in Table 3.
IV, intravenous; SC, subcutaneous.
Baseline is defined as the last non-missing value prior to the first dose of study drug.
Intensive PK blood sampling occurred for 24 h following the dose in SD cohorts, and following both the first and last dose of the MD cohorts. In addition, post-treatment samples at various times up to 14 days in the SD cohorts, through (predose) plasma samples during treatment period, and post-treatment samples up to 70 days after the last SC dose in the MD cohorts were also collected.
In these Phase 1 studies, electrocardiograms (ECGs) were performed using calibrated 12-lead ECG machines. Twelve-lead ECGs (single measurement at each time point) were typically collected during screening, before dosing on Day 1 (baseline), 1–7 h postdose on Day 1 (at or near Cmax), and 12 or 24 h postdose in all subjects, including placebo in the SD and MD cohorts, and on various days during treatment period (predose) and post-treatment follow-up period in the MD cohorts. In addition, 12-lead ECGs at time points listed above were also performed following the last dose administration in the MD treatment cohorts in some studies. The following cardiac variables were assessed from continuous 12-lead ECG: VR, and RR, PR, QRS, and QT intervals. QT corrected using Bazett's formula (QTcB) and corrected using Fridericia's formula (QTcF) was calculated by QTcB = QT/(RR)1/2 and QTcF = QT/(RR)1/3, respectively, where RR = 60/VR.
Bioanalytical sample analyses
Human plasma samples for quantitation of oligonucleotide concentrations were analyzed using a quantitative, sensitive, and selective hybridization enzyme-linked immunosorbent assay method, which is a variation of the method reported previously [18]. The plasma assay was validated for precision, accuracy, selectivity, sensitivity, and stability of mipomersen in human plasma. Plasma sample analyses were performed in compliance with the Principles of Good Laboratory Practice [19]. The assay was tested with synthesized putative short oligonucleotide metabolite standards and showed no measurable cross-reactivity confirming the assay specificity for the parent oligonucleotide. Although this methodology can cross-react, to some degree, with long-chain oligonucleotide metabolites (eg, 19-mer), the presence of 19-mer metabolite of oligonucleotides of the same chemical class as mipomersen in plasma is very minor [20], and thus, the assay can be considered specific for the parent compound for this chemical class. The lower limit of quantitation was determined to be in the range of 1.00–2.00 ng/mL for the assays used to support the Phase 1 dose-escalation studies.
ER statistical analysis
Descriptive statistics for PK plasma concentrations and corresponding QT levels were calculated using WinNonLin Professional Version 5.0 or higher, SAS Version 9, or Microsoft Excel. BLQ values (below the limit of quantitation) were treated as “0” in the calculation of descriptive statistics.
In the Phase 1 dose-escalation studies, an ER analysis was used to explore the relationship between plasma drug concentrations and time-matched QTcF. Before ER analysis, the lack of hysteresis was confirmed. The primary variables were change from baseline in QTcF without and with adjustment for placebo for each study (ΔQTcF and ΔΔQTcF). Since there was no placebo treatment within subjects receiving active ASO treatment in the Phase 1 dose-escalation studies, mean ΔQTcF by time point was calculated for pooled placebo subjects. Subsequently, ΔΔQTcF was calculated by ΔQTcFDT[i] − ΔQTcFP[i], where ΔQTcFDT[i] was defined as the change from baseline at time point i for QTcF in subjects who received active ASO treatment, and ΔQTcFP[i] was the mean change from baseline at time point i for QTcF in the pooled placebo subjects (per Phase 1 dose-escalation study).
A linear mixed-effects approach was performed (using lme package in R version 3.2.1) for the change from baseline in QTcF intervals without and with placebo adjustment (ΔQTcF and ΔΔQTcF) versus drug plasma concentrations, with intercept, plasma concentration, and subject included as a random effect [see Eq. (1)].
This model was used to estimate both the fixed effect and the random effect of the intercept and the slope, respectively. The predicted maximum effect, as well as the upper bound of the two-sided 90% confidence interval (CI), was calculated using the following two equations:
where Cmax was the geometric mean Cmax following the last dose in the MD cohort of their respective therapeutic dose level for all studies with the exception of ISIS 301012-CS1, ISIS 304801-CS1, and ISIS 463588-CS1. For Study ISIS 301012, the reported Cmax was pooled from multiple clinical studies, including patient population was used because of its availability and large sample size [21]. For ISIS 304801-CS1 and ISIS 463588-CS1, the Cmax was interpolated from linear regression of dose ∼ Cmax based on log-transformed data [ie, log(dose) ∼ log(Cmax)] because the clinical therapeutic dose (300 mg) was not conducted in the Phase 1 study.
The highest clinically relevant plasma exposures for 2′-MOE ASOs are mostly below two-times Cmax at the clinical dose levels (typically 200 or 300 mg), since (i) ASOs normally have a low to moderate intersubject variability in PK exposure following either SC or IV administration (% coefficient of variation [CV] typically ranged 25%–50%); (ii) there is no to minimal accumulation in Cmax following multiple dose, and (iii) there were no drug–drug interactions observed thus far in clinic nor expected with this class of compounds [9–11]. Thus, to estimate the risk and maximum ΔΔQTcF change for a given drug, a 2× geometric mean Cmax value is used based on the linear mixed-effects model established as described above.
The criteria used for a negative QT assessment was based on the ICH E14 guidance on alternative approach to the TQT study [17]. Therefore, the absence of a concentration-dependent effect on ΔΔQTcF with 2′-MOE ASO treatment was concluded if as follows.
The upper bound of the two-sided 90% CI of the predicted ΔΔQTcF at highest clinical concentration (ie, 2 × Cmax of the clinical therapeutic dose) was <10 ms.
Results
Graphical analysis
The relationship between plasma ASO concentrations with RR, QTcF, and ΔΔQTcF was examined graphically for the data pooled from all 10 Phase 1 studies for the ten 2′-MOE ASOs evaluated. Plasma concentrations were plotted on logarithmic scale due to the large range of concentrations observed in the clinic (>4-log of magnitude). Indeed, the highest concentration observed (> 50,000 ng/mL) was 4–20 times the Cmax of therapeutic dose for the ten 2′-MOE ASOs evaluated because two of the ten studies included had IV infusion cohorts in addition to SC administration cohorts (Figs. 1–3).

RR as a function of ASO plasma concentrations for the 10 Phase 1 studies pooled. ASO, antisense oligonucleotide.
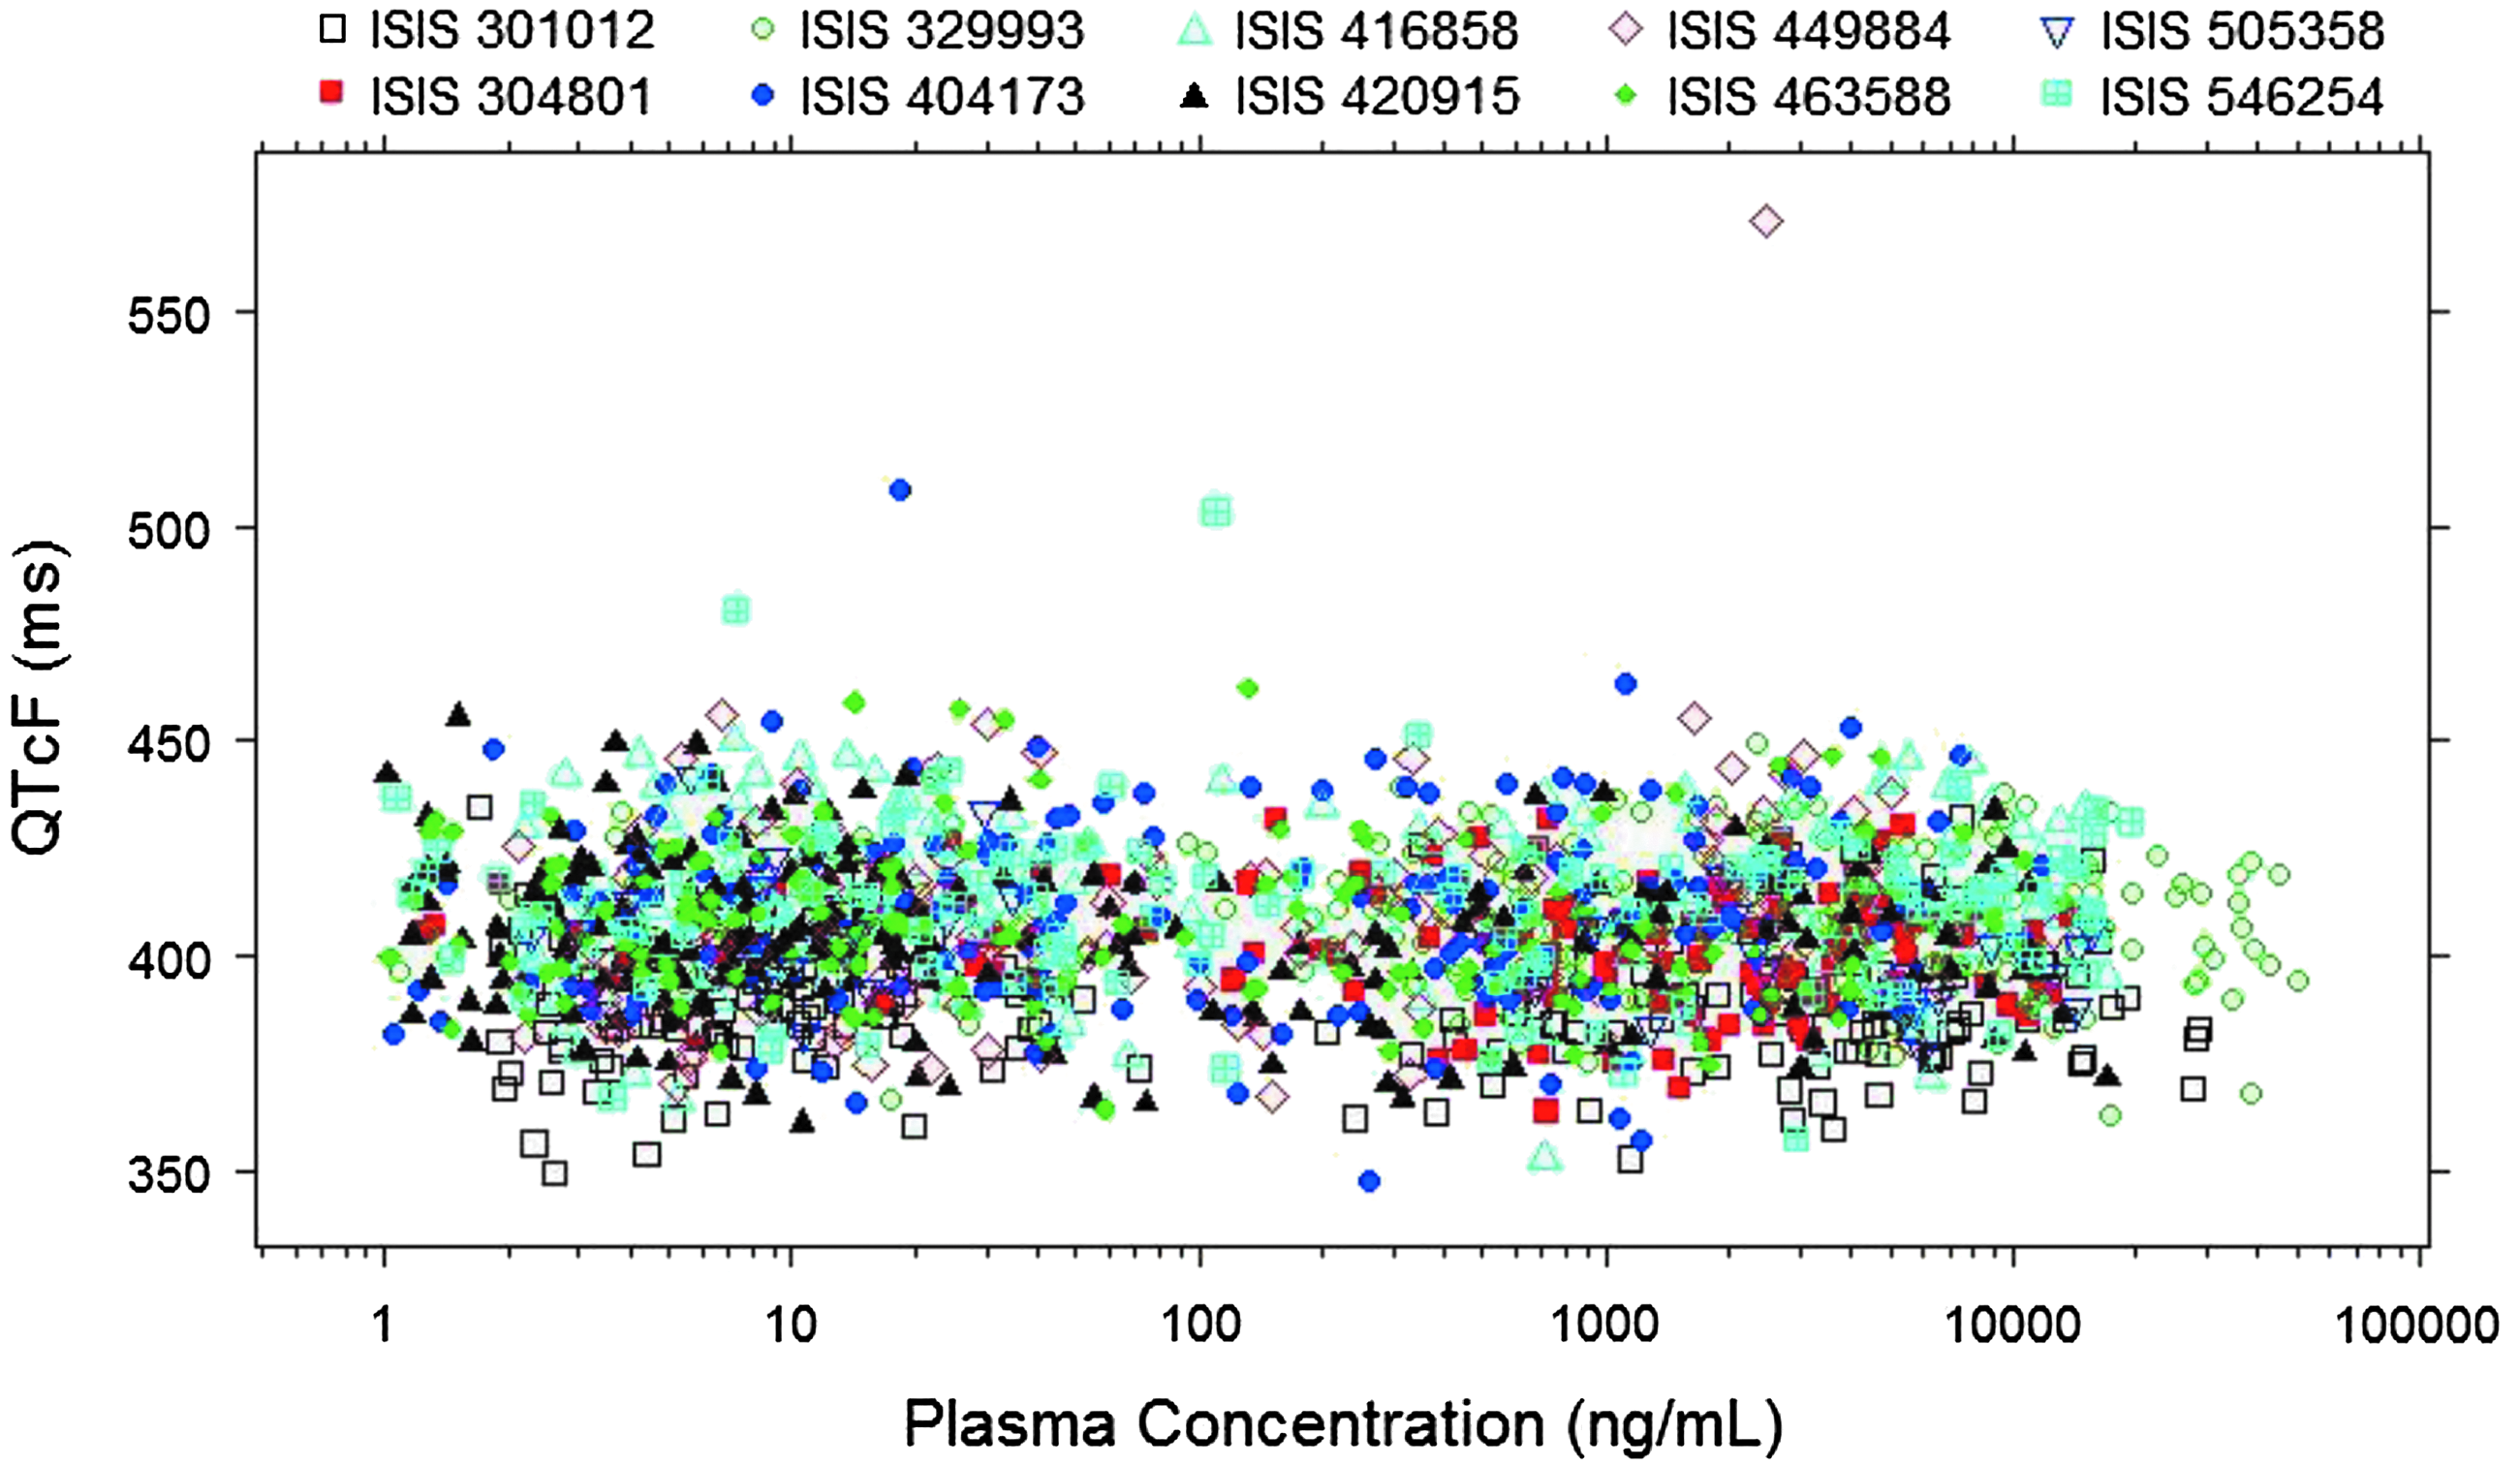
QTcF as a function of ASO plasma concentrations for the 10 Phase 1 studies pooled.
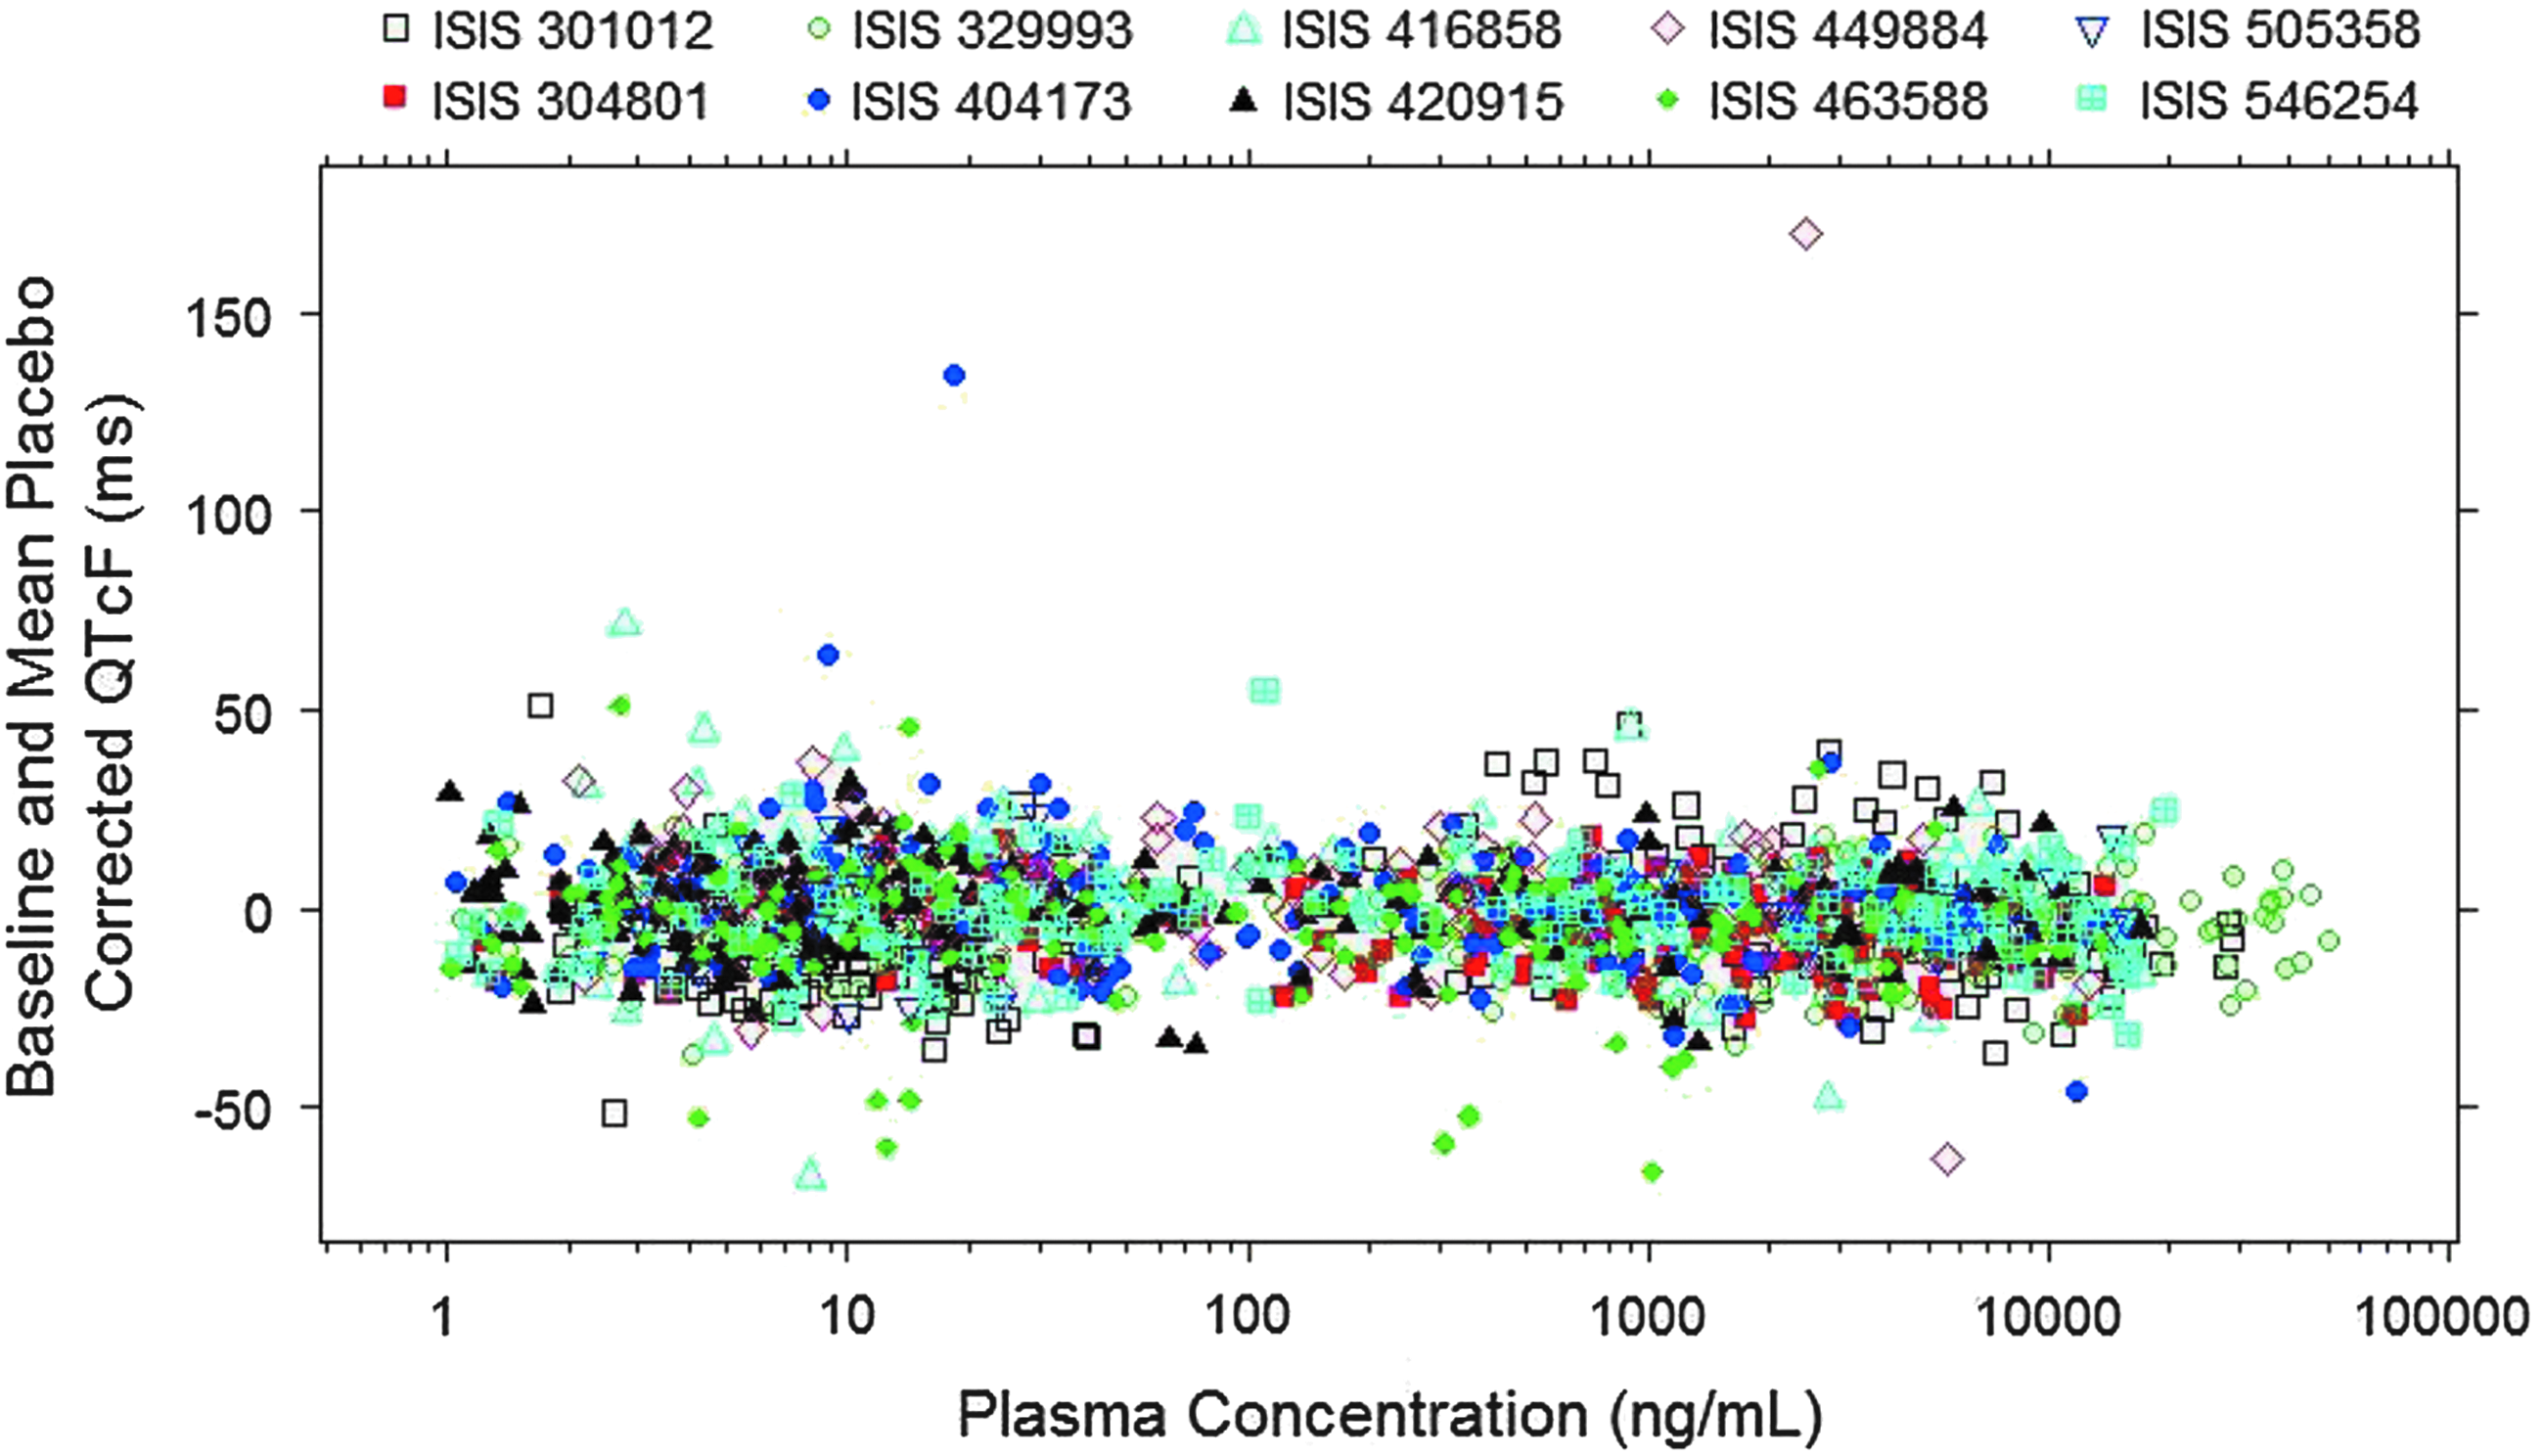
ΔΔQTcF as a function of ASO plasma concentrations for the 10 Phase 1 studies pooled.
As shown in Figs. 1–3, a flat relationship was obtained between plasma ASO concentrations and RR, QTcF, and ΔΔQTcF, respectively, demonstrating ASO treatment had no effect on QT intervals for all ten 2′-MOE ASOs evaluated. Inspection of the QTcF versus concentration data suggested a linear model would be adequate to describe the relationship.
Since only a single ECG measurement was made at each time point in these Phase 1 studies, the ECG measurements were prone to have outliers. Therefore, all the ECG data were carefully evaluated graphically and examined for outliers.
As shown in Figs. 1 and 2, there were only two ECG measurements (QTcF >500 ms, ΔΔQTcF >100 ms) identified as outliers from these 10 studies (one outlier at 72 h in ISIS 404173 CS1 and one outlier at 3 h in ISIS 449884-CS1). These two observations were concluded as outliers because (i) the ΔΔQTcF values before and after the outlier were normal and (ii) the time-matched plasma concentrations associated with the outliers were not at Cmax. These two outliers were excluded from ER analysis. Since only two outliers (of a total of 2,703 observations) were identified among the 10 Phase 1 studies, the quality of the overall ECG data was considered to be reliable.
In addition, the relationship between plasma ASO concentrations with ΔΔQTcF was examined graphically for each individual study. A flat relationship was obtained for all the ten 2′-MOE ASOs evaluated individually between plasma ASO concentrations and ΔΔQTcF, further demonstrating that ASO treatment had no effect on QT intervals.
Central tendency analysis
Following SC administrations of 2′-MOE ASOs, the maximum plasma concentrations (Cmax) were typically observed within only a few hours after SC dosing.
Box plots of the ΔΔQTcF at the Cmax of the time-matched PK-ECG data set for all ASO treatment doses pooled by study and at each dose level within each Phase 1 study are presented in Figs. 4 and 5, respectively.

ΔΔQTcF at the maximum concentration (Cmax) for the 10 Phase 1 studies.
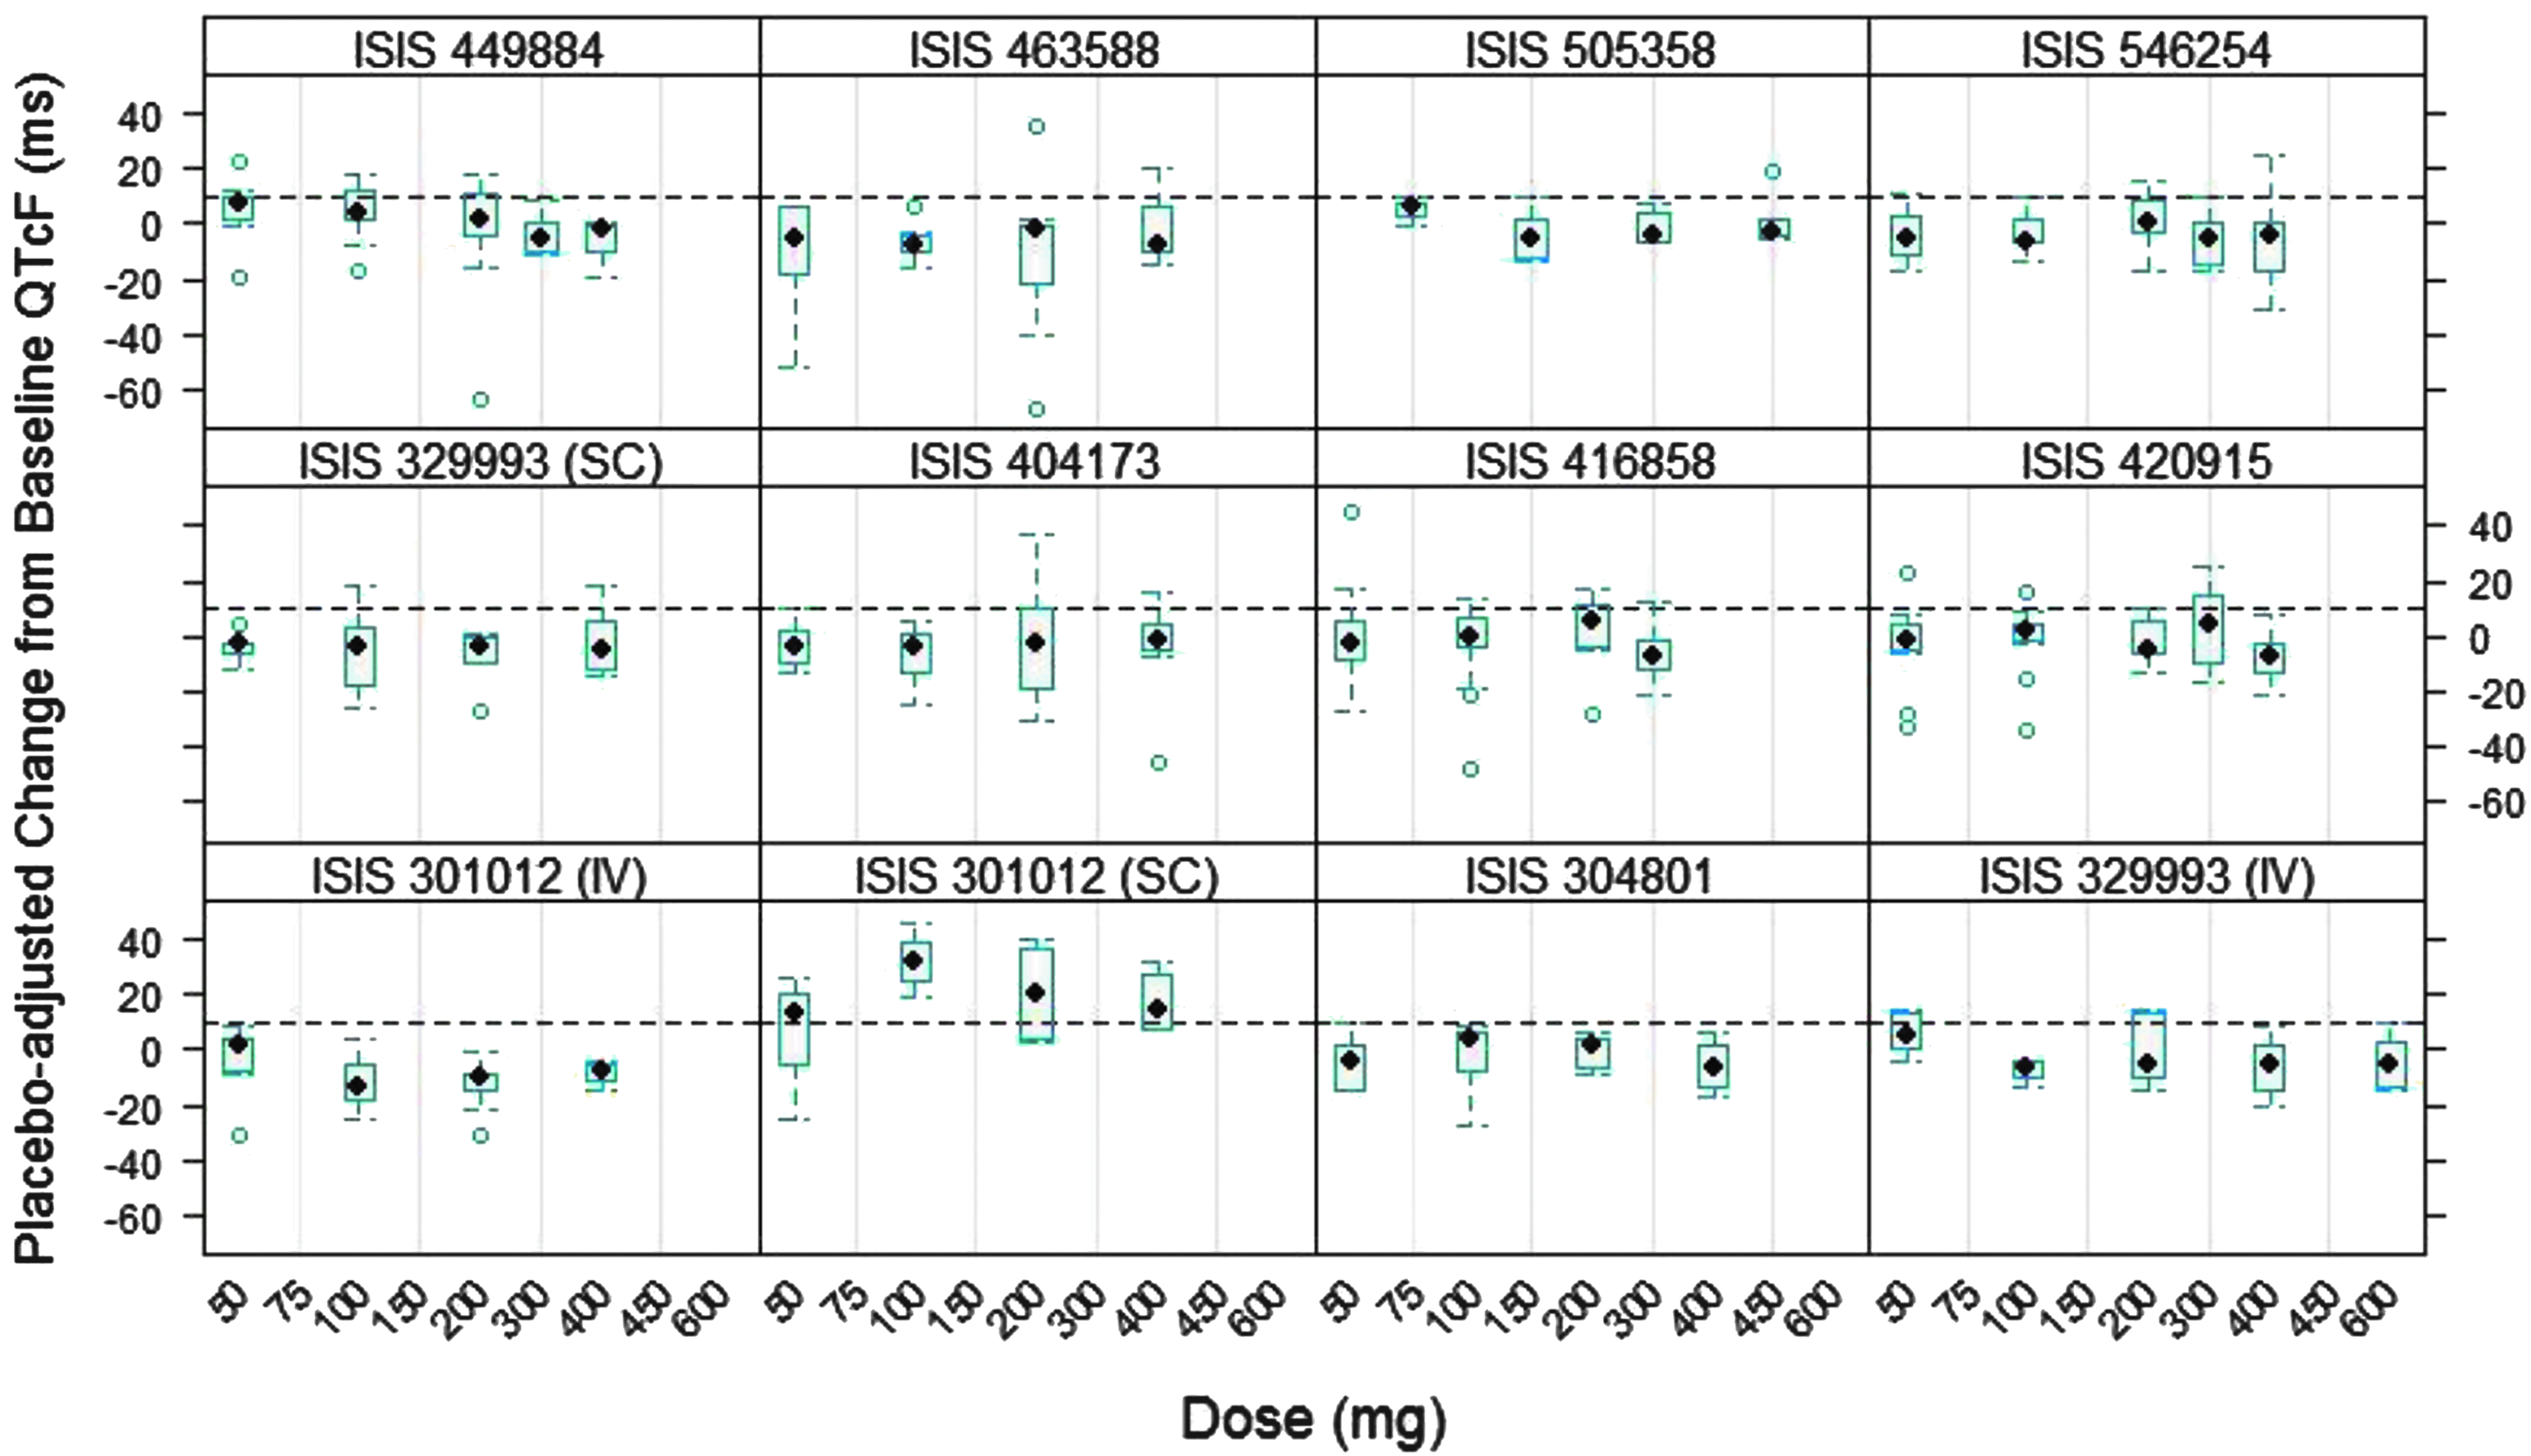
Placebo-adjusted change from baseline QTcF as a function of dose from 10 Phase 1 studies.
The median ΔΔQTcF at the Cmax for all 10 Phase 1 studies was around zero (Fig. 4). In addition, median ΔΔQTcF at Cmax appeared to be independent of dose, further confirming the lack of ASO treatment effect on QT intervals (Fig. 5).
It was noted that the median ΔΔQTcF following SC injection of ISIS 301012 (mipomersen) was >10 ms at all dose levels evaluated (50–400 mg) but was dose independent. Meanwhile, median ΔΔQTcF following 2-h infusion of ISIS 301012 (with plasma concentrations much higher than those following SC injection) was around 0 ms (much <10 ms), suggesting that the increase in QTcF observed following SC injection may not have been related to ISIS 301012 treatment. Moreover, the lack of QT effect with ISIS 301012 treatment was further confirmed by ER analysis in this study (Section 1.7) and in the subsequent TQT study.10
ER analysis
A linear mixed-effects modeling approach was used to characterize the relationship for each individual 2′-MOE ASO between the change from baseline in QTcF intervals with placebo adjustment (ΔΔQTcF) and drug plasma concentrations, with subject included as a random effect. Two ECG measurements (QTcF >500 ms, ΔΔQTcF >100 ms) were identified as outliers (one outlier in ISIS 404173-CS1 and one outlier in ISIS 449884-CS1) and were excluded from the ER analysis as explained previously.
The parameter estimates of the ER analysis for the ten 2′-MOE ASOs in Phase 1 studies are summarized in Table 4. All of the slopes of the ER analysis were approximately zero, suggesting that there was no concentration-dependent increase in ΔΔQTcF following ASO treatment. In addition, the upper two-sided 90% CI at both the Cmax and 2 × Cmax of the clinical therapeutic dose (the highest clinical concentrations) for all the ten 2′-MOE ASOs was below 10 ms threshold (Tables 5 and 6); therefore, the absence of a concentration-dependent effect of 2′-MOE ASO on QT prolongation was concluded.
ISIS 304801-CS1 CSR.
One QT value >500 ms was excluded due to abnormality and was deemed not clinically significant (ISIS 404173-CS1 CSR).
One QT value >500 ms was excluded, but the explanation is still pending (ISIS 449884-CS1 CSR).
Cmax is the observed geometric mean Cmax following the last dose in the MD cohort of therapeutic dose level for all studies except noted.
Cmax was obtained from Li et al. [21].
Cmax was interpolated from linear regression of dose ∼ Cmax based on log-transformed data [ie, log (dose) ∼ log(Cmax)] because the clinical therapeutic dose (300 mg) was not conducted in the Phase 1 study (304801-CS1 CSR).
MD, multiple dose; CI, confidence interval.
Cmax is the observed geometric mean Cmax following the last dose in the multiple-dose cohort of therapeutic dose level for all studies except noted.
Cmax was obtained from Li et al. [21].
Cmax was interpolated from linear regression of dose ∼ Cmax based on log-transformed data [ie, log(dose) ∼ log(Cmax)] because the clinical therapeutic dose (300 mg) was not conducted in the Phase 1 study (304801-CS1 CSR).
Discussion
This retrospective analysis of the effects of 2′-MOE ASO treatment on cardiac safety was based on exposure (PK)/response (QTcF) analyses of ten 2′-MOE ASOs that had completed Phase 1 clinical studies in healthy subjects, conducted by Ionis Pharmaceuticals, Inc. between 2003 and 2014. These studies included a wide dose range (50–450 mg for SC and up to 600 mg for IV) and the ECG measurement included the collection time at or near Cmax. Two of the ten studies (ISIS 301012-CS1 and ISIS 329993-CS1) also included 2-h IV infusion cohorts, in addition to the SC administration cohorts. The combined data from 10 Phase 1 studies where time-matched PK-QT samples collected were over a wide dose and concentration range provided valuable information and robust analysis of ER relationships for 2′-MOE ASOs. The maximum dose evaluated in these Phase 1 studies was 450 mg (for SC and 600 mg for IV), exceeded the clinical dose of 200 or 300 mg (SC) used in subsequent studies in patents, and the highest observed plasma concentration was 4–20 times the Cmax of therapeutic dose. Therefore, the exposures achieved in these studies should be able to cover exposures at different clinical scenarios because of (i) the modest intersubject variability following SC administration, (ii) the lack of accumulation in Cmax on repeated dosing, and (iii) the lack of drug–drug interactions at both the CYP enzyme level and transporter level with this class of compounds [9–11].
Overall, there was neither treatment nor dose-dependent effect on the QTcF and RR for all the ten 2′-MOE ASOs evaluated. There was no evidence for QTc prolongation associated with increasing plasma ASO concentrations in healthy subjects, including supratherapeutic exposures up to 450 mg administered SC or 600 mg by IV infusions, and ASO concentrations that are 4–20 times the Cmax of therapeutic dose, as assessed by both QTcF and change from baseline in QTcF with placebo adjustment (ΔΔQTcF). Moreover, the ER analysis of the relationship between drug plasma concentration and ΔΔQTcF for each compound was further investigated using a linear mixed-effects approach. The results showed that the slope of the regression line was approximately zero for all ten 2′-MOE ASOs evaluated, indicating there was no concentration-dependent increase in ΔΔQTcF following ASO treatment. In addition, the upper bound of the two-sided 90% CI at the highest clinical concentration (2 × Cmax of the clinical therapeutic dose) was well below the 10 ms threshold for all the ten 2′-MOE ASOs (ICH 2015). Therefore, it was concluded that there is no concentration-dependent effect on QT prolongation for all ten 2′-MOE ASOs evaluated. These results further confirm that 2′-MOE ASOs, as a chemical class, do not cause QT prolongation.
The lack of QT effect by ASOs was further supported by a TQT study conducted for one of the ten 2′-MOE ASOs evaluated, that is, ISIS 301012 (mipomersen). This study was a randomized, double-blind, four-way crossover study to define the ECG effects of mipomersen using a therapeutic dose (200 mg SC), supratherapeutic dose (200 mg IV), compared with placebo, and positive control (400 mg moxifloxacin IV) [14]. Fifty-eight subjects enrolled in the study. Mean peak plasma exposure measures of mipomersen (Cmax) were 5,860 and 22,100 ng/mL in the 200 mg SC and 200 mg IV mipomersen treatment groups, respectively. On average, the peak plasma exposure of mipomersen was ∼3.8-fold higher after the IV infusion compared with the SC injection of mipomersen. Results from this study demonstrated that mipomersen had no effects on HR, PR, and QRS interval duration based on both time-matched analyses and ER analysis. There were no new clinically relevant morphological changes. Finally, a recent publication on custirsen, a 4-13-4 2′-MOE gapmer ASO, showed no effect on QT intervals based on PK/QT data in a Phase 1 dose-escalation study with dose up to 640 mg administered via 2-h IV infusion and plasma concentrations up to 90,000 ng/mL [13].
The data package on the lack of QT effect of 2′-MOE ASOs as demonstrated in 10 Phase 1 studies conducted by Ionis Pharmaceuticals, a TQT study conducted by Genzyme Corporation [13], and a study conducted by Teva Pharmaceuticals [13], was overwhelmingly consistent. Because of the similarities of 2′-MOE ASOs in terms of physicochemical properties and PK profiles, a lack of effect on QT prolongation in humans, as demonstrated by a TQT study and ER analysis for a group of 10 similar 2′-MOE ASOs as well as supporting data from the literature [13], can be generalized to 2′-MOE ASOs of the same chemical class.
We recognize that there are some limitations in the data collection of these Phase 1 studies that did not meet the recently published ICH E14 Guideline Q&As (R3) 2015 (ICH 2015) in ER analysis. First, only a single ECG measurement was collected at each time point in these Phase 1 studies, and thus, the data could be prone to have outliers. However, evaluation of the data showed that only two ECG measurements could be considered as outliers from these 10 Phase 1 studies. Therefore, the quality of the overall ECG data was considered to be reliable. Second, the collection time point for ECG measurement was limited. Nonetheless, all the studies included the collection times at or near Cmax. In addition, two of the ten studies included IV infusion in addition to SC administration, with the highest plasma concentrations observed exceeding 4 × Cmax of the therapeutic dose for all the ten 2′-MOE ASOs evaluated. Finally, time-matched mean placebo correction was used in the “ΔΔ” approach rather than within-subject placebo treatment correction because the subjects in these Phase 1 studies did not cross over to receive active or placebo treatment as those in a TQT study. Although the Phase 1 QT data for a given compound are limited, the pooled QT data from multiple compounds and studies are compelling, and results are convincing that ASOs do not cause QT prolongation.
Conclusions
None of the ten 2′-MOE ASOs studied in Phase 1 studies at doses up to 400 mg SC or 600 mg IV for 4 weeks showed an effect on cardiac repolarization, and no positive correlation between QTcF and plasma concentrations was observed. The lack of effect on QT intervals with ASO treatment was further confirmed in a TQT study with mipomersen, one of the 2′-MOE ASOs evaluated. These results from ten 2′-MOE ASOs suggest a lack of effect on QT intervals with ten 2′-MOE ASOs, as a class in healthy subjects and the ER analysis of QT data in Phase 1 dose-escalation studies can be as informative as TQT studies advocated by experts in the field.
Footnotes
Acknowledgments
The authors thank Wei Cheng, Matt Buck, Seung Chun, Drs. Brett Monia, Elizabeth Ackermann; Brenda Baker and Walter Singleton for their scientific discussion and critical review of the article. Finally, this article would not have been possible without the administrative support provided by Robert Saunders, for which they are grateful.
Author Disclosure Statement
R.Z.Y., R.G., R.S.G., S.H., S.H., and Y.W. are all employees of Ionis Pharmaceuticals.