
Abstract
The goal of this study was to develop a reverse transcription quantitative polymerase chain reaction (RT-qPCR) method for the accurate quantification of chemically modified small interfering RNA (siRNA) including but not restricted to thermally destabilizing modifications such as glycol nucleic acid (GNA). RT-qPCR was found to be superior to mass spectrometry-based siRNA detection in terms of sensitivity and throughput. However, mass spectrometry is still the preferred method when specific metabolite detection is required and is also insensitive to siRNA chemical modifications such as GNA. The RT-qPCR approach can be optimized to take chemical modifications into account and works robustly in different matrices without optimization, unlike mass spectrometry. RT-qPCR and mass spectrometry both have their strengths and weaknesses for the detection of siRNA and must be used appropriately depending on the questions at hand. Considerations such as desired throughput, assay sensitivity, and metabolite identification must be weighed when choosing which methodology to apply.
Introduction
The field of RNA therapeutics that uses a new class of therapeutics, small interfering RNAs (siRNAs), has advanced rapidly in the past few years due to the recent approvals of ONPATTRO® and GIVLAARI® by the U.S. Food and Drug Administration (FDA) in August 2018 and November 2019, respectively [1,2].
siRNAs trigger the RNA interference (RNAi) pathway, an intrinsic mechanism of post-transcriptional gene silencing in eukaryotic cells (Fig. 1) [3]. During this process, endogenous short double-stranded RNAs [∼21 base pairs (bp) with 2-base staggered 3′ ends] associate with multiple protein components in the cytoplasm to form the RNA-induced silencing complex (RISC) [3]. Once loaded, the passenger (sense) strand is cleaved, unwound, removed from the complex, and degraded by cytoplasmic nucleases. The RISC-loaded guide (antisense) strand then binds through Watson–Crick base-pairing to a target complementary messenger RNA (mRNA). Subsequently, this process triggers the endonucleolytic cleavage of the complementary target mRNA on the site opposite nucleotides 10–11 of the antisense strand of the siRNA (5′–3′ orientation) [4,5]. RNAi can also be induced by exogenous siRNA duplexes, administered either subcutaneously (SC) or intravenously. After entering the cytoplasm of the cell, synthetic siRNAs are loaded into RISC and effectively trigger endonucleolytic cleavage of target mRNA.
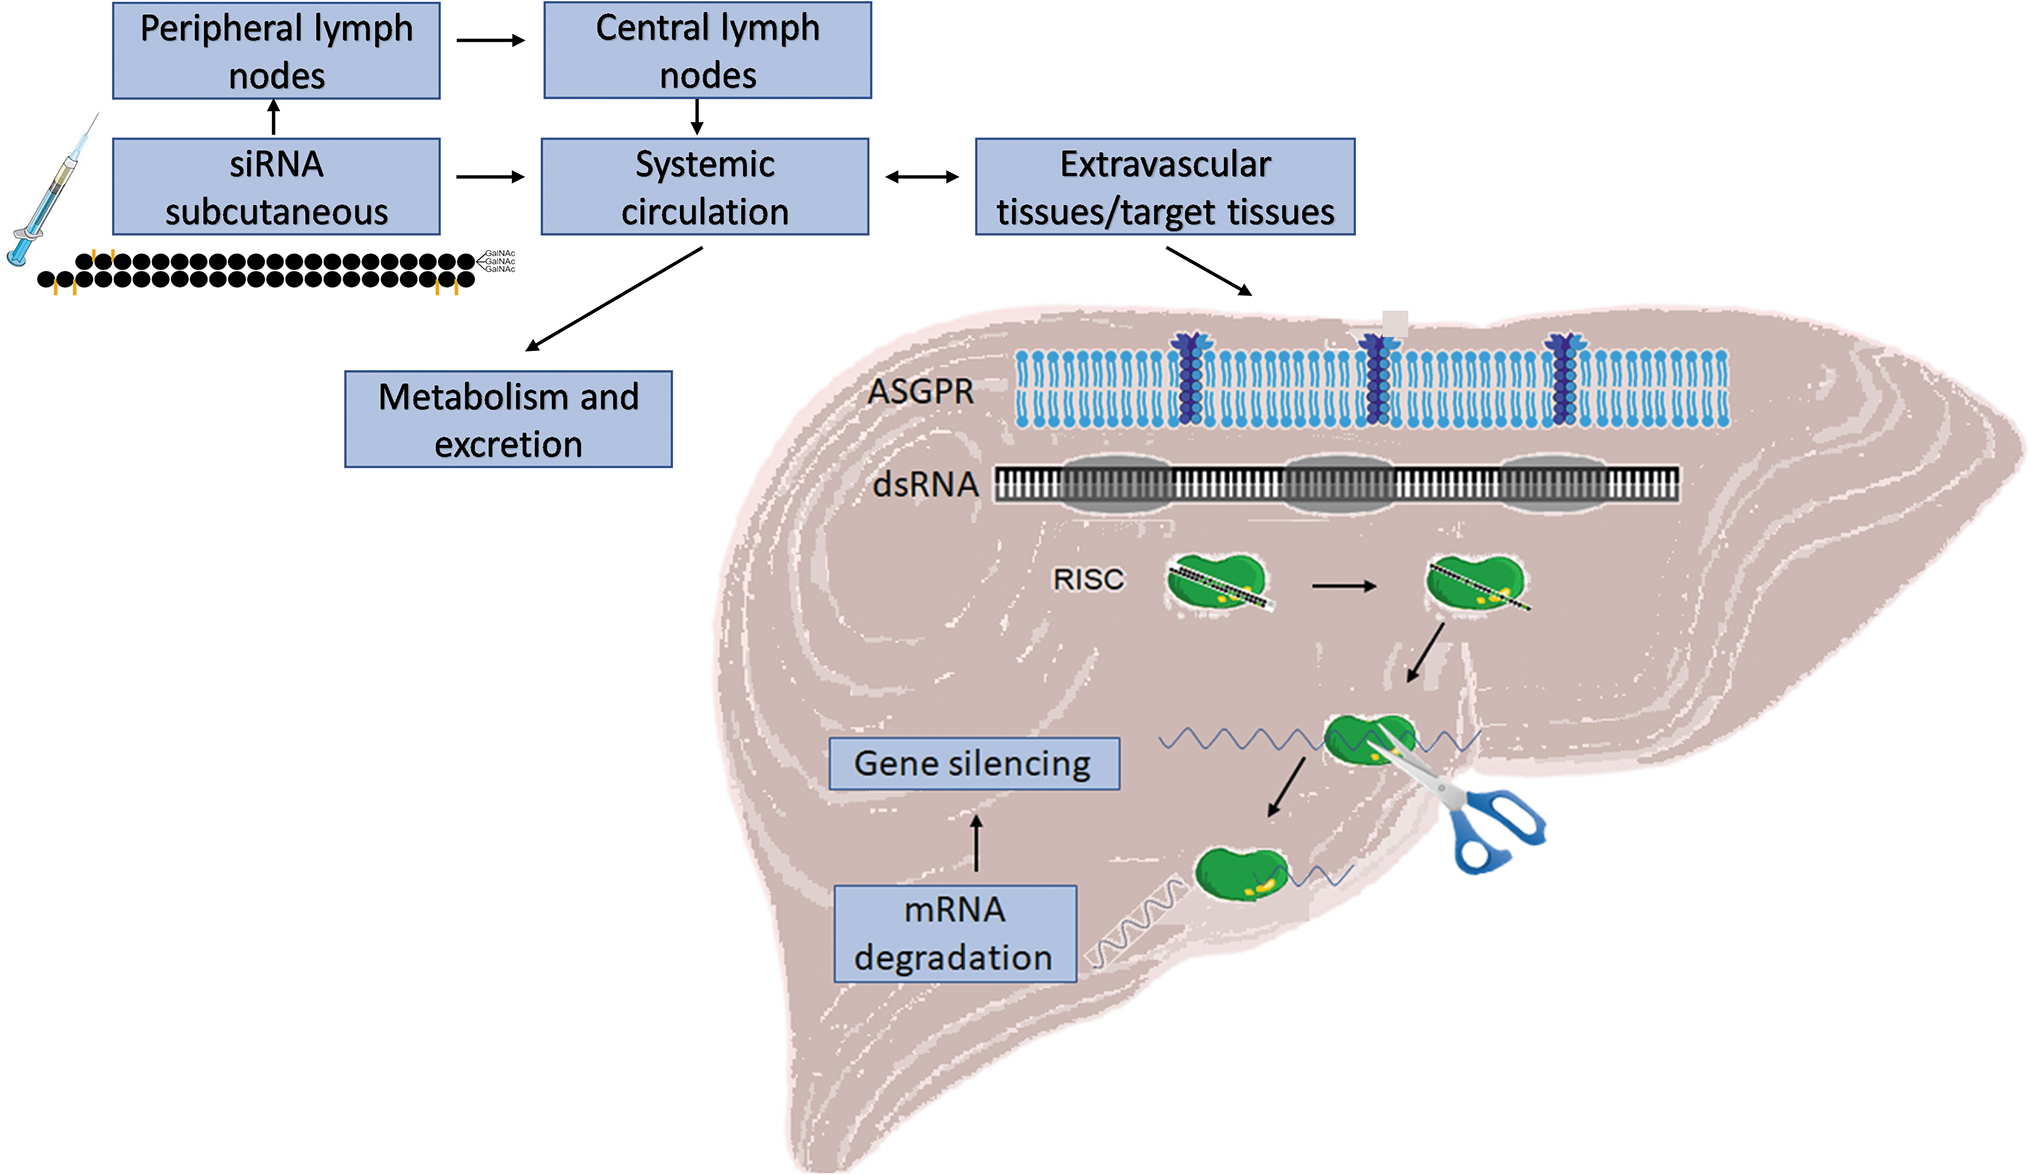
Uptake of GalNAc-conjugated siRNA by hepatocyte ASGPR mediate oligonucleotide delivery from the injection site to the target tissue (liver) to induce targeted gene silencing through the intrinsic RNAi pathway. ASGPR, asialoglycoprotein receptors; GalNAc, N-acetylgalactosamine; RNAi, RNA interference; siRNA, small interfering RNA.
To achieve targeted delivery to hepatocytes without formulating siRNAs into lipid nanoparticles, a new generation of siRNA-conjugates was developed. siRNAs conjugated to a triantennary N-acetylgalactosamine (GalNAc) are recognized with high affinity by the asialoglycoprotein receptor, which is almost exclusively expressed in hepatocytes. After endocytosis, siRNAs proceed through the intracellular trafficking pathway and are released into the cytoplasm by an as-yet undefined mechanism. Once in the cytoplasm, siRNAs suppress the production of target protein through cleavage of mRNA as described earlier. Focused receptor-mediated uptake significantly improves tissue specificity and enhances the therapeutic index of siRNA, resulting in more efficacious treatments with less frequent dosing [6–8].
To better understand the absorption, distribution, metabolism, and excretion (ADME) properties of GalNAc-siRNA, there is an increasing need to adapt current bioanalytical tools to achieve the necessary sensitivity to provide accurate quantification from various matrices, including biofluids such as plasma or serum. To achieve this, traditional bioanalytical methods such as mass spectrometry, hybridization-based high-performance liquid chromatography-fluorescence assay, and probe hybridization assays have proven to be very useful tools to advance the development of these new therapies [9]. Mass spectrometry is still the only method that can accurately quantify and discriminate metabolites from the full-length siRNA (Table 1) with a resolution of 1 bp [10–14]. These methods provide sensitivity only in the ng/mL range, whereas tools such as reverse transcription quantitative polymerase chain reaction (RT-qPCR) can reach sensitivities up to 1,000,000 times greater (pg/mL to fg/mL). In addition, assay development and hands-on time for sample analysis are longer for both mass spectrometry and hybridization approaches compared with RT-qPCR.
Comparison of Methods Used for Small Interfering RNA Quantification
LLOQ. May vary for different compounds and matrices.
Assay can be used for siRNAs that share the same nucleotide sequence despite having different chemical modifications.
LLOQ, lower limit of quantification; RT-qPCR, reverse transcription quantitative polymerase chain reaction; siRNA, small interfering RNA.
Modifications to siRNAs such as 2′-O-methyl (2′-OMe), 2′-deoxy-2′-fluoro (2′-F), and phosphorothioate (PS) linkages have been widely used to stabilize siRNAs, reduce immune stimulation, and enhance siRNA potency [15]. More recently, thermally destabilizing modifications such as glycol nucleic acid (GNA) have been incorporated to mitigate off-target activity of siRNAs [16]. Other modifications commonly found in siRNAs include 3′-O-methyl-2′-phosphate (3′-OMe) and unlocked nucleic acid.
The increasing need for sensitive detection to assess RISC loading, the presence of metabolites with pharmacodynamic activity, and the siRNA length (<23 bp) have presented new challenges associated with siRNA quantification. In addition, although guidelines describing the minimum information necessary for evaluation of qPCR experiments have been proposed by academic laboratories [17], there is still a lack of regulatory guidance and industry practice describing assay development and validation. This article presents our current RT-qPCR assay that was developed for the quantification of chemically modified siRNA, including siRNAs with thermally destabilizing modifications such as GNA.
Materials and Methods
Small interfering RNAs
The eight siRNA molecules used in this study were synthesized by Alnylam Pharmaceuticals, Inc. (Cambridge, MA) as described by Nair et al. [7]. The identities and purities of all oligonucleotides were confirmed by electrospray ionization mass spectroscopy and ion exchange high-performance liquid chromatography, respectively. Although the siRNA molecules differ in sequence, all contain phosphorothioate bonds as well as 2′-OMe and 2′-F modifications and all are conjugated to a triantennary GalNAc moiety. The siRNA stock solutions were prepared at 500 nM in PBST (phosphate-buffered saline, PBS, from 10 × PBS; ThermoFisher Scientific, Waltham, MA) with 0.25% Triton X-100 (Sigma-Aldrich, St. Louis, MO) and stored frozen at −20°C.
Preparation of standard curves and quality control samples
On the day of analysis, standards were prepared by performing fivefold serial dilutions in PBST of a 500 nM siRNA stock solution using the epMotion® 5075t liquid handler (Eppendorf North America, Hauppauge, NY) and the epMotion Editor software (version 40.6). Standards were kept on ice until RT-qPCR analysis. Quality control (QC) samples were also prepared in PBST at 50, 5, 0.5, 0.05, and 0.005 nM. Concentrations in nM were then converted to ng/mL using the corresponding siRNAs molecular weight.
Two nontemplate controls are included in all experiments. The first contains the water used to prepare the transcription master mix and the second contains the PBST buffer used as diluent for samples and standards.
Preparation of plasma, serum, and tissue samples for total siRNA quantification
Serum and plasma samples were diluted in PBST (0.25% Triton X-100) using a minimum 100-fold dilution to avoid matrix interference and protein precipitation during the heating step.
Approximately 50 mg of liver tissue from treated and untreated animals was processed to powder as described by Foster et al. [15] and stored at −80°C. All in vivo experiments were performed according to the Institutional Animal Care and Use Committee (IACUC)'s regulations at Alnylam Pharmaceuticals, Inc. These protocols followed the U.S. Government Principles for the Utilization and Care of Vertebrate Animals Used in Testing, Research, and Training.
Reverse transcription preparation of cDNA
To determine tissue siRNA concentrations, ∼10 mg of powdered tissue was resuspended to a final concentration of 10 mg/mL in PBST. Diluted samples were incubated on a dry block (VWR® Advanced dry block heater; VWR) at 95°C for 10 min, vortexed, and placed on ice for 10 min before centrifugation at 16,000 g for 10 min at 4°C. Supernatants were transferred to 1.5 mL DNase/RNase-free tubes (Eppendorf, NY) and analyzed immediately or frozen until analysis.
A minimum of 20 μL of samples (plasma, serum, or liver), standards, and QCs was then transferred into a 96-well plate and placed into a preheated thermal cycler (Mastercycler®; Eppendorf) at 95°C for 10 min to allow the duplexes to denature and facilitate the annealing of the stem-loop primer to the antisense strand of the siRNA during the reverse transcription (RT) reaction.
Stem-loop RT-qPCR
To detect siRNAs using a TaqMan®-based approach, we used a similar strategy to the one described by Chen et al. [18] for microRNA detection. The approach is illustrated in Fig. 2. In brief, the RT step occurs in the presence of a stem-loop RT primer that is complementary to the last 6–10 bases of the 3′ end of the antisense strand of the target siRNA. The stem-loop primer contains an additional universal sequence at the 5′ end that facilitates a TaqMan-based detection strategy in the subsequent qPCR step. As in the case of microRNA, the forward primer for qPCR is sequence-specific for the target siRNA. For sequence compositions that yield a low predicted melting temperature (Tm), the forward primer is designed as a tailed primer to help increase Tm.
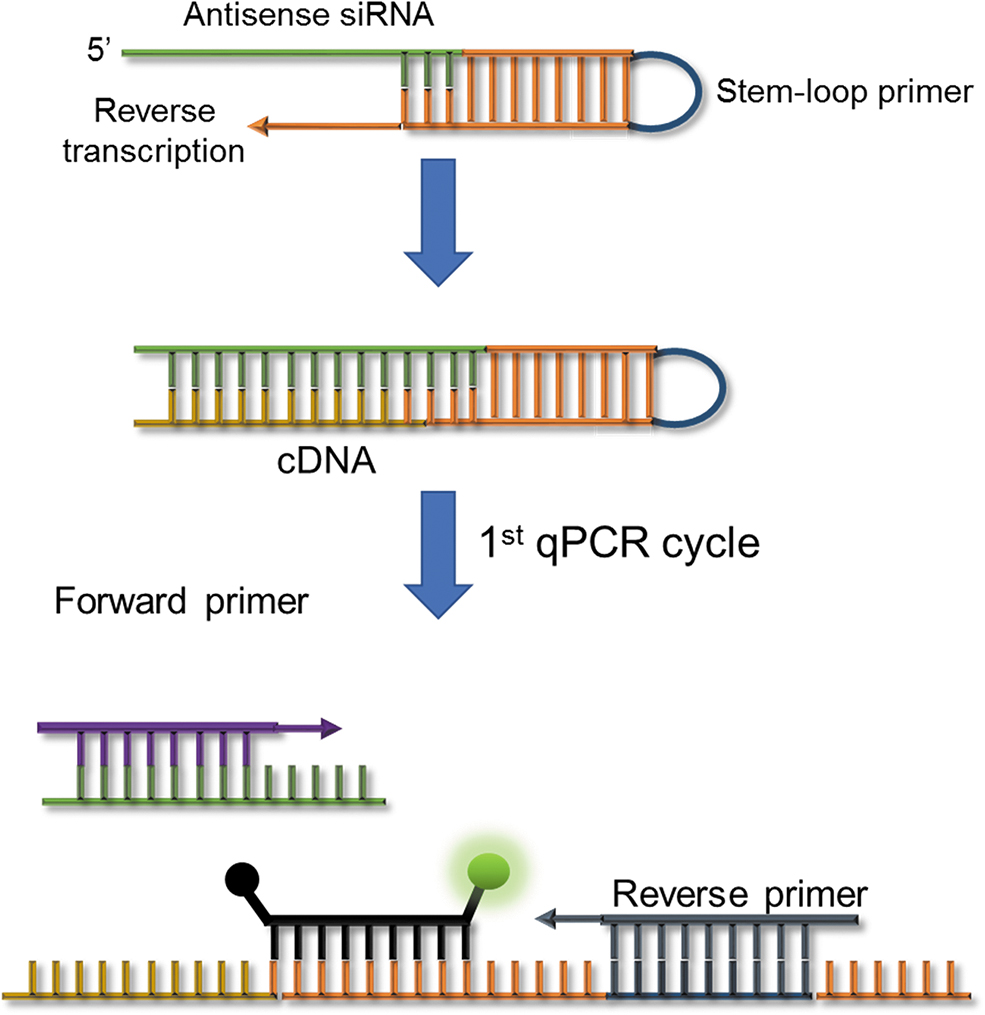
Schematic representation of a stem-loop reverse transcription followed by a qPCR approach to quantify the antisense strand (full-length or active drug component). RT-qPCR, reverse transcription quantitative polymerase chain reaction.
All samples, standards, and QCs were analyzed in duplicate. Each assay plate included a standard curve containing at least six points unless otherwise noted, as well as five levels of QC ranging from 50 to 0.005 nM. An assay run was considered acceptable when amplification efficiency fell within 90%–110% as calculated from the slope of the log-linear portion of the standard curve, the coefficient of correlation for the standard curve was >0.99, and the difference between the nominal and observed concentration for each QC level was ≤25%.
RT conditions used in this study were the same as previously described by Landesman et al. [19]. The TaqMan MicroRNA Reverse Transcription Kit (Applied Biosystems®; ThermoFisher Scientific) was used following manufacturer's recommendations. In brief, 5 μL of the denatured sample/standard was added to 10 μL of the RT reaction mixture containing 10 × buffer, 1 × reverse transcriptase, RNAse inhibitor, stem-loop oligonucleotide, water, and dNTPs. Reactions were then incubated at 16°C for 30 min, followed by 42°C for 30 min, and a final inactivation step at 85°C for 5 min.
The qPCR step was then performed on a ViiA 7 Real-Time PCR System (Applied Biosystems; ThermoFisher Scientific) using a 384-well block and TaqMan™ Fast Advanced Master Mix (ThermoFisher Scientific) according to the manufacturer's protocols.
Sequence-specific stem-loop, forward and reverse primers (Integrated DNA Technologies, IA), and TaqMan probes (ThermoFisher Scientific) were also designed as previously reported by Chen et al. [18] and Landesman et al. [19]. For the stem-loop primer, the universal sequence (5′ GTCGTATCCAGTGCAGGGTCCGAGGTATTCGCACTGGATACGAC 3′) reported by Jung et al. [20] was used. Primer Express Software v3.0.1 (ThermoFisher Scientific) was used to predict Tm values for primers and minor groove binder-containing probes and to evaluate the presence of potential secondary structures.
Measurement of siRNA loaded into RISC
Measurement of RISC-loaded siRNA (antisense strand) in liver was performed as previously reported by Nair et al. [21] using a combination of immunoprecipitation followed by the stem-loop RT-qPCR procedure described earlier.
Processed (powdered) liver prepared from 50 mg of tissue was resuspended at 100 mg/mL in prechilled lysis buffer (50 mM Tris-HCl, pH 7.5, 150 mM NaCl, 2 mM EDTA, 0.5% Triton-X 100; chemicals were obtained from ThermoFisher Scientific), supplemented with one tablet of cOmplete™ Mini, EDTA-free Protease Inhibitor Cocktail (Roche, Sigma-Aldrich) and 1 mM of phenylmethanesulfonyl fluoride (Sigma-Aldrich). Precleared samples (using QAE-Sephadex® A-50 resin; Sigma-Aldrich) were then subjected to Ago2 immunoprecipitation by incubation with anti-mouse Ago2 (Clone No: 2D4; FUJIFILM Wako Pure Chemical Corporation, San Diego, CA) and control normal mouse IgG (sc-2025; Santa Cruz Biotechnology, Inc., Dallas, TX) followed by precipitation with Protein G Dynabeads (Life Technologies, ThermoFisher Scientific). Final lysates of RISC-loaded siRNAs were subsequently quantified by the stem-loop RT-qPCR approach described earlier.
mRNA quantification
Total mRNA was isolated, and reverse transcribed into cDNA as previously described [15]. qPCR reactions were performed using gene-specific TaqMan assays for each target gene (Mm00443267_m1 for Ttr, and Mm00551119_m1 for Tmprss6; ThermoFisher Scientific).
Data analysis
Mean, standard deviation, and linear regression were calculated in GraphPad Software V 7.01 G (GraphPad Software, San Diego, CA). The slope of the regression line was calculated using the log-transformed siRNA concentration (ng/mL) as the independent variable versus the mean cycle threshold (CT) value (number of PCR cycles for the fluorescence signal to cross the threshold) as the dependent variable.
Results
Reportable range and linearity
An example of reportable range and linearity for siRNA-1 using the RT-qPCR method is shown in Fig. 3. In this example, the standard curve was generated using 11 standards. The siRNA concentrations ranged over 6 logs (65.19 ng/mL to 1.3 × 10⁻⁶ ng/mL), including the anticipated quantification range. The qPCR reaction had a calculated efficiency of 102%, based on the slope of −3.27.

Analytical sensitivity of stem-loop RT-qPCR on siRNA-1 in serum
Analytical specificity and accuracy
Mass spectrometry can discriminate full-length siRNA and metabolites with a resolution of 1 bp in contrast to the stem-loop RT-qPCR approach that detects all metabolites plus full-length as total siRNA without discriminating (Table 1).
The stem-loop primers were designed to have either a 6-bp or a 10-bp overlap to the 3′ end of the antisense strand of siRNA. Assay performance using both types of primer was assessed based on the standard curves generated by RT-qPCR of intact siRNA-2 and siRNA-2 lacking the 3′ terminal nucleotide on the antisense strand, AS(N − 1)3′. As shown in Fig. 4A, RT-qPCR using the 10-bp overlapping stem-loop primer detected full-length siRNA-2 and AS(N − 1)3′ sequence with the same accuracy. However, assay accuracy for the detection of the AS(N − 1)3′ siRNA was lower when using the 6-bp overlapping stem-loop primer (Fig. 4B). When the 6-bp overlapping stem-loop primer was used, the AS(N − 1)3′ siRNA had an average CT delay of 2.88 when compared with the full-length sequence, indicating a reduction in recovery and lowered assay accuracy.

Stem-loop RT strategy using either a 10 bp
To corroborate that the aforementioned findings were applicable to other siRNA sequences, we performed the assay using the 6-bp overlapping stem-loop primer with a different siRNA sequence (siRNA-3) and its AS(N − 1)3′ form, together with a truncation variant where one nucleotide was removed from the 5′ terminus of the antisense strand, AS(N − 1)5′ (Supplementary Fig. S1). Results showed that the loss of only one nucleotide on the 3′ end of the antisense strand of the siRNA resulted in a CT delay of 4.7 CT for this particular sequence compared with the full-length antisense strand. For the AS(N − 1)5′ form, CT values were the same as for the full-length sequence.
To measure the closeness between the measured value and the true value we also compared siRNA-1 concentrations measured by stem-loop RT-qPCR versus mass spectrometry in the serum of human healthy volunteers after a single dose at either 1 or 6 mg/kg. Comparison between siRNA concentrations up to 24 h showed a Pearson correlation of 0.965 between the two methods as calculated by GraphPad Software V 7.01 (Fig. 5).
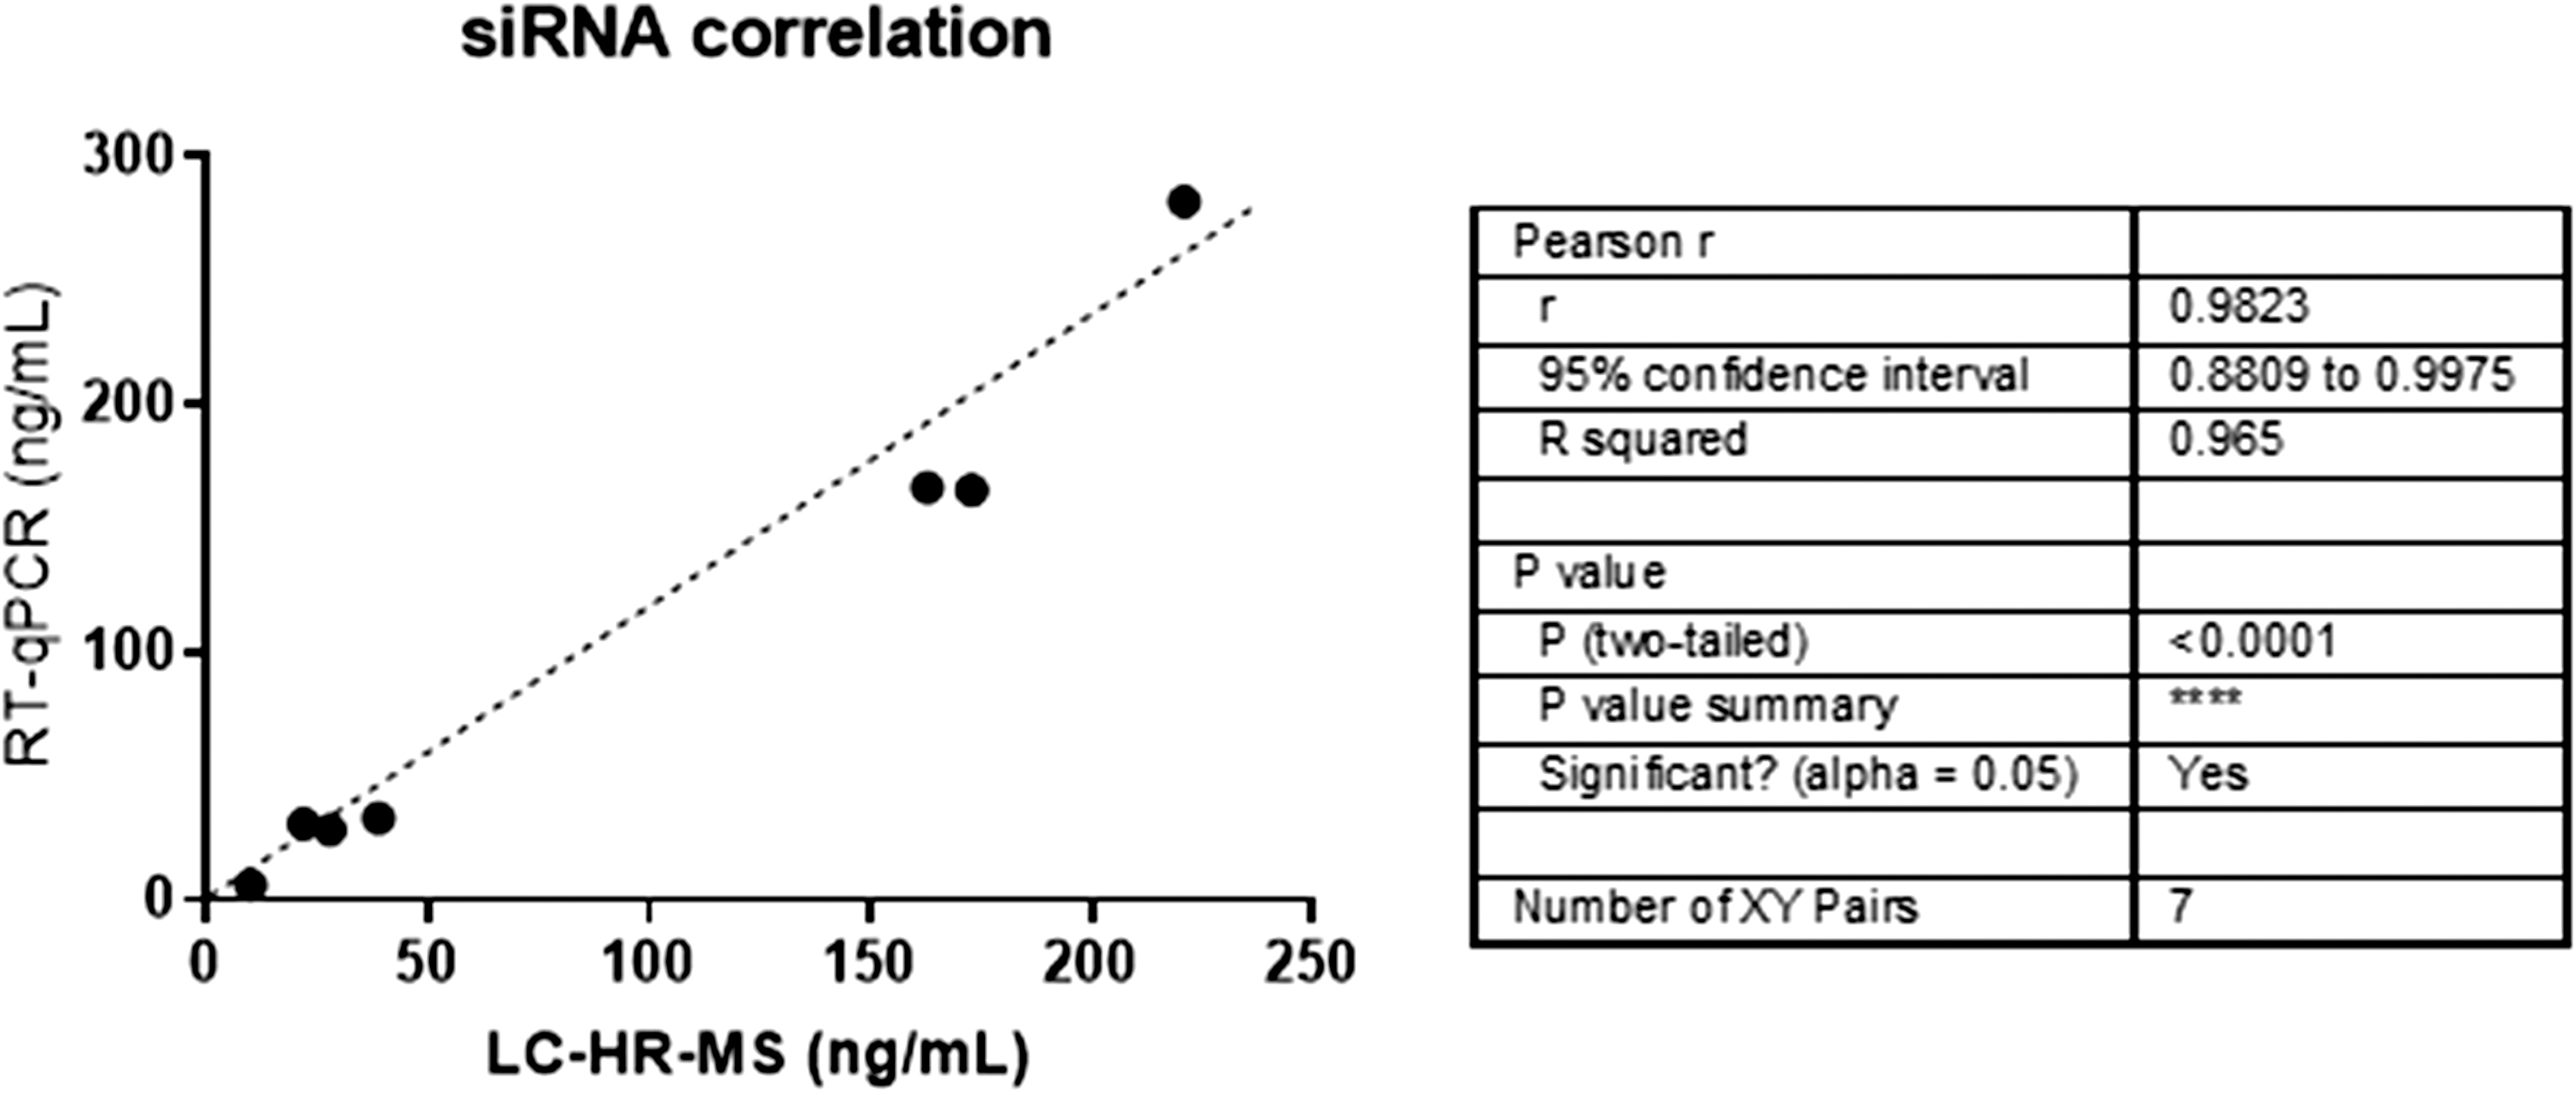
Pearson correlation between siRNA-1 concentrations as measured by either mass spectrometry (LC-HR-MS) or RT-qPCR from seven different human serum samples after single dose at either 1 or 6 mg/kg for the first 24 h. LC-HR-MS, liquid chromatography-high resolution mass spectrometry.
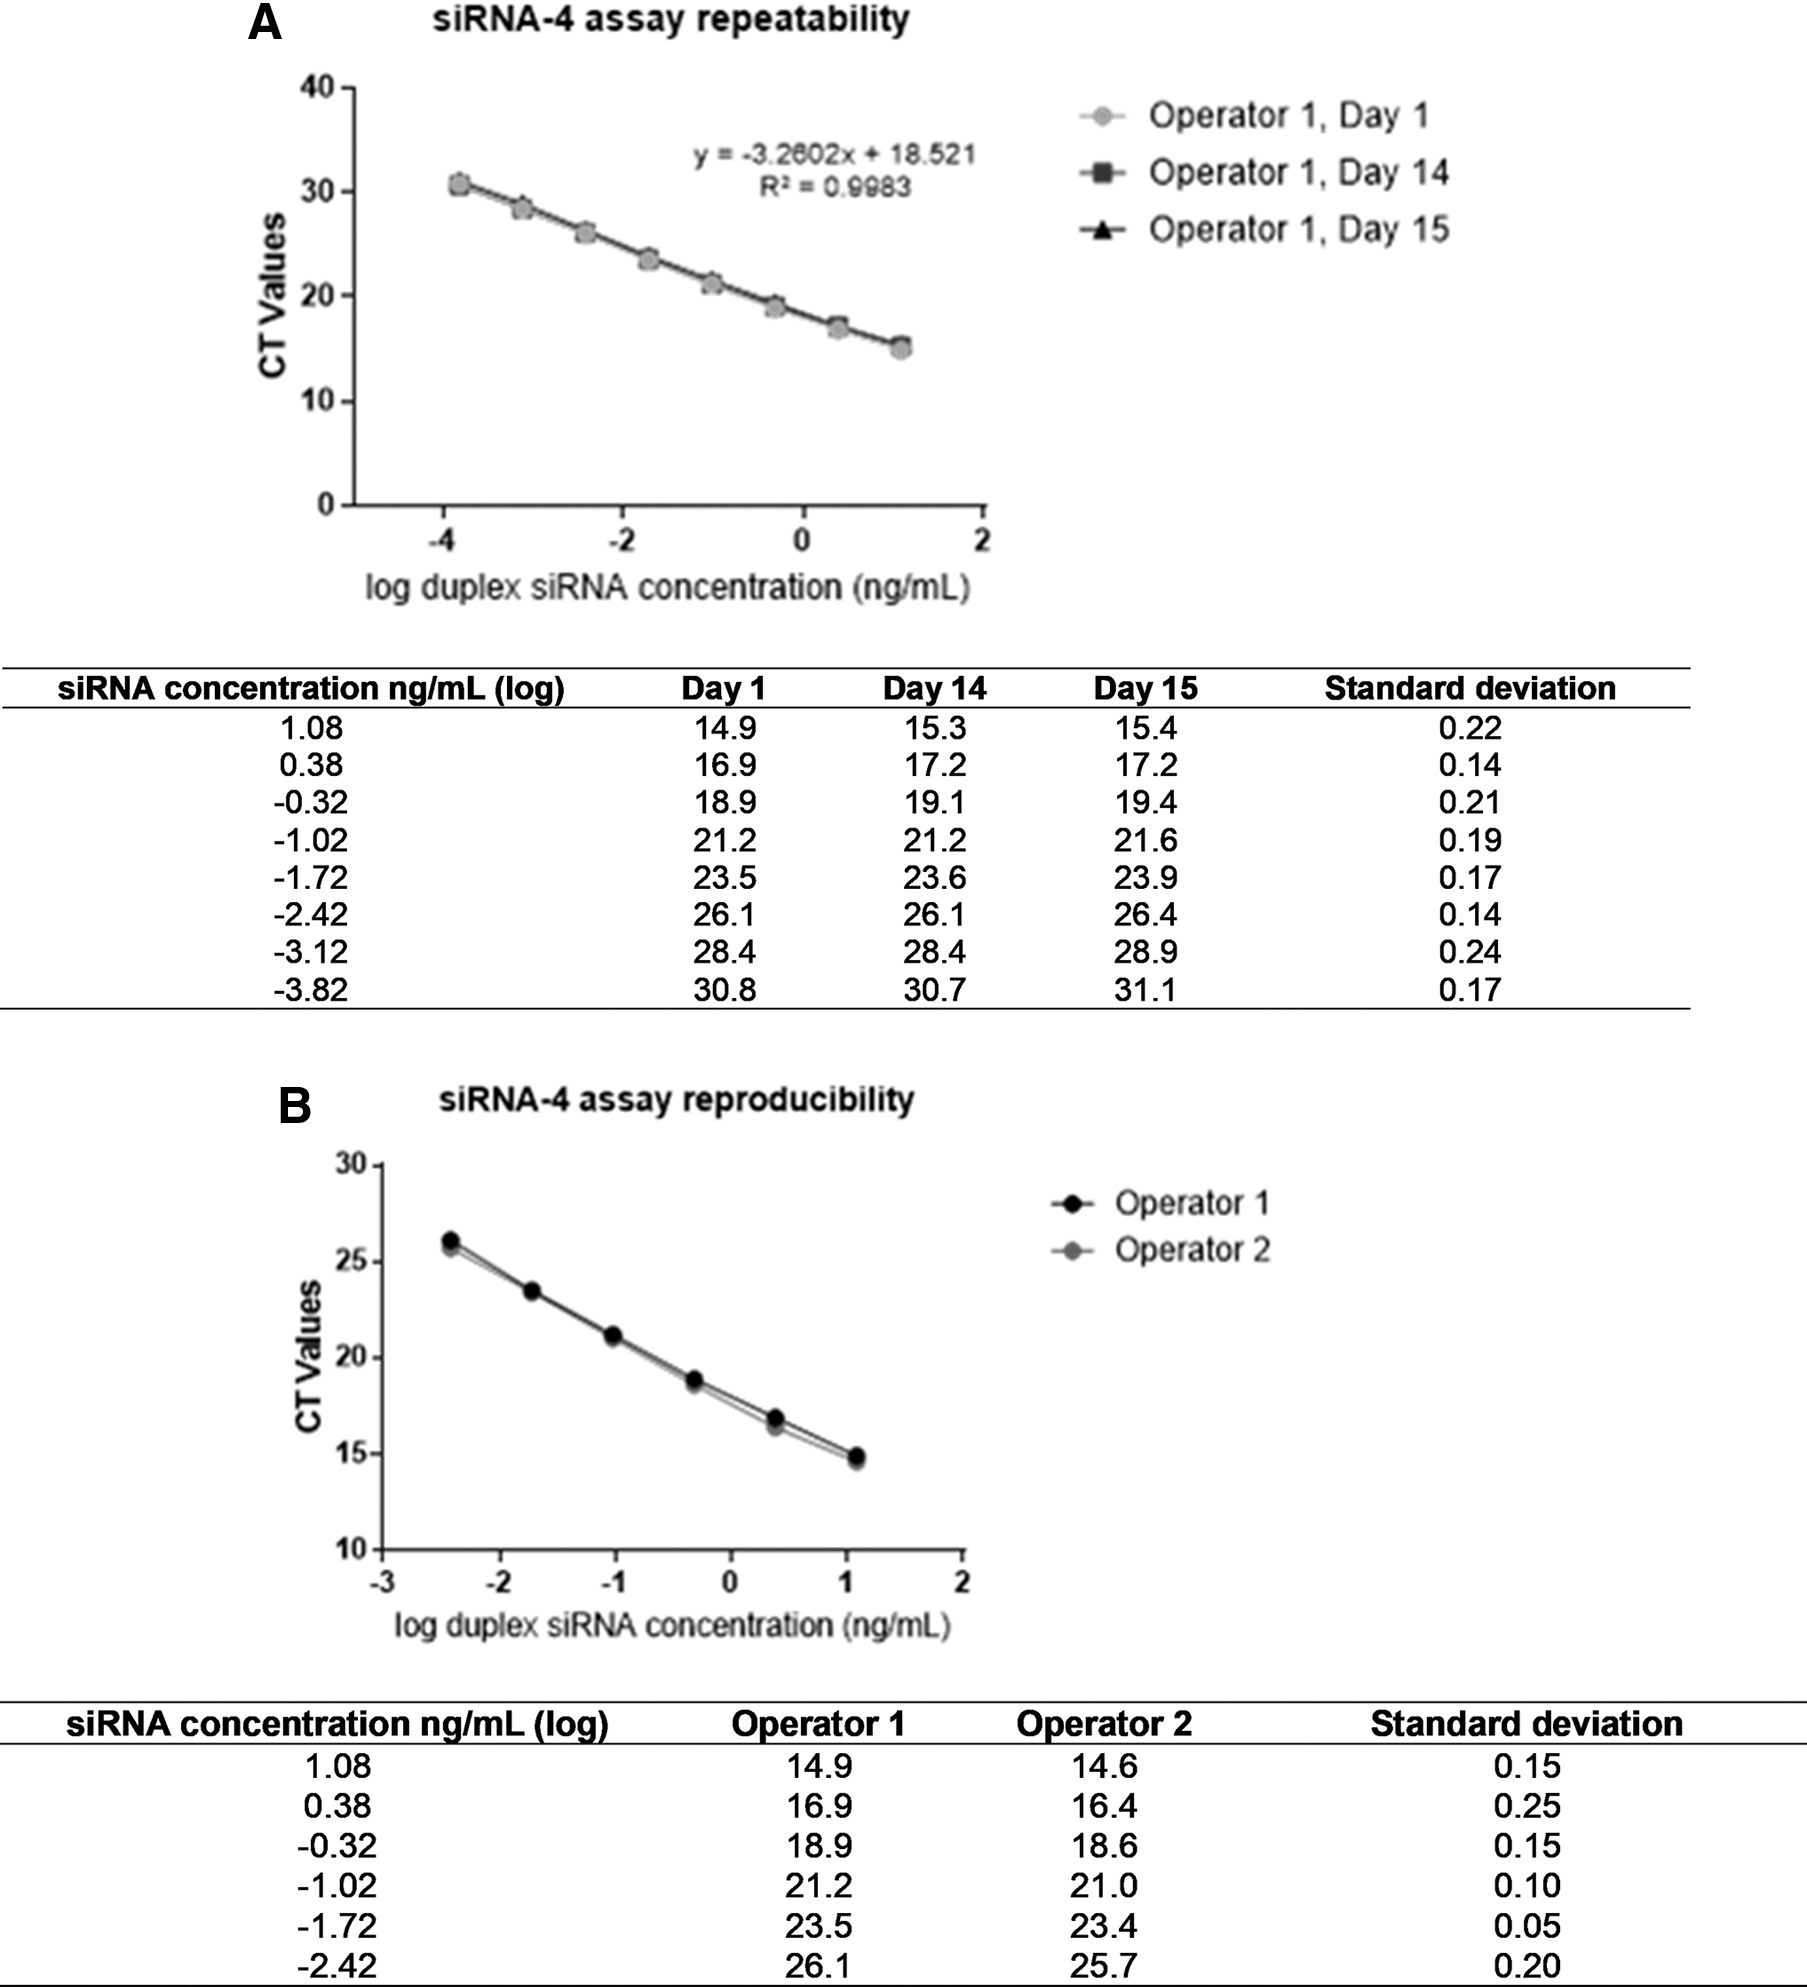
Precision
To assess siRNA ADME properties, assays must be precise, robust, and reproducible, yielding the same values from repeat analysis of the same input material across different days and operators.
Figure 6 shows assay repeatability for the same operator (intra-operator) as a function of CT values across several siRNA-4 input concentrations for a 15-day period. Figure 6B also reflects the assay reproducibility, assessed by two independent operators on the same day using the same analyte, siRNA-4.
Sensitive siRNA detection with RT-qPCR for in vivo samples
Figure 7 depicts the plasma and serum profiles for nonhuman primates (n = 3) for siRNA-5 after a single subcutaneous dose at 3 mg/kg measured by mass spectrometry (Fig. 7A) and RT-qPCR (Fig. 7B). siRNA levels in plasma samples collected >8 h postdose fall below lower limit of quantification (LLOQ) when analyzed by mass spectrometry (serum has a similar sensitivity, data not shown), whereas siRNA-5 was still detected up to 2,376 h (99 days) using RT-qPCR. For siRNA-5, the LLOQ for the RT-qPCR assay was >1 million-fold lower than for mass spectrometry (6.71 fg/mL vs. 10 ng/mL).
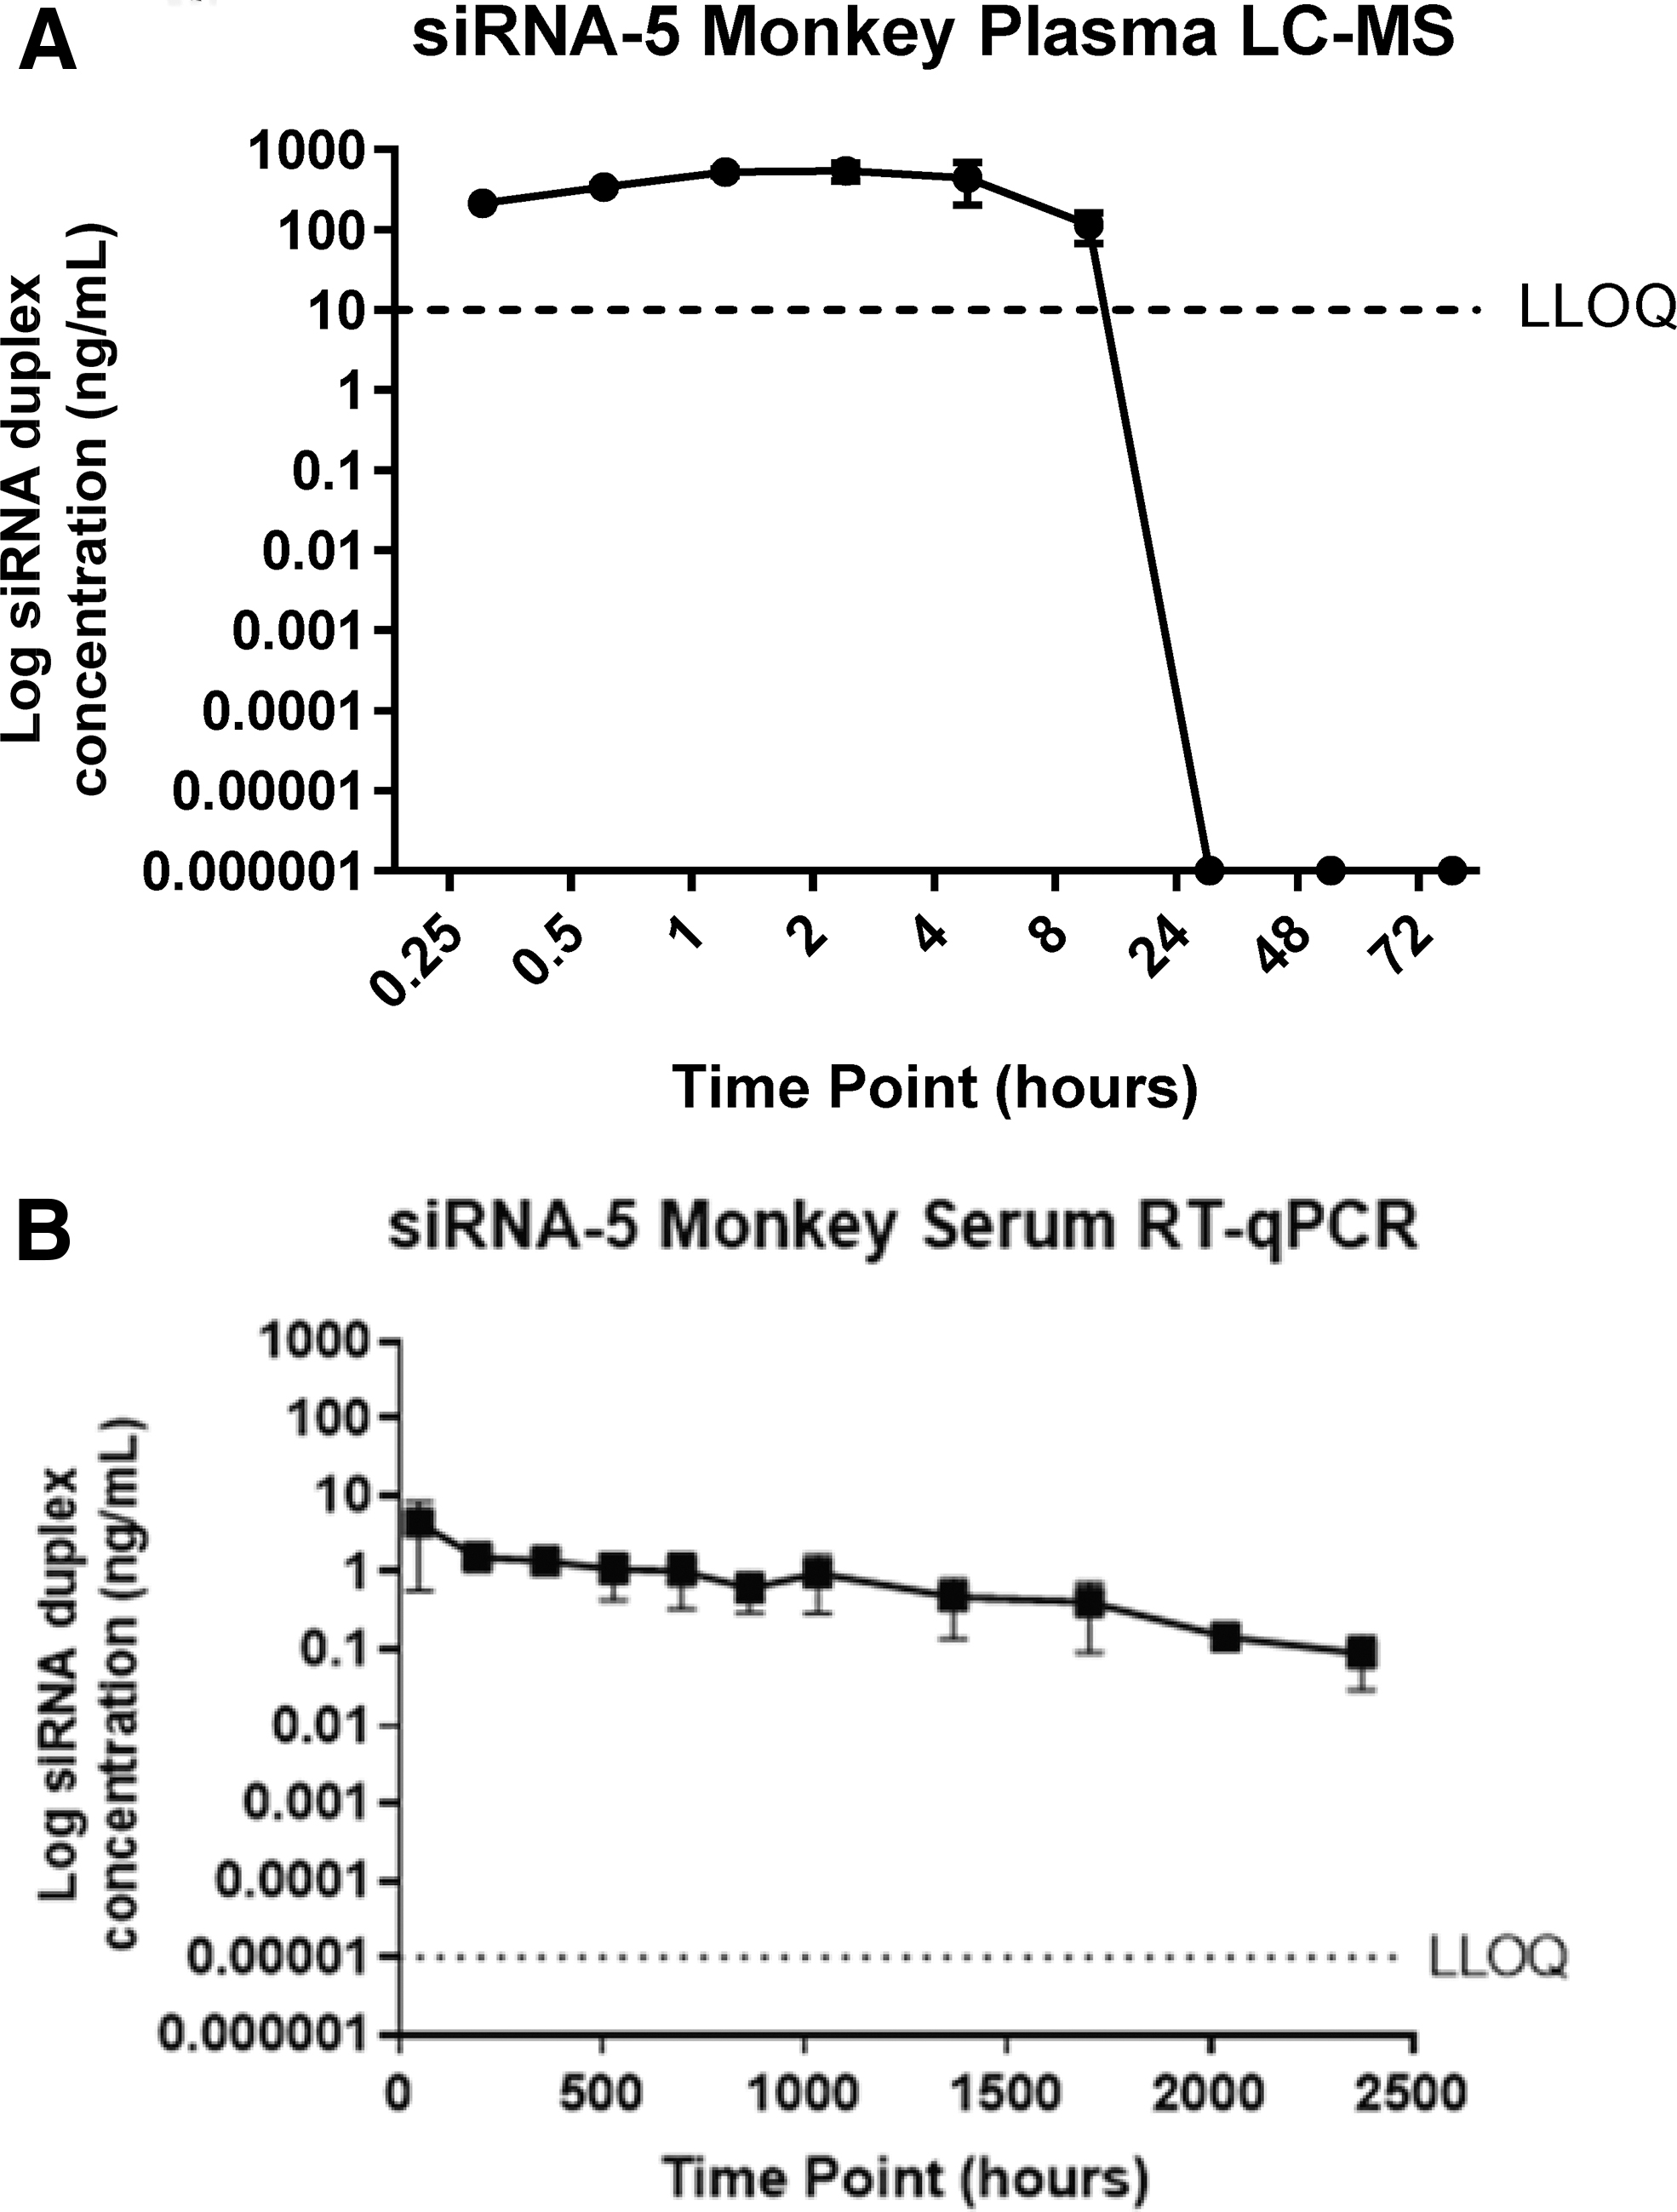
Mass spectrometry and RT-qPCR plasma and serum siRNA-5 profiles for nonhuman primates after one SC dose at 0.3 mg/kg. Mass spectrometry plasma profiles fall below LLOQ after only 8 h postdose
Effect of siRNA modifications on RT-qPCR detection
Standard curves of siRNA-6 with and without a single GNA modification showed that the incorporation of a single GNA base resulted in a 6 CT shift in the standard curve compared with the same duplex siRNA without the GNA base. In this case, both standard curves still showed qPCR efficiencies between 90% and 110% (Fig. 8A). This is not surprising since previous studies [22] have shown that the presence of this three-carbon acyclic backbone base is an unnatural substrate for reverse transcriptases and that only the addition of manganese (II) ions improved GNA-dependent DNA synthesis. They demonstrated that the incorporation of 1 mM manganese chloride (MnCl2) into the RT step led to increased full-length cDNA product.
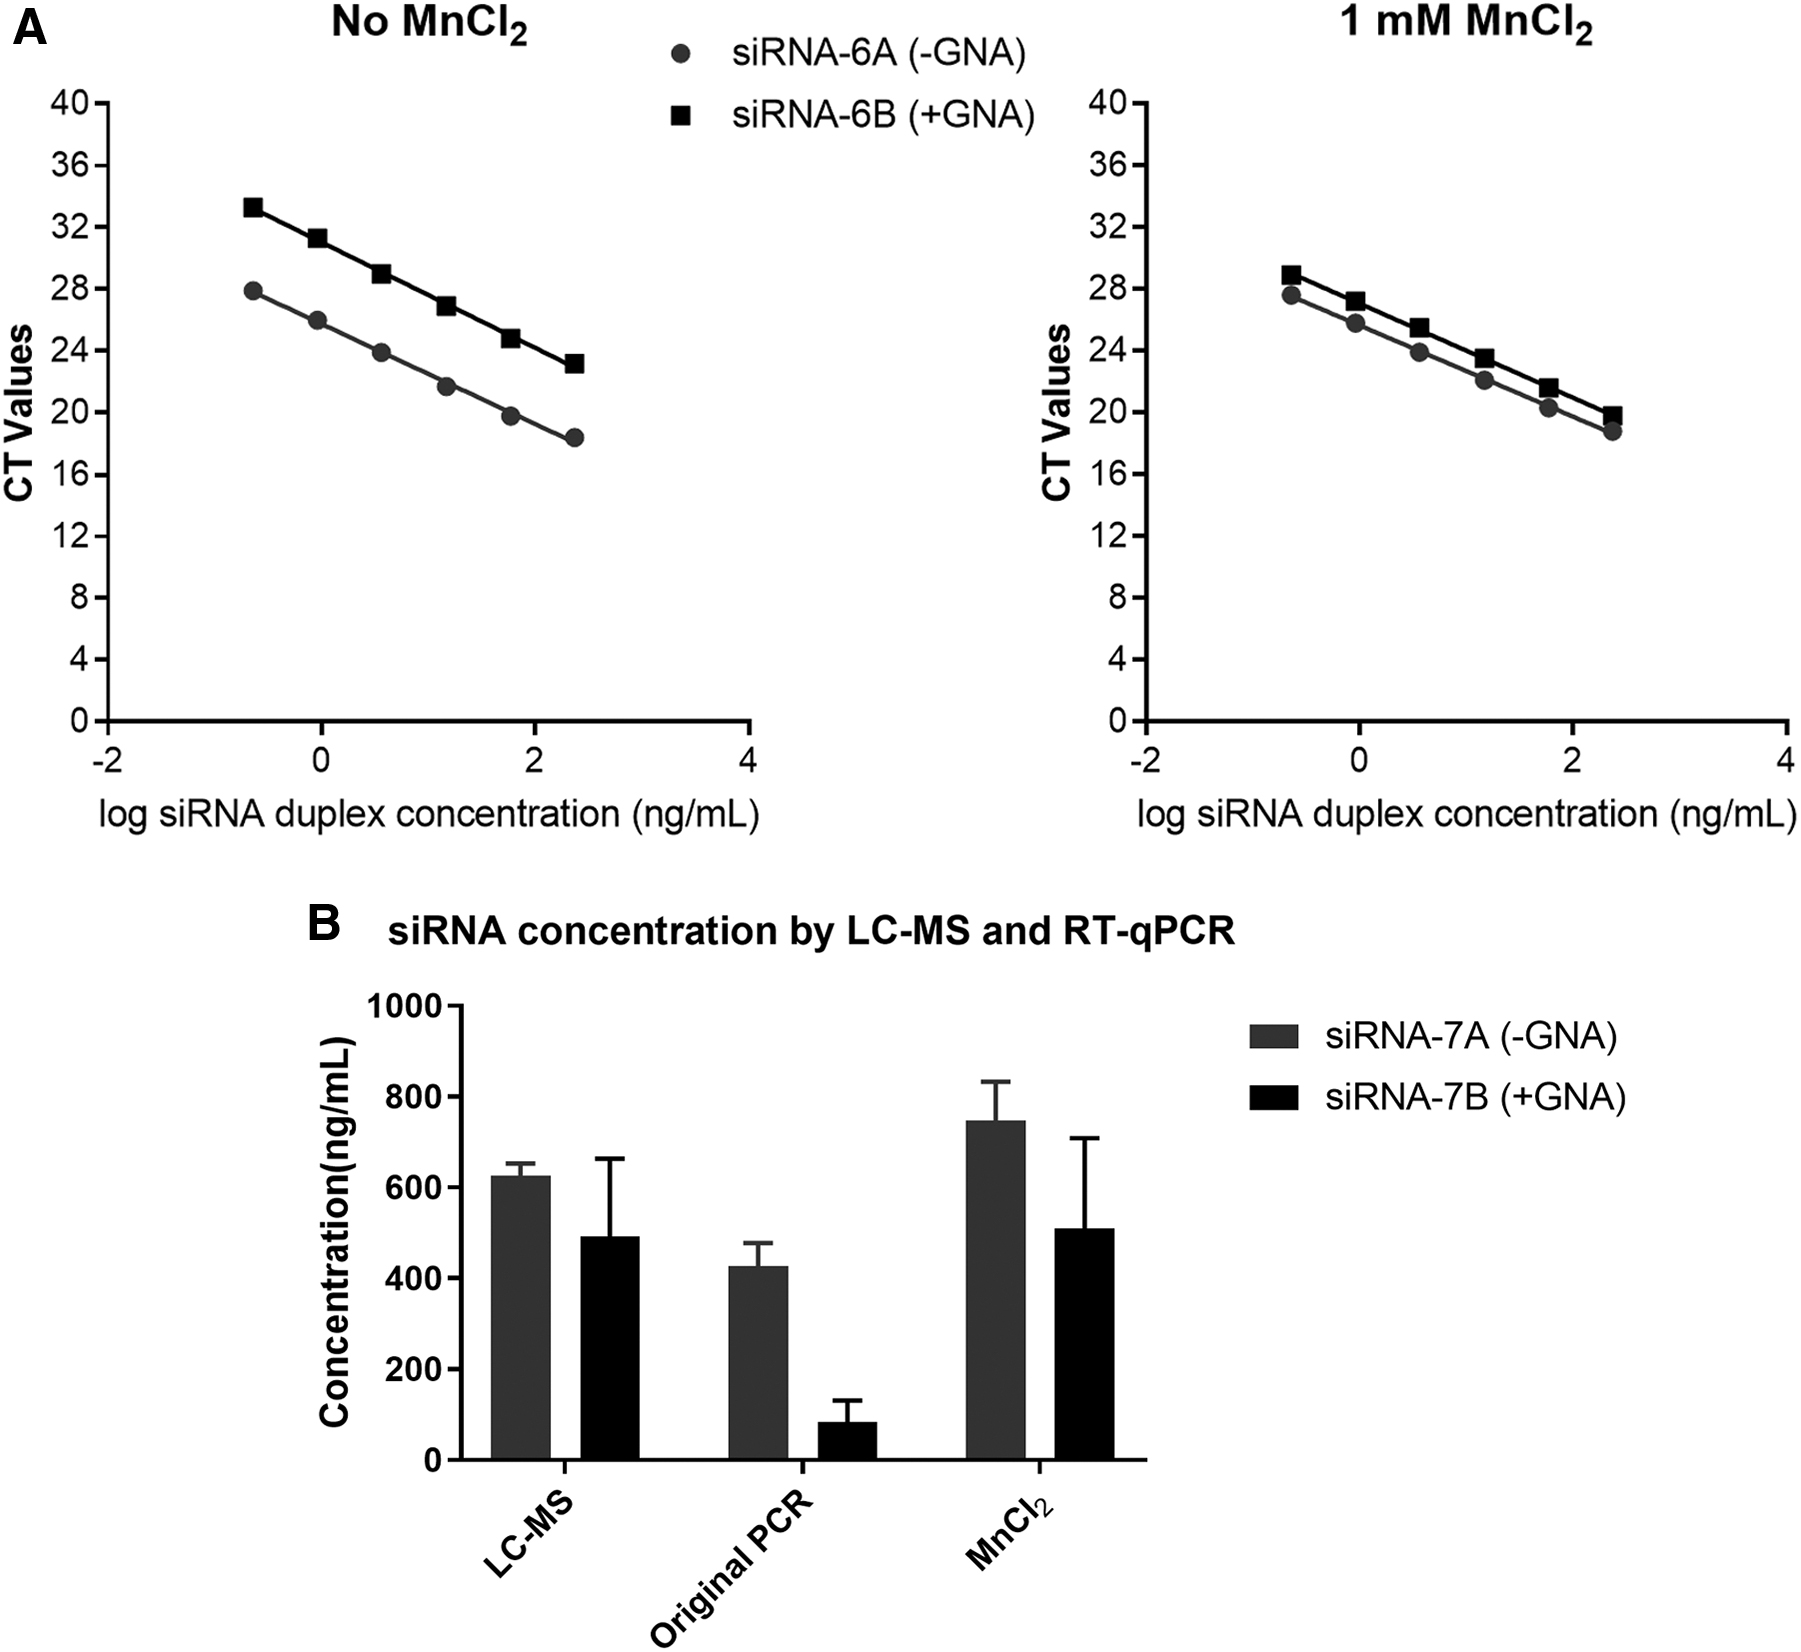
Effect of adding one thermally destabilizing modification on RT-qPCR assay performance and dynamic range for siRNA-6. Assay performance is improved after the addition of 1 mM MnCl2
For the siRNA-6 sequence, we also demonstrated that the incorporation of 1 mM MnCl2 during the cDNA synthesis step helped decrease the CT shift previously observed between the non-GNA (parent) and GNA-containing duplexes.
Next, to assess whether this strategy could be applied to samples from animals treated with a different siRNA duplex, we measured plasma concentrations for siRNA-7 from nonhuman primates 2 h after dosing at 3 mg/kg. As shown in Fig. 8B, siRNA concentrations using MnCl2 in the RT-qPCR reaction showed similar siRNA concentrations (ng/mL) for the GNA and non-GNA, compared with the mass spectrometry data (GNA does not influence the performance of this method, Supplementary Fig. S2). As shown in Fig. 8B, samples from animals treated with the GNA version of siRNA-7 were inaccurately quantified with the previous RT-qPCR strategy.
Correlation of siRNA levels with RISC-loaded drug and pharmacodynamic profiles
Very high assay sensitivity is crucial when evaluating the active form of siRNA therapeutics (ie, RISC-loaded drug). For this, the RT-qPCR method presented here can accurately measure siRNAs loaded into RISC, which are typically <1 ng/g (ng siRNA per gram liver tissue) as shown in Fig. 9. In these experiments, two siRNAs targeting two different targets, transmembrane serine protease 6 (Tmprss6) and mouse transthyretin (Ttr) were evaluated in animals receiving single SC doses of 2.5 and 0.75 mg/kg. The TMP siRNA was ESC (Enhanced Stabilization Chemistry) and the TTR siRNA was Advanced ESC, a more metabolically stable design. Total liver exposure was measured for the antisense strand of both siRNAs (Fig. 9A). The TMP siRNA had higher initial levels due to the higher dose but was eliminated faster than the TTR siRNA. RISC-loaded antisense siRNA was quantified by RT-qPCR and showed a direct correlation with target mRNA knockdown.
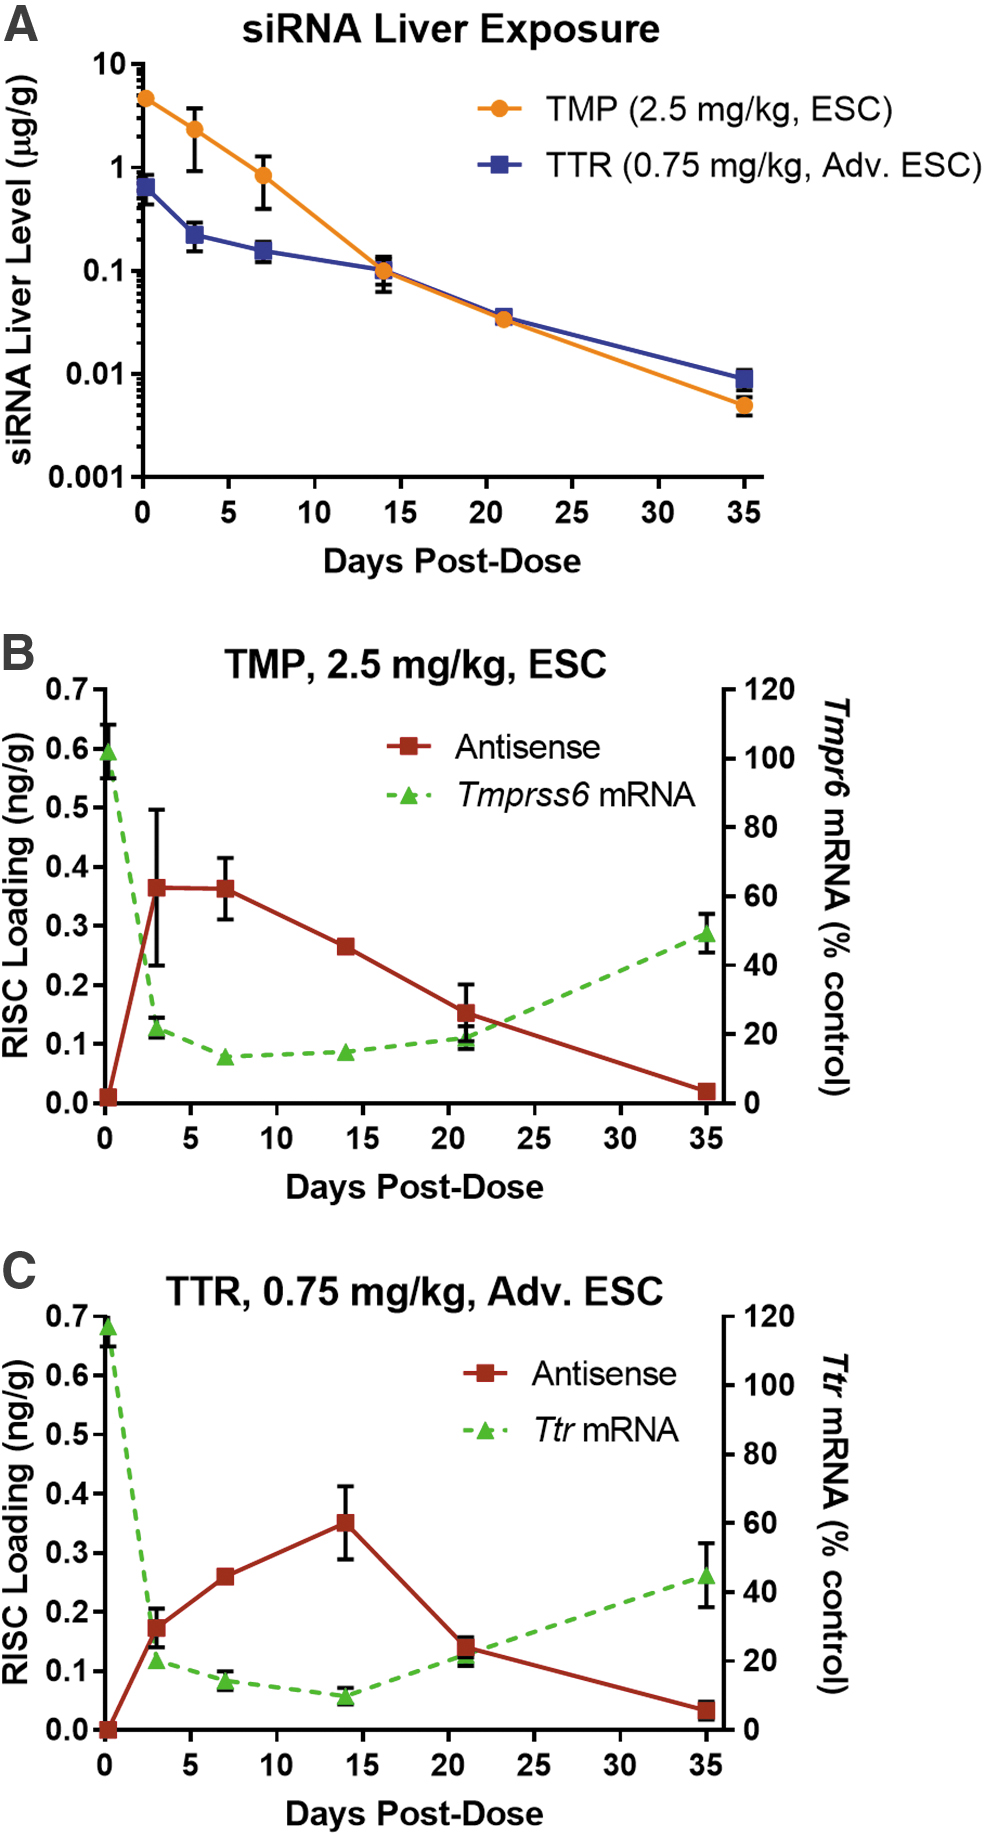
Utility of RT-qPCR for sensitive quantification of RISC-loaded drug and correlation with pharmacodynamic profiles from target liver tissues.
Discussion
To assess ADME properties of various siRNAs at the preclinical stage, it is important to quantify them accurately from various matrices without having to use time-consuming or costly isolation methods with variable efficiencies. Stem-loop RT-qPCR is a very high-throughput method and assay efficiency is not impacted by the presence of crude biological matrices with variable nonspecific binding properties [19,23].
In addition, to understand the mechanism of action of different siRNA sequences and chemical modifications at the discovery stage, it is necessary to have a sensitive method that can measure how much duplex is loaded into RISC. For this, hybridization enzyme-linked immunosorbent assay (ELISA) [24] or RT-qPCR could provide the necessary assay sensitivity (<1 ng/g) with medium- to high-throughput capabilities, respectively. However, one of the reported caveats of hybridization ELISA is its lower specificity compared with mass spectrometry, which has been addressed with novel approaches such as dual ligation hybridization [9,13]. Although hybridization ELISA provides a good alternative to RT-qPCR, it still requires seven primer/template/probe oligonucleotides and three different enzymes, a complex approach that may pose some challenges in routine bioanalysis, especially when dealing with many matrices and siRNA sequences.
Understanding RISC pharmacokinetics (PK) in preclinical species can assist in the development of quantitative models that predict reduction of target mRNA in humans. These predictions can help determine appropriate dose levels and dose frequency in future clinical trials. The RT-qPCR method is critical to these evaluations due to its exquisite sensitivity for the low drug levels present in RISC.
In addition, to quantify siRNAs with the same sequence but differing chemical modifications, RT-qPCR uses the same set of primers/probes (if equivalent RT and amplification efficiencies are previously established), whereas mass spectrometry requires specific method development for each unique siRNA.
Despite the advantages of RT-qPCR for siRNA analysis, it is still critical to assess intact siRNA (full-length) and its metabolites to design more stable and potent molecules. For this, mass spectrometry is to date the only bioanalytical method capable of achieving this level of specificity. Thus, it is still best to choose downstream bioanalytical methods based on best fit for purpose contingent on throughput, sensitivity, and specificity needs.
In summary, RT-qPCR provides high throughput and high sensitivity with tolerance for a variety of biological matrices. In addition, this method expedites the evaluation of any set of siRNAs having the same sequence but with distinct chemical modifications by utilizing a single set of primers for all analyses.
Footnotes
Acknowledgment
We thank Sarah Bond for careful review of the article and for providing comments and insights.
Author Disclosure Statement
All authors were employees of Alnylam Pharmaceuticals, Inc. at the time of this study.
Funding Information
Internal funding for this work was provided by Alnylam Pharmaceuticals. No funding was received from outside institutions or funding agencies.
References
Supplementary Material
Please find the following supplemental material available below.
For Open Access articles published under a Creative Commons License, all supplemental material carries the same license as the article it is associated with.
For non-Open Access articles published, all supplemental material carries a non-exclusive license, and permission requests for re-use of supplemental material or any part of supplemental material shall be sent directly to the copyright owner as specified in the copyright notice associated with the article.