
Abstract
Hereditary transthyretin-mediated amyloidosis is an inherited, rapidly progressive, life-threatening disease caused by mutated transthyretin (TTR) protein. Patisiran is a small interfering RNA (siRNA) formulated in a lipid nanoparticle that inhibits hepatic TTR protein synthesis by RNA interference. We have developed an indirect-response pharmacokinetic–pharmacodynamic model relating plasma siRNA (ALN-18328) levels to serum TTR reduction across five clinical studies. A sigmoidal function described this relationship, with estimated Hill coefficient of 0.548, and half maximal inhibitory concentration (IC50), IC80, and IC90 values of 9.45, 118.5, and 520.5 ng/mL, respectively. Following patisiran 0.3 mg/kg every 3 weeks (q3w), steady-state plasma ALN-18328 exposures were between IC80 and IC90, yielding average serum TTR reductions of 80%–90% from baseline. Covariate analysis indicated similar TTR reduction across evaluated intrinsic and extrinsic factors, obviating the need for dose adjustment. Modeling results support the recommended patisiran dosing schedule of 0.3 mg/kg q3w, with a maximum dose of 30 mg for patients weighing ≥100 kg.
Introduction
Hereditary transthyretin-mediated (hATTR) amyloidosis is an inherited, rapidly progressive, debilitating, and often fatal disease caused by mutations in the transthyretin (TTR) gene [1–4]. The TTR protein is primarily produced in the liver and forms a tetramer that transports vitamin A and hormone thyroxine in association with retinol-binding protein in plasma and cerebrospinal fluid [2,3,5]. TTR tetramers dissociate into misfolded monomers due to pathogenic mutations in the TTR gene, the most common of which worldwide is the V30M mutation (valine to methionine mutation at position 30 in the human TTR gene) [6]. Misfolded TTR accumulates as amyloid deposits in multiple tissues, including nerves, heart, and the gastrointestinal tract [3,4]. The heterogeneous clinical manifestations of hATTR amyloidosis include sensory and motor neuropathy, autonomic neuropathy, cardiomyopathy, nephropathy, and gastrointestinal impairment (eg, diarrhea and constipation) [6–8]. The disease progresses rapidly; median survival is 4.7 years following diagnosis, with a reduced survival (3.4 years) for patients presenting with predominant cardiomyopathy [9–12].
RNA interference (RNAi) is an endogenous mechanism for regulating gene expression [13,14]. The RNAi process involves small interfering RNAs (siRNAs) bound to the RNA-induced silencing complex (RISC), which directs cleavage of the target messenger RNA (mRNA) resulting in specific gene silencing. Patisiran was designed to inhibit hepatic synthesis of mutant and wild-type TTR by targeting the 3′ untranslated region of TTR mRNA [15]. The patisiran drug substance is a novel, synthetic, double-stranded siRNA, composed of two 21-nucleotide, partially complementary single strands. To facilitate hepatic drug targeting, ALN-18328 is formulated as a lipid nanoparticle (LNP) composed of four lipid excipients.
In the Phase 3 APOLLO study, patisiran rapidly reduced serum TTR and maintained an 81% median reduction over 18 months in patients with hATTR amyloidosis [16]. Treatment with patisiran resulted in statistically significant improvement in polyneuropathy, quality of life, gait speed, nutritional status, and activities of daily living versus placebo [16]. Patisiran is approved for the treatment of the polyneuropathy of hATTR amyloidosis in adults by multiple countries including the U.S. Food and Drug Administration [17] and by the European Medicines Agency [18]. The recommended patisiran dosing regimen is 0.3 mg/kg administered through intravenous (IV) infusion every 3 weeks (q3w) up to a maximum dose of 30 mg for patients weighing ≥100 kg [17,18].
We have developed a pharmacokinetic–pharmacodynamic (PK/PD) model which linked plasma ALN-18328 levels to inhibition of hepatic TTR production and consequently lower serum TTR levels across five patisiran clinical studies. This analysis aimed to characterize the exposure–response relationship, quantify inter- and intrasubject variability, evaluate relevant covariate effects on the PK/PD relationship, and assess the adequacy of the recommended patisiran dosing regimen.
Materials and Methods
Summary of clinical trials
This PK/PD analysis included pooled data from five clinical studies. Study design and sampling schedules are summarized in Supplementary Table S1. These studies included up to 2 years' patisiran exposure. Frequent PK/PD sampling pre- and postdosing was performed for Phase 1 and Phase 2 studies (Studies 001, 002, and 005) and sparse PK/PD sampling was performed for the Phase 3 study (Study 004) (Supplementary Table S1). The study protocols were approved by the ethics committee at each site. All participants provided written informed consent.
Development of population PK/PD model
A nonlinear mixed-effects modeling approach was used. Before PK/PD analysis, a population PK analysis of ALN-18328 was performed and posterior Bayes estimates of the PK parameters were merged with PD samples for PK predictions [19]. The structural PK/PD model was selected based on fit of the TTR reduction data. Random effects structure was initially fitted with diagonal block and covariances were added following evaluation of post hoc correlations. Proportional and additive residual variabilities were also assessed.
The quality of fit was evaluated using statistical criteria (ie, deviance, −2 × log–likelihood [−2LL]) as well as graphical evaluation, including: plots of observed dependent variables (DVs) versus population predicted data (PRED) and individual predicted data (IPRED); DVs versus time after first administration (time) and DVs versus time after previous dose (TAD), with locally weighted scatterplot smoothing lines for IPRED and PRED; and conditional weighted residuals (CWRES) versus PRED, versus TAD, and versus time. Outliers with absolute CWRES >4 were identified and the sensitivity of parameter estimates to outliers was assessed. If parameter estimates were largely similar, outliers with a difference of <15% were retained in the model.
Covariate–parameter relationships for evaluation in the PK/PD analysis were prespecified based on clinical relevance. Prespecified covariates were selected to explain the between-subject variability on selected PD parameters. For the zero-order hepatic synthesis rate for TTR (Kin) the covariates were: body weight, age, study population (healthy subjects versus patients), V30M genotype, and mild hepatic impairment. For the ALN-18328 concentrations in the effect compartment that resulted in 50% reduction in TTR synthesis rate [half maximal inhibitory concentration (IC50)], the covariates were: baseline serum TTR, body weight, age, and mild hepatic impairment. The covariate effects of renal impairment, race, and sex were not found to significantly impact PK exposures of ALN-18328 and therefore were not prespecified as covariates in the PK/PD model. Nonetheless, post hoc evaluation of random effects versus these covariates was conducted to evaluate and confirm absence of noticeable trends. Additional covariates were added based on noticeable trends observed during post hoc evaluation.
Continuous and categorical covariates were included in the model using power and exponent functions, respectively. The full model approach was used: all covariates entered the model simultaneously and parameter estimates and 95% prediction interval (PI) reflecting the confidence interval (CI) were obtained using a stratified bootstrap algorithm with 500 replicates. Stratification was by study population, sex, race, hepatic function, and V30M genotype. Forest plots were used to present fold changes in PD parameters for covariate categories of interest relative to a typical patient; for continuous covariates, fold change in PD parameters was evaluated over the range of values (minimum vs. maximum).
Patisiran was manufactured using three different buffers of the ALN-18328 solution that were used during manufacturing batch scale-up [20]. The impact of change in manufacturing process was evaluated as a time-varying covariate in the PK/PD model. The covariate effect of batch scale on relative bioavailability fraction was evaluated in a univariate setting and was retained in the full model evaluation if found statistically significant [ie, 95% CI excluded 0].
The final population PK/PD model was qualified using visual predictive checks (VPCs). Time profiles of serum TTR levels were simulated using 1,000 replicates. Observed and simulated data were separated based on nominal time or visit. Within each bin, nonparametric 95% CI of the 10th, 50th, and 90th percentiles of predicted concentrations were computed and compared with the 10th, 50th, and 90th percentiles of observed concentrations.
Model application
Based on the final PK/PD model estimates, rich concentration–time profiles of serum TTR in typical patients were simulated using 500 replicates to evaluate covariate effects on steady-state TTR lowering. Different typical patients were defined by changing covariate values of statistically significant covariates in the full PK/PD model. For continuous covariates, the minimum and maximum were used to explore the range of possible effects while keeping all other covariates at the reference value.
The simulated serum TTR levels at steady state (40 weeks) were compared with steady-state serum TTR levels observed in the Phase 2 open-label extension (OLE) and APOLLO studies.
To compare the PD effects of the maximum dose of 30 mg q3w versus the weight-based 0.3 mg/kg q3w regimen in patients weighing ≥100 kg, steady-state serum TTR levels were simulated for these regimens in patients ≥100 kg and were compared against the steady-state TTR levels following the 0.3 mg/kg q3w regimen in patients <100 kg. The simulations were based on individual empirical Bayes estimates from the PK/PD model.
Software
Dataset preparation and data exploration and visualization were performed using SAS v9.3 or R® (Version 3.3.1). Population PK/PD modeling and model evaluation and simulations were performed using Phoenix™ NLME® v7 (Pharsight, A Certara™ Company).
Results
A total of 4,331 measurable serum TTR concentrations were pooled from 5 clinical studies, providing data over a wide patisiran dose range (0.01–0.5 mg/kg) and from single and repeat administrations for up to 2 years (Supplementary Table S1). Characteristics of the 29 healthy volunteers and 254 patients with hATTR amyloidosis contributing to the analyses are given in Table 1.
Baseline Characteristics of the Pharmacodynamic Modeling Analysis Population
hATTR, hereditary transthyretin-mediated; mNIS+7, modified Neuropathy Impairment Score +7; SD, standard deviation; TTR, transthyretin; V30M, valine to methionine mutation at position 30 in human TTR gene.
Median age, body weight, and baseline mean serum TTR levels in patients with hATTR amyloidosis were similar between patisiran and placebo groups. In the patisiran-treated population, 75.4% were male, 76.9% Caucasian, 7.5% had mild hepatic impairment, 19.6% and 9.0% had mild and moderate renal impairment, respectively, and 39.2% had the V30M genotype.
Exploratory data analysis used in model development
Across the patisiran clinical program, the serum TTR profiles following patisiran dosing exhibited hysteresis with a lag in peak serum TTR reduction compared with peak plasma ALN-18328 concentration (Fig. 1a). Maximum serum TTR reduction of 70%–80% was observed 7–14 days after the first dose, whereas peak ALN-18328 plasma concentrations were seen at the end of infusion (Fig. 1a). To account for this delay, an indirect PK/PD model with an effect compartment was evaluated. Sustained TTR reduction was observed in the 0.3 mg/kg q3w patisiran treatment group (Fig. 1b). No TTR reduction was observed in the placebo group (Fig. 1b); thus, a placebo-effect model was not considered in the PK/PD model.
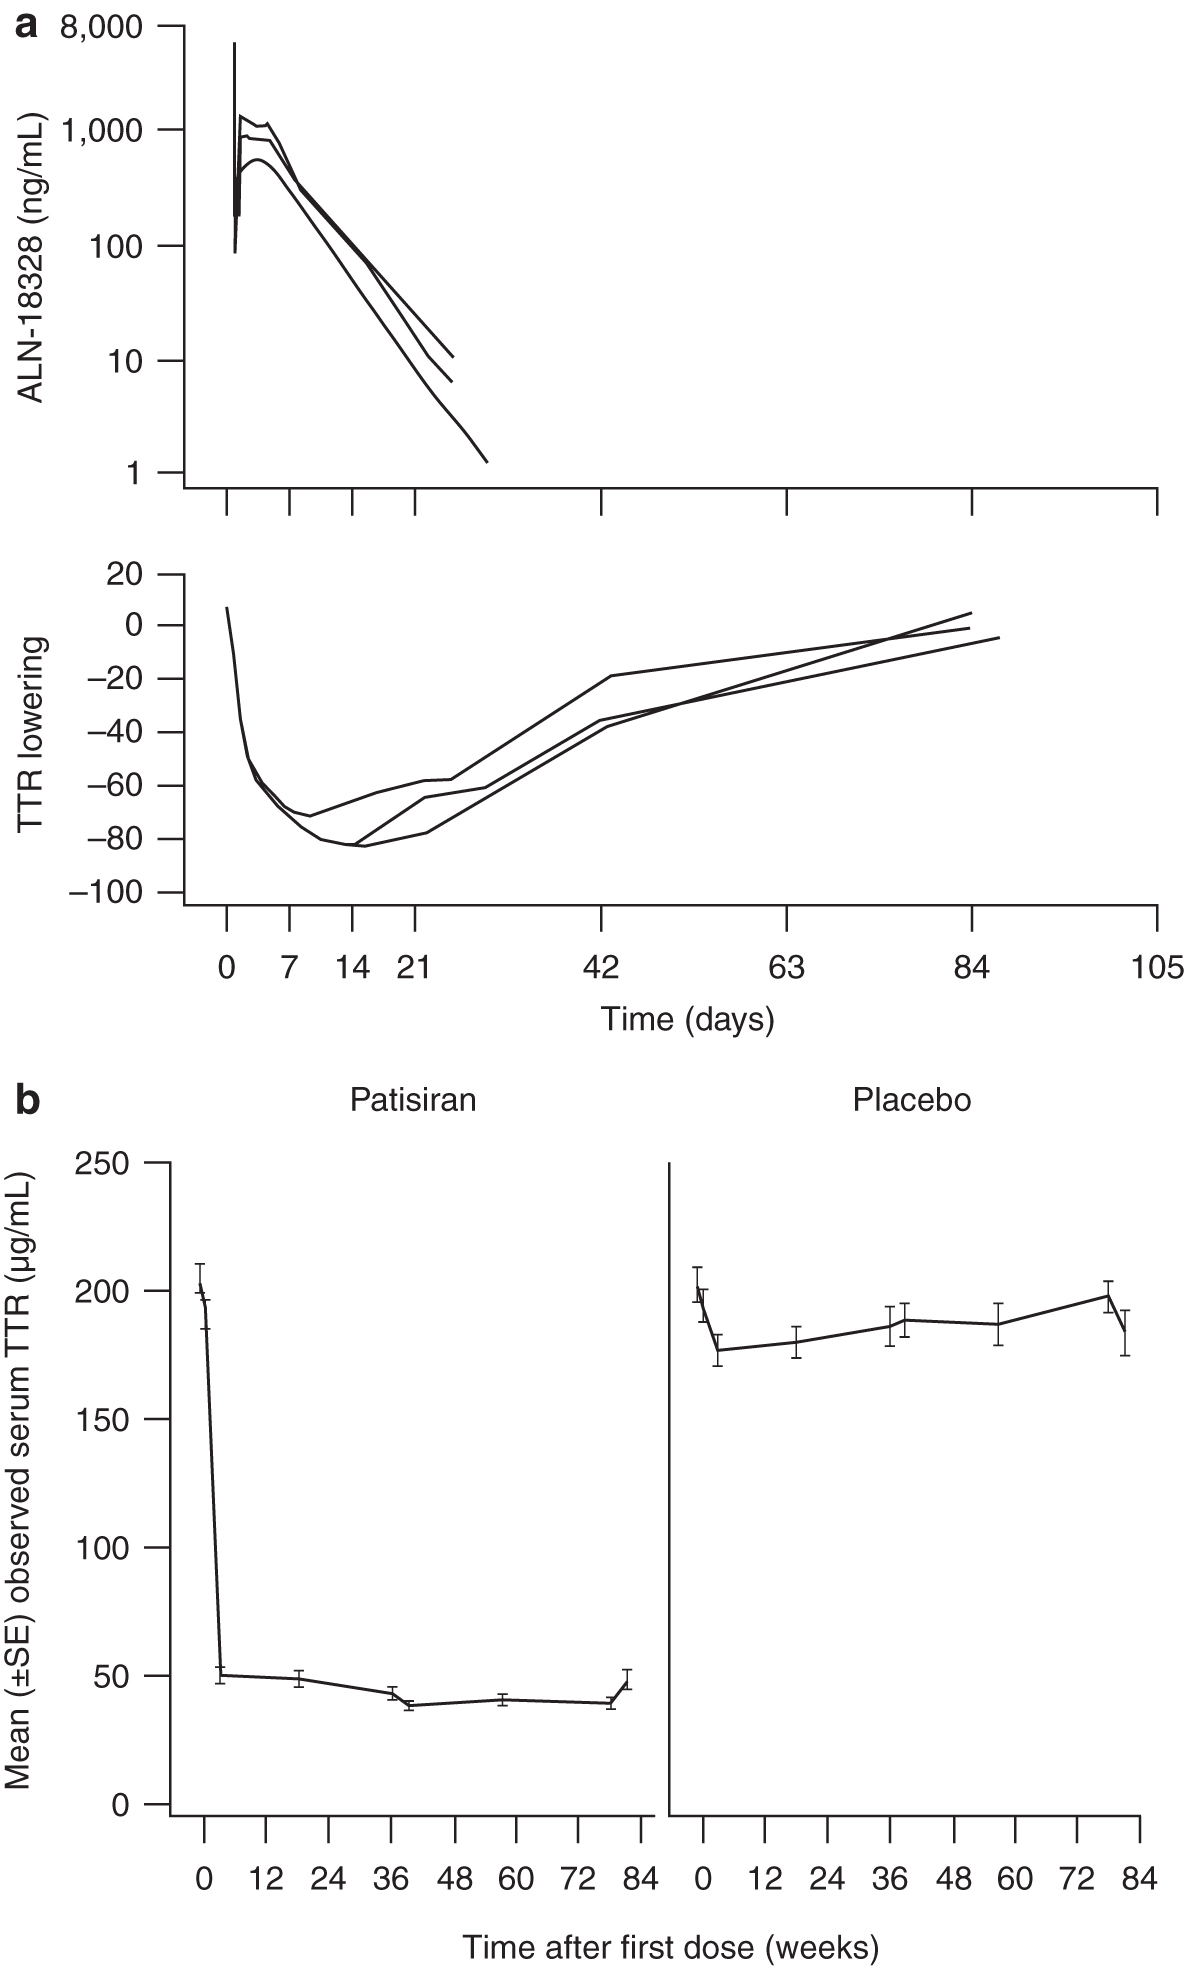
A clear dose–response relationship was observed, whereby increasing patisiran dose levels resulted in greater magnitude of serum TTR reduction, with a plateau in maximum TTR reduction seen at patisiran dose levels ∼0.3–0.5 mg/kg [15,20]. This observation suggested evaluation of a maximum effect model to describe the plateau in maximum serum TTR reduction seen at higher patisiran exposures.
Description of the structural model
The final PK/PD model was an indirect-response model with a sigmoidal inhibitory effect model linking modeled plasma ALN-18328 concentrations with reduction of TTR synthesis rate through an effect compartment (Fig. 2). ALN-18328 plasma PK in these five studies was predicted from a stand-alone population PK model [19]. A brief description is provided in the Supplementary Data. Since TTR is primarily produced in the liver, changes in serum TTR levels are reflective of change in hepatic production rate caused by patisiran administration. Thus, an indirect-response model with inhibition of rate of TTR production was adequate to describe changes in serum TTR levels:
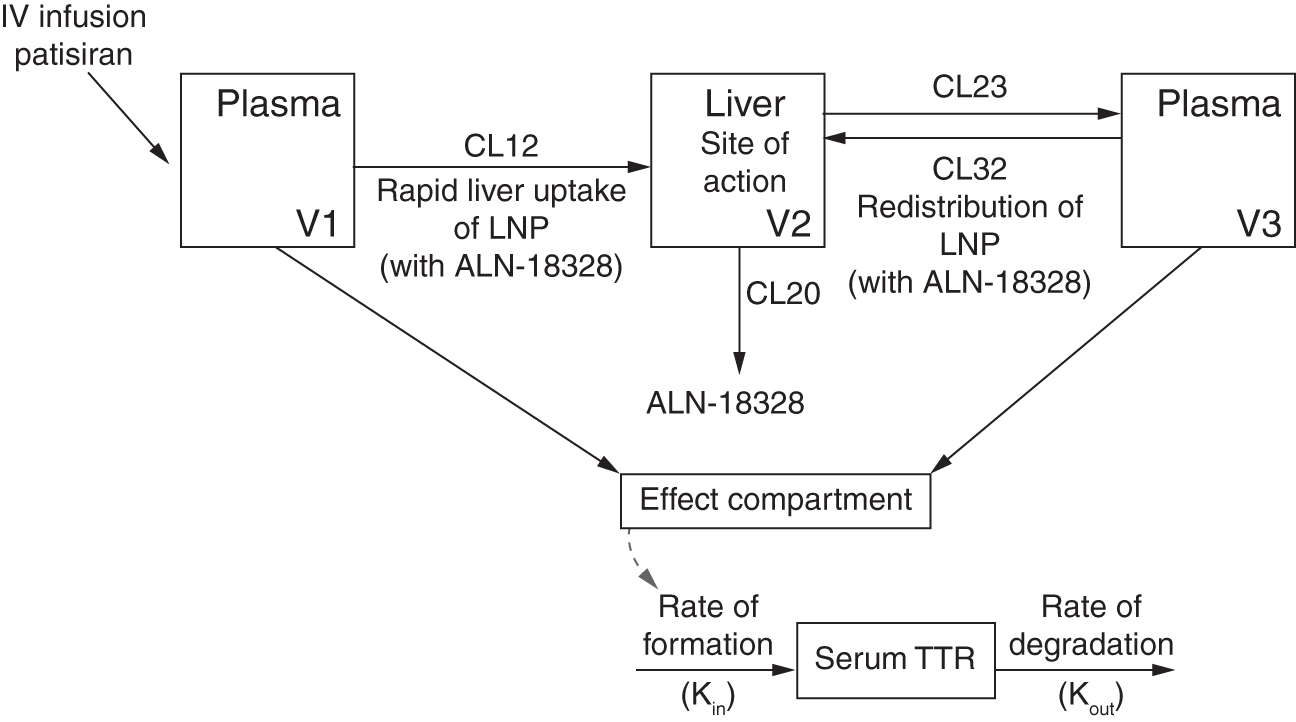
Schematic representation of indirect-response model linking plasma ALN-18328 concentrations and serum TTR. ALN-18328, patisiran drug substance (small interfering RNA), which is formulated in an LNP; CL12, ALN-18328 initial distribution clearance from plasma (compartment 1) to liver (compartment 2) in first phase; CL20, ALN-18328 elimination clearance from liver (compartment 2); CL23, ALN-18328 redistribution clearance from liver (compartment 2) to plasma (compartment 3) in second phase; CL32, ALN-18328 distribution clearance from plasma (compartment 3) to liver (compartment 2) in second phase; IV, intravenous; Kin, rate of TTR formation; Kout, rate of TTR degradation; LNP, lipid nanoparticle; siRNA, small interfering RNA; TTR, transthyretin; V1, distribution volume of compartment 1; V2, distribution volume of compartment 2; V3, distribution volume of compartment 3.
where Kout is the first-order degradation rate for TTR. Drug EffectALN-18328 describes the ALN-18328 concentration–effect relationship using the sigmoidal Imax function:
where Ce(t) is the ALN-18328 concentration in the effect site at time t; parameter γ is the Hill coefficient describing the shape of the concentration–effect curve relationship; and Imax represents the maximum inhibitory drug effect and was fixed to 1, based on observed TTR reduction of up to 98% in APOLLO [16].
ALN-18328 exposures in the effect compartment represent RISC complex-loaded siRNA within hepatocytes, which degrades TTR mRNA and reduces TTR protein synthesis. The effect compartment exposures were described by:
where Ce is the effective ALN-18328 concentration; Cp is the plasma ALN-18328 concentration predicted from the population PK model [19]; and Ke is a first-order equilibrium rate constant. Ce achieves equilibrium with Cp through Ke and reflects the equilibrium delay between plasma and RISC-loaded ALN-18328 concentrations in hepatocytes. ALN-18328 loaded onto RISC leads to TTR synthesis inhibition. At steady state, effect compartment concentrations are in equilibrium with plasma concentrations and area under the curve (AUC) in the effect compartment is equal to the AUC in the plasma compartment. Thus, average plasma concentrations over the dosing interval (Cpave) reflect steady-state effect compartment exposures and were used for exposure–response interpretation. Inclusion of the effect compartment resulted in a significant reduction in −2LL function of 206.79.
Inter-individual variability was estimated on Kin, Kout, and IC50 assuming log-normal distribution. Correlation between Kin and Kout was included based on post hoc evaluation. The residual error term was described using proportional error function. Of the 4,331 serum TTR samples analyzed, only 6 had absolute CWRES >4. Exclusion of outliers resulted in negligible (2%) difference in PD estimates; therefore, all TTR samples were retained in the final analysis.
Covariate model development
The results of a separate population PK analysis indicated that renal impairment, anti-drug antibodies, race, and sex have no significant impact on PK exposures of ALN-18328 [19]. Furthermore, these covariates showed no trends in post hoc evaluation with PD parameters. Therefore, these covariates were not evaluated in the present PK/PD model.
Evaluation of empirical Bayes estimates of individual estimates versus covariates showed a positive relationship between body weight and IC50 (Pearson correlation coefficient [r] of 0.18) and a weak correlation between age and IC50 (r = −0.09). Kin showed positive correlation with body weight (r = 0.33) and weak negative correlation with age (r = −0.16). All other covariate correlations were minor. The univariate effect of batch scales was not statistically significant and thus was not retained in the full population PK/PD model evaluation [20].
A full covariate modeling approach was used, with all covariates entering the model simultaneously. The final list of covariates on Kin were body weight, age, study population (healthy volunteers versus patients), genotype (V30M vs. non-V30M), and hepatic function (mild impairment vs. normal). Covariates on IC50 were baseline serum TTR, body weight, age, and mild hepatic impairment.
Model estimates
The parameter estimates of the base and covariate PK/PD model are presented in Table 2. Incorporation of covariates led to a decrease in −2LL of 152.
Population Pharmacodynamic Model Parameter Estimates from Base And Final Models
Statistical significance was reached when nonparametric 95% CI excluded the null value.
One participant with moderate hepatic impairment was pooled with participants with mild hepatic impairment.
ALN-18328, patisiran drug substance (small interfering RNA); BSV, between-subject variability; CI, confidence interval; IC50, ALN-18328 concentration producing 50% TTR reduction; Imax, maximal inhibition; Ke, transfer rate constant to the effect compartment; Kin, rate of TTR formation; Kout, rate of TTR degradation; NA, not applicable; PD, pharmacodynamic; PK, pharmacokinetic; TTR, transthyretin; V30M, valine to methionine mutation at position 30 in human TTR gene.
The typical value of Kin, which reflects endogenous TTR production, was 2.86 μg/mL/h, and the ratio of Kin/Kout was 160.7 μg/mL, which was comparable with the observed median baseline TTR concentrations in patients with hATTR amyloidosis (Table 2). Covariate evaluation suggested that the TTR synthesis rate was higher in healthy volunteers (+62%); increased with increasing body weight with an exponent of 0.37, and was higher in subjects with the V30M genotype (+34%). Although mild hepatic impairment and age were statistically significant covariates on Kin, the effect sizes were negligible: −1.9% in mild hepatic impairment versus normal hepatic function, and −1% across the age range of 21–83 years (Supplementary Fig. S1b). Incorporation of covariates led to a decrease in between-subject variability (BSV) for Kin from 60.9% to 50.8%.
The typical value for Kout was 0.0178 h−1, which reflects a TTR degradation half-life of 40 h. The typical value of Ke was 0.00551 h−1 (Table 2), which represents an equilibrium half-life [ln(2)/Ke] of 5.24 days between plasma ALN-18328 concentrations and RISC-loaded ALN-18328 levels. The Hill coefficient estimate describing the shape of the exposure–response curve was 0.548. The model estimate of ALN-18328 IC50 was 9.45 ng/mL.
Covariate evaluation indicated IC50 values increased with increasing baseline body weight, with an exponent of 0.91. IC50 values were also slightly lower (−31%) in subjects with mild hepatic impairment versus normal hepatic function and were not significantly impacted by baseline age and serum TTR levels (Supplementary Fig. S1a). The estimate of BSV for IC50 was high (344% with 21% shrinkage) and estimates were comparable between the base and covariate model. The residual variability on predicted serum TTR concentrations derived with the proportional error model was relatively low (28.2%) and was similar to the base model estimate.
Model evaluation
The goodness-of-fit plots from base and final models indicated that population and individual predicted concentrations of serum TTR were evenly distributed around the line of identity (Supplementary Fig. S2). No residual bias in CWRES was observed as a function of population prediction and time.
VPCs of the final PK/PD model were based on serum TTR data from long-term patient studies after 18–24 months of patisiran 0.3 mg/kg q3w administration with intensive sampling profiles and are presented in Supplementary Fig. S3. There was good agreement between model simulations and observed data from the Phase 2 OLE and the Phase 3 APOLLO study. Overall, the observed medians and 10th–90th percentiles were generally within the simulated 95% CI, confirming the predictive ability of the PK/PD model. However, some divergence was observed in the Phase 2 OLE, where the observed 90th percentile of serum TTR was lower than model predictions at weeks 34 and 106. This was likely due to small sample size (n = 27), as the 90th percentile was adequately captured in patisiran-treated patients in the larger APOLLO study (n = 145).
At steady state following IV infusion of patisiran 0.3 mg/kg q3w, the model-predicted trough and maximum median serum TTR reductions from baseline were 76.6% and 85.4%, respectively. These results were in good agreement with the observed maximum trough and postdose TTR reductions of 77.7% and 87.8%, respectively, in the APOLLO study [16].
Model applications
The model-estimated concentration–response relationship showed that reductions in serum TTR were positively correlated with increasing ALN-18328 plasma PK exposure (Fig. 3). The average plasma ALN-18328 IC80 and IC90 were estimated to be 118.5 and 520.5 ng/mL, respectively.
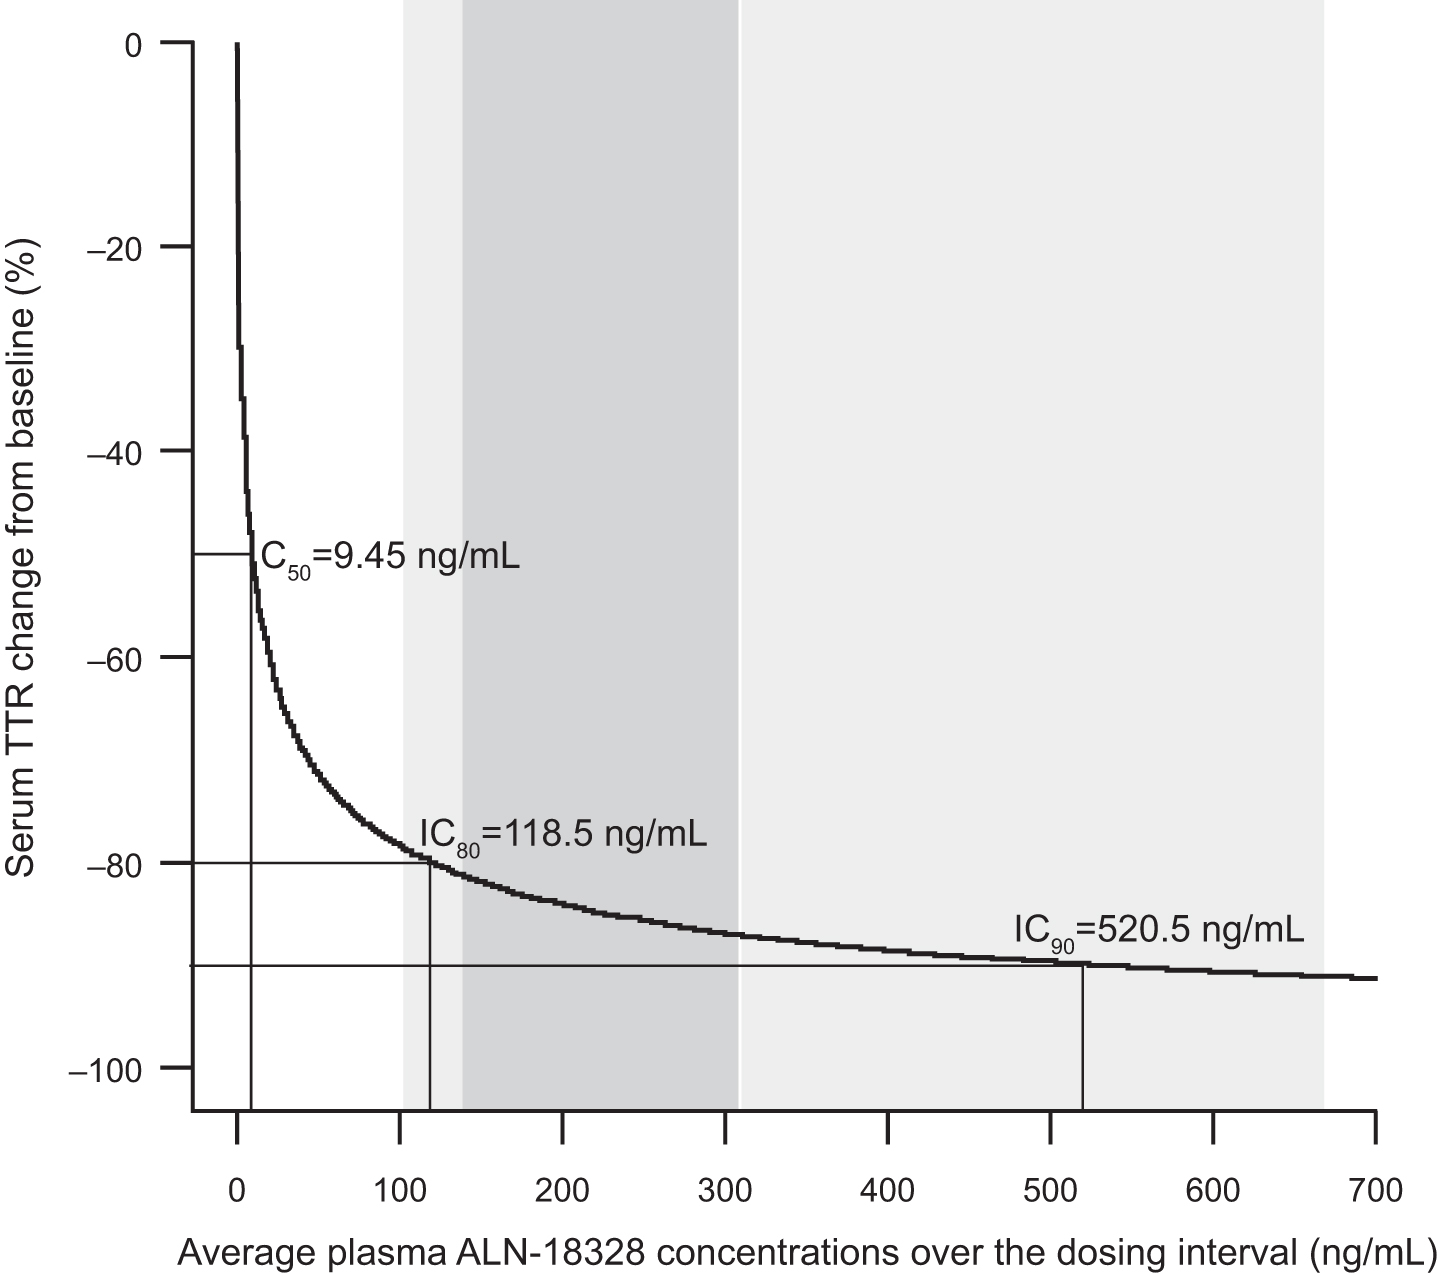
Simulated concentration–response relationship for steady-state TTR reduction. The gray shaded area and light gray shaded area represent the 25th and 75th percentiles (139.1–309.5 ng/mL) and the 5th and 95th percentiles (102.8–668.7 ng/mL), respectively, of the average steady-state concentration of ALN-18328 following 0.3 mg/kg patisiran administered every 3 weeks. ALN-18328, patisiran drug substance (small interfering RNA); IC50, IC80, and IC90 are the ALN-18328 plasma concentrations predicted to produce 50%, 80%, and 90% serum TTR reduction from baseline, respectively. IC50, half maximal inhibitory concentration; TTR, transthyretin.
The simulated magnitude and duration of serum TTR reduction were similar across the following covariates: body weight range of 36.2–110.0 kg (median TTR reduction of 84.9% and 85.6%, Supplementary Fig. S4a); mild hepatic impairment and normal hepatic function (median of 87.7% and 85.4%, respectively, Supplementary Fig. S4b); V30M and non-V30M genotypes (median of 85.3% and 85.4%, respectively, Supplementary Fig. S4c).
In patients weighing ≥100 kg, the model predicted similar steady-state TTR reduction of 79% in patients receiving either a capped fixed dose regimen of 30 mg or a body weight-based dose regimen of 0.3 mg/kg q3w (Supplementary Fig. S5). Further, these reductions were similar to median serum TTR reduction of 80% in patients weighing <100 kg, indicating that the capped fixed dose of 30 mg for patients weighing ≥100 kg does not lead to suboptimal reduction in serum TTR.
Discussion
This analysis describes the first population PK/PD model of an siRNA therapeutic. Here, an indirect-response PK/PD model linking siRNA, ALN-18328, plasma concentrations to reduction of liver TTR synthesis through an effect compartment adequately described the time-course of serum TTR reduction across different dose levels and dosing duration.
In clinical studies, a 7- to 14-day lag period was observed between peak TTR reduction compared with peak ALN-18328 plasma concentrations post-dose (generally around end of infusion) [21,22]. The observed hysteresis is likely attributable to time taken for a sequence of events from hepatic uptake of LNP, endosomal trafficking, loading of siRNA onto RISC, and elimination of existing serum TTR [15]. The model used an effect compartment to describe this hysteresis with an equilibrium half-life of 5.24 days. The resulting model adequately described the TTR time-course following single- and multiple-dose regimens of patisiran.
The PK/PD model used ALN-18328 plasma concentrations as an exposure metric and a surrogate for the amount of RISC-loaded ALN-18328 in hepatocytes. It is important to highlight that the PK profile of ALN-18328 demonstrates two phases: Phase 1 represents rapid update of LNP from systemic circulation into liver; Phase 2 represents release of ALN-18328 complexed with LNP lipids from the liver back into plasma [22,23]. Plasma exposures associated with Phase 2 reflect effect site concentrations (liver). The AUC associated with Phase 2 corresponds to 80%–90% of the total plasma AUC of ALN-18328, increases proportionally with dose, and shows a two- to three-fold accumulation with repeat q3w dosing [22]. In the PK/PD model, the concentration–time profile consisting of both phases was used as the driver of the PD response. The resulting model captured the time-course of TTR reduction after patisiran administration across a wide dose range that spanned 50-fold (0.01–0.5 mg/kg) and following single- and multiple-dose regimens.
The average baseline TTR value in a typical patient was estimated to be 160.7 μg/mL. Mild hepatic impairment and age had no meaningful impact on baseline TTR levels. The model estimated that healthy volunteers had higher baseline TTR levels compared with typical patients with hATTR amyloidosis; this finding is consistent with reports of lower serum TTR levels in patients with hATTR amyloidosis relative to healthy controls [24]. Patients with higher body weights were estimated to have higher baseline TTR levels, consistent with the knowledge that serum TTR levels are reflective of nutritional status and are positively correlated with lean body mass [25].
The model estimated that patients with hATTR amyloidosis with the V30M genotype had 34% higher baseline TTR levels than patients with non-V30M genotypes. A literature review yielded no report directly comparing serum TTR levels in patients with hATTR amyloidosis with V30M versus non-V30M mutations; further studies are needed to confirm this difference and evaluate its impact on disease progression. In the APOLLO study, change in mNIS+7 and lowering of TTR with patisiran was not affected by TTR genotype (V30M and non-V30M) [16,23]. Similar TTR lowering across different transthyretin mutations are expected with patisiran because the siRNA ALN-18328 was designed to bind to a genetically conserved sequence in the 3′ untranslated region of TTR mRNA and thus mediates degradation of both wild-type and mutant TTR mRNA regardless of the specific pathogenic mutation [15].
Model simulations indicated that patisiran significantly reduced TTR levels with similar percent reduction from baseline regardless of V30M genotype status, baseline TTR, and body weight.
As patisiran is targeted to the liver, hepatic function was evaluated as a covariate in the PK/PD model. Mild liver impairment did not impact the PK/PD relationship, suggesting that mild impairment causes no appreciable differences in apolipoprotein E-mediated liver uptake of LNP or subsequent RISC loading of ALN-18328 in hepatocytes.
The model demonstrated that increasing ALN-18328 plasma concentration was associated with greater serum TTR reduction from baseline, which was best described by a sigmoidal relationship with a low IC50 value (9.45 ng/mL) and a Hill coefficient of 0.548. The population PK model- predicted steady-state Cpave of ALN-18328 in APOLLO [19] and the observed Cpave from the Phase 2 OLE following patisiran 0.3 mg/kg q3w were within the IC80–IC90 range (119–521 ng/mL) from the PK/PD model [21]. This confirms that the approved patisiran dosing regimen yields, on average, 80%–90% reductions in serum TTR in patients with hATTR amyloidosis.
At the therapeutic dosing regimen of 0.3 mg/kg q3w, plasma PK exposures increased with increasing body weight as a consequence of higher absolute dose (mg/kg dose × body weight). A two-fold increase in median PK exposures of ALN-18328 was predicted by the population PK model over the body weight range 36.2–110 kg [19]. However, PK/PD simulations from the present model showed no effect of the two-fold higher PK exposures on median TTR reduction over this body weight range. This is because average ALN-18328 plasma concentrations following patisiran 0.3 mg/kg q3w are in the IC80 and IC90 concentration range estimated by the model, i.e., in the plateau portion of the exposure–response curve where changes in PK exposure do not translate into meaningful additional reduction in serum TTR. Consistent with these results, similar TTR lowering was predicted with capped fixed dose of 30 mg q3w or a body weight-based dose of 0.3 mg/kg q3w in patients weighing ≥100 kg. Although plasma concentrations with the 30 mg fixed dose were slightly lower compared with the 0.3 mg/kg body weight-based dose in patients weighing ≥100 kg [23], these concentrations were still within the IC80–IC90 range, thus yielding similar TTR reductions to those seen in patients <100 kg receiving patisiran 0.3 mg/kg q3w.
In the APOLLO study, reductions in serum vitamin A and retinol-binding protein (RBP) levels paralleled the reductions in serum transthyretin levels [23]. These observations are consistent with the role of TTR as a major transporter of the RBP–retinol complex in serum [5,26–28]. It is important to highlight that vitamin A uptake from the gastrointestinal tract to the liver is independent of serum TTR and RBP levels [29]. Furthermore, alternative mechanisms of vitamin A transport and tissue uptake can occur in the absence of transthyretin [26]. Thus, it is expected that in patients treated with patisiran, dietary uptake and transport of vitamin A to the liver will occur by the normal mechanisms that are independent of serum TTR levels and that hepatic stores of retinol will be normal [29]. This is supported by observations of no symptoms of vitamin A deficiency and normal levels of retinol and retinyl ester in hepatic and peripheral tissues of TTR-deficient mice with no transthyretin and very low levels of plasma retinol and RBP [30,31].
In conclusion, our PK/PD model adequately characterized the relationship between plasma ALN-18328 exposures and serum TTR reduction following patisiran administration over a wide range of doses. Simulations demonstrated that patisiran 0.3 mg/kg q3w yielded PK exposures in the plateau portion of the exposure–response curve, resulting in an average of 80%–90% TTR reduction. Reductions in serum TTR with patisiran 0.3 mg/kg q3w were similar across patient covariates of sex, body weight, age, V30M genotype, baseline TTR levels, and hepatic and renal impairment. Taken together, these results support the current approved patisiran dosing regimen of 0.3 mg/kg q3w for patients weighing <100 kg up to a maximum of 30 mg for patients weighing ≥100 kg.
Footnotes
Acknowledgments
The authors thank all patients and their families who were involved in the study. The authors would also like to acknowledge the contributions of study investigators and study coordinators. The authors acknowledge the contributions of Jim Miller for statistical programming, Husain Attarwala for simulations that helped in model development, Yuanxin Xu and Valerie Clausen for bioanalytical analysis of PK, PD, and anti-drug antibody samples (Alnylam Pharmaceuticals). Editorial assistance was provided by Adelphi Communications (Bollington, United Kingdom) and funded by Alnylam Pharmaceuticals (Cambridge, MA.).
Author Disclosure Statement
V.G., X.Z., and G.J.R. are full-time employees of Alnylam Pharmaceuticals. C.J., N.H.G., and J.F.M. are consultants at Certara Strategic Consulting and were paid by Alnylam Pharmaceuticals to analyze data. This study was sponsored by Alnylam Pharmaceuticals.
Funding Information
The study was sponsored by Alnylam Pharmaceuticals (Cambridge, MA).
References
Supplementary Material
Please find the following supplemental material available below.
For Open Access articles published under a Creative Commons License, all supplemental material carries the same license as the article it is associated with.
For non-Open Access articles published, all supplemental material carries a non-exclusive license, and permission requests for re-use of supplemental material or any part of supplemental material shall be sent directly to the copyright owner as specified in the copyright notice associated with the article.