
Abstract
A sensitive and specific capillary electrophoresis with laser-induced fluorescence (CE-LIF) and a simple extraction process was developed to simultaneously detect G3139 and its metabolites as a model of antisense oligonucleotides (ASOs). This method has shown excellent linearity within the tested concentration range for G3139 and its metabolites, with a detection limit of 3.0 pM and a recovery of >84.2%. Based on our developed plasma extraction method, we have evaluated the pharmacokinetics and metabolites from rat plasma after intravenous administration of G3139 at 0.76 mg/kg. The results showed that G3139 and its metabolites were successfully simultaneously detected and analyzed through a single run using CE-LIF with baseline separation until the 30-h test sampling time point. The half-life of G3139 and its metabolites was observed at 31 and 68 h, respectively. This study may provide an effective analytical method for the pharmacokinetic and metabolite evaluation required to develop ASOs to treat a variety of diseases.
Introduction
Antisense oligonucleotides (ASOs) are an emerging and effective drug candidate because of their ability to bind with target DNA or RNA strands, which may inhibit translational processes [1,2]. Several ASOs have been clinically investigated and developed to treat various diseases [3]. Therefore, the pharmacokinetics of ASO and its metabolites after administration have to be evaluated to develop appropriate therapeutics. Currently, analysis of ASOs in biological fluids, such as plasma, has been conducted using liquid chromatograph-tandem mass spectrometer (LC/MS/MS) [4] and enzyme-linked immunosorbent assay (ELISA) [5]. These LC/MS/MS and ELISA methods each have advantages such as specific separation and identification of parent ASO and their metabolites and high sensitive analysis. However, these analytical methods have critical limitations. For the LC/MS/MS method, a high dose is required and two different extraction methods are used to avoid detection interferences. Also, in the ELISA method, it is difficult to discriminate parent ASO and their metabolites. This is because oligonucleotide metabolites are mainly formed by endo- and exonucleases that degrade nucleic acids by hydrolyzing phosphodiester bonds, unlike the metabolism of small molecules, so the molecular weight and charge of the parent and metabolite are similar.
The capillary electrophoresis with laser-induced fluorescence (CE-LIF) is a promising and rapidly developing tool with the potential to provide highly sensitive and specific analysis of biological molecules, including microRNAs (miRNAs), and simultaneous analysis of nucleic acids of similar length [6,7]. Moreover, the CE-LIF system is relatively unaffected by endogenous interference as compared with other analytical methods [8]. We developed a rapid and sensitive CE-LIF method to simultaneously detect parent G3139 and their metabolites. This method involves a simple extraction method without solid-phase extraction or extensive phase separation after a relatively low dose of G3139. G3139 is an 18-base phosphorothioate oligonucleotide that complements the first six codons of Bcl-2 messenger RNA (mRNA) [9]. Treatment with G3139 selectively decreases Bcl-2 mRNA and protein levels in various cancer cell lines and showed therapeutic efficacy in various solid tumors. Moreover, the G3139 formulation has been shown to improve poor cellular uptake and targeting [10,11]. Therefore, a pharmacokinetic evaluation of G3139 and its metabolites has been continuously needed in clinical and pharmaceutical areas.
Previously published pharmacokinetics and metabolic research on G3139 has used the LC/MS/MS method, but it demonstrated two different extraction processes with a large sample volume and high doses of G3139 [12]. To overcome these problems, we developed a sensitive CE-LIF method in the plasma, allowing for the analysis of G3139 and its metabolites in rat plasma after a low dose of G3139. We also modified a simple extraction method based on the widely used method of phenol–chloroform extraction used in common nucleotide analysis system, including LC/MS/MS. We have successfully conducted the first pharmacokinetic evaluation of both G3139 and its metabolites in rat plasmas after intravenous (IV) administration of G3139 using CE-LIF.
Materials and Methods
Chemicals and materials
Fluorescence-labeled single-stranded DNA oligonucleotide probe with 5′-carboxyfluorescein phosphoramidite [6-carboxyfluorescein (6-FAM)], G3139 [TCT CCC AGC GTG CGC CAT, molecular weight (MW): 5,411.6] and its metabolites, 3′-N-1 (TCT CCC AGC GTG CGC CA, MW: 5,107.3), 3′-N-2 (TCT CCC AGC GTG CGC C, MW: 4,794.1), and 3′-N-3 (TCT CCC AGC GTG CGC, MW: 4,505.0) was purchased from Cosmogenetech (Seoul, Korea). Phenol:Chloroform 5:1 Reagent was obtained from Sigma-Aldrich (Carlsbad, CA). In vivo jetPEI was purchased from Polyplus Transfection (Illkirch-Graffenstaden, France).
Animal treatment and blood collection
Sprague Dawley male rats (7 weeks old) were supplied by Raonbio (Suwon, Korea). All experimental protocols were approved by the Institutional Animal Care and Use Committee of Center at Chaon (Gyeong-gi, Korea) under approval number CE2019063. Two rats were administrated with a single dose of 0.76 mg/kg G3139 loaded into in vivo jetPEI. The solutions containing G3139 and in vivo jetPEI were mixed (N/P = 7) and incubated according to the manufacturer's protocol and IV injected through the tail vein at the dose of 0.76 mg/kg for each blood samples were collected from three rats per time point at 0, 5, 10, 15, 45, 90, 180, 360, 540, 1,440, and 1,800 min postdose by retro-orbital puncture into ethylenediaminetetraacetic acid (EDTA) tubes. Thereafter, plasma was obtained from the blood sample by centrifugation at 3,000g for 10 min at 4°C. The resulting plasma was stored at −80°C until ready to be used.
Oligonucleotide isolation
Plasma (100 μL) sample was deproteinized using 20 μL of Phenol:Chloroform 5:1 Reagent (Sigma-Aldrich). Deproteinized plasma samples were mixed by Chloroform Phenol reagent and 100 μL of 5% ammonium hydroxide. Each sample was vortexed for 60 s and centrifuged the samples for 12,000g for 15 min at 4°C. Supernatant was transferred to a new tube. Eight hundred microliters of ethanol was added to the supernatant for oligonucleotide precipitation. After precipitation of oligonucleotide incubate in −80°C for 1 h, centrifuge at 20,000g for 30 min at 4°C. The pellet was dissolved with 30 μl of the hybridization buffer.
Capillary electrophoresis
The extracted miRNA was analyzed using the PA800 plus CE system (Beckman Coulter, Fullerton, CA) with the LIF detector. Fluorescence was detected by excitation at 488 nm using a 3-mW argon–ion laser and emission through a 520-nm emission filter at a rate of 4 Hz. Separations were performed using an untreated capillary (Beckman Coulter), which had a 75-μm inner diameter and 60-cm length (50-cm effective length). Separations were performed using a running buffer of 150 mM Tris-borate (pH 10.0) containing 2.5 M urea at 35°C by applying 14 kV, whereas the sample compartment was maintained at 25°C. Samples were introduced hydrodynamically at 0.5 psi for 20 s and the injection volume was 60 nL. Electropherograms were analyzed using 32 Karat software.
Hybridization
For hybridization, 6-FAM-labeled DNA probes (100 nM) and synthetic G3139 and its metabolites (3′-N-1, 3′-N-2, and 3′-N-3) were mixed with the hybridization buffer (50 mM Tris-acetate, pH 8.0, containing 50 mM NaCl, 0.1 mM EDTA, and 1% Triton X-100). The labeled DNA probes were dissolved in elution buffer (10 mM Tris-Cl buffer, pH 8.5) from a QIAprep Spin Miniprep Kit (Qiagen, Crawley, UK). The samples were incubated in a thermal cycler (Eppendorf) for denaturation at 95°C for 5 min, followed by a renaturation step at 40°C for 15 min before introduction into the capillary.
Pharmacokinetic data analysis
Pharmacokinetic parameters were estimated with WinNonlin software version 6.0 (Pharsight, Mountain View, CA).
Results and Discussion
Analysis of G3139 in plasma using CE-LIF
Before the pharmacokinetic profile analysis of G3139 and its metabolites using CE-LIF, conditions were optimized for the simultaneous analysis of G3139, 3′-N-1, 3′-N-2, and 3′-N-3, the major metabolites in the plasma. First, based on our previous pharmacokinetic study of miRNA using CE-LIF, simultaneous analysis of G3139 and its metabolites was attempted using a 125 mM tris borate buffer and 50 cm capillary [6]. However, baseline separation was not achieved between 3′-N-1 and 3′-N-2. The separation buffer concentration and capillary length were changed to 150 mM and 60 cm, respectively, to lengthen the migration time to separate all tested parent G3139 and metabolites peaks.
Separation and simultaneous analysis of G3139 and its metabolites was conducted and no obvious interferences from endogenous substances were observed under the developed CE-LIF conditions. Typical electropherograms obtained from a blank plasma sample, a spiked plasma sample with the analytes at low limit of quantification (0.5 nM for G3139 and 3′-N-1 and 0.1 nM for 3′-N-2 and 3′-N-3), and a plasma sample after oral administration of G3139 are shown in Fig. 1. Finally, this CE condition was applied to evaluate the pharmacokinetics of G3139 and its metabolites in the plasma after G3139 administration.
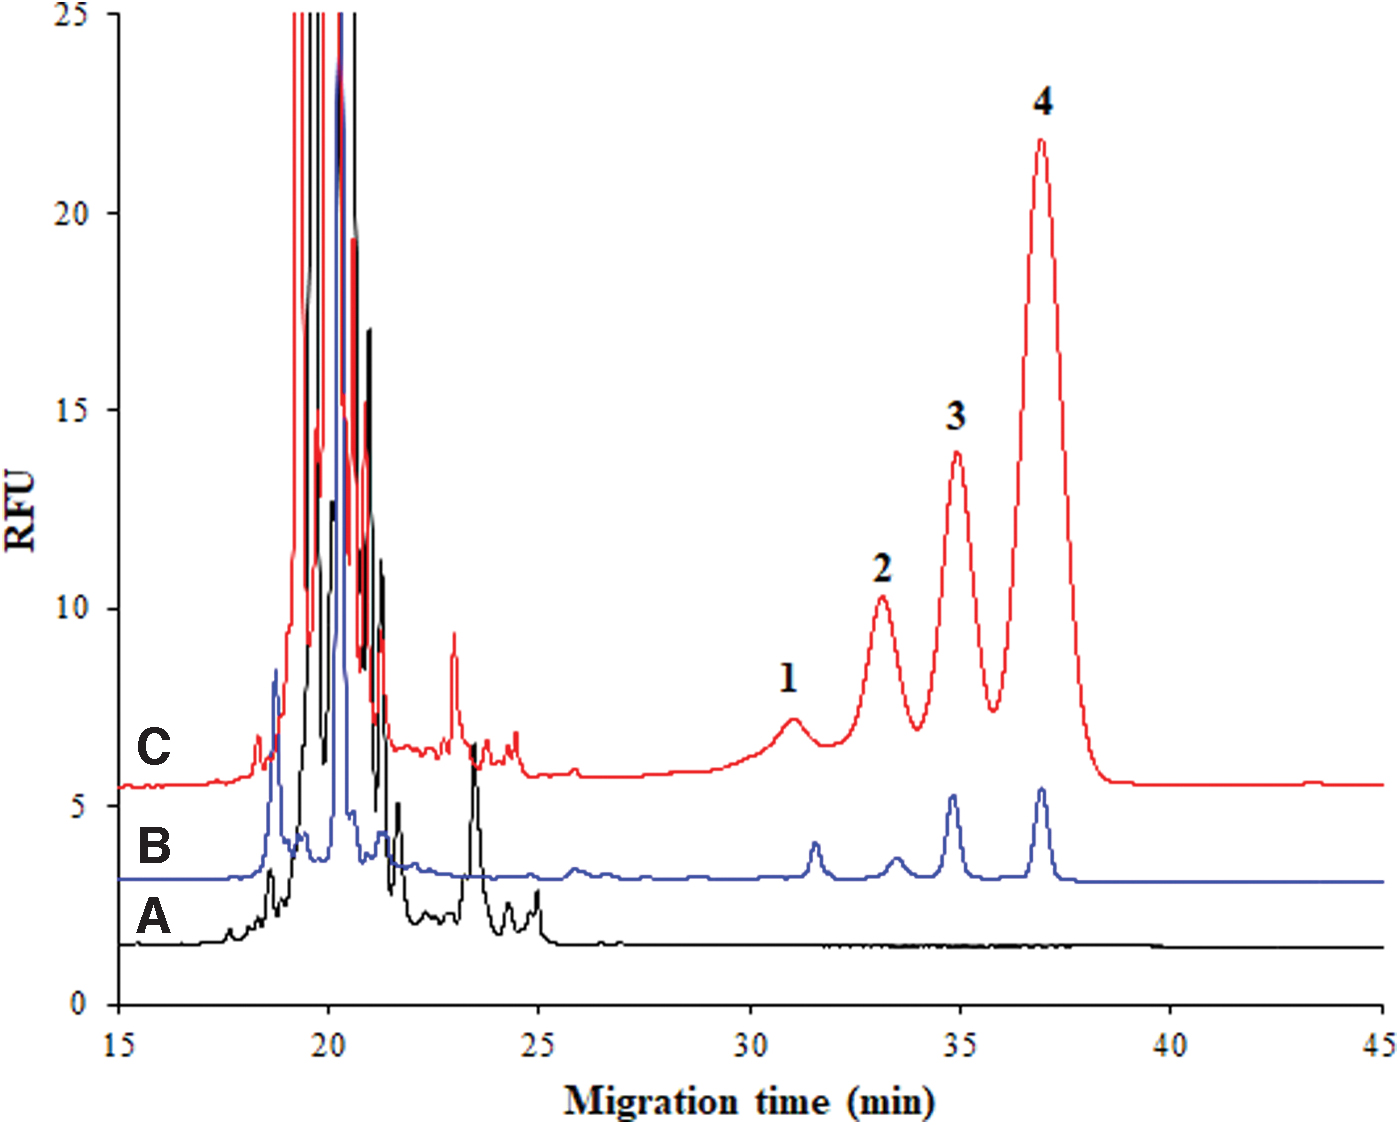
Electropherograms of G3139 and its metabolites extracted from blank rat plasma sample
With these analysis conditions, the extraction of ASO and its metabolites in the plasma sample was optimized for effective and simple sample extraction. Designing proper sample preparation is critical for high recovery and reliable analysis, which has a significant impact on the detection limit and reproducibility. Typical ASO sample preparation method for ELISA analysis involves time-consuming reaction process [13]. In addition, the sensitivity and specificity of analysis depend on quality of reagents [14]. For high-performance liquid chromatography or LC/MS/MS analysis, both solid-phase extraction and phenol–chloroform extraction are used to remove endogenous interferences in the extracted sample to minimize detection interferences [12,15]. To attempt simple and rapid extraction process in our study, ASO was extracted from the plasma through ethanol precipitation after deproteinization of the plasma sample with 20 μL of a phenol–chloroform solution. This extraction process did not involve intensive phase separation or additional extraction processes, such as solid-phase extraction. The results showed that ASO can be successfully separated and analyzed from the plasma without interference using the CE-LIF system, which is relatively unaffected by endogenous interference as compared with other analytical systems. This extraction obtained high recovery of >84.2% and demonstrated a simplified phase separation process with a small volume of phenol–chloroform solution.
These optimized sample extraction and analysis methods showed plasma G3139 linearity in the range of 0.5–50 nM (R2 = 0.9930). G3139 metabolites showed a linear (R2 > 0.9990), concentration-dependent absorbance at the calibration lines (0.5–50 nM for 3′-N-1 and 0.1–20 nM for 3′-N-2 and 3′-N-3). Typical equations for the calibration curves for G3139, 3′-N-1, 3′-N-2, and 3′-N-3 were y = 0.1522x-0.0622, y = 0.1629x-0.075, y = 0.061x-0.0059, and y = 0.0681x-0.0164, respectively. The detection limit was 3 pM for G3139 and its metabolites in the plasma. This result indicated that our developed CE-LIF condition and extraction process can be used to conduct a highly sensitive and specific analysis of G3139 and its metabolites in the plasma. This method showed a 10-fold improvement in sensitivity over the LC/MS/MS method [15] and was simpler than the ELISA method [13].
Pharmacokinetics and metabolites of G3139 after IV administration of G3139
Using our optimized CE-LIF condition and extraction process, the pharmacokinetics study was conducted after IV administration of 0.76 mg/kg of G3139. Especially, in this study, to monitor the pharmacokinetics in a polymer-based G3139 delivery, a commercially available in vivo jetPEI (Polyplus Transfection), based on cationic linear polyethylenimine, was used for IV administration because many ASOs, including G3139, have been formulated to improve stability, cellular uptake, and targeting.
The pharmacokinetic results showed that parent G3139 and its metabolites, 3′-N-1, 3′-N-2, and 3′-N-3, were detected as expected. In addition, G3139 and its metabolites were detected until the 30-h tested sampling time point, except for 3′-N-3, which was detected until 3 h because of a low plasma level (Fig. 2). This result indicated that CE-LIF method we applied was sensitive enough to analyze G3139 and its metabolites in the plasma, even at a low dose.
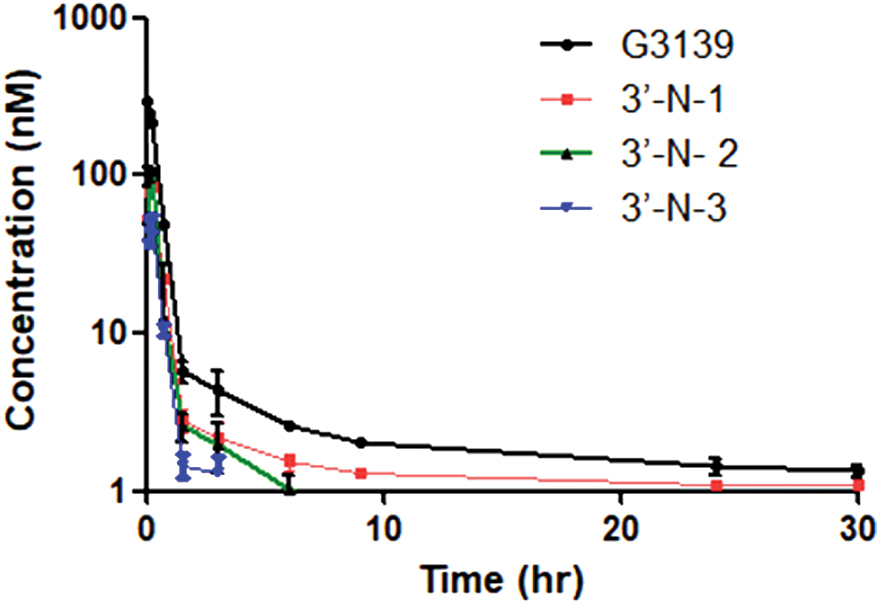
Plasma concentration-time profiles of G3139 and its metabolites, 3′-N-1, 3′-N-2, and 3′-N-3, in rats after an intravenous injection (0.76 mg/kg). Dots represent means of measured concentrations; bars represent standard deviation (n = 2). Color images are available online.
The results indicated that the blood concentration of G3139 was ∼293 nM at the earliest sampling time point (5 min), and then it decreased to ∼5.66 nM within 1.5 h. Approximately 98.1% of the earliest measured concentration time was eliminated from the blood during this time. The half-life and area under the curve value of G3139 was estimated at 31.24 h and 183.83 h/nM, respectively (Table 1). This half-life was extended compared with reported results [15,16]. It is possible a carrier (in vivo jetPEI) affected the half-life after G3139 administration. All tested metabolites showed a prolonged half-life and especially, metabolite, 3′-N-1 was the longest half-life among tested G3139 and its metabolites. And the peak plasma concentrations of metabolites were reduced 0.25 h after IV injection (Table 1).
Pharmacokinetics Parameters of G3139 and Its Metabolites (n = 2)
AUC (last), area under the plasma concentration-time curve from time zero to time of last measurable concentration; CL/F, apparent clearance; Cmax, peak plasma concentration; T1/2, plasma terminal half-life; Tmax, time to peak plasma concentration; Vz/F, apparent volume of distribution.
Conclusions
In this study, we evaluated the levels of G3139 and its metabolites in the plasma using a simple and sensitive CE-LIF method after IV administration of G3139. This CE-LIF method was successfully applied to evaluate the pharmacokinetics and metabolites of G3139 at a very low dose (0.76 mg/kg) compared with other studies [12,16]. Moreover, G3139 was administered using the in vivo jetPEI method for the first time to monitor the pharmacokinetics in a polymer-based G3139 delivery. This CE-LIF method demonstrated a sensitive and reliable simultaneous analysis of G3139 and its metabolites in the plasma. We found that G3139 and its metabolite, 3′-N-1 was slowly eliminated from circulation compared with 3′-N-2, and 3′-N-3. Especially, 3′-N-1 was showed the longest half-life among tested G3139 and its metabolites, 3′-N-1, 3′-N-2, and 3′-N-3.
In this study, we have achieved simultaneous analysis of oligonucleotide and its metabolites in plasma using CE-LIF. However, the migration time of analytes was almost 40 min and significantly long compared with that of the LC system (6–15 min) [17,18]. This is a limitation of our study, and further studies are required to achieve a faster analysis. Also, further research is warranted to evaluate the change in tissue distribution, and targeted delivery of polymer-based G3139. Moreover, in addition to phosphorotioate ASOs such as G3139, the additional study is needed to determine if the extraction method and the CE-LIF system can be applied to study the pharmacokinetics and metabolites of other chemically modified ASOs.
Footnotes
Author Disclosure Statement
The authors declare that they have no conflicts of interest.
Funding Information
This study was supported by a National Research Foundation of Korea (NRF) grant funded by the Ministry of Science and ICT (2020R1A4A4079494 and 2019R1A2C2004052). Eunmi Ban was supported by RP-Grant 2020 of Ewha Womans University.