
Abstract
Recent FDA approvals of mRNA vaccines, short-interfering RNAs, and antisense oligonucleotides highlight the success of oligonucleotides as therapeutics. Aptamers are excellent affinity reagents that can selectively label protein biomarkers, but their clinical application has lagged. When formulating a given aptamer for in vivo use, molecular design details can determine biostability and biodistribution; therefore, extensive postselection manipulation is often required for each new design to identify clinically useful reagents harboring improved pharmacokinetic properties. Few methods are available to comprehensively screen such aptamers, especially in vivo, constituting a significant bottleneck in the field. In this study, we introduce barcoded aptamer technology (BApT) for multiplexed screening of predefined aptamer formulations in vitro and in vivo. We demonstrate this technology by simultaneously investigating 20 aptamer formulations, each harboring different molecular designs, for targeting Non-Small Cell Lung Cancer cells and tumors. Screening in vitro identified a 45 kDa bispecific formulation as the best cancer cell targeting reagent, whereas screening in vivo identified a 30 kDa monomeric formulation as the best tumor-specific targeting reagent. The multiplexed analysis pipeline also identified biodistribution phenotypes shared among formulations with similar molecular architectures. The BApT approach we describe here has the potential for broad application to fields where oligonucleotide-based targeting reagents are desired.
Introduction
Oligonucleotide therapeutics have gained significant attention over the past decade, dominated by mRNA vaccines and transcript-altering reagents such as short-interfering RNA (siRNA) and antisense oligonucleotides (ASOs). These reagents all harbor distinct molecular pharmacophore properties (features that determine target specificity, such as sequence) and dianophore properties (features that determine biodistribution and metabolism, such as backbone chemistry or conjugates), allowing for rapid adaptation to multiple diseases through sequence changes once a given reagent demonstrates that it can be delivered to a particular target tissue.1–5 Aptamers are an alternative nucleic acid-based technology for which the folded 3D conformation of the reagent provides excellent molecular target recognition, typically with nM to high pM affinities. Aptamers selected against cell surface proteins have been widely used in biomedical research to label cells in vitro and target tissues in vivo.6–8 Despite advancements, the clinical translation of aptamer therapeutics and diagnostics has advanced only marginally since the FDA approval of Macugen (pegaptanib) in 2004,9,10 with the recent approval of Izervay (avacincaptad pegol) coming nearly 20 years later. 11 It is notable that both of these therapies, approved to treat the pathogenesis of age-related macular degeneration, are delivered locally (intravitreal injection) rather than systemically.
In contrast to antibodies, the clinical barrier for aptamer technology can largely be attributed to poor pharmacokinetic (PK) properties (especially upon systemic injection), which are driven by the following: (i) small size—allowing rapid filtration through the kidney glomeruli, (ii) monovalent nature—lacking target avidity effects, (iii) serum nuclease susceptibility—limiting bioavailability, and (iv) inherent negative charge—increasing nonspecific interactions with serum proteins and scavenger receptors. These concerns can be mitigated through extensive covalent modification of the oligonucleotide sugars, phosphates, or nucleobases, a practice that has been widely adopted in the development of ASO and siRNA therapeutics.1,3,12,13 Unlike ASOs and siRNAs, aptamers are three-dimensional targeting molecules for which their pharmacophore and dianophore properties are not separable and each new reagent requires re-validation for target binding and biodistribution. Unfortunately, present limitations in both polymerase and sequencing technologies have precluded the canonical selection and competitive comparison of fully modified or multivalent aptamers - adaptations likely required for success in biological systems14–16 - via systematic evolution of ligands by exponential enrichment (SELEX). 17 In addition, in silico aptamer selection, 18 or design and modeling,19–22 is still in its infancy and rarely predictive, unlike the rapidly developing predictive capabilities for proteins,23–25 as the datasets are especially sparse for training algorithms on aptamers that contain modified nucleotides or other expanded alphabets. Until these limitations are addressed, extensive postselection manipulation (modification and validation) will likely be required to obtain clinically useful reagents, similar to what was done for both of the FDA-approved aptamers. 26
Multiantigen or multiepitope (biparatropism) recognition27,28 has been explored widely to improve targeting reagents, as increasing the valency and quantity of unique targeting agents may increase the relative binding affinity through avidity effects and can increase cell or tissue selectivity through multiple binding interactions. Nevertheless, it can be extremely challenging to balance all the variables in a nanostructure design, such as defining optimal targets (or epitopes), number of targeting ligands, and spatial orientation for proper tissue accumulation and target engagement.28,29 As each newly engineered formulation must undergo optimization for target- and tissue-specific delivery, an analytical pipeline that allows for less laborious, multiplexed screening would be valuable to explore these and other variables. Unfortunately, there are few if any methods presently available to comprehensively screen and compare postselection modified or multivalent aptamers in a high-throughput manner, especially in vivo.
In this work, we introduce BApT, a
Materials and Methods
Reagents
DNA oligonucleotides were purchased from Integrated DNA Technologies (IDT, Coralville, IA). Stock solution of sheared salmon sperm DNA (sssDNA) at 10 mg/mL was purchased from Invitrogen (Waltham, MA). Allophycocyanin (APC)-labeled EGFR monoclonal antibody (clone AY13, cat: #2364525) and isotype control (mouse IgG1, κ, clone MOPC-21, cat: #2600605) were purchased from Sony Biotechnology (San Jose, CA). APC-labeled anti-c-Met monoclonal antibody (clone 271, cat: #10692-R271-A) was purchased from Sino Biological US Inc. (Houston, TX). All other materials were purchased from Sigma Aldrich (St. Louis, MO), unless otherwise noted.
Barcoded aptamer design
The anti-c-Met DNA aptamer (CLN3) or a tailored mutant version that alters the G-quadruplex structure of CLN3 (G5mutCLN3) was used to design all barcoded oligonucleotides. The 5′ ends of these aptamers, which are constant between the two species, served as 5′ primer binding sites (PBS). An 8-nucleotide (nt) barcode, an annealing scaffold, and a 3′ PBS were added to the 3′ ends. The 3′-PBS sequence (5′-ACCC
Aptamer generation
All DNA and RNA oligonucleotides (reported in Supplementary Table S3) were resuspended in Milli-Q® water to reach a stock concentration of 100 µM. For fluorescent imaging, the DNA annealing scaffold (‘anti-tail’ or 3WJ_a) or DNA aptamer (CLN3 or G5mutCLN3) containing the 3′ annealing scaffold was purchased from IDT with a 5′ C6 amino modifier. The 5′-amino-modified DNA oligonucleotides were conjugated to NHS ester modified Atto647N and purified via high-performance liquid chromatography (HPLC) to make 5′-dye-labeled DNA oligonucleotides (next paragraph). 2’-fluoropyrimidine (FY)-modified RNA aptamers were generated via in vitro runoff transcription (IVT). All 2’-FY-modified RNA aptamers (MinE07 or mutMinE07) included an extended 3′ 'tail' sequence (5′-CGACGACGACGACGACGACGA-3′). First, the DNA templates were PCR amplified with primers that appended a T7 promoter (Supplementary Table S1). Then, 2’FY-modified RNA aptamers were transcribed by overnight IVT at 37°C using recombinant mutant T7 RNA polymerase (Y639F), IVT buffer (50 mM Tris-HCl pH 7.5, 15 mM MgCl2, 5 mM DTT, 4% w/v PEG4000, and 2 mM spermidine), and 2 mM of each ATP, GTP, 2’F-modified CTP, and 2’F-modified UTP (TriLink Biotechnologies, San Diego, CA, USA). All RNA aptamers were purified through denaturing polyacrylamide gel electrophoresis (0.75 mm, 6%–8% TBE-PAGE, 8M urea). Bands corresponding to the expected product size were visualized by UV shadow, excised from the gel, and then eluted overnight while tumbling in 300 mM sodium acetate pH 5.4. Eluates were ethanol precipitated, resuspended in Milli-Q® water, and stored at −20°C until further use.
Dye-labeling and HPLC purification of DNA oligonucleotides
The 5′-amino-modified DNA oligonucleotides (aptamers or antitail) were labeled with NHS ester-modified Atto647N. Labeling reactions with Atto647N were performed as follows: 30 nmoles of 5′-amino-modified DNA oligonucleotides were diluted in 0.2 M sodium bicarbonate buffer (pH 9) and mixed with 20-fold molar excess of dye in a final volume of 500 μL. Reaction mixtures were kept overnight at 4°C. To remove excess fluorophore before analytical evaluation, oligonucleotides were ethanol precipitated and resuspended in a minimal volume of Milli-Q® water (<100 μL). Analytical evaluation of labeling reactions and purification of dye-labeled oligonucleotides were performed using reverse-phase HPLC (RP-HPLC) using an Agilent 1100 series instrument with an Agilent Zorbax Eclipse XDB-C18 (4.6 × 150 mm2). For all analyses, column temperature was set at 50°C to partially denature aptamer secondary structures and improve sharpness and peak resolution. Flow rate was 1 mL/min with triethylammonium acetate (TEAA)/acetonitrile (ACN) buffer system (solvent A: 100 mM TEAA, pH 7; solvent B: 100% ACN). For Atto647N and Cy5, dye-labeled aptamers (retention time ∼18–20 min) were separated from the unlabeled fraction (retention time ∼8–9 min) and purified using a linear gradient from 5% to 30% ACN over 20 min. A further linear gradient was applied from 30% to 60% ACN over 5 min. The final step applied 60% ACN for 3 min to purge the column of unreacted fluorophore. Coupling efficiencies of these labeling reactions were >90% for oligos <30 nt and ∼30% (desalted) or ∼65% (HPLC-purified) for oligos >50 nt. Purified dye-labeled oligonucleotides were concentrated and purified by the residual fraction of ACN using either a spin desalting column (Amicon Ultra-15 mL, 3K MWCO) or lyophilization. In the case of the latter, dry pellets were dissolved in 100 μL of Milli-Q® water. Dye-to-aptamer ratio was evaluated from absorbance measured at 260 nm (for DNA oligo) and 646 nm (for Cy5 and Atto47N) on a NanoDrop 1000 spectrophotometer (Thermo Scientific). All dye-labeled oligonucleotides result in a dye-to-oligo stoichiometry of 1:1 within an experimental error.
Aptamer folding and annealing and INPUT formulation
Aptamers were folded and annealed as previously described.35–37 All aptamer formulations were prepared at 4 µM. All in vitro annealing reactions were prepared at room temperature in Dulbecco’s phosphate-buffered saline (DPBS, pH 7.4) supplemented with 5 mM MgCl2. For molecular architecture 1 (direct annealing ‘tail/anti-tail' scaffold), a slight excess (1.2:1.0 molar ratio) of RNA aptamer or DNA ‘tail' to the barcoded DNA aptamer was used. For molecular architecture 2 (3WJ annealing scaffold), an equimolar ratio of oligonucleotides was used. For thermal renaturation, samples were transferred into a preheated aluminum insert within a dry heat block set to 90°C, where they were kept for 1–2 min to denature nucleic acid structures, and then the aluminum insert was removed from the block heater and placed on the workbench to cool slowly to room temperature. Aptamer annealing efficiency was checked by electrophoretic mobility shift assays (EMSAs) as previously described. 37 In brief, ∼20 pmol of labeled aptamer was run on a native 6%–8% polyacrylamide gel, stained with ethidium bromide, and analyzed using FIJI. 38 Annealing efficiency is calculated using the limiting reagent (typically the labeled, barcoded oligo) where the fluorescence of the complex is divided by the total fluorescence of the lane. INPUT was generated by mixing equimolar amounts of all 20 barcoded aptamer formulations to a final concentration of 4 µM for all oligos combined and 200 nM for each individual formulation. For in vitro experiments, INPUT was freshly prepared and diluted to 200 nM (10 nM each formulation) before adding to cells. For in vivo experiments, INPUT was freshly prepared and injected undiluted.
Cell culture and cell line validation
A549 cells were gifted by Dr. Bumsuk Hahm, University of Missouri-Columbia. H1975 and H820 were gifted by Dr. Raghuraman Kannan, University of Missouri-Columbia. A549 cells were cultured in Dulbecco's Modified Eagle Medium supplemented with 10% fetal bovine serum (FBS), 1 mM sodium pyruvate, 2 mM L-glutamine, and 1X non-essential amino acids (NEAAs). H1975 and H820 cells were cultured in HyClone™ RPMI 1640 supplemented with 10% FBS, 1 mM sodium pyruvate, 2 mM L-glutamine, and 1X NEAAs. All cell lines were maintained at 37°C in a humidified incubator with 5% CO2 and passaged when ∼80% confluent. Cells were not passaged more than 20 times from thaw or past total passage number 30 (P30) to minimize genetic drift. Cells were consistently validated for EGFR and c-Met antigen expression using both antibody and aptamer staining. Consistency in cell morphology was checked before each passage.
Aptamer and antibody binding
A549, H1975, and H820 cells were seeded at 40–50,000 cells/well in a 48-well flat-bottom tissue culture plate 24 h before experiment. On the day of the assay, individual aptamer formulations were folded and annealed as above. sssDNA was added to each sample at a final concentration of 1.0 mg/mL as a competitor for nonspecific binding sites. MgCl2 was adjusted to maintain a final concentration of 5 mM Mg2+. APC-labeled EGFR and c-Met monoclonal antibodies and isotype control were diluted to a desired concentration in Dulbecco’s phosphate-buffered saline (DPBS) supplemented with 0.1% bovine serum albumin. Cells were washed once with DPBS and then incubated in either aptamer or antibody binding solution for 45 min at 37°C and 5% CO2. After incubation, the solution was removed, cells were washed once with DPBS, and cells were lifted off with 1X TrypLE Express (Thermo Fisher, Waltham, MA) for <5 min at 37°C. TrypLE Express was diluted by the addition of complete medium, and cells were transferred to 1.5 mL Eppendorf tubes and gently centrifuged to pellet (5 min, 500x g). Cells were then fixed in 4% paraformaldehyde in DPBS in the dark for 5 min at 4°C before being pelleted (5 min, 400x g) and resuspended in DPBS. Cells were stored in the dark at 4°C until analysis with flow cytometry.
Flow cytometry
Flow cytometry was performed on a BD Accuri C6 (BD Biosciences, San Jose, CA) or Attune NxT (Thermo Fisher Scientific, Waltham, MA) by counting 10,000–30,000 live cell events. Fluorescence of far-red dyes (Cy5 or Atto647N) was excited using a 640 nm (Accuri) or 637 nm (Attune) laser and detected using a standard FL4 filter [675 ± 12.5 nm] (Accuri) or RL1 filter [670 ± 7 nm] (Attune). Flow cytometry data were then analyzed and processed using FlowJo Software (Tree Star, Ashland, OR). Viable singlet cells were gated and analyzed for mean fluorescence intensity (MFI).
Subcutaneous xenograft of NSCLC cells
To develop cell-line-derived subcutaneous tumor models, 39 H1975 cells were cultivated as described above in 15-cm dishes to ∼80% confluence. Cells were collected, washed twice with cold DPBS, and resuspended in ice-cold DPBS plus 50% extracellular matrix (ECM) gel (Sigma Aldrich, cat: #E6909) at ∼5 million cells per 100 µL. Cells were kept on ice during injections to prevent solidification of ECM. To develop xenografts, BALB/c nude mice (Charles River, Wilmington, MA) were briefly anesthetized with isoflurane in an induction chamber (4%, 250 mL/s). Using a 28G 1/2” 1 cc insulin syringe/needle, 5 × 10⁶ cells were subcutaneously injected into the flank or shoulder of each mouse. Cells were allowed to engraft for one week and then mice were palpated every 3–4 days until tumors could be measured (>4 mm2), at which point tumors were measured using digital calipers at a similar interval until experimental start point (∼75–150 mm2).
Animal ethics statement
All animal procedures and monitoring were conducted according to the NIH guidelines for the care and use of laboratory animals and were approved by the University of Missouri Institutional Animal Care and Use Committee.
Barcoded formulation delivery and DNA recovery
INPUT libraries for in vitro and in vivo experiments were prepared as described above. For in vitro experiments, 40–50,000 cells/well were seeded into a 48-well, flat-bottom tissue culture plate 24 h before the experiment. On the day of the assay, INPUT was diluted to 200 nM in complete medium and added to cells (in triplicate) and incubated for 1 h at 37°C in 5% CO2. After incubation, the INPUT solution was removed, cells were washed three times with DPBS, lifted with TrypLE Express, diluted in complete medium, and moved to a 1.5 mL Eppendorf tube. Cells were resuspended in 100 µL of MilliQ water for DNA extraction. For in vivo experiments, mice were anesthetized using isoflurane in an induction chamber (4%; 250 mL/s). Using a 28G 1/2” 1 cc insulin syringe/needle, 100 µL of INPUT (∼400 pmol total or 20 pmol each formulation) was injected into the retro-orbital (RO) sinus of tumor bearing mice (time point = 0 h). RO injections were used to minimize pain and suffering. At 1, 4, or 12 hpi, mice were humanely euthanized (carbon dioxide followed by cervical dislocation), and their vascular systems were flushed with DPBS before blood coagulation (<2 min after expiration). To flush the vascular system, a 50-mL syringe was filled with DPBS and equipped with a 25G butterfly needle. The mouse abdominal aorta was severed, and the needle was placed in the left ventricle. DBPS (30–50 mL) was injected until the organs (specifically the liver and kidney) were blanched. Tumor, liver, kidney, spleen, and blood were harvested for DNA recovery. To digest and disaggregate the tumor, liver, kidney, and spleen into single-cell suspensions, tissue was added to a 5-cm Petri dish containing 5 mL of medium supplemented with collagenase type I, cut and smashed into smaller pieces, and allowed to gently shake (80 rpm) for 30 min at 37°C. Note that no DNase was added to the digest to prevent aptamer or oligonucleotide digestion. After digestion, cell solution was filtered (40 µm) and washed with DPBS. Filtration was repeated 2–4 times to remove unwanted material. Cells were treated with red blood cell lysis solution for 5 min at room temperature, washed with DPBS, and resuspended in DPBS. Cells were analyzed by flow cytometry (Cytek Aurora, Bethesda, MD) to identify and count live cells. Cells were resuspended at ∼35 million live cells/mL in water. Approximately 5 million cells (∼140 µL) were used for DNA extraction and the remaining samples were stored at −20°C. For blood, 1.4 µL was diluted in 140 µL water (1:100 dilution). To extract DNA, diluted blood or single-cell suspensions in water (140 µL total) from in vitro and in vivo samples were placed in a 95°C heat block for 10 min to lyse cells, centrifuged at 13,100g for 5 min at room temperature, and then 120 µL of the supernatant containing the eluted DNA aptamers was collected and immediately added to the PCR mix (200 µL final volume) on ice for amplicon enrichment. 40
Amplicon enrichment and NGS
To enrich DNA amplicons, the PCR mix was subjected to the minimum number of amplification cycles (∼15–20) using Illumina_prim primers (Supplementary Table S1). To determine the minimal number of rounds of PCR, aliquots were taken at 10, 15, 20, and 25 rounds and visualized via 2.5% agarose gel electrophoresis. PCR products were purified using the AxyPrep™ Mag PCR Clean-Up kit (Corning, Corning, NY) before sequencing. For quality control, all purified samples were visualized via 2.5% agarose gel electrophoresis for the presence of expected band (160 nt) and disappearance of primer dimers (Supplementary Fig. S5) before NGS. To normalize data and minimize amplification bias, INPUT was subject to five rounds of PCR amplicon enrichment and purification and sent for NGS. Illumina NGS was performed on enriched amplicons by the University of Missouri DNA Genomics Technology Core using MiSeq (in vitro) or NovaSeq (in vivo) technologies to provide 100 base single-end reads.
Data processing and statistical analyses
To process amplicon data, a modified DADA2 analysis pipeline was used. 41 For reproducibility, this pipeline is available at GitHub (https://github.com/bjtpk5/barcoded-aptamers). In brief, raw FASTQ sequencing files were inspected and then filtered and trimmed based on quality and size. Sequencing depth after filtering/trimming varied from 10–30,000 per sample (MiSeq) or 1–16 million per sample (NovaSeq). Following filtering and trimming, error rates were learned, samples were inferred (reported as reads per inferred sequence), and contaminating chimeras were removed. For in vivo analysis only, multiple other barcode-containing sequences (often with one or more nucleotide mutations) were present after inference, although to a significantly lower read depth. Only sequences with the correct barcode (Supplementary Table S2) and neighboring aptamer sequence (CLN3 or G5mutCLN3; ∼60 nt total) were used for analysis. Formulations were then mapped to the correct sequence (barcodes; Supplementary Table S2) and reads were converted to fraction of sum (alternatively, reads per million) for normalization. Using GraphPad Prism (version 10.0.0 for Windows; GraphPad Software, Boston, MA), definitive outliers were removed using the most stringent settings (ROUT, Q = 0.1%) and enrichment was calculated relative to INPUT. Values were transformed and reported as log2(Y), where positive numbers represent enriched formulations and negative numbers represent depleted formulations. For statistical analysis, two—way analysis of variance (fit full model) was used with multiple comparison (FWER adjusted using Bonferroni method). Adjusted p-values are reported (Supplementary Fig. S8). Due to the experimental design and number of comparisons, modified z-scores calculated in Microsoft Excel from the median of the transformed values (log2Y) and from the median absolute deviation (MAD) were used to elucidate meaningful changes from baseline.
Results
Establishing BApT
Aptamers and experimental model for establishing the technology
We focused on oncology for the case-use proof-of-principle study, as this field has been used extensively as a proving ground for new aptamer technologies as therapeutic42–44 and diagnostic6,45,46 reagents, with a select few of these moving into Phase I-III clinical trials. 44 NSCLC LUAD harbors a 5-year survival rate below 20% despite various FDA-approved targeted therapies (eg., tyrosine kinase inhibitors [TKIs]) that provide effective short-term treatment.47–49 LUAD has many subtypes and is often defined by oncogenic genetic alterations.50,51 We focused on the subtypes defined by mutation and upregulation of EGFR52–54 and/or by amplification of c-Met55,56 as these alterations provide targetable cell surface proteins for which there are well-validated aptamers.7,57 We and others have shown that the 2’-FY RNA anti-EGFR aptamer, MinE07, 30 is capable of binding to wild-type (WT) EGFR with nanomolar affinity (Kd ∼1–10 nM)7,30,36,58 and that it also binds to tyrosine kinase domain mutants that comprise the most prevalent mutant forms of EGFR present in NSCLC, including clinically relevant secondary mutations that drive TKI resistance. 35 The DNA anti-c-Met aptamer, CLN3 (Kd ∼50 nM), was selected for use in an immunomodulating bispecific aptamer and has been validated by our laboratory and others.31,35,59–62 For simplification, these aptamers are referred to herein by their respective targets as EGFR apt and c-Met apt.
Formulations and input library designs
An aptamer’s molecular weight has been shown to have a significant impact on tumor penetration, and its valency (avidity) has significant impacts on tumor cell binding.63–69 Therefore, we tested aptamer formulations that differed in molecular size and/or valency, based on two distinct molecular architectures (Fig. 1A, and Supplementary Fig. S1A–B). Both architectures utilize c-Met apt (or a nontargeting control apt, G5mutCLN3) that contains three structural elements: an annealing scaffold for assembly with other components, PBSs for amplification, and a barcode to identify the specific formulation into which it has been assembled (Fig. 1A). Molecular architecture 1 uses a direct annealing scaffold to assemble two strands together, yielding a valency of up to two targeting moieties (Fig. 1A and Supplementary Fig. S1A; Table 1, formulations 1–6). 70 The barcoded aptamer is extended with a 21 nt ‘antitail' sequence ([TCG]7) that anneals with a complementary 21 nt ‘tail' sequence ([CGA]7), either alone (monomer; Table 1, formulations 1,4) or appended onto EGFR apt (or control apt, mutMinE07 36 ) (Table 1, formulations 2–3, 5–6). Molecular architecture 2 uses a stable three-way junction (3WJ) scaffold adapted from Guo and colleagues 71 that is assembled from three oligonucleotide strands to allow up to three targeting moieties per assembled complex (Fig. 1A and Supplementary Fig. S1B; Table 1, formulations 7–20). Schematics for all formulations are represented in Supplementary Figure S1C.
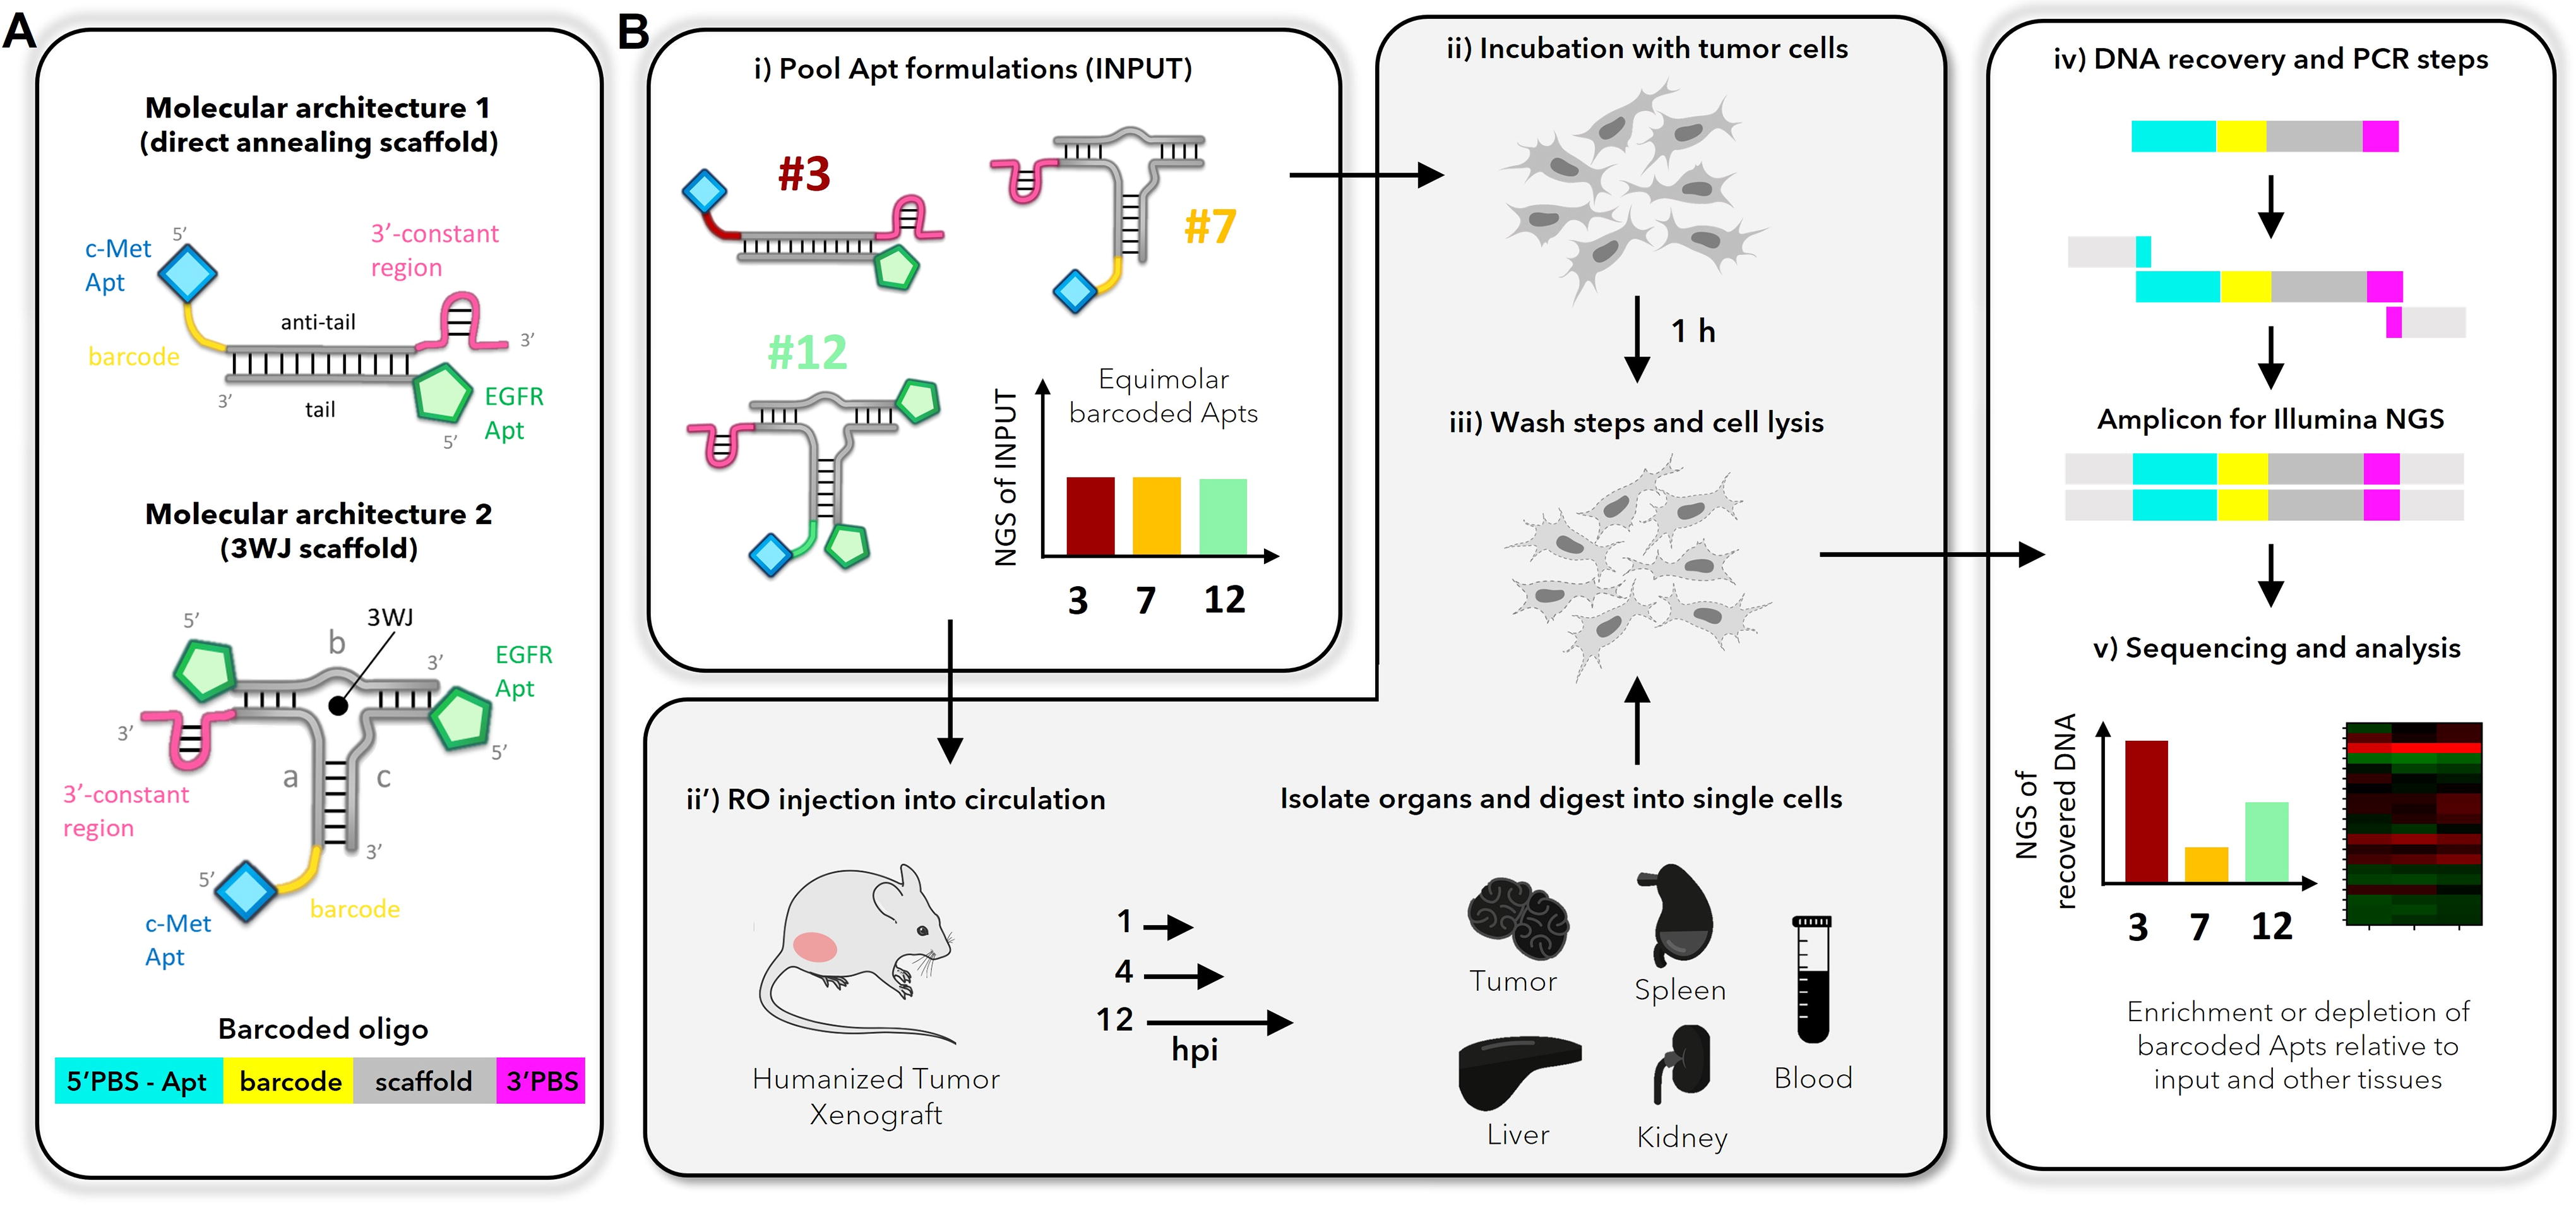
Schematic of barcoded aptamer technology and pipeline.
Attributes of Barcoded Aptamer Formulations
*X-mer determined by the number of targeting moieties only.
Validation of BApT components
Representative aptamer formulations for each molecular architecture were validated for assembly, binding to their targets on NSCLC cell lines, and relative PCR amplification efficiency. First, native polyacrylamide gel EMSAs established that assembly and annealing efficiencies were generally >80% (Supplementary Fig. S2 and as shown previously 35 ). Second, antigen expression was measured by flow cytometry for three LUAD cancer cell lines (H1975, A549, H820) using fluorescently tagged monoclonal antibodies (Supplementary Fig. S3A) and monomeric aptamers (Supplementary Fig. S3B). All three cell lines displayed moderate-to-high levels of EGFR and c-Met relative to isotype antibody or aptamer controls, consistent with the expected relative expression of these proteins for each cell line (Supplementary Fig. S3; www.proteinatlas.org).35,72,73 Third, to ensure that assembly of the full complex did not interfere with aptamer function, fluorescently labeled (5’-Atto647N) barcoded oligonucleotides were assembled into their respective monospecific or bispecific formulations, incubated with H1975 cells, and analyzed by flow cytometry. In each case, increasing the number of targeting moieties increased the geometric MFI (Supplementary Fig. S4A-C), but nonspecific cell binding of multimeric, control aptamers did not vary. Fourth, when PCR amplification using primers that annealed to the 5′ and 3′ PBS (Supplementary Table S1, Illumina_prim), all formulations produced a single band of similar intensity at the expected size (166 nt; Supplementary Fig. S5A), indicating roughly equal amplification efficiencies for all barcodes. Finally, all 20 barcoded aptamer formulations (Table 1) were individually prepared and mixed to a final concentration of 200 nM each (4 µM total) (Fig. 1B-i) and subjected to amplicon sequencing and the DADA2 analysis pipeline to establish fractional representation. This analysis established that any sampling bias was minimal, with the average fraction making up 5.0 ± 1.6 (in vitro prep) or 5.0 ± 1.8 (in vivo prep) percent. None of the formulations deviated >2-fold from the expected 5% (Supplementary Fig. S6). These results confirmed that the molecular architecture and the addition of selected barcodes (Supplementary Table S2) and 3′-PBS did not disrupt aptamer folding, function, or cell targeting, and they did not prevent recovery or significantly bias amplification of the barcoded aptamers.
Multiplexed screening in vitro identifies bispecific EGFR/c-Met aptamer as the best cell line targeting formulation
As a first test of feasibility for BApT, we first performed multiplexed screening of aptamer binding to cells in vitro (Fig. 1B
Because individual formulations carry zero, one, two, or three functional aptamers capable of binding to one or two different molecular targets, and because they display the aptamers in different spatial orientations, they represent a wide range of targeting potential (Supplementary Fig. S4). When fractional representation of each formulation in the recovered samples was compared with INPUT (eg, initial pool of aptamer formulations before the incubation with the cells), formulation #3 (EGFR/c-Met bispecific aptamer, bsApt; valency = 2) clearly stood out above the others as the best cancer cell targeting reagent (enrichment analysis, median log2 fold change, Fig. 2A), including those formulations of molecular architecture 1 and 2 with the same or increased valency.
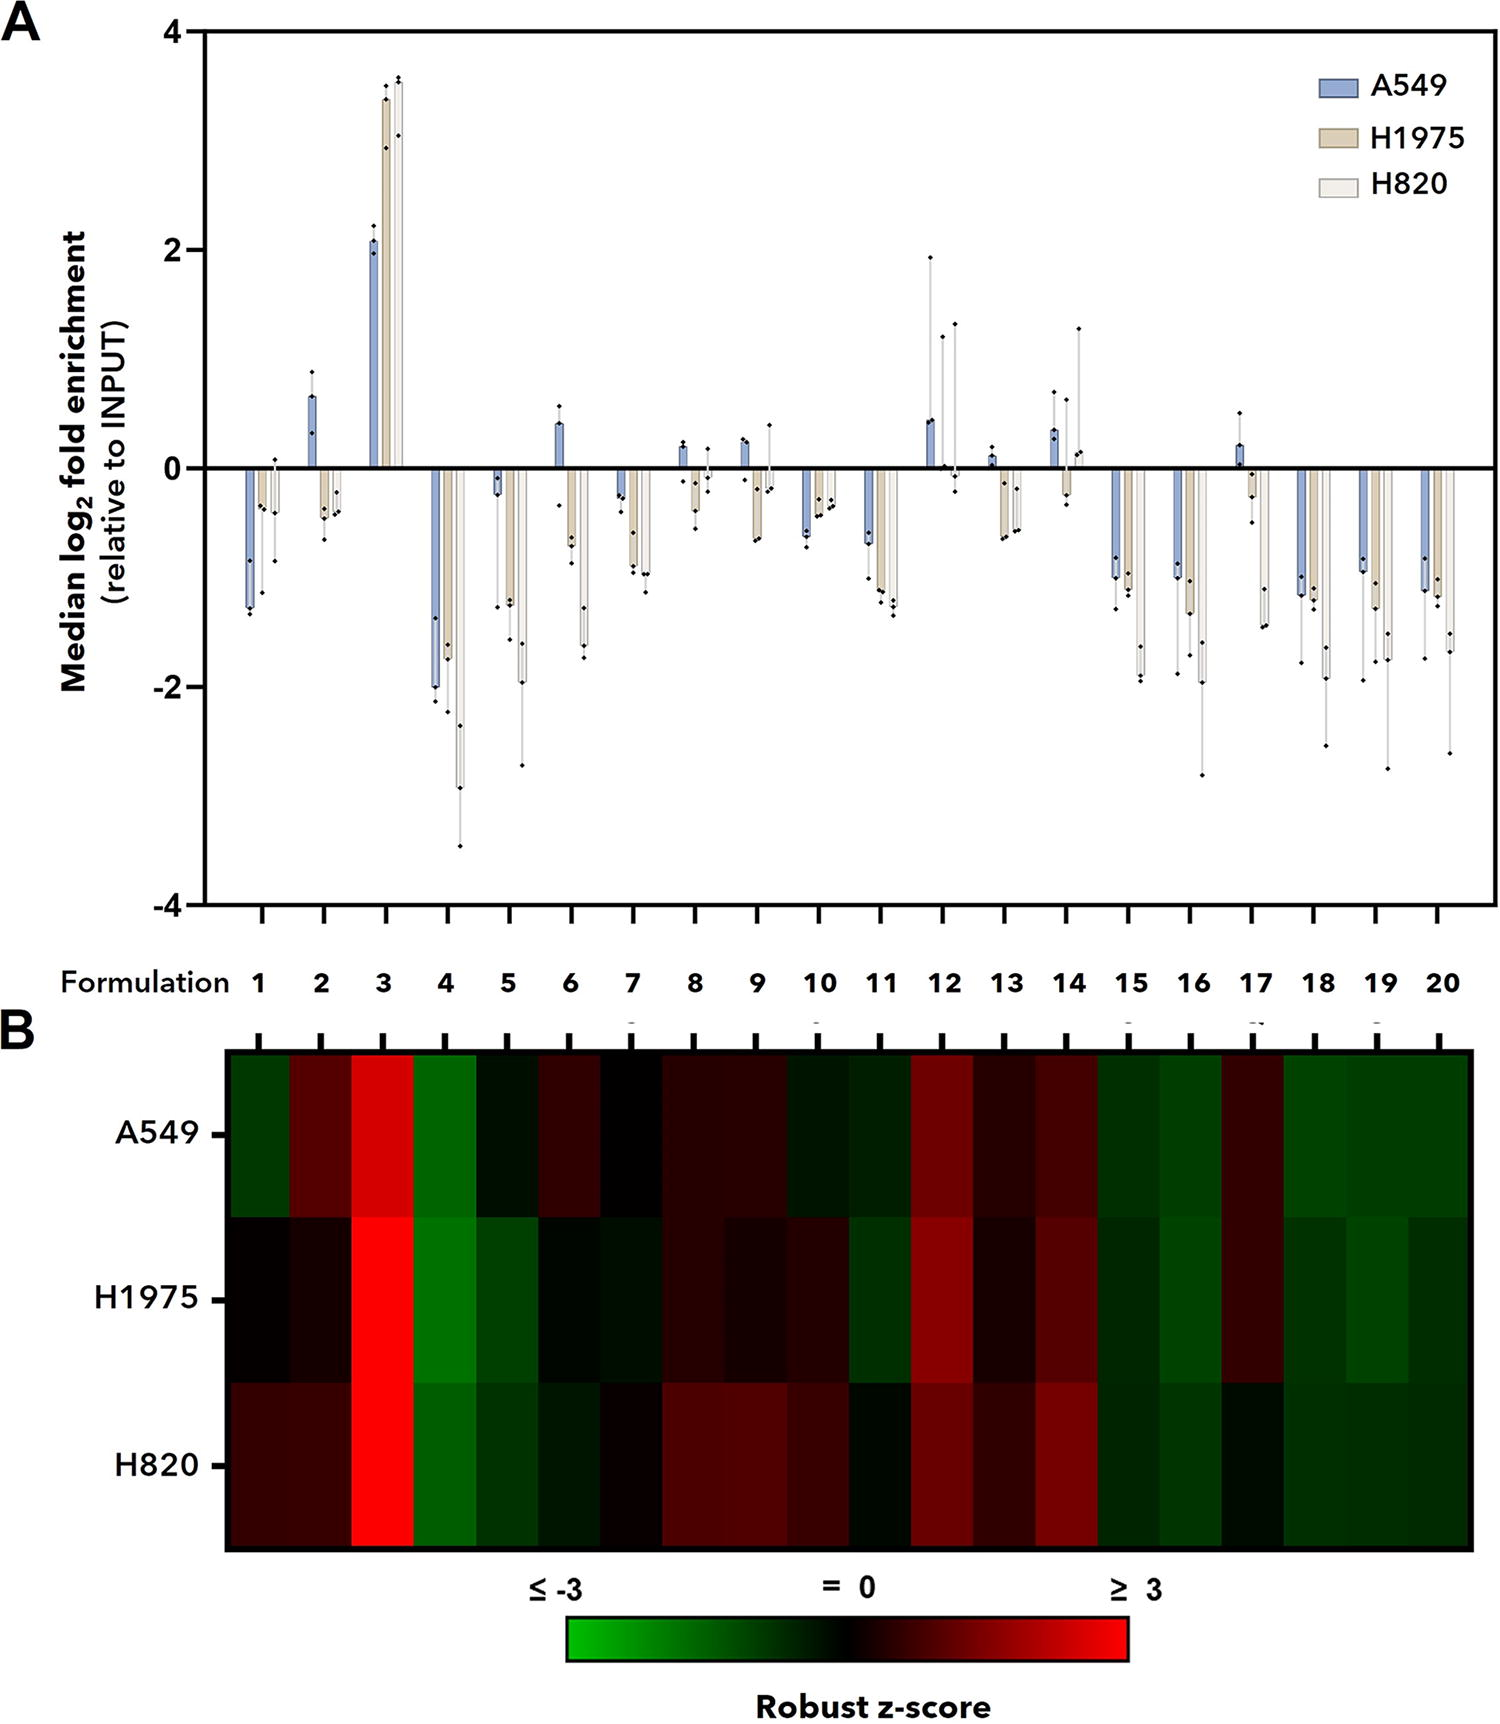
EGFR/c-Met bispecific aptamer is enriched in NSCLC cell lines in vitro. INPUT containing 20 barcoded formulations was incubated with three NSCLC cell lines that express moderate-to-high levels of WT (A549) or mutant EGFR (H1975, H820) and c-Met. After 1 h, cells were washed and lysed to recover total DNA. Barcoded oligos were enriched by PCR, and amplicons were subject to amplicon NGS and analyzed to determine enrichment or depletion of formulation-specific barcodes relative to INPUT.
Robust z-scores (sometimes referred to as modified z-scores) utilize median and MAD to identify meaningful changes from baseline enrichment values and are commonly used in drug screening where values >2 (significance level < 0.05) indicate hits. For our analysis, robust z-scores allow us to easily observe how a given formulation faired compared with the rest of the formulations (median of all samples) within a given sample (eg., cell line) or treatment condition (eg., time). As expected from enrichment analysis, robust z-scores (Fig. 2B) revealed that formulation #3 well outperformed the other formulations. Highlighting the utility of robust z-score analysis, formulations #12 and #14 (valency = 3), which showed little overall enrichment compared with INPUT (Fig. 2A), had robust z-scores that indicated these two formulations were enriched in all cell lines relative to other formulations that were typically depleted. Nontargeting internal controls (Fig. 2, formulations #4–5, #18–20) were generally depleted relative to INPUT and other formulations. Overall, enrichment analysis and robust z-scores indicated that formulations with at least two targeting moieties performed best across all cell lines in vitro. These findings are consistent with previous work from our group, 35 and others,66,68,74 demonstrating that increasing aptamer valency and avidity can greatly increase tumor cell labeling and selectivity in vitro; however, they also indicate that while valency contributes to formulation performance, it does not alone determine it.
Multiplexed screening in vivo identifies monomeric c-Met aptamer as the best tumor targeting formulation
Previous reports have noted a lack of correlation between binding of aptamers to tumor cell lines in vitro and targeting of tumors derived from those cell lines in vivo.7,35,75 While some of these differences can be ascribed to the complexity of the three-dimensional tumor microenvironment relative to cell culture, an aptamer’s structure, size, and spatial orientation in a formulation likely also significantly affect PK factors such as absorption, distribution, metabolism, and excretion (ADME).
76
We therefore used BApT to evaluate tumor targeting in a murine model of human cancer (Fig. 1B
Enrichment analysis (Fig. 3A) and robust z-scores (Fig. 3B) in tumor tissues revealed that the monomeric c-Met aptamer (molecular architecture 1, formulation #1) was the best tumor targeting formulation at early time points (1 and 4 hpi) but saw a decline at the last time point (12 hpi). Formulations #6 (1 EGFR/1 nontargeting moiety) and #3 (EGFR/c-Met bsApt) were the next best tumor targeting formulations, respectively, reaching highest enrichment at 4 hpi but declining by 12 hpi. Among these three, targeting formulation #1 is the smallest, with a molecular weight of ∼30 kDa, followed by formulations #6 and #3 with molecular weights of ∼45 kDa (Table 1).
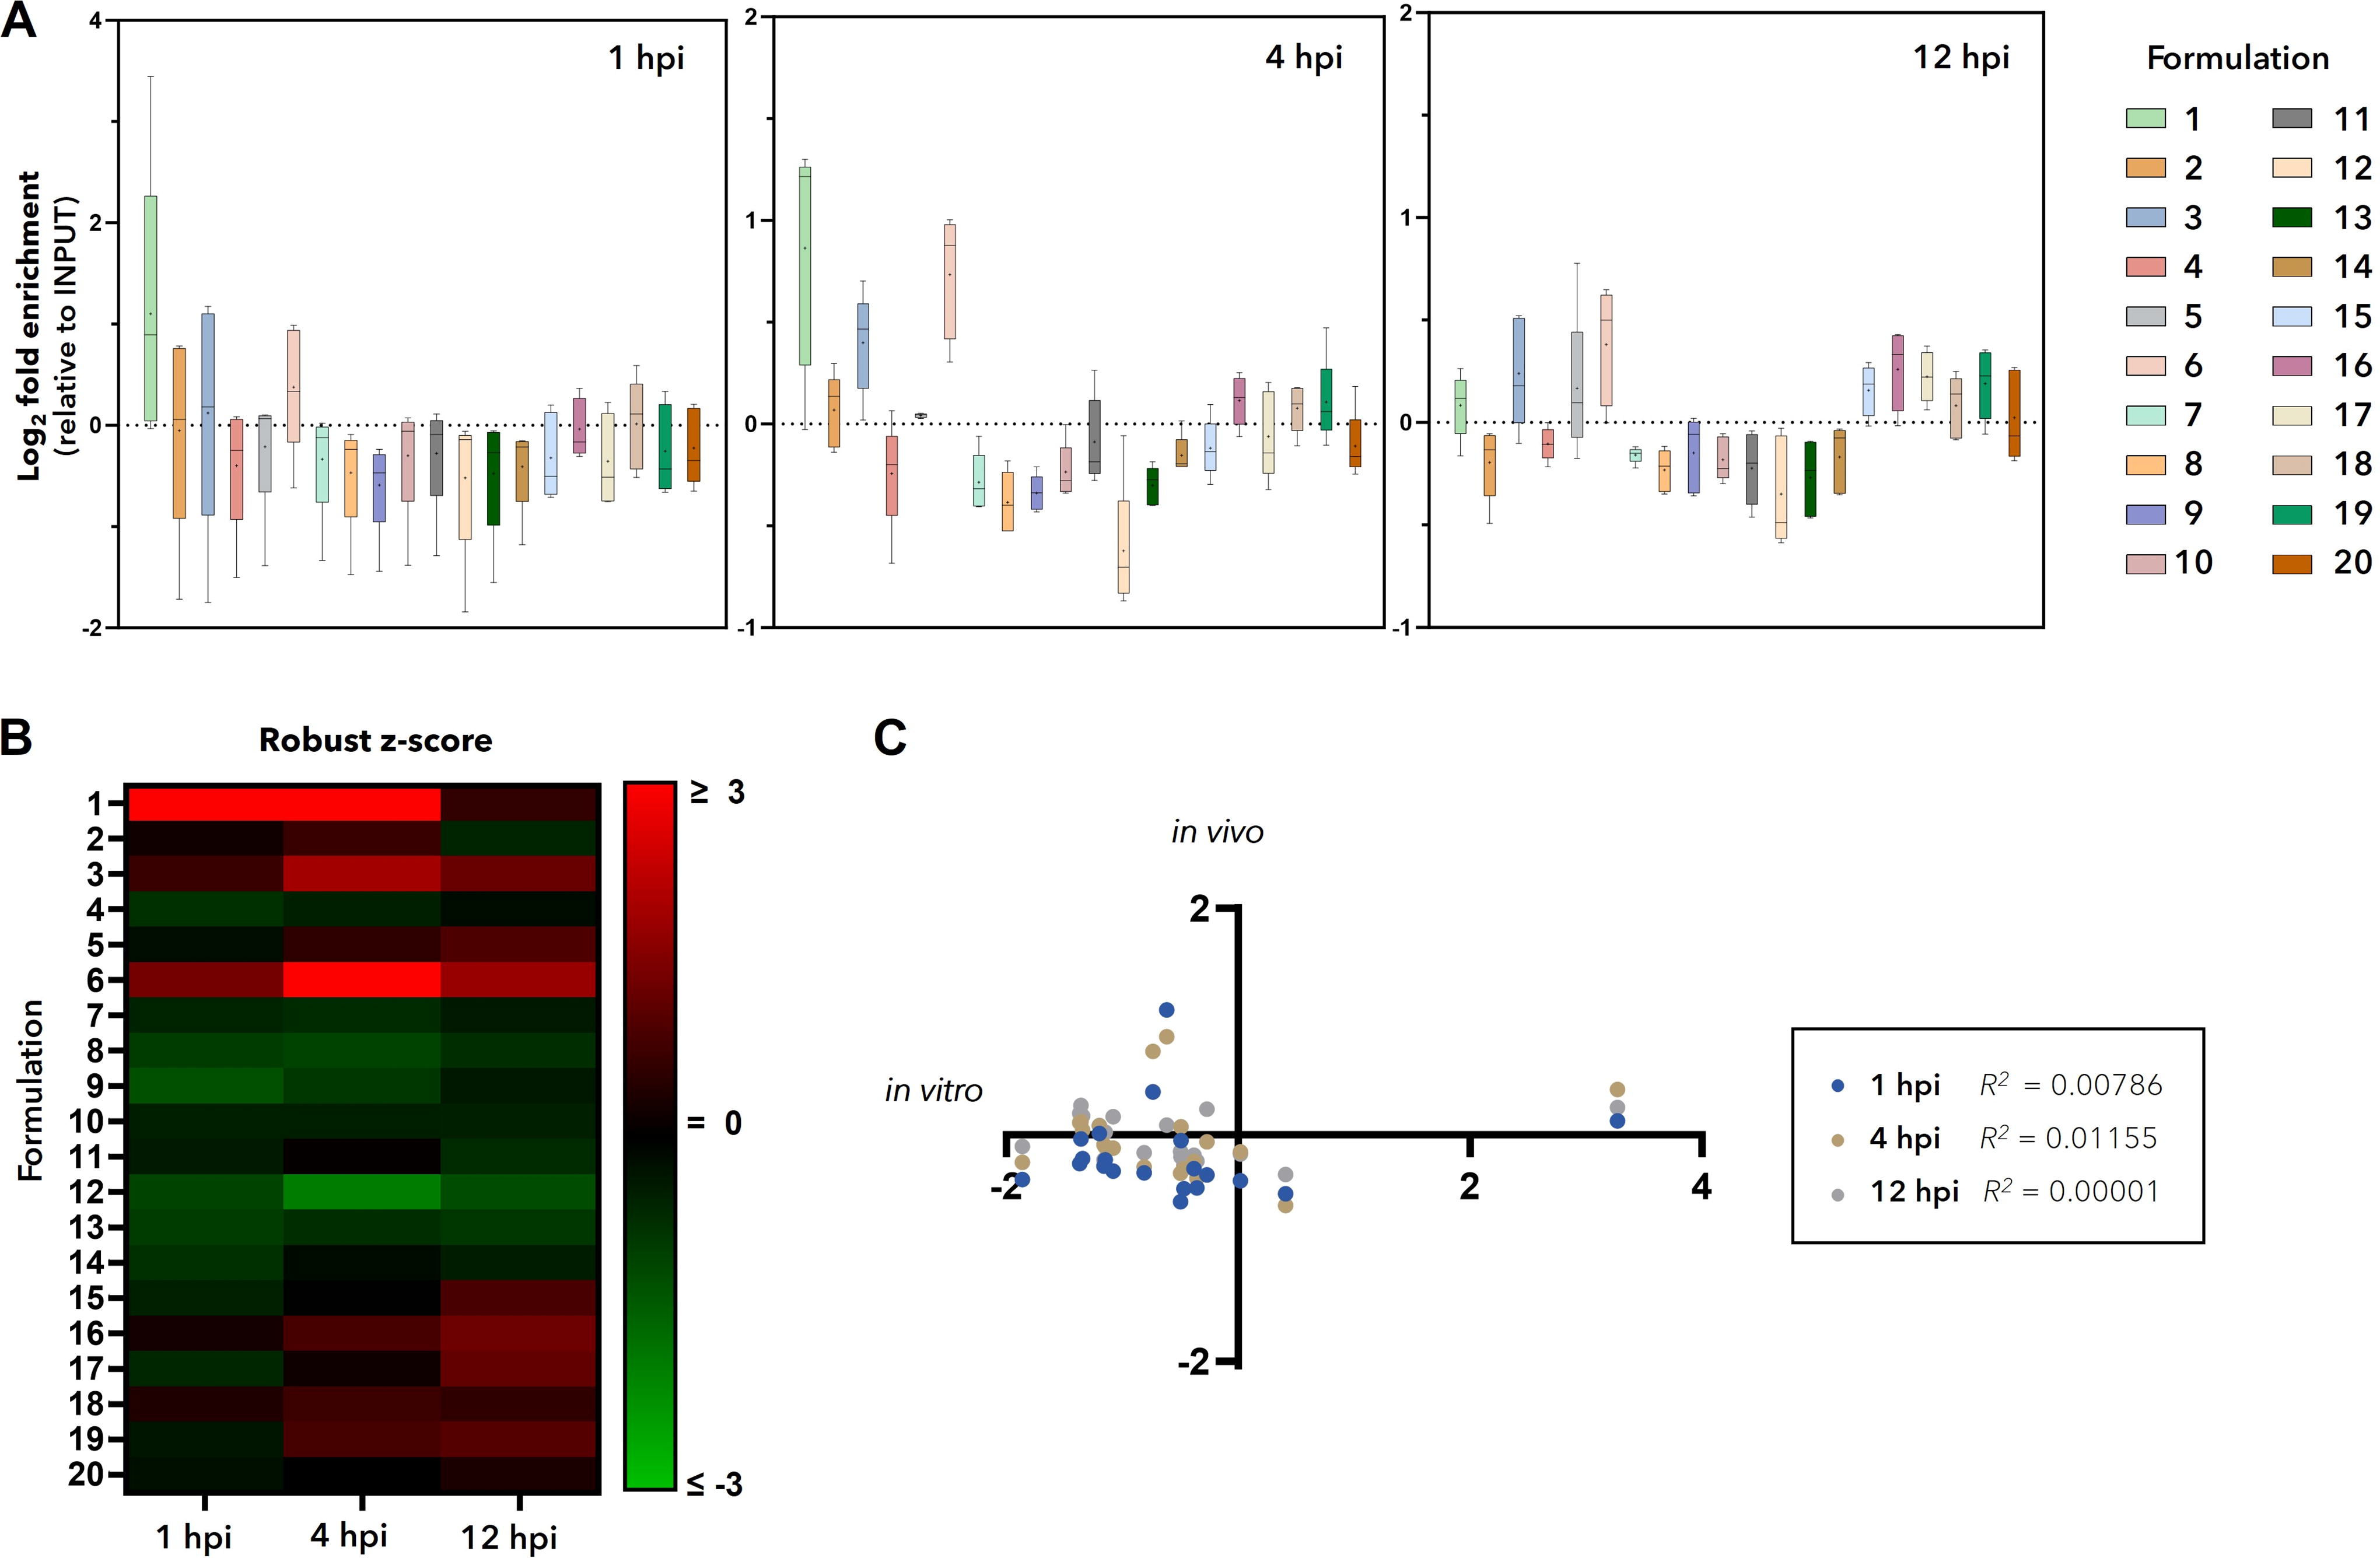
Formulations of molecular architecture 1 are enriched in H1975 tumors in vivo. INPUT containing 20 barcoded formulations was retro-orbitally injected into mice bearing H1975-derived subcutaneous xenografts. After 1, 4, or 12 h postinjection (hpi), mice were euthanized, their vascular systems were flushed, and organs of interest were harvested and prepared into a single-cell solution. Approximately 5 million live cells were lysed to recover total DNA. Barcoded oligos were enriched by PCR, and amplicons were subject to amplicon NGS and analyzed to determine enrichment or depletion relative to INPUT.
In contrast to our in vitro analysis, it is clear that increasing the valency did not seem to drive outcomes in the in vivo model as it did in vitro. Instead, formulation size seemed to be the predominate factor that drove tumor enrichment, although all are likely at play. Correlation analysis revealed no significant overlap between in vitro (H1975) and in vivo experiments, with R-squared values between 0 and 0.012 for all time points (Fig. 3C). The differences between in vitro and in vivo results here, as with other reports, illustrates the need for more representative tumor models to be utilized 77 —such as those that better represent the complexity of the tumor and its microenvironment (eg., 3D organoids or cocultures) or that add PK variables (eg, organ-on-a-chip)—and for formulations to move to in vivo testing as quickly as possible so as to not waste valuable resources, mis-prioritize false positives, or eliminate false negatives.
Enrichment analysis relative to other tissues reveals monomeric c-Met aptamer as the most tumor-specific formulation
To exclude the identification of nonspecific tumor targeting or falsely enriched formulations, we further analyzed enrichment in tumors relative to other tissues—blood, kidney, liver, and spleen (Fig. 4). As fractional abundance and not total sequencing reads are used in these analyses, no direct assumptions can be made about the total amount of a formulation in one tissue relative to another, only that for a given INPUT, a formulation is enriched or depleted at one tissue relative to another. Nevertheless, only monomeric c-Met aptamer (formulation #1) consistently showed enrichment at the tumor relative to all solid tissues at all time points (Fig. 4A–B). Formulations #3 and #6 consistently showed lower enrichment values when compared with assessing tumor targeting alone, although it was still above background at 4 and 12 hpi (Fig. 4B). Importantly, this analysis showed that nontargeting controls (formulations #4–5, #18–20) were mostly depleted relative to other formulations and they were not enriched at the tumor relative to other tissues, serving as internal validation in an in vivo setting (Fig. 4A–B). These data suggest that while multiple formulations may accumulate in the tumor tissue relative to other formulations (Fig. 3, formulations #1, #3, #6), they may also accumulate in other tissues and not be truly tumor specific (Fig. 4, formulation #6). That said, it is important to take into consideration both tumor-only (ie., accumulation by one formulation relative to others at the targeted tissue) and tumor-specific (ie., selectivity of a given formulation at the tumor relative to other tissues) analyses when identifying reagents for a given application. For targeted delivery, it is likely that the ideal reagent is one that is not only consistently (ie., at all time points) highly enriched in the tumor but is also highly tumor specific, criteria used in identifying formulation #1 as the best overall, tumor-specific targeting reagent from our test group of 20 aptamer formulations.
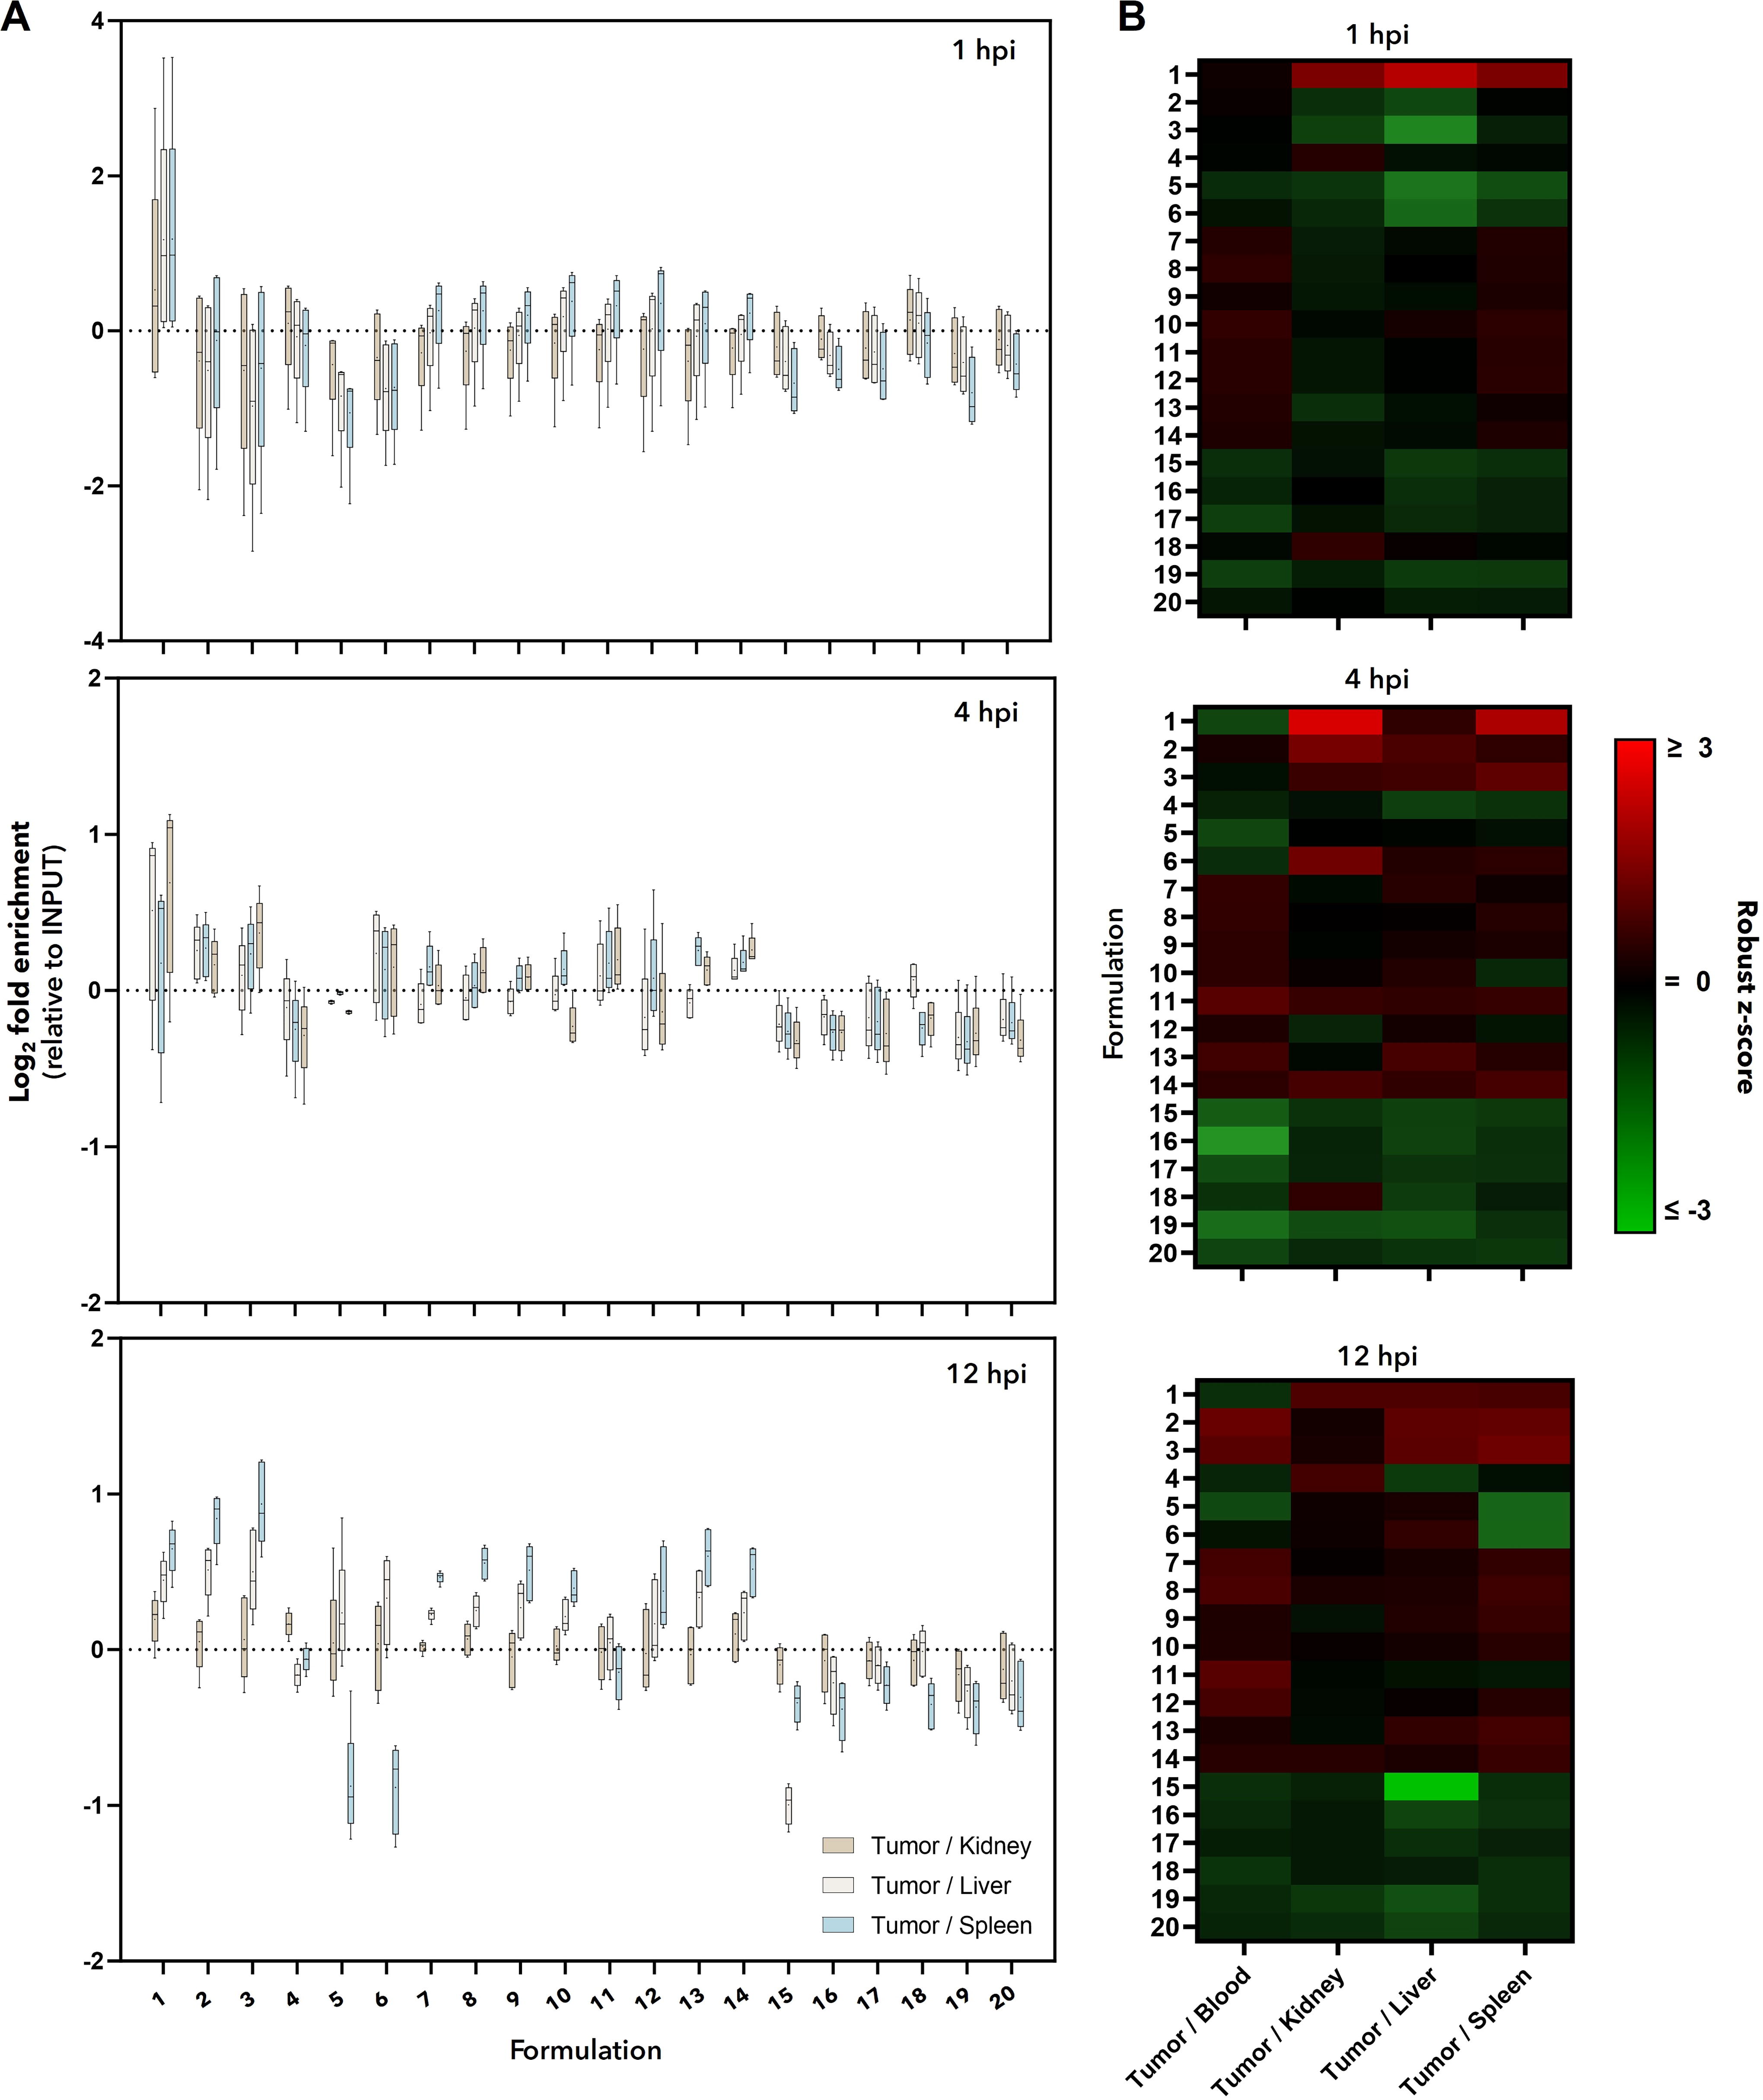
Relative accumulation by tissue identifies monomeric c-Met aptamer as the best tumor-specific formulation in vivo. Normalized tumor enrichment data from Figure 3 were assessed relative to enrichment data from other tissues.
BApT identifies different biodistribution phenotypes based on molecular architecture
A major benefit of BApT is that it can provide a large amount of biodistribution data from the harvested tissues via NGS analysis. Unlike fluorescence or radionuclide imaging, which provides total biodistribution data for only one reagent per animal and may not reflect the true biodistribution (ie, readout is the probe, not the reagent itself), BApT provides true biodistribution data for multiple reagents at once, although relative to each other. This allows us to elucidate trends common among formulations, such as molecular architecture type, that may contribute to a specific biodistribution phenotype. Among formulations built from molecular architecture 2, those harboring the barcoded c-Met targeting moiety (formulations #7–14) were quickly and systemically depleted from all observed organs, including blood (Supplementary Fig. S7A–B), despite these formulations being equivalently represented in the INPUT (Supplementary Figs. S5 and Figs. S6). Although the underlying mechanisms driving this systemic depletion have not yet been elucidated, we speculate these formulations may have been delivered to different tissues or locations that were not sampled for NGS analysis, or they may not have properly intravasated into the vasculature after RO injection. Looking at the metabolic tissue biodistribution (eg., biodistribution to kidney, liver, and spleen), another trend emerges for formulations of molecular architecture 1 (30–45 kDa), all of which tended to show higher enrichment in both the kidney and liver at the earliest time point (1 hpi) compared with formulations of molecular architecture 2 (73–101 kDa; Supplementary Fig. S7A–B). This trend diminished with time; it was less prevalent at 4 hpi, and by 12 hpi molecular architecture 2 (formulations #15–20) was more predominate in the liver and kidneys. Despite differential enrichment in metabolic tissues over time, the fractions within the blood remained rather consistent and were unremarkable over time. These examples illustrate the ability of BApT to identify trends among groups of related formulations that can guide further optimization, in addition to identifying groups of promising formulations.
Discussion
Biodistribution and tumor-specific targeting
BApT identified a monomeric c-Met aptamer (formulation #1) as the best formulation among 20 predefined barcoded aptamer formulations targeting cell-line-derived NSCLC xenografts harboring moderate-to-high levels of mutant EGFR and c-Met in vivo (Figs. 3 and 4). As each formulation was defined by a molecular architecture, we were better able to identify and develop hypotheses about formulation properties, such as the size and valency of targeting moieties, that may lead to improved tumor targeting at the observed time points and for our specific targets. The best overall tumor-specific targeting aptamer was also the smallest formulation, with molecular weight of ∼30 kDa (Figs. 3 and 4). In one of our recent works, we observed similar findings where an EGFR/c-Met bispecific aptamer did not outperform the tumor targeting properties of a monospecific EGFR apt in vivo. We hypothesize this could be because smaller molecules are better able to extravasate from circulation and penetrate the complex, three-dimensional landscape of the tumor microenvironment.8,69 In addition, smaller aptamers possess fewer net negative charges and a smaller exposed surface area compared with larger, multimeric aptamers, and these properties could provide better tumor selectivity by reducing nonspecific binding to plasma proteins and accumulation in nonspecific tissues. Later time points showed a loss of tumor-targeted enrichment of formulation #1 and a gain of enrichment of formulations #3 and #6 (Fig. 3). This may reflect differences in clearance based on size (ie., kidney glomerular filtration and time spent in circulation). The general loss of tumor enrichment (Fig. 3A) and decreased total number of reads (data not shown) over time for all formulations are likely due to the known overall metabolic instability of partially modified aptamers. As noted by others,8,16,78 future work should aim to observe longer time points using fully modified and conjugated reagents, for which circulation half-lives are significantly increased.
Target recognition and tissue-specific accumulation are critical for all reagents poised for diagnostic purposes and for most reagents poised for therapeutic purposes. Understanding of potential aptamer toxicity in humans is limited,8,79 but among the therapeutics that have seen clinical success (mainly siRNA, and ASOs), several have reported significant hepatotoxicity and kidney toxicity in a subpopulation of patients during clinical evaluation. The majority of these adverse events can be attributed to properties that make oligonucleotides prone to nonspecific protein interactions and drive unwanted tissue distributions,7,80 such as backbone charge. Nonetheless, these findings have led to the draft development of industry guidelines for specific considerations when assessing oligonucleotide therapeutics, 81 which include assessing biodistribution to metabolic tissues. Using BApT to assess tumor enrichment relative to other tissues such as those involved in nucleic acid metabolism (kidney, liver, and spleen) allowed us to identify reagents that are not only accumulating at the tumor (or target tissue) but doing so in a specific manner relative to other tissues, thus decreasing the likelihood of added toxicity from nontarget tissue enrichment.
Humane use of animal models
Ethical and humane use of animal models has garnered increasing attention in translational research. 82 The BApT method makes it possible to minimize the number of animals required for pilot studies and/or to include many more formulations and controls in the analysis. Instead of each aptamer formulation requiring 3–10 animals at each time point (eg., total of 60–200 mice per time point for the 20 formulations evaluated here, including controls), BApT allows for all formulations to be screened in parallel in a single animal (total of 3–10 mice per time point, independent of number of samples), thereby maximizing the utility of each animal and making the pilot analysis of targeting reagents more cost effective and humane for translational research. Minimizing the number of animals also lends well to the use of clinically translatable models, such as humanized rodents or patient-derived xenograft, for which generating these animals may be tedious and costly (eg., bone marrow transplantation or orthotopic implantation), tissue may be limited (eg., small clinical sample after early surgical intervention), and repetitive inoculation and passaging disrupts tumor heterogeneity and ultimately the clinical utility of the sample.
Technology considerations and future applications
Consideration of potential limitations of BApT suggests strategies to mitigate or overcome them. First, amplification bias during amplicon PCR and NGS83,84 can be mitigated by minimizing the number of PCR cycles used for enrichment, by subjecting the INPUT to similar amplification steps, and normalizing data appropriately, as we have done, and by using polymerase enzymes that minimize amplification bias, such as BST3.0 for reverse transcription of RNA aptamers. 85 Amplification bias may be largely eliminated in some cases by forgoing PCR enrichment and sending recovered DNA directly for NGS (after modifying 5′/3′-PBS sequences accordingly). Second, barcodes and PBS should be designed to minimize perturbations of aptamer folding and target recognition properties that drive successful targeting. In our design, this was achieved by using part of the 5′ sequence of the aptamer as the 5′-PBS (ie., no additional sequences were added to the 5′-end) and by including a 3′-PBS that forms a stable stem-loop structure, reducing opportunities for interaction with the aptamer or with the annealing scaffold. Structure perturbations can be further mitigated by minimizing the barcode and PBS length, by using secondary structure prediction software (eg, NUPACK or Mfold) to eliminate strongly predicted misfolds, and by experimentally confirming target-binding function with and without added sequences, as we have done. Lastly, as partially modified aptamers are metabolically unstable in plasma and in endolysosomal compartments, fully or partially degraded sequences might not get detected, especially as our DADA2 analysis pipeline requirements were set so that the sequenced oligonucleotides were counted only if the inferred sequences contained the proper barcode and flanking sequences (∼60 nt total). However, this phenomenon (metabolism) could be explored by using less strict sequence requirements, such as barcode only or barcode plus a few neighboring nucleotides. That said, this becomes less of a concern with more stable reagents, such as fully modified aptamers.
BApT was designed to be generalizable and broadly adaptable to accelerate the development of clinically useful oligonucleotide diagnostic and therapeutic reagents. In the present work, we showed the feasibility of BApT to evaluate 20 multimeric aptamer formulations, but we anticipate that this technology can be readily applied to explore other variables that drive tissue-specific targeting. This includes but is not limited to (i) building upon prior efforts to facilitate the optimization of delivery reagents,37,86,87 (ii) examining different delivery methods,88,89 or (iii) improving previously reported partially modified aptamers by assessing where and what sequence modifications are allowed while retaining, and ideally improving, in vivo targeting and PK properties. Such iterative and systematic comparisons of modified reagents have been reported for siRNAs88,90 and ASOs,91,92 but much less so for aptamers.7,26,93 In addition, we foresee opportunities to advance BApT, such as exploiting the intersection of both single-cell and amplicon sequencing technologies to elucidate organ- and cell-type-specific delivery. 94 These applications and advancements could make BApT a valuable tool for fields interested in identifying superior nucleic acid-based targeting reagents.
Supporting Information Available
Schematics of formulations and design; data from BApT validation studies (annealing, in vitro binding, PCR, INPUT amplicon sequencing); data from other tissues from BApT test in vivo; additional statistical analyses; aptamer and barcode sequence information.
Footnotes
Acknowledgments
We would like to thank Dr. A. Ohler for her insights and guidance on statistical analyses.
Author Disclosure Statement
The authors declare no competing interests.
Data Availability Statement
Funding Information
This work was financially supported by the MU Tier 1 Sequencing funds sponsored by the UM Research Strategic Investment Program and the University of Missouri School of Medicine (PI: Porciani), the MU Life Sciences Center (LSC)-Early Concept Grant (ECG) for Innovative Collaborative Research involving Post-Doctoral Researchers (PI: Burke-Daniels-Porciani), and the UM Research and Creative Works Strategic Investment Program grant (PI: Burke).
References
Supplementary Material
Please find the following supplemental material available below.
For Open Access articles published under a Creative Commons License, all supplemental material carries the same license as the article it is associated with.
For non-Open Access articles published, all supplemental material carries a non-exclusive license, and permission requests for re-use of supplemental material or any part of supplemental material shall be sent directly to the copyright owner as specified in the copyright notice associated with the article.