
Abstract
Alcohol consumption prior to traumatic brain injury (TBI) promotes morbidity and mortality although the mechanisms involved remain unclear. The morbidity and mortality caused by TBI, especially brain contusion, are known to be closely associated with brain edema. Here we examined the effects of ethanol pretreatment on brain edema, inflammatory responses, and oxidative stress after brain contusion. Male Wistar rats were given 3 g/kg ethanol intraperitoneally and 1 h later were subjected to brain contusion. The ethanol-pretreated group had a significantly decreased survival rate. Magnetic resonance imaging showed ethanol pretreatment significantly augmented the volume of cytotoxic brain edema after contusion. In the ethanol-pretreated rat, the activities of NF-κB and AP-1 were reduced 6 h after contusion and COX-2 mRNA expression was increased 24 h after contusion. These findings suggest that ethanol augmented cerebral edema and mortality in rats with brain contusion, possibly through actions on cell survival pathways or COX-2 expression. In addition, antioxidant treatment at 3 h post-injury significantly attenuated some markers of oxidative stress, mortality, and volume of edema at 24 h after ethanol treatment and contusion.
Introduction
A
Brain edema is a common and serious complication after severe TBI that is associated with poor neurological outcome (Unterberg et al., 2004). The development of edema promotes the occurrence of secondary injuries, including delayed hemorrhage, ischemia, and intracranial hypertension, which frequently lead to death. Two major types of brain edema exist, namely, vasogenic and cytotoxic edema. Vasogenic brain edema is characterized by protein-rich plasma-derived exudates that result from increased capillary endothelial cell permeability to albumin and other plasma proteins (Betz et al., 1989). It has been shown that ethanol intake prior to brain injury promotes edema by increasing the permeability of the blood-brain barrier (Albin and Bunegin, 1986). Thus, ethanol can increase vasogenic edema after TBI. Cytotoxic brain edema is characterized by sustained intracellular water accumulation by both astrocytes and neurons (Unterberg et al., 2004). It has been observed that acute ethanol exposure also induces cultured rat primary astrocytes and astroglia to swell (Allansson et al., 2001; Aschner et al., 2001).
TBI induces a complex array of immunological/inflammatory tissue responses with similarities to ischemic reperfusion injury (Werner and Engelhard, 2007). Actually, ethanol alters proinflammatory responses in the brain such as cytokine release and the activation of innate immune system signaling in the brain (Emanuele et al., 2005; D'Souza El-Guindy et al., 2007; Fitzgerald et al., 2007). The activation of proinflammatory responses in the brain after TBI has been shown to correlate with the subsequent development of secondary damage (Shohami et al., 1994; Knoblach et al., 1999; Stover et al., 2000). These proinflammatory responses involve nuclear factor-kappaB (NF-κB) and activating protein-1 (AP-1), which are important components of signal transduction pathways leading to cell survival (Shaulian and Karin, 2002). We have found that acute ethanol intake rapidly (within 20 min) activates NF-κB and AP-1 in hepatocytes (Matsumoto et al., 2000, 2002). Thus, ethanol consumption several hours before TBI may enhance the proinflammatory response to TBI, therefore promoting the development of more severe brain damage.
It has been suggested that TBI causes oxidative stress (Sen et al., 1994; Awasthi et al., 1997). Recently, Yi and colleagues (2005) reported that the expression of Heme oxygenase-1 (HO-1), a suggestive marker of oxidative stress, occurred in the injured cerebral cortex following TBI. Tyurin and colleagues (2000) indicated that relative amounts of fluorescent end products of lipid peroxidation in brain extracts were increased at 6 and 24 h after traumatic brain injury. Bayir and co-workers (2005) reported that after TBI, 3-nitrotyrosine, a marker of oxidative stress, was increased but ascorbate, an antioxidant, was decreased. Therefore, TBI causes oxidative stress, which may contribute to the pathogenesis after TBI. On the other hand, ethanol consumption causes oxidative stress in the brain (Nordmann, 1987). Taken together, prior alcohol consumption may increase oxidative stress after TBI.
These observations led us to hypothesize that ethanol intake just prior to brain contusion may enhance TBI-induced proinflammatory responses in the brain, and that this elevates oxidative stress and thereby augments the development of secondary brain injuries. To test this hypothesis, we used a rat TBI model to ask whether ethanol indeed augments the development of cytotoxic brain edema after brain contusion. We also examined the role that proinflammatory cytokines and transcriptional factors play in the TBI-induced formation of edema. Finally, we examined the role of oxidative stress in brain edema after TBI by injecting the antioxidant.
Materials and Methods
Animals
Male Wistar/ST rats (270–300 g) were purchased from Sankyo Labo Service (Sapporo, Japan) and were housed in cages in a temperature-controlled (24°C) animal colony with a normal 12 h/12 h light-dark schedule (lights on at 7:00 am). The animals had free access to food and water until 24 h prior to traumatic brain injury, when the food source was removed. All experimental procedures were approved by the Animal Care and Use Committee of Sapporo Medical University School of Medicine. First, 0.9% saline (10 mL/kg) and 3 g/kg ethanol (10 mL/kg) were administered intraperitoneally to the rats in control and EtOH group, respectively. Each group consisted of six animals. Dead animals were removed from the examination except for survival analysis. Brain samples were obtained 3, 6, 24, or 48 h after TBI. Ethanol-pretreated rats without TBI were performed by i.p. administration of 3 g/kg EtOH.
Determination of blood ethanol concentrations
Blood samples were obtained from portal veins 3, 6, 24, or 48 h after TBI. In the non-TBI groups, the samples were obtained at the same time as the TBI groups. Ethanol concentration in blood was measured by headspace gas chromatography (GC), as described previously (Matsumoto et al., 1994). The GC system consisted of a Shimadzu GC-14A gas chromatograph equipped with a flame ionization detector and a Headspace Sampler HS-40 (Perkin Elmer Inc., Waltham, MA). Samples were injected into the Headspace Sampler under the following conditions: sample temperature, 60°C; needle temperature, 100°C; transfer temperature, 120°C; GC cycle time, 15 min; thermostatting time, 20 min; pressurization time, 3.0 min; injection time, 0.20 min; withdrawal time, 0.5 min. GC chromatography was carried out on a DB-ALC2 analytical column (J&W Scientific Inc., Folsom, CA) under the following conditions: column temperature, 50°C; injector temperature, 150°C; detector temperature, 200°C.
Traumatic brain injury
Each rat was anesthetized intraperitoneally with ketamine (75 mg/kg) and xylazine (10 mg/kg) and positioned in a prone position in a stereotaxic head frame (Narishige Scientific Instrument Lab, Tokyo, Japan). A midline scalp incision was made and the skin and periosteum were retracted from the skull surface. A craniotomy (7 mm in diameter) was performed by drilling between the bregma and lambda, 1 mm right lateral to the midline.
Brain contusion was produced using a weight drop method and injury device modified from that procedure described by Ucar and colleagues (2006). Preliminary studies were conducted to determine the mass of the weight and the height from which the weight was dropped in order to produce a moderate TBI. The injury device consisted of a vertical Plexiglas tube that could be held in place by a stand and contained a 30 g steel weight that was held in place 1 meter above the end of the tube by a stopper. Prior to dropping the weight, it was manually lowered onto the brain to ensure precise contact. Then the trauma device was taken in the brain 1.5 mm depth precisely by the stereotaxic manipulator. It impacted an area of the brain that was 4 mm in diameter. Any rebound impact was prevented by pulling on the rope attached to the weight. After TBI, the scalp was closed by sutures.
The sham operation was performed as follows. A midline scalp incision was made and the skin and periosteum were retracted from the skull surface. A craniotomy (7 mm in diameter) was performed by drilling between the bregma and lambda, 1 mm right lateral to the midline of brain. Following this, the scalp was closed by sutures.
Magnetic resonance imaging
Before imaging, all rats were anesthetized with an intraperitoneal injection of ketamine (75 mg/kg) and xylazine (10 mg/kg). Each rat was then placed in an animal holder/magnetic resonance imaging (MRI) probe apparatus and positioned inside the magnet. The animal's head was held in place inside the imaging coil. MRI imaging was performed by using a 7-Tesla, 18-cm-bore superconducting magnet (Oxford Magnet Technologies, Witney, Oxfordshire, United Kingdom) interfaced to a UNITYINOVA console (Varian, Palo Alto, CA). T2-weighted images (T2WI) were obtained from a 1.0 mm thick coronal section with a 0.5 mm gap using a 30 mm × 30 mm field of view, TR = 3000 ms, TE = 37 ms, b value = 0, and reconstructed using a 256 × 256 image matrix. Diffusion-weighted images (DWI) were obtained under the same conditions as T2WI except for the b value, which was 1000. MRI images were obtained 3, 6, 24, or 48 h after TBI.
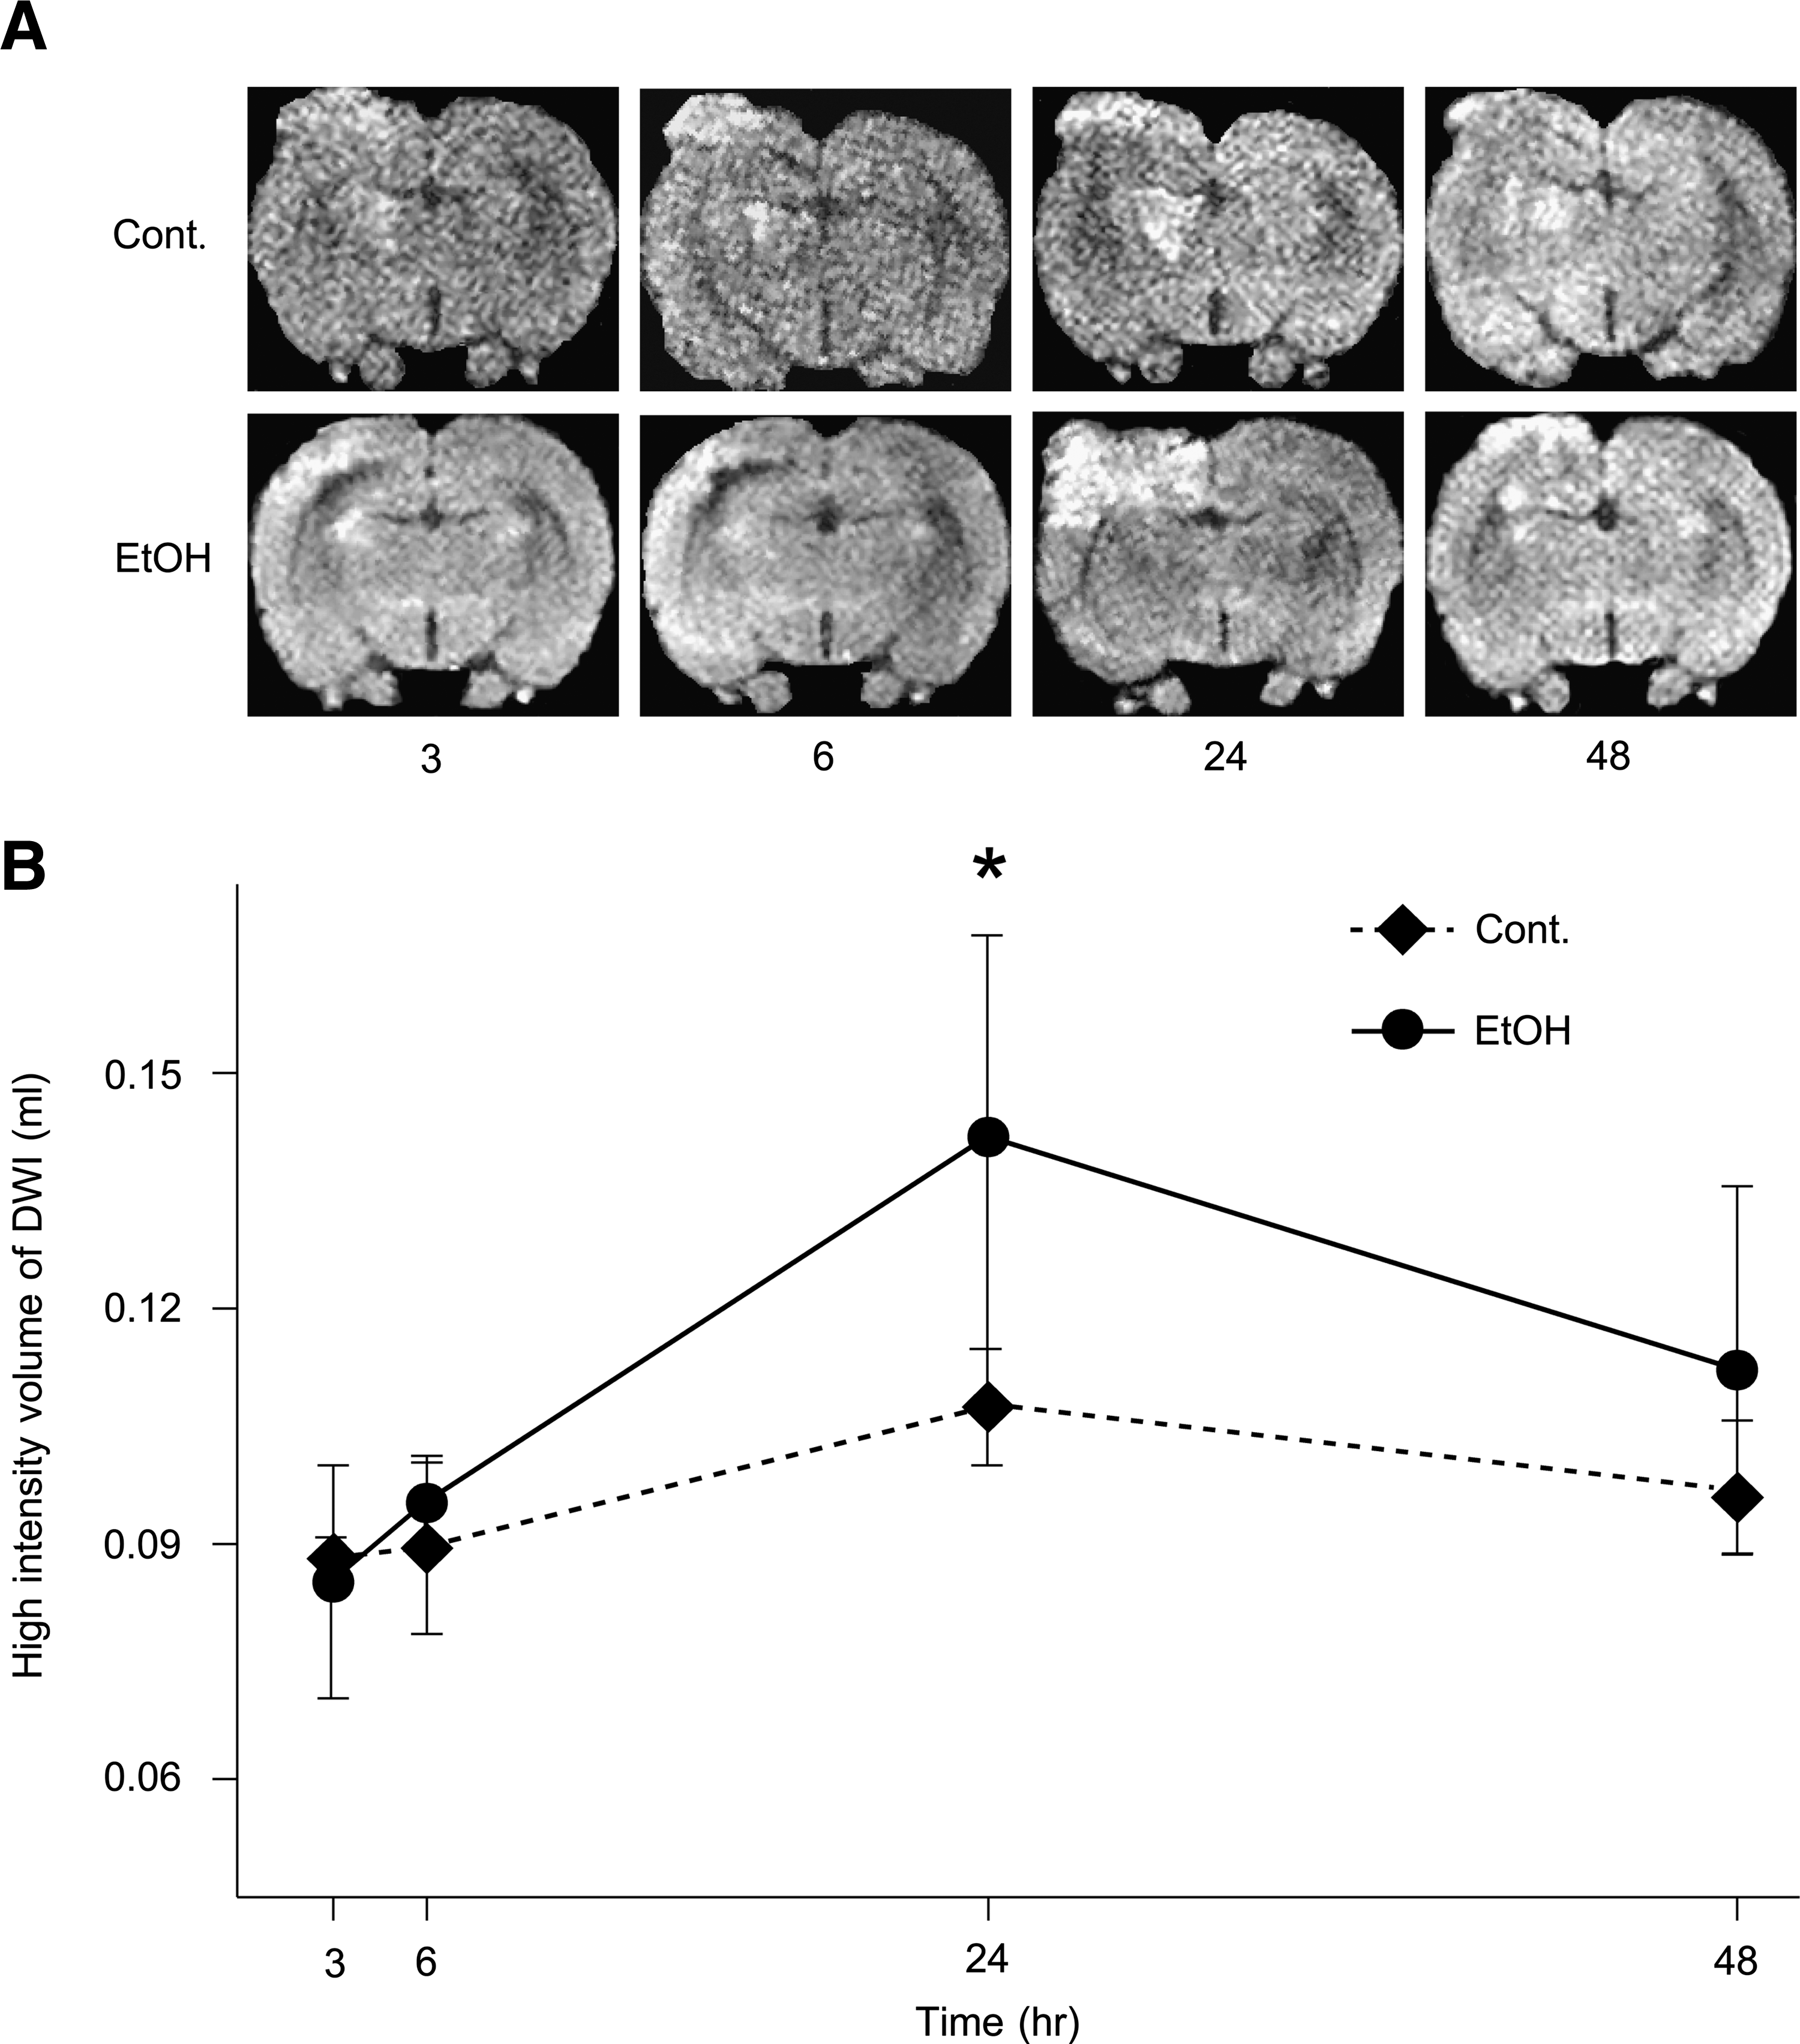
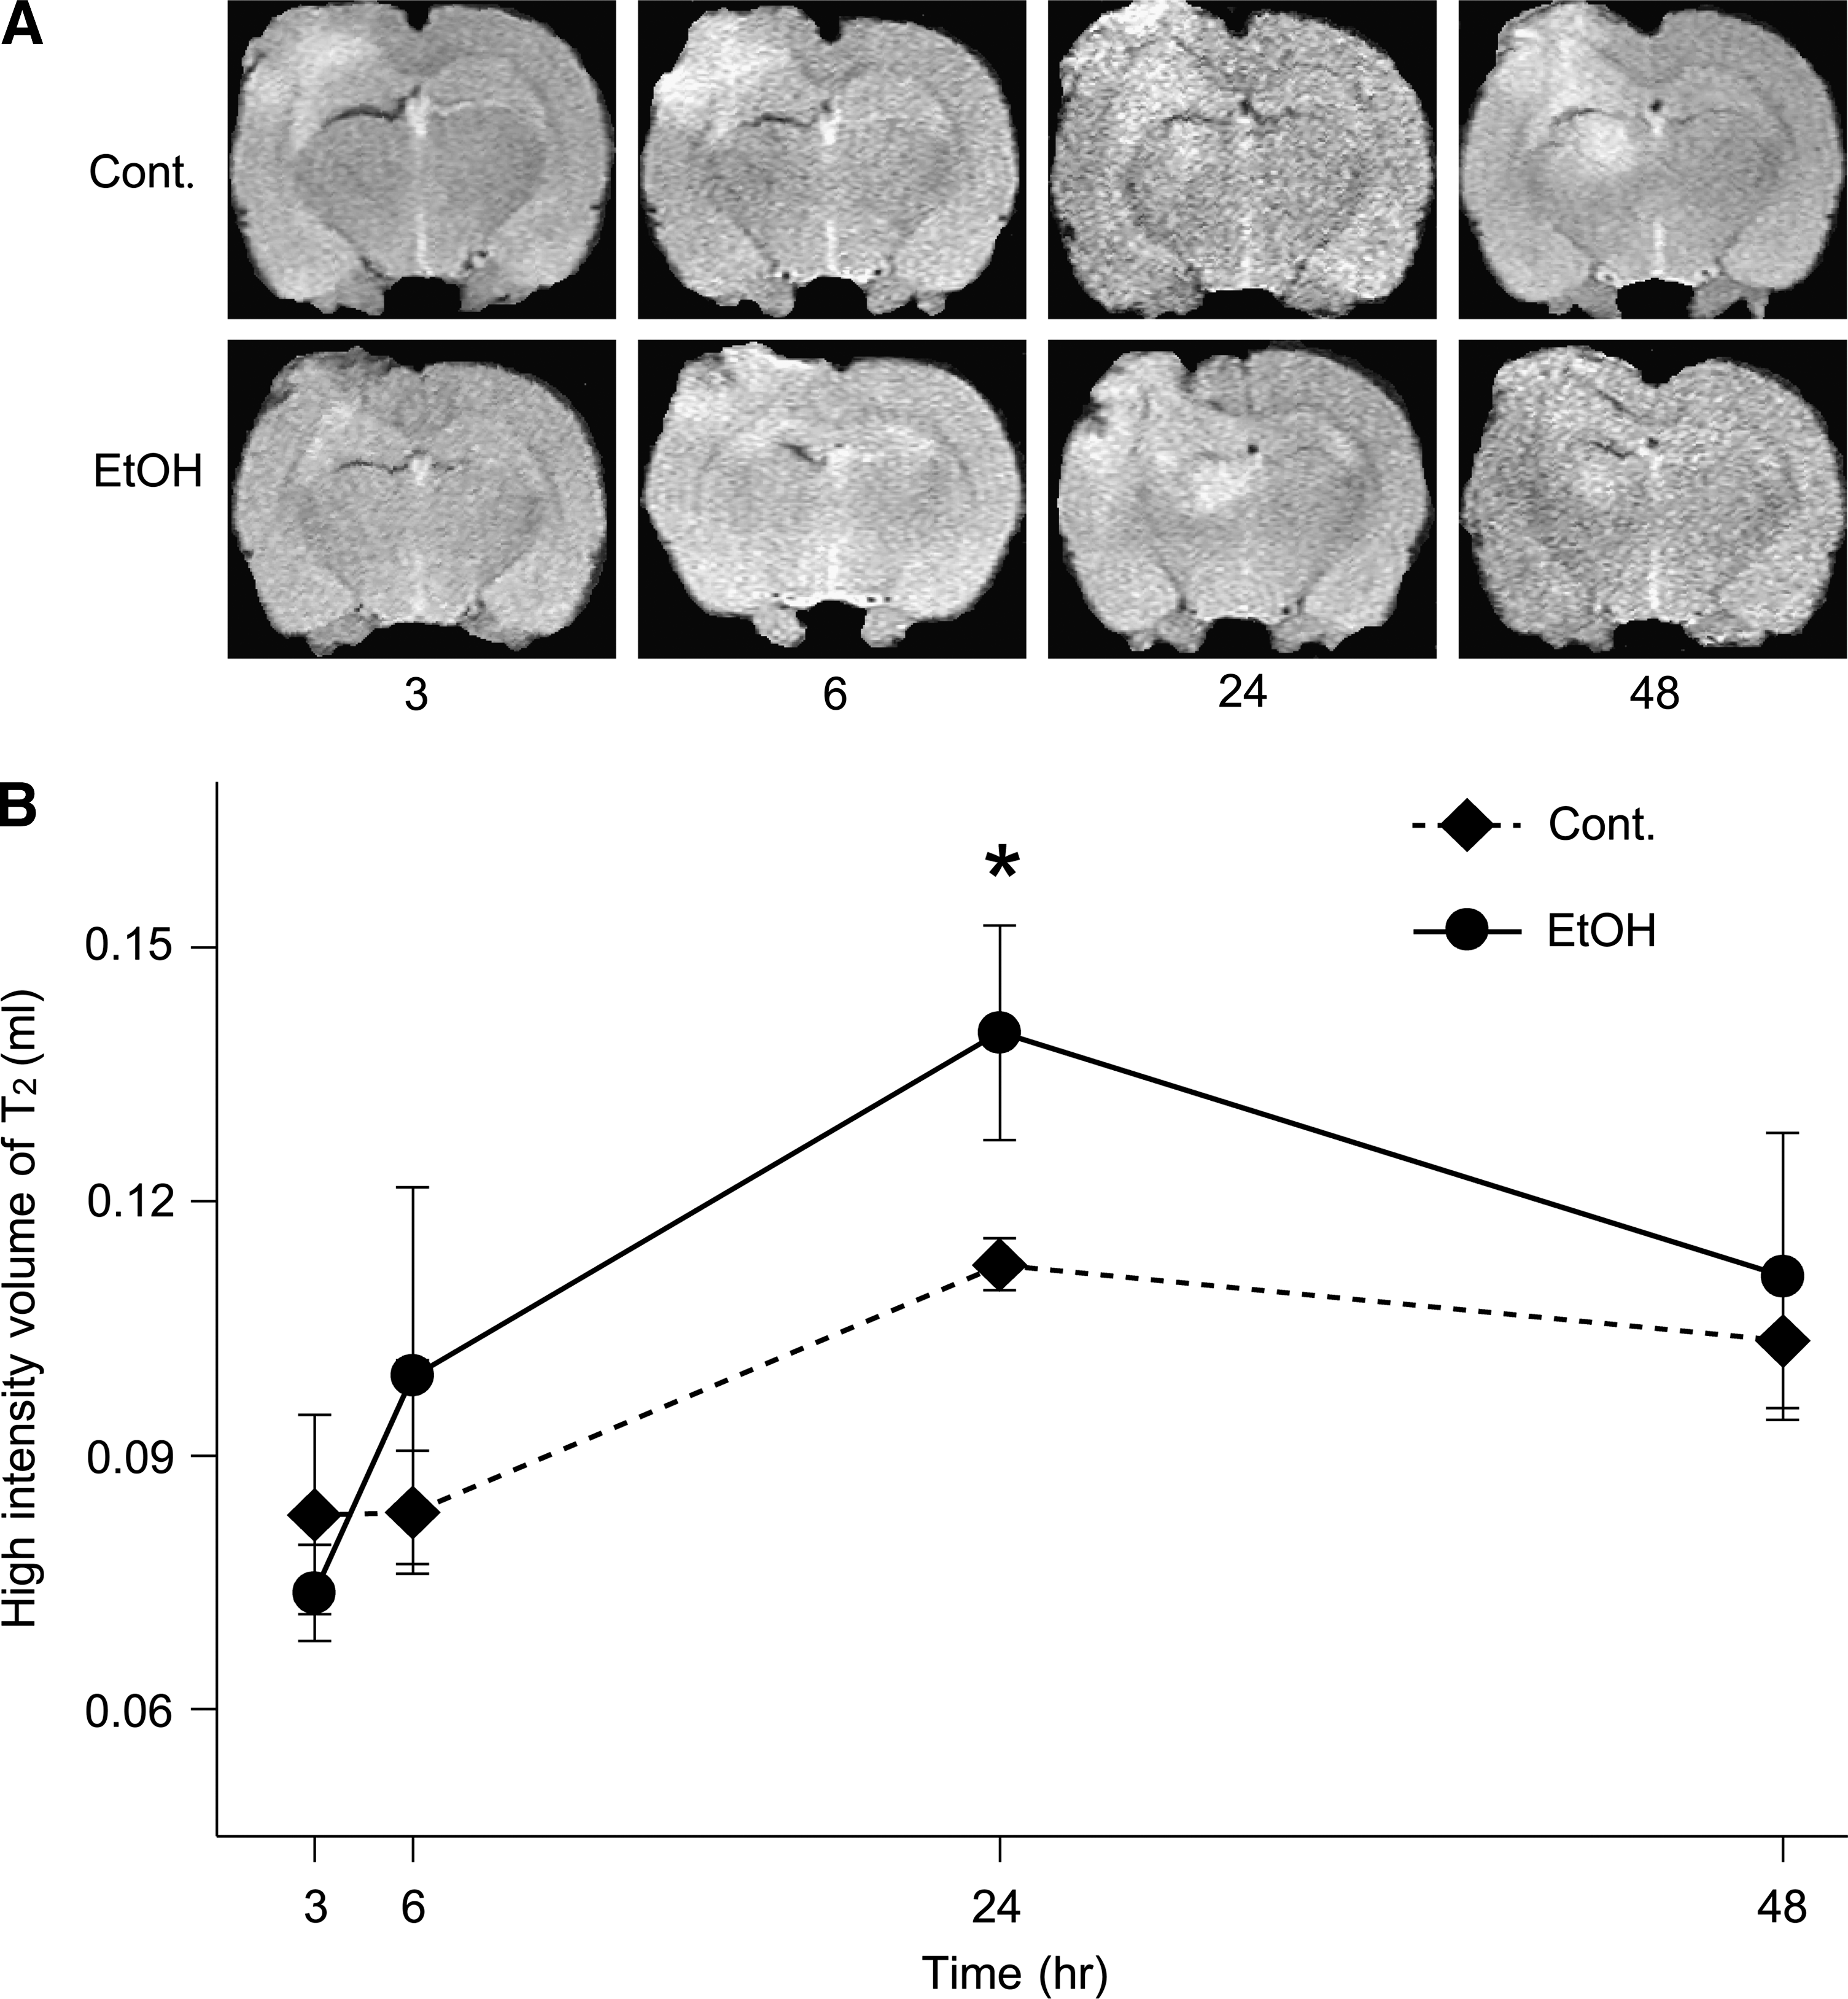
The brain contusion and edema lesion area were calculated from both T2WI and DWI by using imaging software (Scion Image, Version Beta 4.0.2, Scion Corp., Frederick, MD) as described previously (Neumann-Haefelin et al., 2000). For each slice, the higher intensity lesions in T2WIs and DWIs, in which the signal intensity was 1.25 times greater than the counterpart in the contralateral brain area, were marked as the contusion or edema area, and the high intensity volume was calculated by taking slice thickness (1 mm per slice) into account as described previously (Onda et al., 2007).
Histopathology
The rats were injected with ketamine (75 mg/kg) and xylazine (10 mg/kg) 3, 6, 24, or 48 h after TBI and their brains were quickly extracted. After brain extraction, brain was divided into two sections (anterior and posterior) at the brain contusion area. Anterior section was used for biochemical analysis. For histopathological analysis, the posterior section was fixed for 3 days in 10% neutral-buffered formalin containing 4% formaldehyde, 0.5% sodium phosphate buffer, and 1.5% methanol (pH 7.0). The brains were cut into 5 mm coronal sections and embedded in paraffin. A microtome was then used to section the brains into 50 μm slices. The slides were stained with hematoxylin and eosin.
Electrophoretic mobility shift assay
Ipsilateral cortex was taken for use in the electrophoretic mobility shift assay (EMSA) and mRNA assays. After brain extraction, brain was frozen at −80°C until analysis.
EMSA was performed as described previously (Nishitani and Matsumoto, 2006). Briefly, consensus NF-κB and AP-1 double-stranded oligonucleotides (Santa Cruz Biotechnology, Santa Cruz, CA) were end-labeled with [γ-32P]ATP by using T4 polynucleotide kinase (Boehringer Mannheim, Indianapolis, IN). For binding reactions, 5 × 10⁴ cpm of the labeled oligonucleotide probes were incubated with 5 μg nuclear extract and 1 μg poly-(dI-dC) in binding buffer (4% [v/v] glycerol, 1 mM MgCl2, 0.5 mM EDTA, 0.5 mM DTT, 50 mM NaCl, 10 mM Tris-Cl [pH 7.5]) at room temperature for 30 min. Protein-DNA complexes were separated by electrophoresis on a 7% non-denaturing polyacrylamide gel in 0.5 × TBE buffer and visualized and quantified by FLA-3000 (Fuji Photo Film Co., Tokyo, Japan). Quantitative analysis of each band was performed by densitometry using the Quantity One 1-D analysis software (Bio-Rad Laboratory, Hercules, CA) and the Scion Image software (Scion Image Beta 4.02 Win).
Quantitative real-time RT-PCR
Total RNA was isolated from the brain by using TRIzol reagent (Invitrogen, Carlsbad, CA) according to the manufacturer's instructions. After treatment with deoxyribonuclease I (Invitrogen), total RNA was reverse-transcribed into cDNA by using SuperScript II reverse transcriptase (Invitrogen) and oligo (dT)12–18 primers (Invitrogen). The PCR primers used amplified cyclophilin A (Cyp A), IL-1α, IL-1β, IL-2, IL-10, TNFα, cyclo-oxygenase-2 (COX-2), cFos, high mobility group B1 (HMGB-1), receptor of advanced glycation end products (RAGE), neuronal nitric oxide synthase (nNOS), endothelial nitric oxide synthase (eNOS), inducible nitric oxide synthase (iNOS), hemeoxygenase-1 (HO-1), NADPH oxidase-1, NADPH oxidase-4, or erythropoietin (EPO). The sequences of these primers are shown in Table 1. Quantitative real-time PCR was conducted by using the DNA Engine Opticon System (MJ Research, Watertown, MA). Each 20 μL reaction mixture contained 10 μL SYBR Premix Ex Taq (Takara Bio, Otsu, Japan), 2 pmol forward primer, 2 pmol reverse primer, and 20 ng cDNA. Amplification parameters consisted of an initial denaturation at 95°C for 10 s followed by 50 cycles of a three-step PCR: denaturation at 95°C for 5 s, annealing at 61–65°C for 20 s, and extension at 72°C for 15 s. The expression of the housekeeping gene CypA was used as a control to assess differences in loading and cDNA synthesis efficiency among samples. The mRNA expression levels are shown as cycles of the threshold (Ct) value normalized against the CypA mRNA value. To determine the relationships between Ct values and mRNA levels, the primers were calibrated by using serial dilutions of cDNA. We confirmed that there were good correlations between Ct values and cDNA dilutions for each primer set.
N-acetyl cysteine treatment
N-acetyl cysteine (NAC) treatment, based on a cysteine analog (Kelly, 1998), can protect against reactive oxygen species by restoring intracellular glutathione levels (Ratan et al., 1994; Juurlink and Paterson, 1998). Three hours after TBI, 150 mg/kg NAC was administered to rats. For this experiment, four ethanol-pretreated rats were subjected to TBI and then given NAC. Brain sample extraction and MRI imaging were performed 24 h after TBI.
Statistical analysis
The survival of the various groups was evaluated by using the Kaplan-Meier method. Differences between groups were assessed by log-rank test. The results were expressed as means ± SD (n = 3–6 independent samples). Data were analyzed using two-way ANOVA with repeated measures or Student's t test as appropriate between EtOH group and control group. A p value of <0.05 was considered statistically significant.
Results
Blood ethanol concentrations in the ethanol-pretreated group were 2.078 ± 0.182 and 1.189 ± 0.286 mg/mL at 3 (4) and 6 (7) h after TBI (ethanol administration), respectively. We did not detect blood ethanol 24 h after TBI. On the other hand, the concentrations in the non-TBI group were 2.962 ± 0.460 and 1.536 ± 0.789 mg/mL 4 and 7 h, respectively, after ethanol administration. Then blood ethanol was eliminated from the body 25 h after ethanol administration in the group.
The survival rates of the control and EtOH groups after TBI are shown in Figure 1. The control animals all survived for over 48 h but only 89%, 84%, 52%, and 52% of the EtOH animals were still surviving 3, 6, 24, and 48 h after TBI, respectively. The lower survival rates of the ethanol group were statistically significantly different from the control survival rates. These findings also suggest that ethanol consumption prior to TBI is critical.
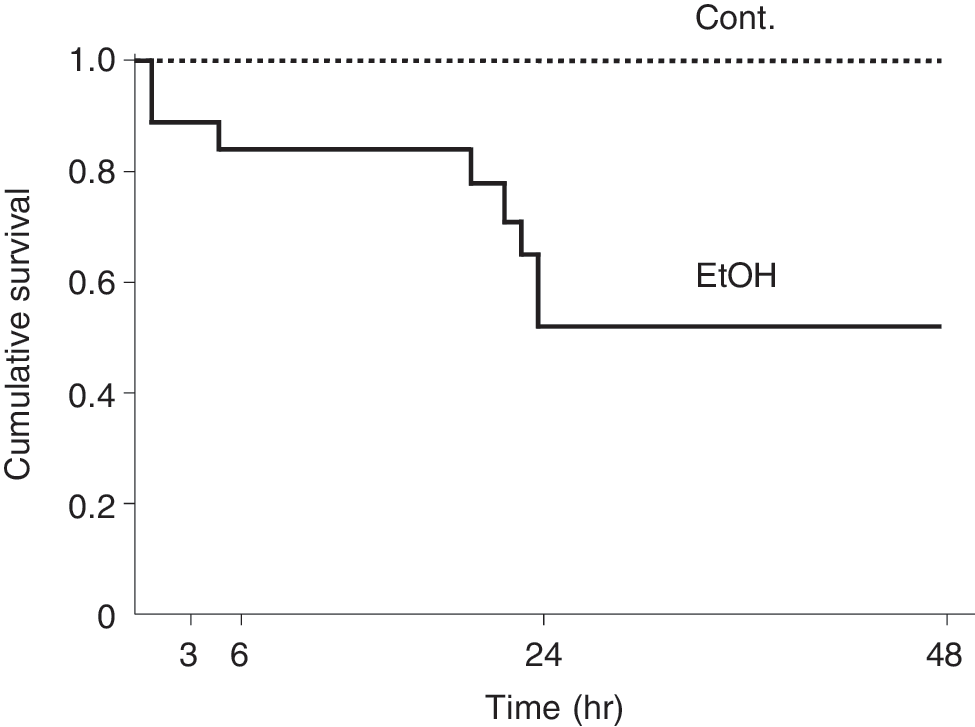
Kaplan-Meier survival curve. Only the EtOH group showed animal deaths. Survival probability for the EtOH animals decreased markedly between 6 and 24 h after TBI. Time 0 indicates when TBI was inflicted. Log-rank test, p = 1.09 × 10⁻³. Cont., control; n = 23; EtOH, ethanol, n = 29.
The brains of the surviving animals were stained with hematoxylin and eosin and examined histologically 3, 6, 24, and 48 h after TBI. Cell swelling was observed in all the animals until 48 h after TBI (Fig. 2). The size of the lesion was estimated by in vivo MRI (see Materials and Methods section) 3, 6, 24, and 48 h after brain contusion. DWI is more useful for detecting lesions of the cytotoxic edema, while T2WI is more useful for detecting areas of brain contusion and edema. Representative MRI DWIs and T2WIs are shown in Figure 3A and 4A, respectively. The changes in lesion volume and area over time are shown in Figures 3B and 4B. Three hours after brain injury, the EtOH group showed slightly lower brain edema. However, at the 24 h time point, the EtOH group had significantly enhanced brain edema in both DWIs and T2WIs. On the other hand, there was no edema in all the EtOH-treated rats without TBI. These observations indicate that ethanol may initially delay but then subsequently exacerbate brain edema after brain contusion.
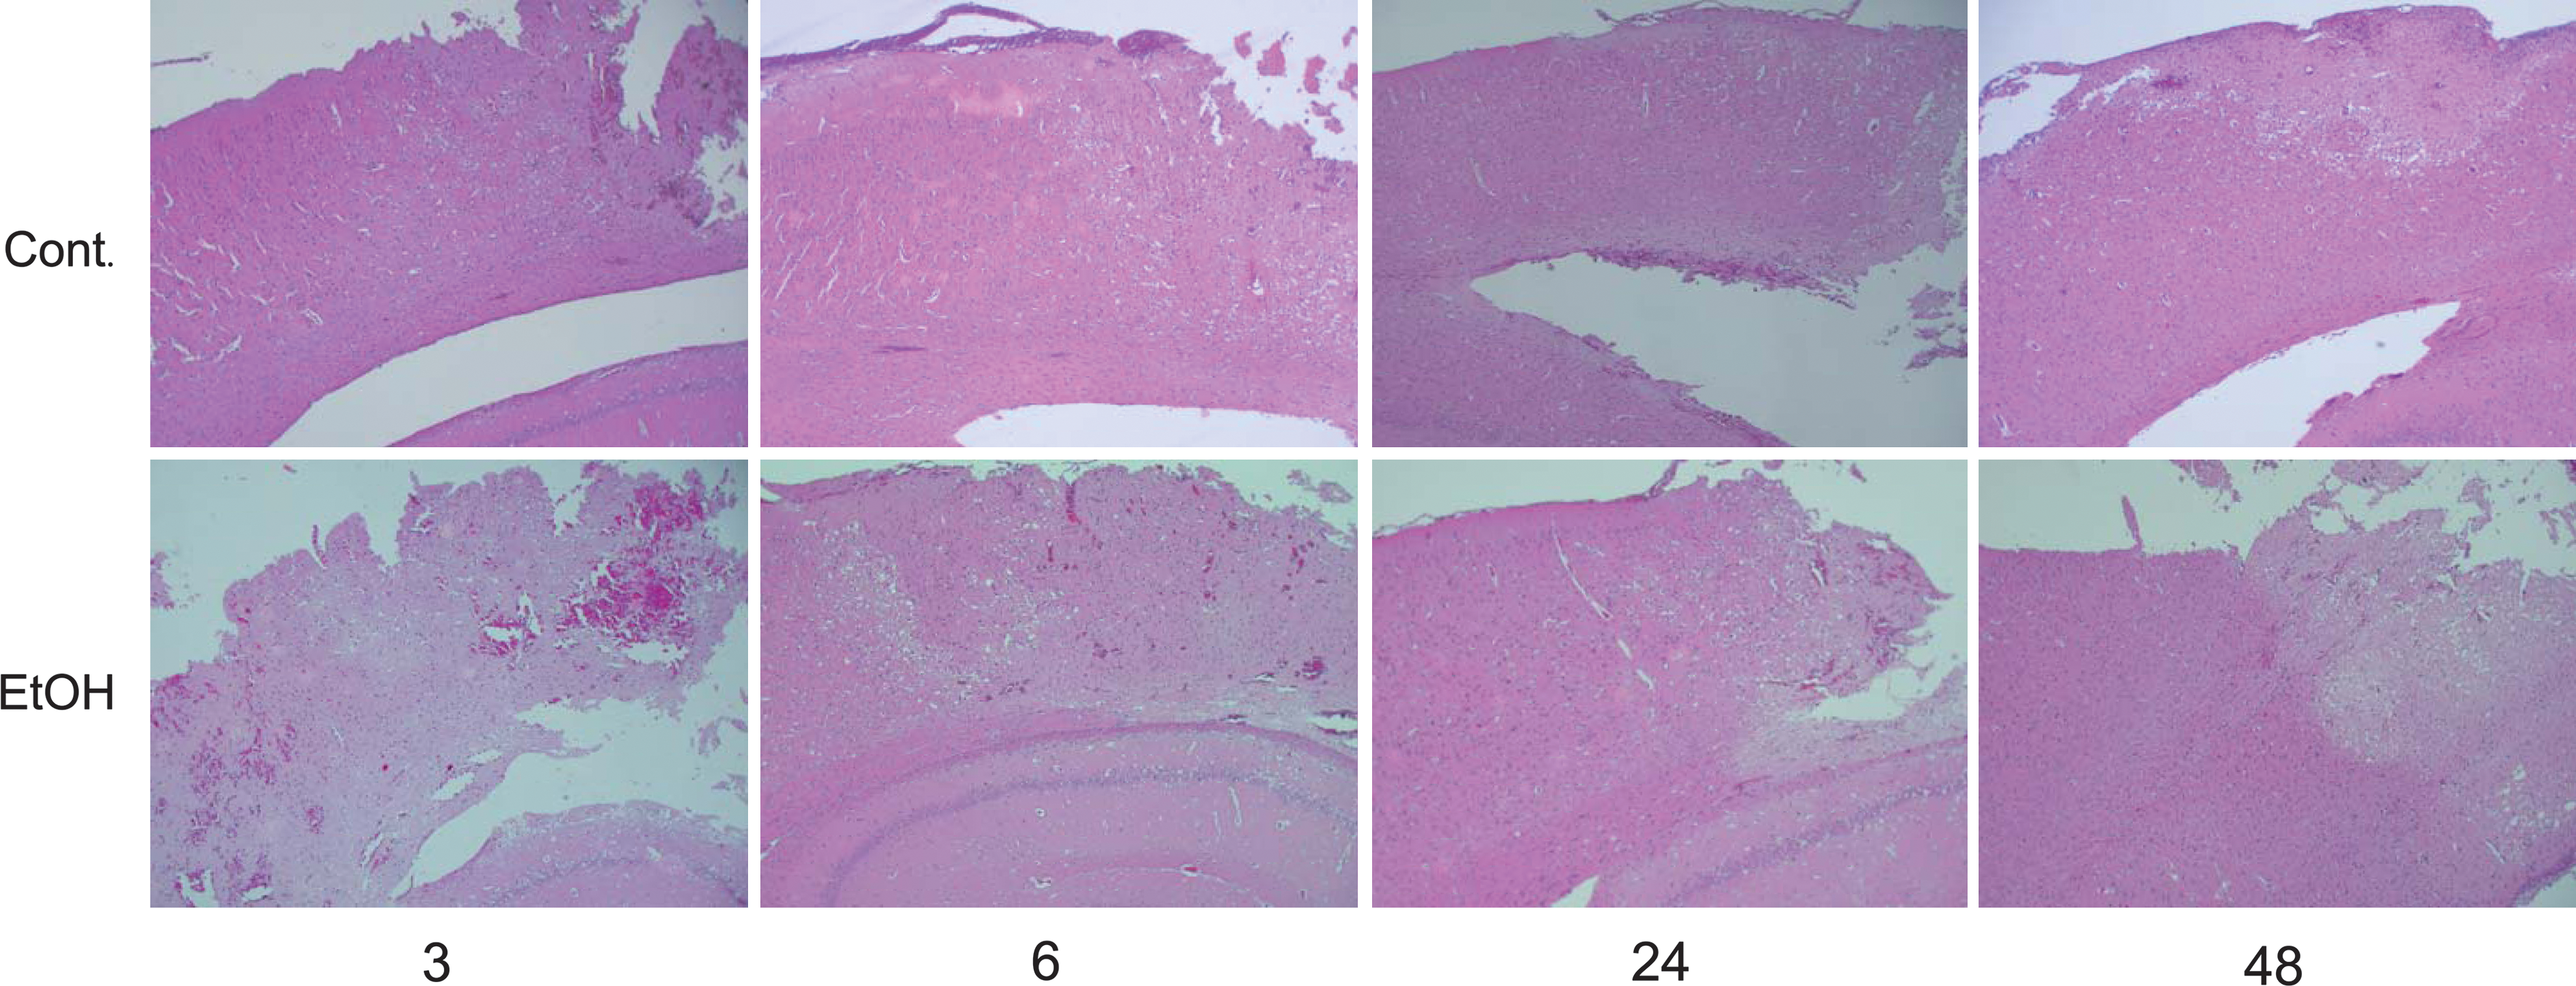
Hematoxylin and eosin staining for the brain tissue following traumatic brain injury. Upper and lower panels show typical experiments of the control (Cont.) and ethanol (EtOH) groups, respectively. All the photomicrographs at 50-fold magnification show cell swelling, indicating cytotoxic brain edema. The phenomenon occurs remarkably in the cortex near the contusion lesion.
(
(
We then examined the mRNA expression of various proinflammatory cytokines in the TBI region. Ethanol pretreatment significantly augmented COX-2 mRNA expression at the 24 h time point after TBI but had no effect on IL-1β, HO-1, HMGB-1, cFos, nNOS, eNOS, iNOS, and NADPH oxidase 1 mRNA expression (Fig. 5). IL-1α, IL-2, IL-10, TNFα, NADPH oxidase 4, RAGE, and EPO mRNA expression was not detected in either control or EtOH brains (data not shown). Thus, inflammatory cytokines do not appear to play a pivotal role in ethanol-induced enhancement of brain edema after brain contusion.
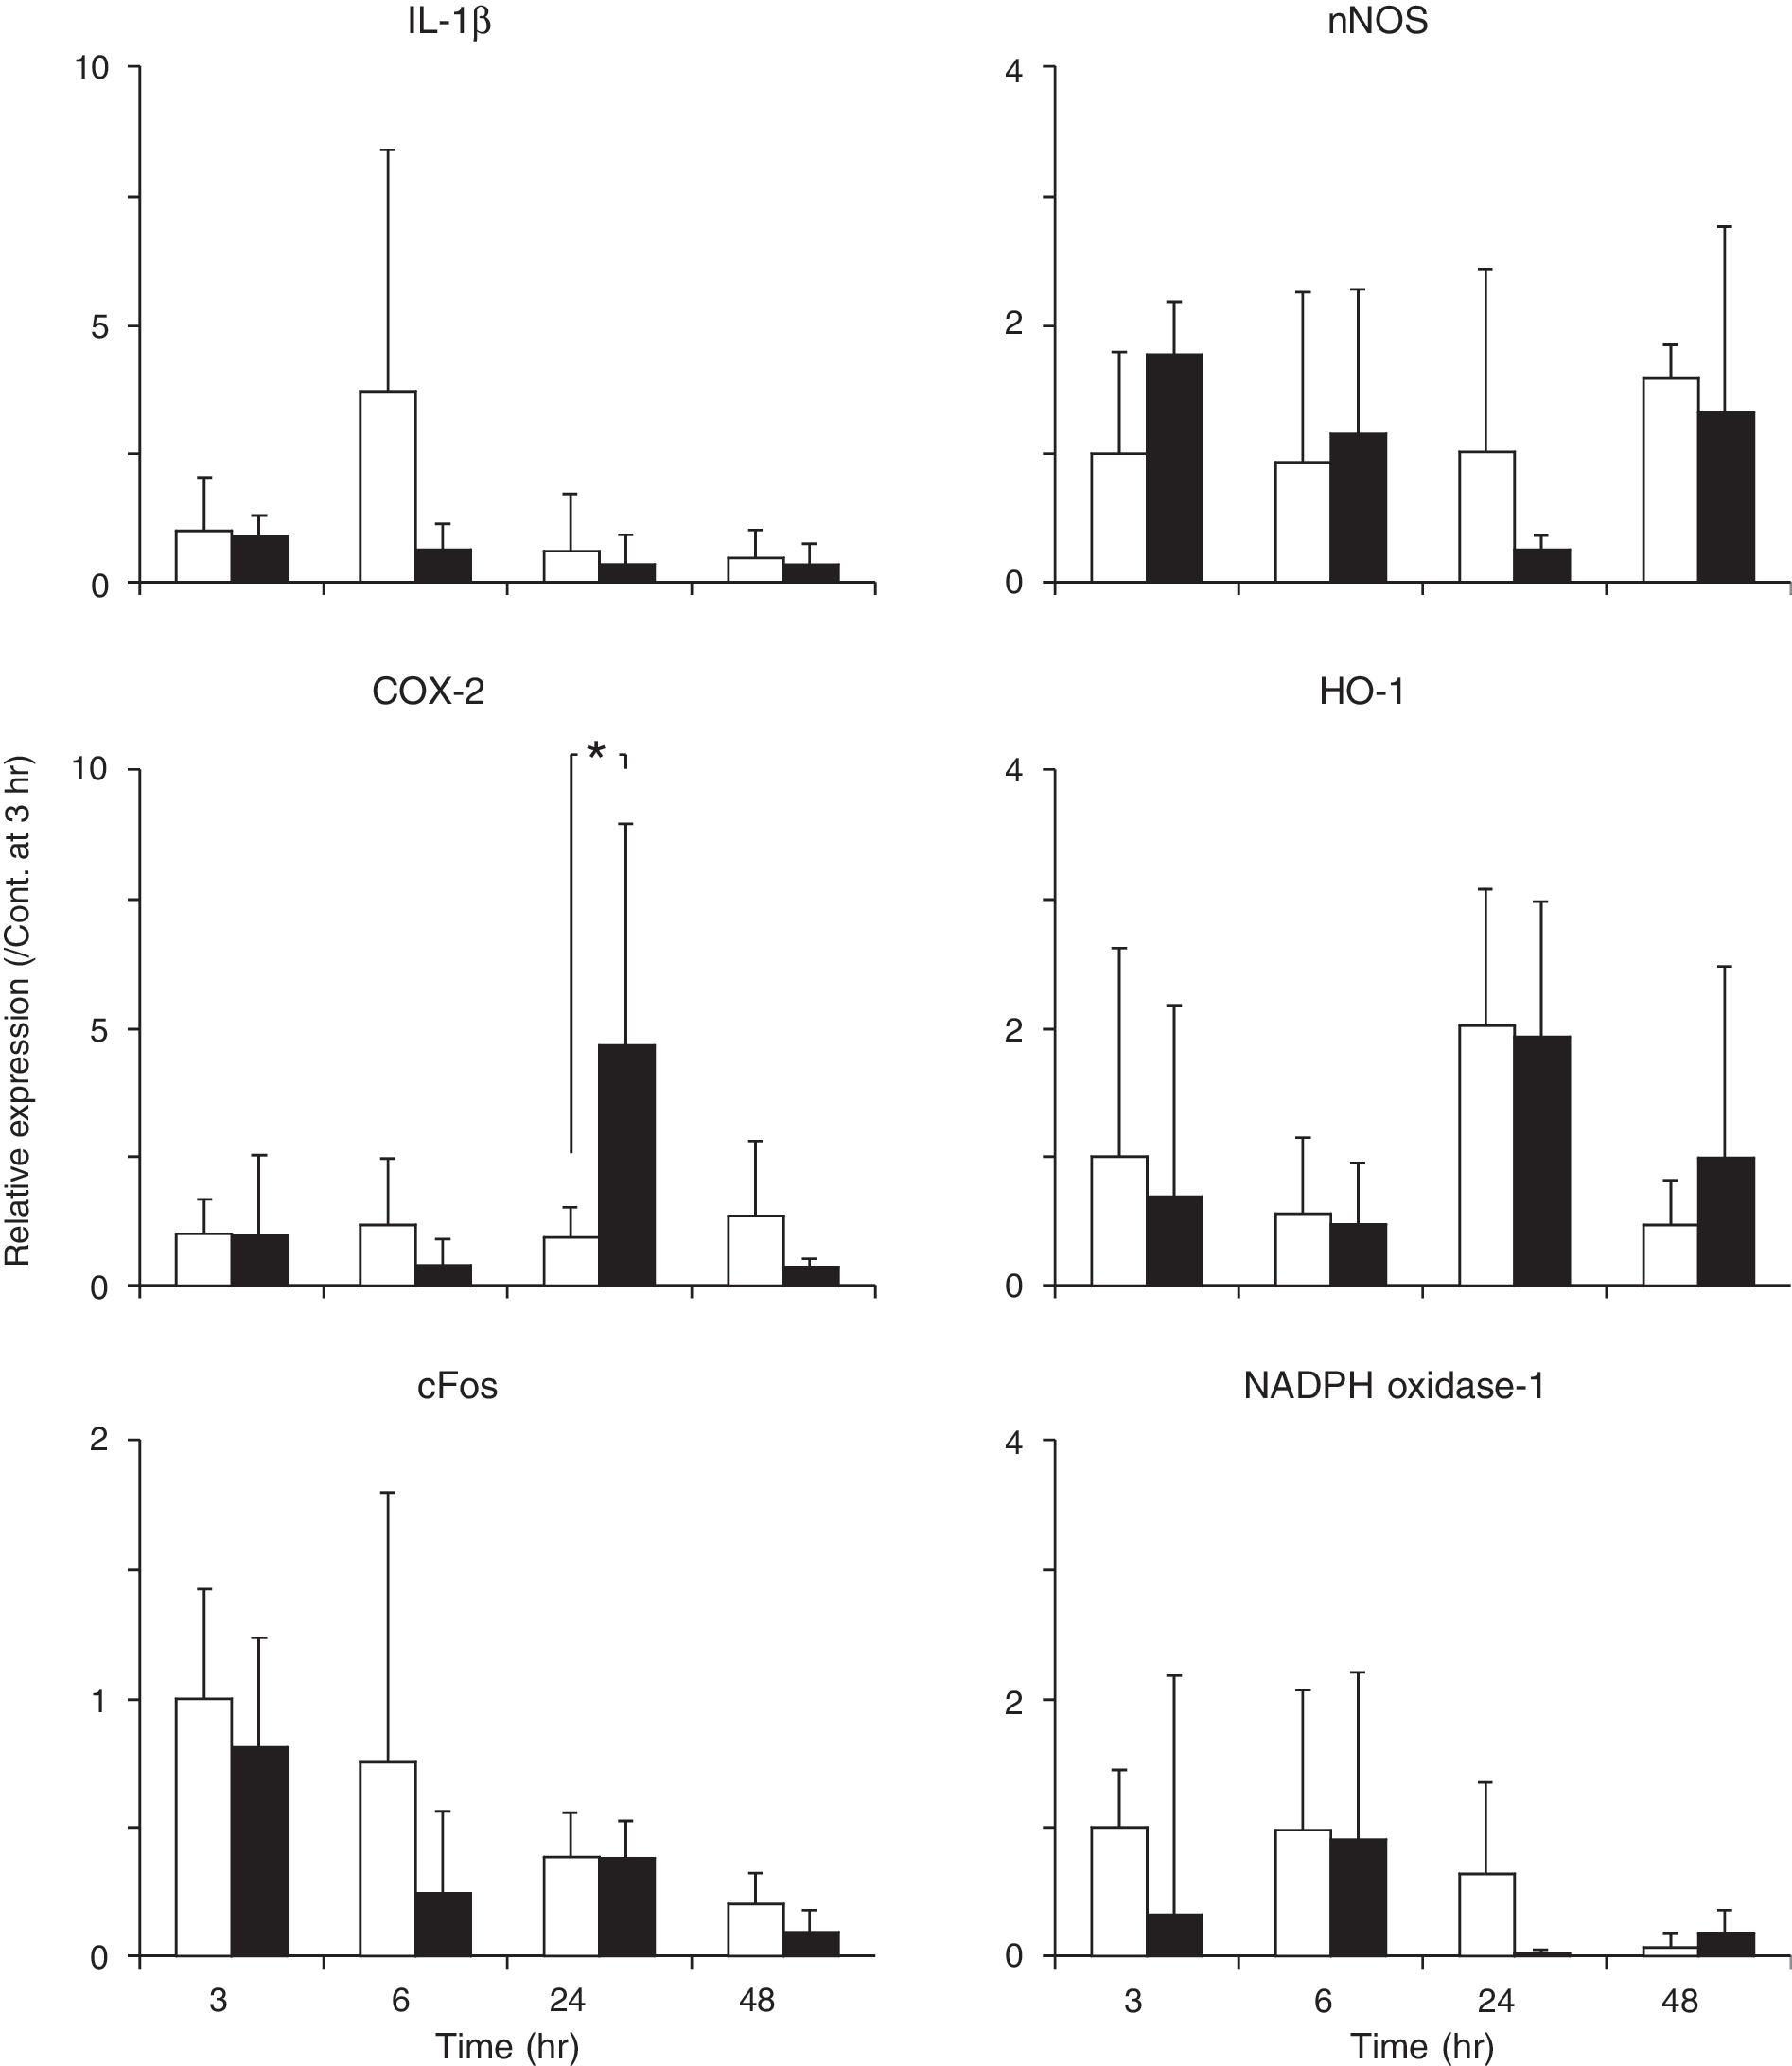
Expression of IL-1β, COX2, cFos, nNOS, HO-1, and NADPH oxidase-1 mRNA after TBI. mRNA levels were analyzed by quantitative real-time RT-PCR. cypA served as a control. Graphs show fluorescence levels relative to cypA levels. The data shown are means ± SD (n = 4 or 6). *p < 0.05. Open bars, control; solid bars, ethanol.
We also examined the TBI region for NF-κB or AP-1 activity by EMSA. Ethanol pretreatment decreased NF-κB activity at the 6 h time point after TBI but significantly increased it at the 48 h time point (Fig. 6A). Ethanol also significantly decreased AP-1 activity at the 6 h time point (Fig. 6B). These findings show that ethanol pretreatment depresses cell survival signaling pathways 6 h after TBI.
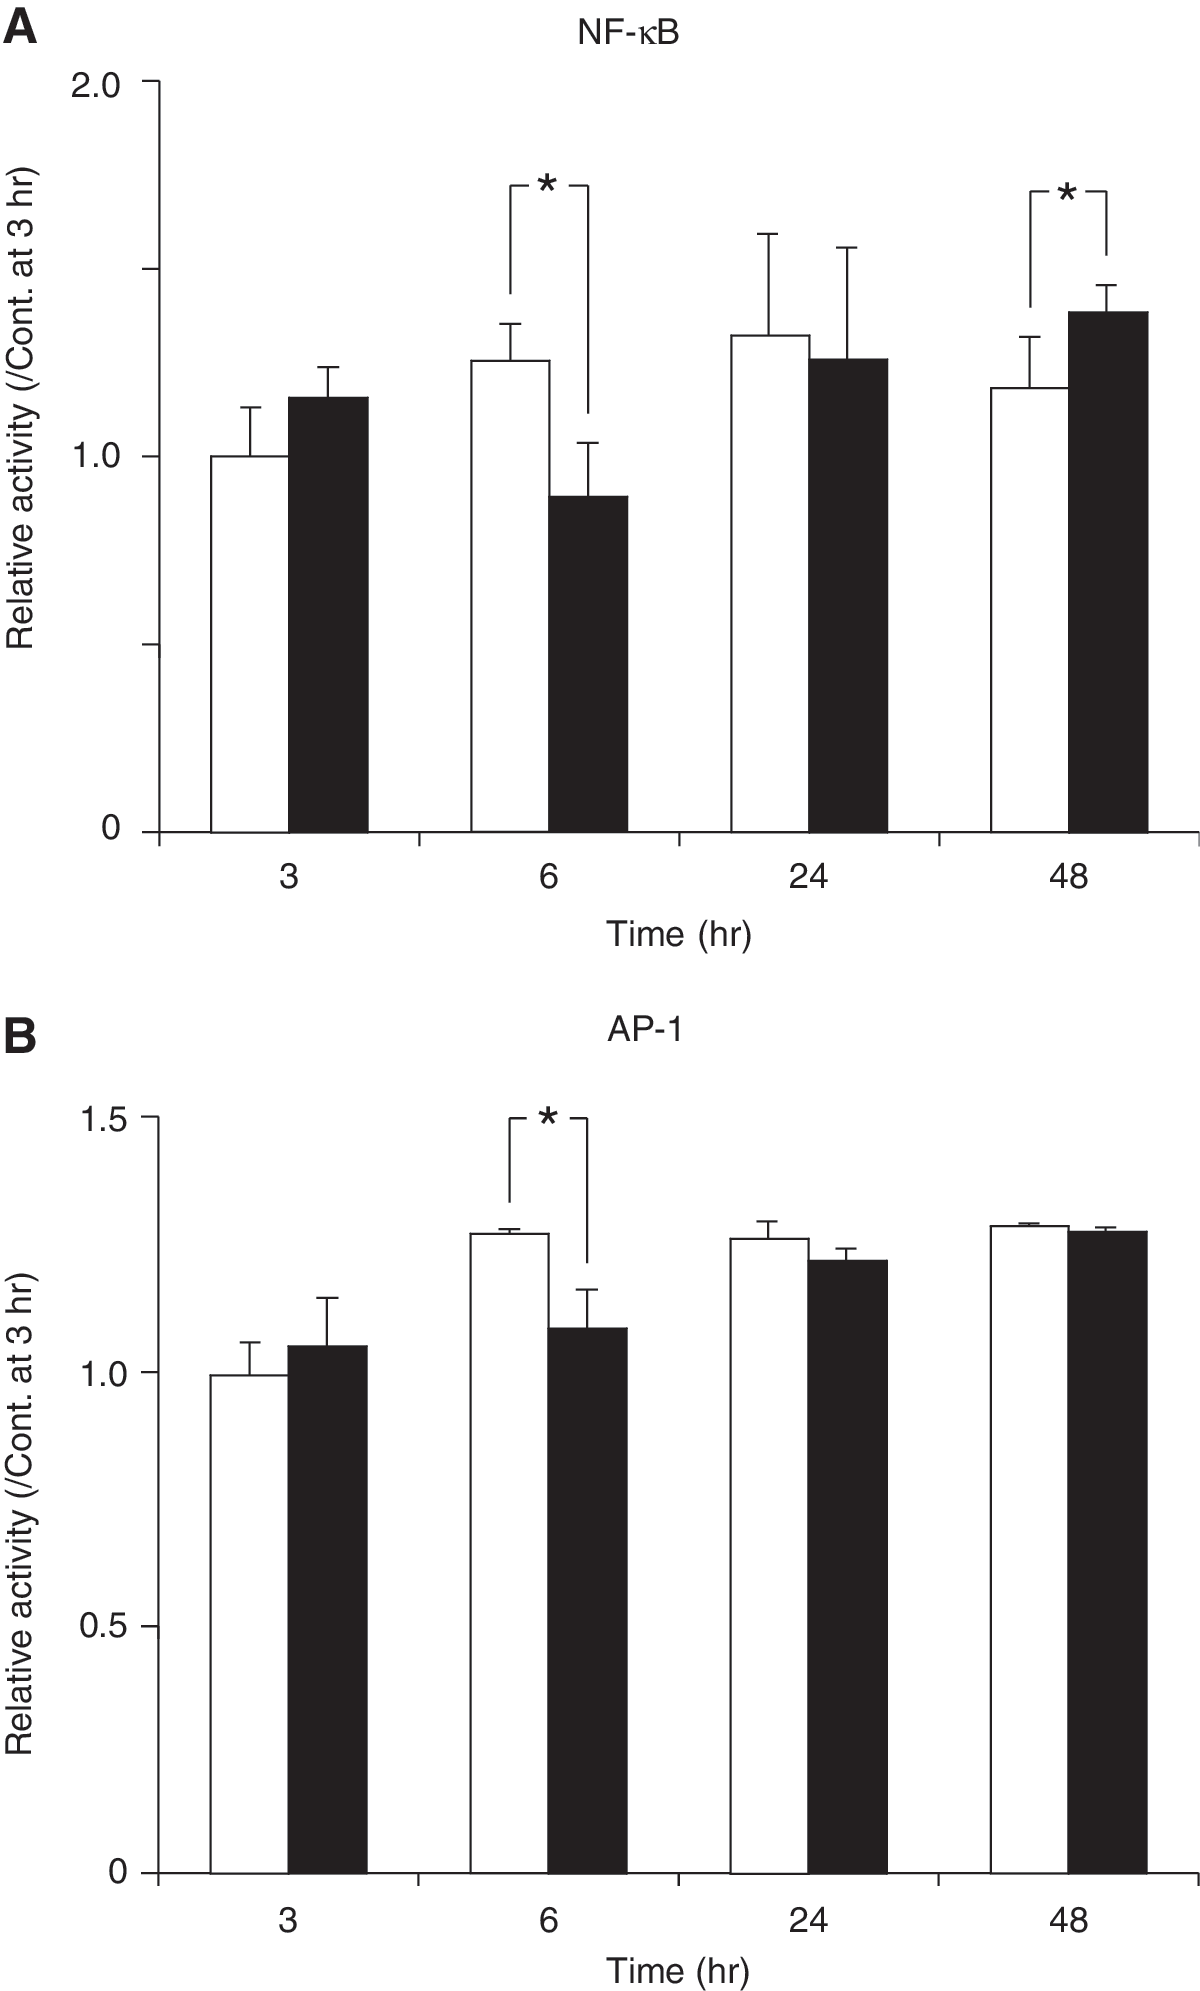
Relative NF-κB (
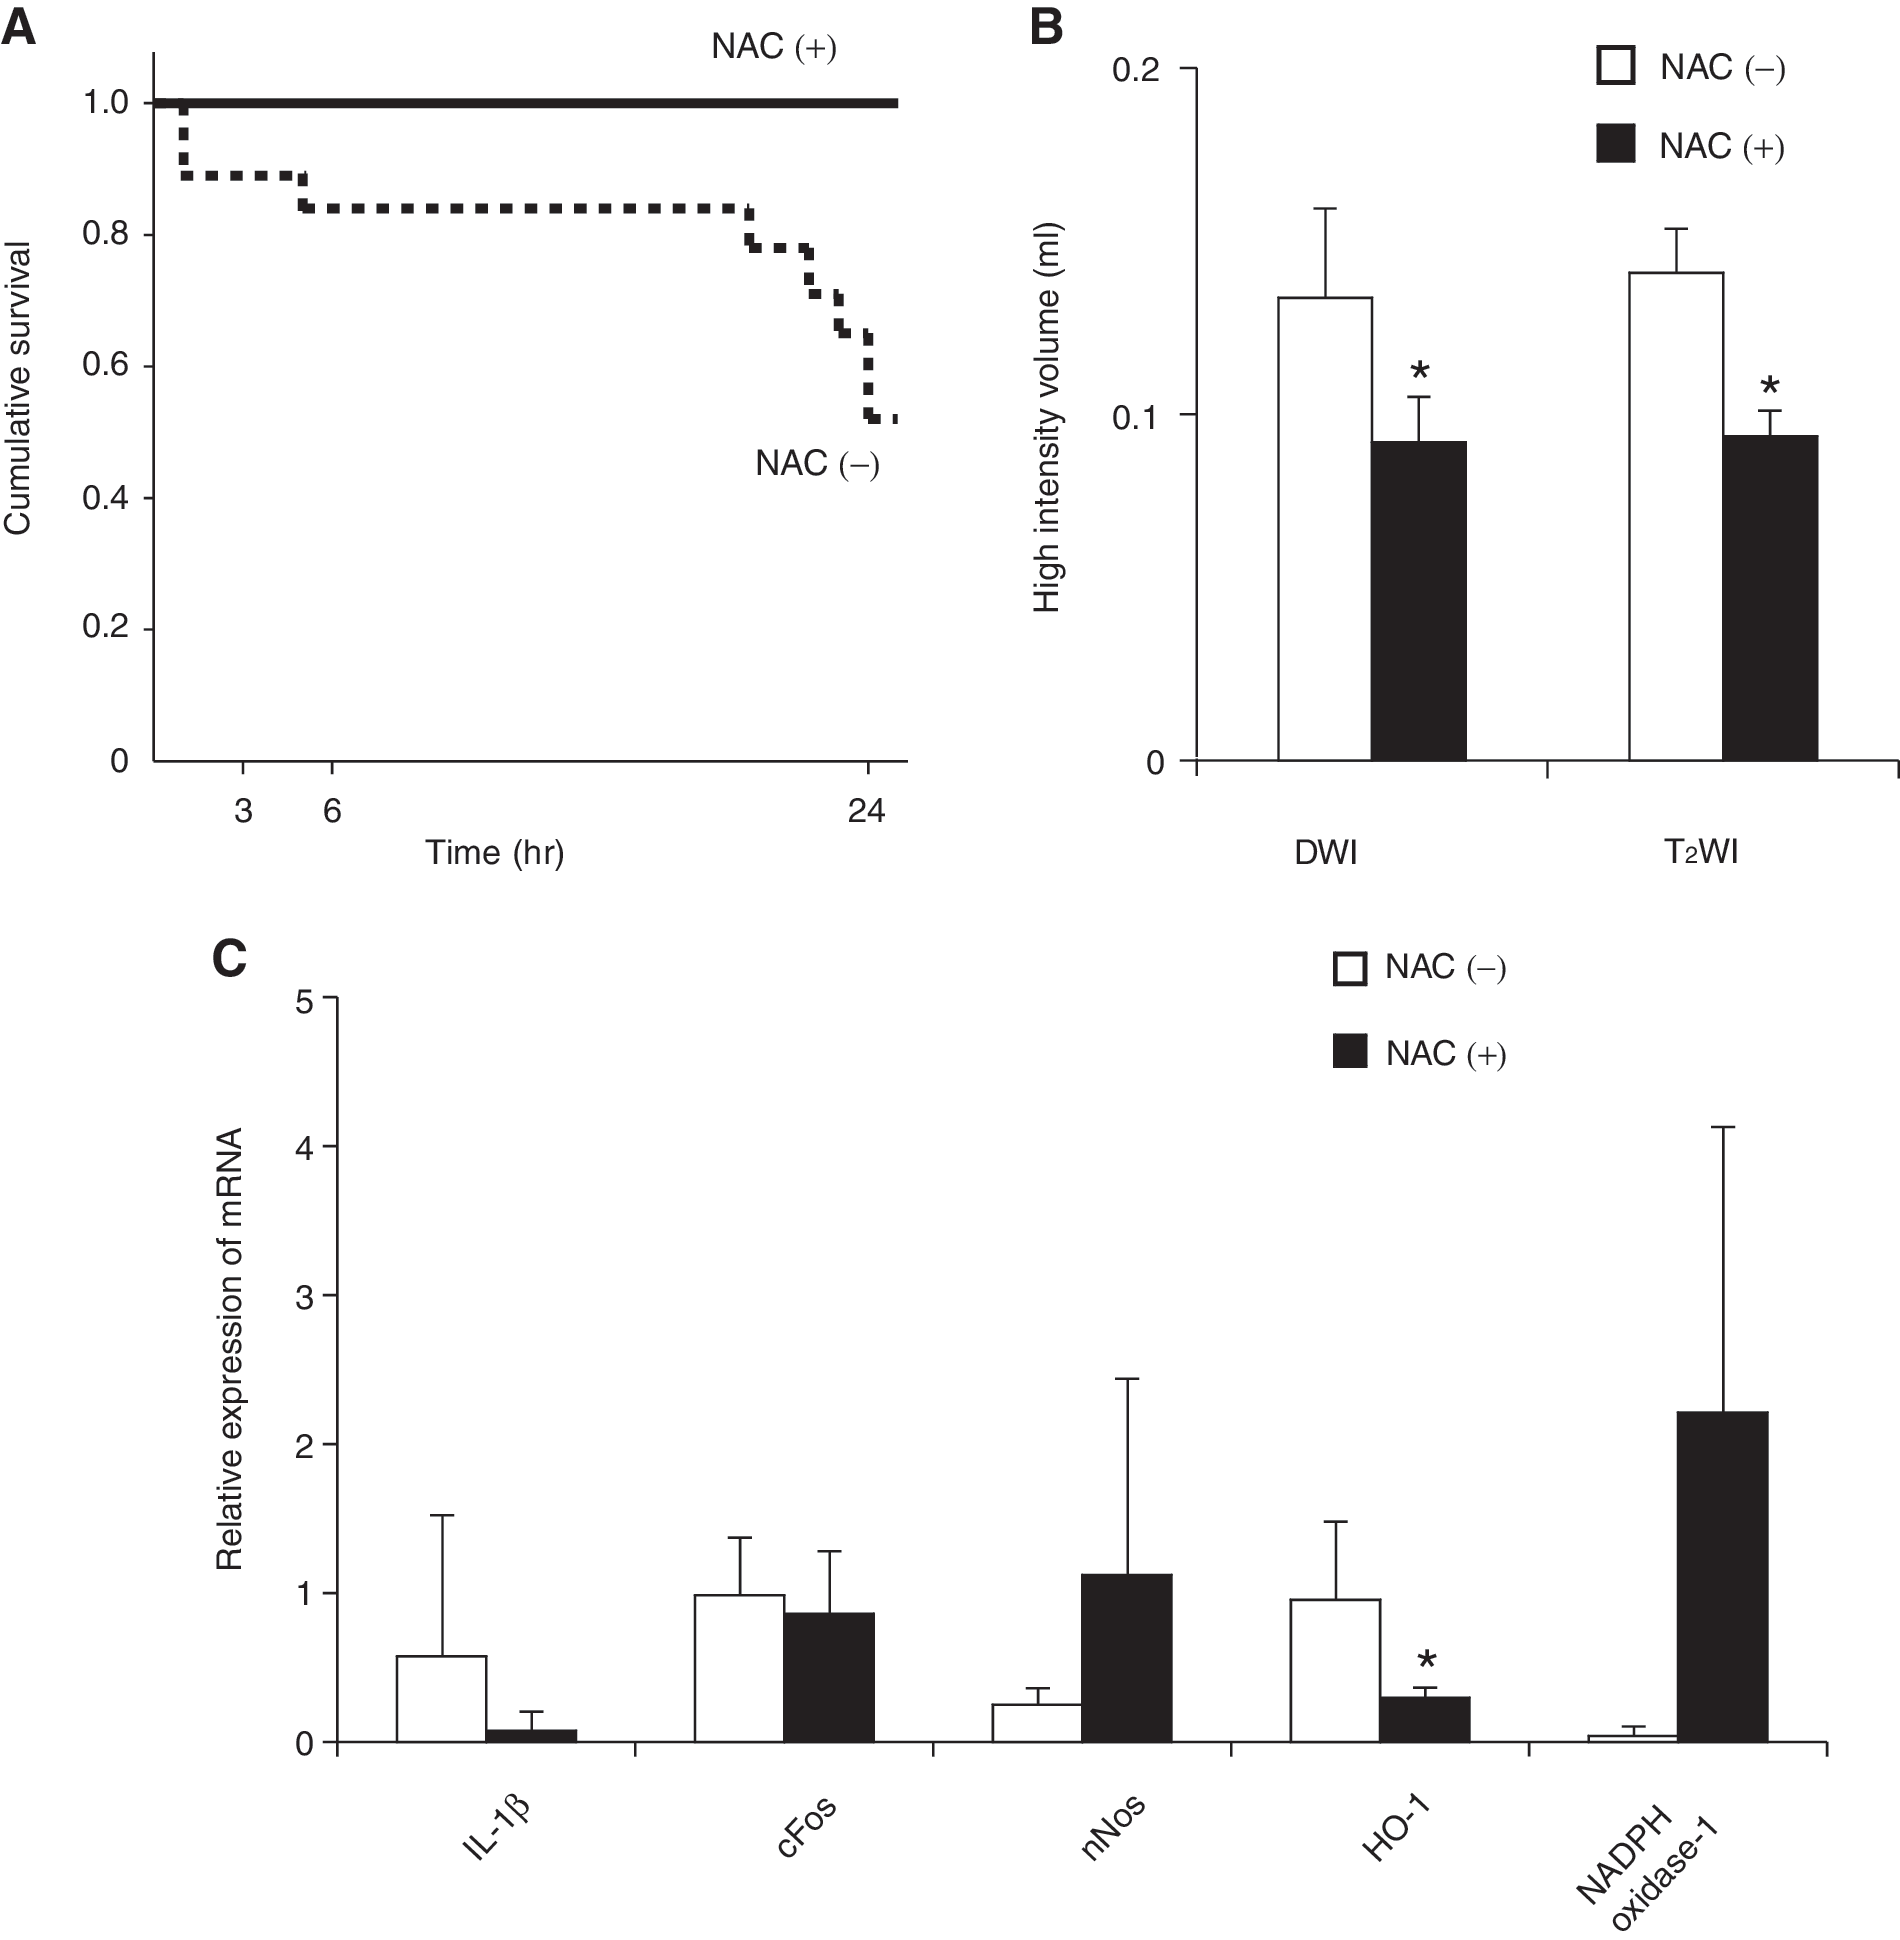
It has been well known that TBI induces oxidative stress. Thus we administered N-acetyl cysteine (150 mg/kg) to rats with or without pretreatment of EtOH. The survival of the animals over the following 24 h is shown in Figure 7A. Since all saline-pretreated animals survived regardless of whether they received NAC, the survival of these groups is not shown. Also shown in Figure 1 is that only 52% of the EtOH rats that did not receive NAC were still alive at the 24 h time point. However, when the ethanol-pretreated rats were given NAC, their survival rate rose to 100%. Figure 7B shows 24 h DWIs and T2WIs of the NAC-treated EtOH group compared to the NAC-untreated EtOH group. These images indicate that NAC treatment of the EtOH animals reduced the high intensity volume in DWIs and T2WIs—namely, it suppressed the enhancing effect of ethanol pretreatment on cytotoxic edema. Thus, NAC effectively inhibits the development of brain edema after brain contusion in the ethanol-pretreated animals. We also examined the mRNA expression of the inflammatory cytokines IL-1β, COX2, cFOS, nNOS, HO-1, and NADPH oxidase-1 in the EtOH/NAC+ and EtOH/NAC- groups 24 h after TBI. NAC treatment significantly decreased HO-1 mRNA expression in the EtOH animals but had no effect of the expression of the other cytokines (Fig. 7C). COX-2 mRNA expression was not detectable (data not shown).
(
Discussion
In the present study, we found that ethanol (EtOH) initially delayed and then subsequently enhanced brain edema after brain contusion, and that in the absence of TBI, ethanol consumption did not cause edema in the brain. MRI imaging showed that ethanol mainly influenced cytotoxic edema rather than vasogenic edema after TBI. Half of the EtOH-pretreated animals died within 24 h after TBI. Brain edema also peaked 24 h after brain contusion, as did the promoting effect of ethanol pretreatment on edema. Thus, it appears that the ethanol-pretreated animals died because of the aggravating effects of ethanol on brain edema.
It has been reported that ethanol promotes the swelling of cultured primary astroglia (Allansson et al., 2001; Aschner et al., 2001). It should be noted that we detected cell swelling in ethanol-pretreated animals after TBI. Moreover, the combination of hyponatremia and ethanol increases astrocyte volume (Aschner et al., 2001). TBI also induces excitotoxic damage, alterations in calcium homeostasis, free radical-induced damage, inflammation, and mitochondrial dysfunction (Enriquez et al., 2004). Various mediators are released, resulting in the occurrence of brain edema (Marmarou, 1994, 2003). Some of these mediators may be inflammatory cytokines, as these molecules are markedly increased in the cerebrospinal fluid of patients after brain injury (Shackford, 1997). Previous studies have demonstrated that ethanol pretreatment of rats attenuates the TBI-associated increase in IL-1β and TNFα levels in the injured cortex (Gottesfeld et al., 2002). However, we found that while ethanol pretreatment significantly increased COX-2 expression 24 h after TBI, it has no effect on the expression of other inflammatory cytokines. Thus, it appears that inflammatory cytokines do not play an important role in the augmenting effect of ethanol on brain edema after TBI.
TBI is known to induce NF-κB activation and elevate proinflammatory cytokine levels (Yang et al., 1995; Fan et al., 1996). A recent study has shown that systemic administration of LPS after TBI magnifies those molecular and cellular events (Hang et al., 2004). Moreover, the continuous overexpression of NF-κB, TNFα, IL-6, and ICAM-1 may exacerbate the secondary brain damage after brain injury (Nadeau and Rivest, 2000). In the present study, we found that NF-κB activity peaked 24 h after TBI in the control group, and that ethanol pretreatment initially suppressed NF-κB activity (at 6 h) but then promoted it (at 48 h). AP-1 was also decreased at 6 h after TBI and then recovered until 48 h. These findings indicate that ethanol inactivates cell survival signaling pathway early after TBI and this may lead to subsequent augmentation of brain edema and death.
A previous study has demonstrated that N-acetyl cysteine treatment after TBI rapidly repairs the low glutathionine levels in the brain and reduces oxidative stress (Xiong et al., 1999). Another study revealed that NAC treatment after TBI induced HO-1 protein (Yi and Hazell, 2005). Thus, NAC may prevent secondary neuronal damage and death after TBI by improving the antioxidant status of the brain tissue. It has long been recognized that ethanol consumption causes oxidative stress in the brain (Nordmann, 1987). In the present study, we found that HO-1 mRNA expression in ethanol-pretreated animals peaked 24 h after TBI and that this was significantly decreased by NAC treatment. These findings were consistent with the report made by Yi and Hazell (2005). MRI analysis also showed that NAC treatment significantly decreased the cytotoxic edema volume in ethanol-pretreated animals. These findings indicate that oxidative stress is strongly associated with TBI-induced brain edema, especially under ethanol consumption.
In conclusion, we found that prior ethanol consumption increases cytotoxic brain edema after traumatic brain injury by oxidative stress leading to death, and that post-treatment of N-acetyl cysteine reduces brain edema and oxidative stress.
Footnotes
Acknowledgment
This work was supported in part by Grants-in-Aid for Scientific Research from the Japan Society for the Promotion of Science.
Author Disclosure Statement
No competing financial conflicts exist.