




Abstract
The hemodynamic response (HDR) function is the basis for standard functional magnetic resonance imaging (fMRI) analysis. HDR is influenced by white matter inflammation. Traumatic brain injury (TBI) is frequently accompanied by diffuse white matter injury, but the effect of this on the HDR has not been investigated. The aims of the present study were to describe the HDR in visual cortex and examine its relationship with the microstructure of the optic radiation in severe TBI survivors and controls. Ten severe TBI survivors without visual impairments, but with known diffuse axonal injury, and 9 matched controls underwent diffusion tensor imaging (DTI) and fMRI. From the fMRI time series obtained during brief randomized visual stimuli, blood oxygenation level–dependent (BOLD) signal changes for each subject were estimated in V1, and group HDR curves were produced. Standard between-group analysis of BOLD activation in V1 + V2 was performed. For each individual the optic radiations were identified and fractional anisotropy (FA) plus mean apparent diffusion coefficient (ADCmean) values for these tracts were calculated. Group HDR curves from the visual cortex were fully transposable between TBI survivors and controls, despite a significant reduction in FA in the optic radiation in TBI survivors. A significant correlation between BOLD signal in the visual cortex and FA values in the optical tract was present in controls, but not in TBI survivors. Between-group comparisons showed that TBI survivors had increased areas of activation in V1 and V2. The HDR appears to be intact in traumatic white matter damage, supporting the validity of using standard fMRI methodology to study neuroplasticity in TBI.
Introduction
B
Methods
Subjects
Ten right-handed male severe TBI survivors aged 18–36 years were recruited from an outpatient rehabilitation follow-up group at the Department of Physical Medicine and Rehabilitation, St. Olav's Hospital, Trondheim, Norway. Time since injury was 4.4 ± 0.5 years. All had sustained a traumatic blow to the head and had an initial Glasgow Coma Scale (GCS) (Teasdale and Jennett, 1974) score below eight, indicating severe TBI. Only one was working, and the others were either undergoing vocational rehabilitation or receiving disability pension. All had mild to moderate cognitive deficits. All TBI survivors had normal visual acuity; one had previously undergone corrective surgery for hypometropia. Nine of the 10 TBI survivors had no visual field deficits for weak or strong stimuli for monocular and binocular vision as tested with Goldmann's perimetry. The tenth participant had a limited visual field defect in the lower quadrant in the left eye for weak stimuli (i.e., the smallest object [1/16 mm2] at 0 dB and at all intensities). But when stimulated with strong stimuli (i.e., a large object [64 mm2] at 0 dB and relative intensity of 1.00), and stimulated binocularly with the weak stimuli, no deficits were detectable. The visual fMRI paradigm used had large objects, and was presented binocularly.
All patients had white matter abnormalities and were diagnosed as having diffuse axonal injury by standard radiological methods based on fluid-attenuated inversion recovery (FLAIR), and T2-weighted MRI. None of the patients had FLAIR-detectable lesions in the optic radiation. For more details on TBI survivors see the articles by Xu and associates (2007) and Rasmussen and colleagues (2008). Nine right-handed age-matched, healthy male controls were recruited among the patients' friends and first siblings. None of the controls had a history of neurological disorders or current DSM-IV axis I diagnosis of psychiatric illness including substance abuse. None of the participants used psychopharmaceuticals. All controls had normal visual acuity and visual fields.
The study was approved by the Regional Committee for Medical Research Ethics at the Norwegian University for Science and Technology, Trondheim, Norway. All subjects gave their written informed consent.
Stimulation paradigm and image acquisition
Yellow letter “H”s in a checkerboard configuration on a black background covering the entire screen were flashed 42 times for 700 msec each, according to a jittered event-related design (Dale, 1999; Miezin et al., 2000). Interstimulus intervals were 5, 12.4, 13.8, 17.8, and 18.8 sec, and varied randomly. Visual stimuli were either single or double, and were presented in a random order. Twenty-six single visual stimuli lasting 0.70 sec, and 26 double visual stimuli, each lasting 0.70 sec at 5-sec intervals were presented.
Baseline was a yellow cross-hair on a black background. The subjects were instructed to press a response button (Nordic Neuro Lab, Bergen, Norway) each time the “H”s were presented. The paradigm was compiled in and response times were logged by E-prime software (Psychology Software Tools, Pittsburgh, PA).
Scanning was performed on a 3-Tesla Philips Intera scanner (Philips Medical, Best, the Netherlands) with a SENSitivity Encoding (SENSE) head-coil (InVivo, Gainesville, FL). First, a scout image with nine images in three orthogonal planes was obtained. Thereafter, a SENSE calibration scan was performed. T2-weighted BOLD images were acquired with a single-echo echo-planar imaging (EPI) pulse sequence (TR = 1500 msec; flip angle = 90°; TE = 35 msec; rectangular field of view =230 mm; slice thickness = 2.30 mm; 23 slices; acquisition matrix = 96 × 128 reconstructed to 128 × 128, giving a reconstructed voxel size of 1.80 × 1.80 × 2.30 mm3, and SENSE-reduction factor = 2.2 in a total of 352 volumes). The slices were transversally tilted to include the visual cortex. Each functional run was preceded by four dummy scans for magnetization stabilization that were discarded before analysis. Image acquisition and stimulus presentation was synchronized with a sync-box (Nordic Neuro Lab) that was set to trig on every 12th volume.
Diffusion tensor imaging was performed with the use of a single-shot spin-echo, echo-planar imaging sequence with 32 diffusion gradients applied along non-collinear directions. DTI scanning parameters were: field of view = 230 × 230; matrix size = 128 × 128; 55 contiguous axial slices with slice thickness = 1.72 mm, giving isotropic voxels of 5.6 mm3, TE = 50 msec; b-value = 800 sec/mm2; partial Fourier acquisition = 61.5%; and a SENSE reduction factor = 1.5. Cardiac triggering was applied with a trigger delay of 150 msec, giving a TR between 13 and 16 sec, this varying slightly between individuals with variations in heart rate (Skare and Andersson, 2001). For each slice, one image without diffusion gradient and 32 images with diffusion gradient were acquired. A high-resolution 3D magnetization prepared rapid gradient echo (MP-RAGE) T1-weighted image consisting of 182 contiguous slices of 1.2 mm thickness, with an in-plane resolution of 0.97 × 0.97 mm2 was acquired for anatomical reference.
Data analysis
Behavioral data such as response accuracy and mean ± SEM response times for the TBI and control groups, recorded by E-prime, were calculated and compared using a Student's t-test.
All fMRI analyses were performed with FSL 4.0 (Smith et al., 2004; FMRIB Software Library, Oxford, U.K.;
The planned contrasts were tested for significance with a cluster-wise threshold of z > 2.3 and p < 0.05 (corrected for multiple comparisons). A region of interest (ROI) of the visual cortex was constructed using standard atlas tools, and the feat query functionality was used to obtain mean parameter estimates of neuronal activation from the ROI. Parameter estimates (or beta values) are estimates of how strongly an explanatory variable fits the data at each voxel, an explanatory variable being an effect included in the general linear model, in this case the visual stimuli (
Estimation of hemodynamic response functions
ROIs encompassing the primary visual cortex were obtained by co-registering the standard space Brodmann area 17 ROI from the Juelich Histological Atlas (available with the FSL package) to each subject's structural image. Co-registrations were performed using FLIRT (FSL package). Filtered fMRI time courses (obtained as described in the data analysis section above) were averaged across ROI voxels, interpolated at time points spaced TR/10 sec, and then divided into segments comprising the period from 5 sec prior to each stimulus onset to 20 sec after it. These segments were inspected and a few cases showing abnormally large signal changes were discarded (2, 2, and 6 segments were discarded for three TBI subjects, and 3 segments were discarded for one control subject). Although TBI patients are well known to show both greater behavioral variability and variability in signal change, the discarded segments showed abrupt variations that could only be attributed to strong motion artifacts. The entire signal time series was deconvolved with the stimulus time series using a least-squares scheme (Lu et al., 2006), including in the regression matrix the motion regressors to account for residual movement effects, and a second-order polynomial to account for drift. A gamma model (Cohen, 1997):
was fitted to the deconvolved hemodynamic response function, and a set of parameters was calculated from them: amplitude, time-to-peak, rise rate (height/time-to-peak), width, and area under the curve. Figure 1 shows a graphical depiction of these parameters.
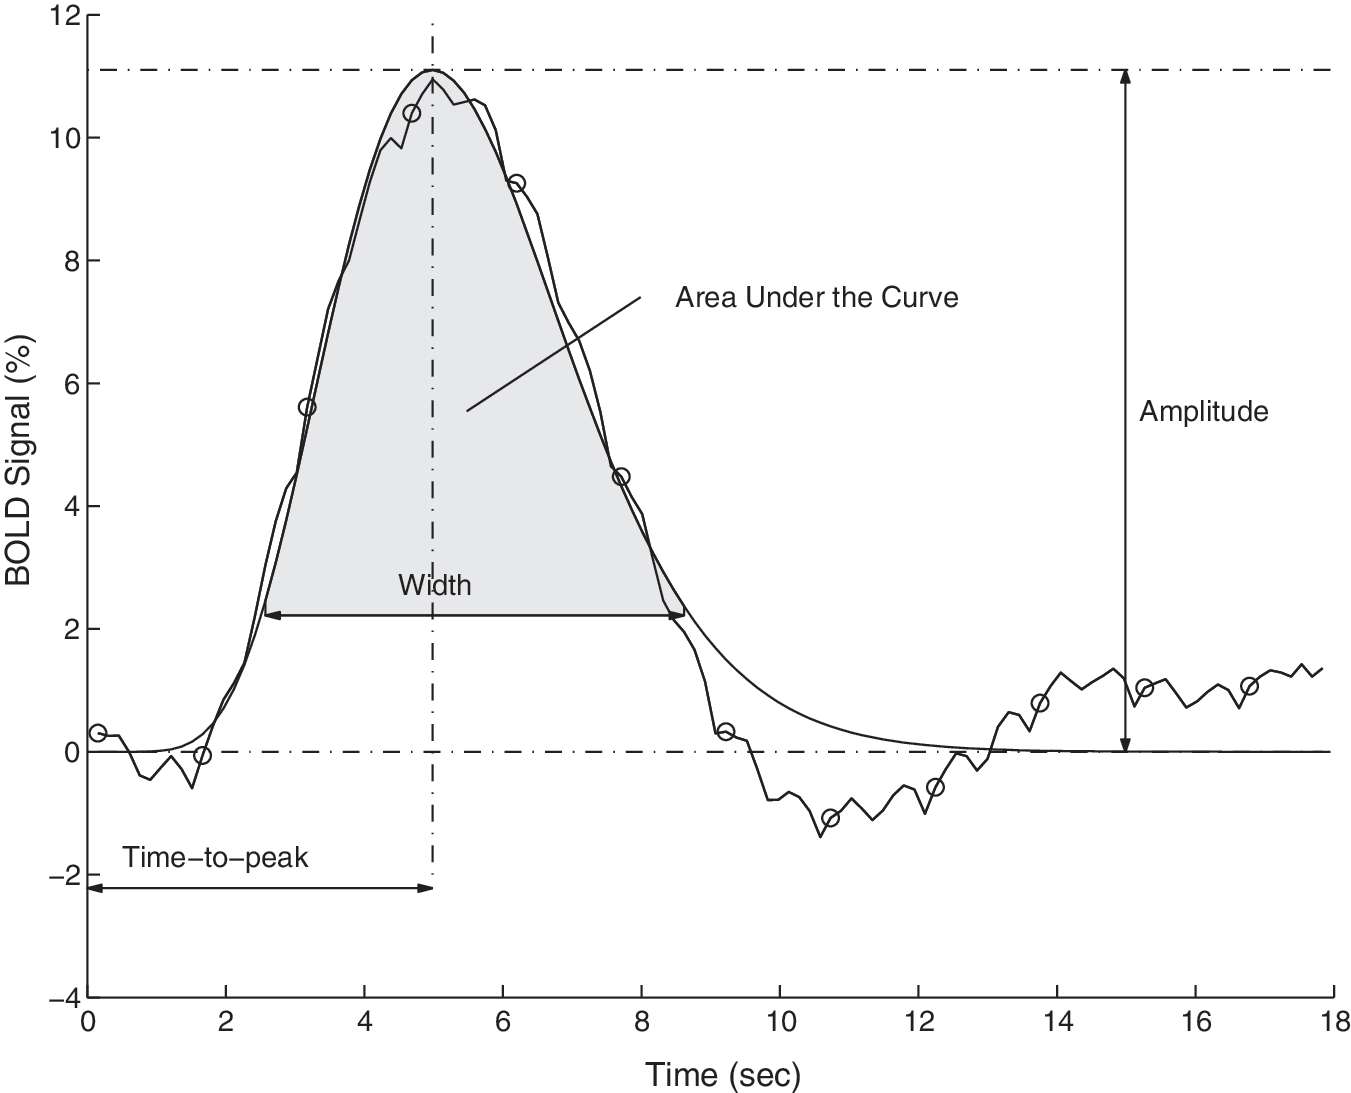
Diagram illustrating the deconvolved hemodynamic response function (HRF) curve (computed from 36 HRFs), and the fitted gamma model. The circles indicate the time resolution of the measured signal. Four parameters, calculated from each fitted curve, are depicted in the diagram: Amplitude, Time-to-peak, Width, and Area Under the Curve. The parameter width was defined as the width of the curve at the level of 20% of the amplitude (BOLD, blood oxygenation level–dependent).
Finally, a Wilcoxon rank-sum test was performed for the between-group statistical comparison of the parameter estimates. These analyses were performed in MATLAB (The MathWorks, Natick, MA).
Diffusion tensor imaging
The diffusion tensor images were corrected for head motion and eddy currents using FLIRT (Functional Software Library, FMRIB Analysis Group, Oxford, U.K.) with b = 0 as reference. Brain masks were created from b = 0 images using the Brain Extraction Tool (BET) in FSL to exclude voxels outside the brain. Thereafter, all sets were manually fine-segmented using MRIcro software (Rorden and Brett, 2000) to provide accurate isolation of brain voxels. FA and ADCmean were calculated at each voxel from the diffusion-weighted images (Basser et al., 1994) using DTIStudio software [Laboratory of Brain Anatomical MRI, Johns Hopkins Medical Institute, Baltimore, MD (Jiang et al., 2006)].
Segmentation of the optic radiation was performed for all subjects using DTIStudio software, based on the fiber assignment by continuous tracking (FACT) algorithm (Mori et al., 1999). Termination criteria were set to FA < 0.15, or the main diffusion directions in consecutive steps differed by more than 30 degrees. It was successful in all eight healthy controls that underwent DTI imaging (unfortunately, DTI images were lost for one control subject due to technical reasons), and 8 of 10 TBI survivors. The initial seed points for tracking of the optic radiation were placed on color-coded FA maps. First, the coronal slice containing the most posterior part of the corpus callosum seen on a mid-sagittal slice was located. Second, a seed point covering the entire coronal slice was placed. Third, rough tractograms were manually fine-tuned by removing contaminating axonal projections belonging to corpus callosum, fronto-occipital fasciculus, and other aberrants. The final resulting tractograms were investigated visually for shape, thickness, and extension.
The analyses of FA and ADCmean values were limited to the optic radiations by using the tractograms as binary masks. For ADCmean, voxels with values ranging from 0.0005–0.0015 mm2sec–1 were distributed into 20 bins, each 0.00005 mm2sec–1 in width. For FA, voxels with values ranging from 0.01– 1.0 were also distributed into 20 bins, each 0.05 in width. The number of voxels in each bin was normalized to the percentage of total voxels in all bins for the respective FA and ADCmean results. The normalized data were analyzed using Student's t-test and the results were plotted. In addition, regression analyses between FA values and mean PE from the ROI analyses were performed. Mean PE of BOLD signal beta value in the visual cortex ROI were derived from the feat query, as described in the data analysis section above. Regression analyses of ADCmean and mean PE and of FA values and ADCmean were also performed.
Results
Behavioral data
Unless otherwise stated data are presented as mean ± SEM. TBI survivors demonstrated a significantly longer response time to the visual stimuli (427 ± 6 msec) than control subjects (394 ± 4 msec, p < 0.0001 by Student's t-test; Fig. 2). In addition, the TBI group responded to 76 ± 9.5 % of the visual stimuli presented, compared to 92 ± 3.9 % in the control group. However, this difference was not significant (p = 0.14 by Student's t-test). There was no significant difference in overall subject head motion during scanning between the TBI and control groups (p = 0.56 by Student's t-test).
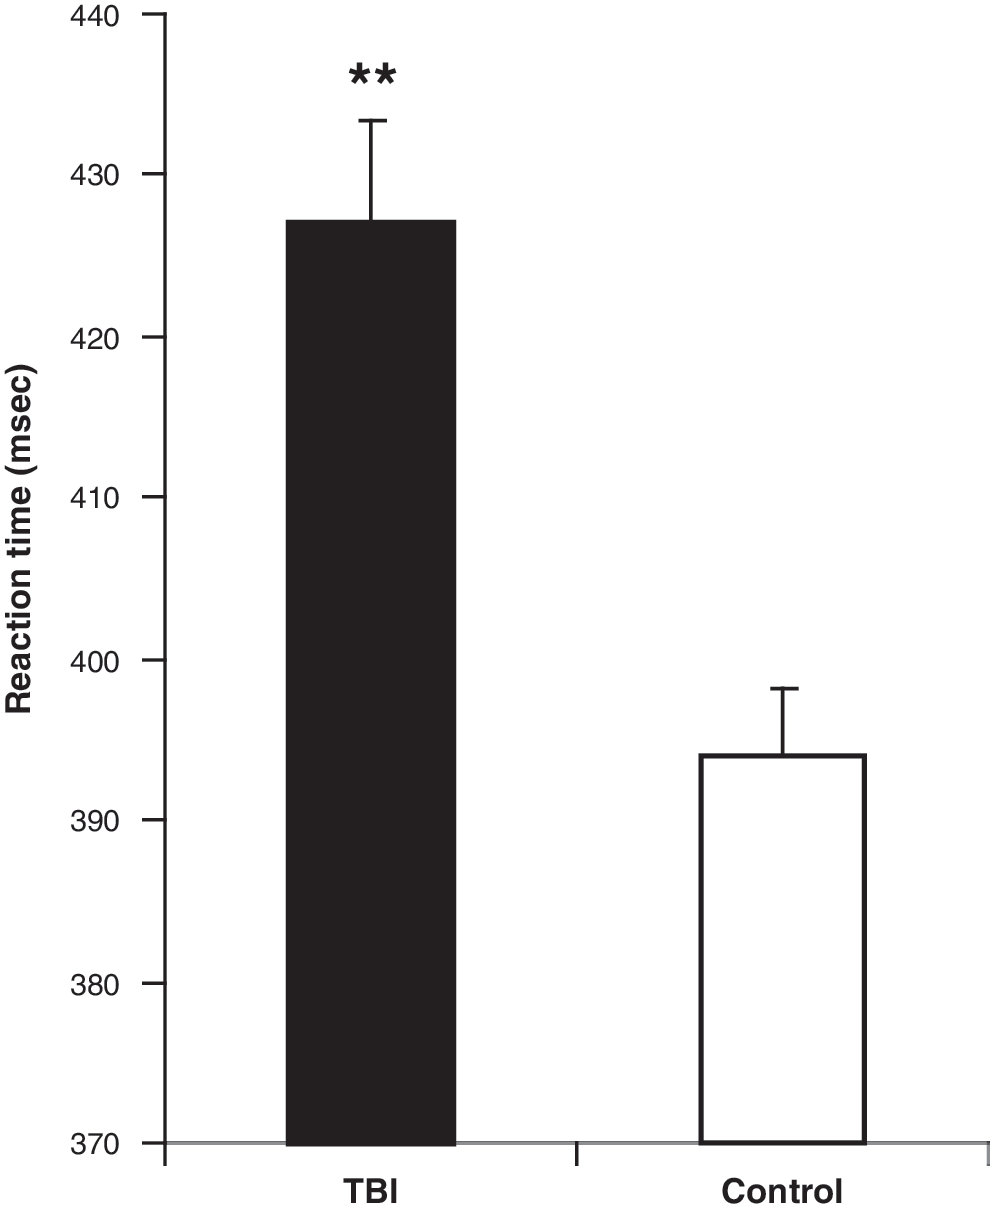
Reaction time to visual stimuli by the TBI group (mean ± SEM; N = 321, n = 10), and the control group (N = 309, n = 9; **p = 0.000015 by Student's t-test; SEM, standard error of the mean; TBI, traumatic brain injury).
Comparison of hemodynamic responses
HDR curves for the TBI and control groups were fully transposable. The amplitude, time-to-peak, rise rate (height/time-to-peak), width, and area under the curve from the hemodynamic response function, were almost identical in the two groups (Fig. 3). There were no statistically significant differences between the TBI and control groups for any of the parameters tested, and the p values for the Wilcoxon rank sum test were as follows for the single-stimulus testing: amplitude p = 0.6607; time-to-peak p = 0.3891; rise rate p = 0.3562; width p = 0.9682; area under the curve p = 0.9048.
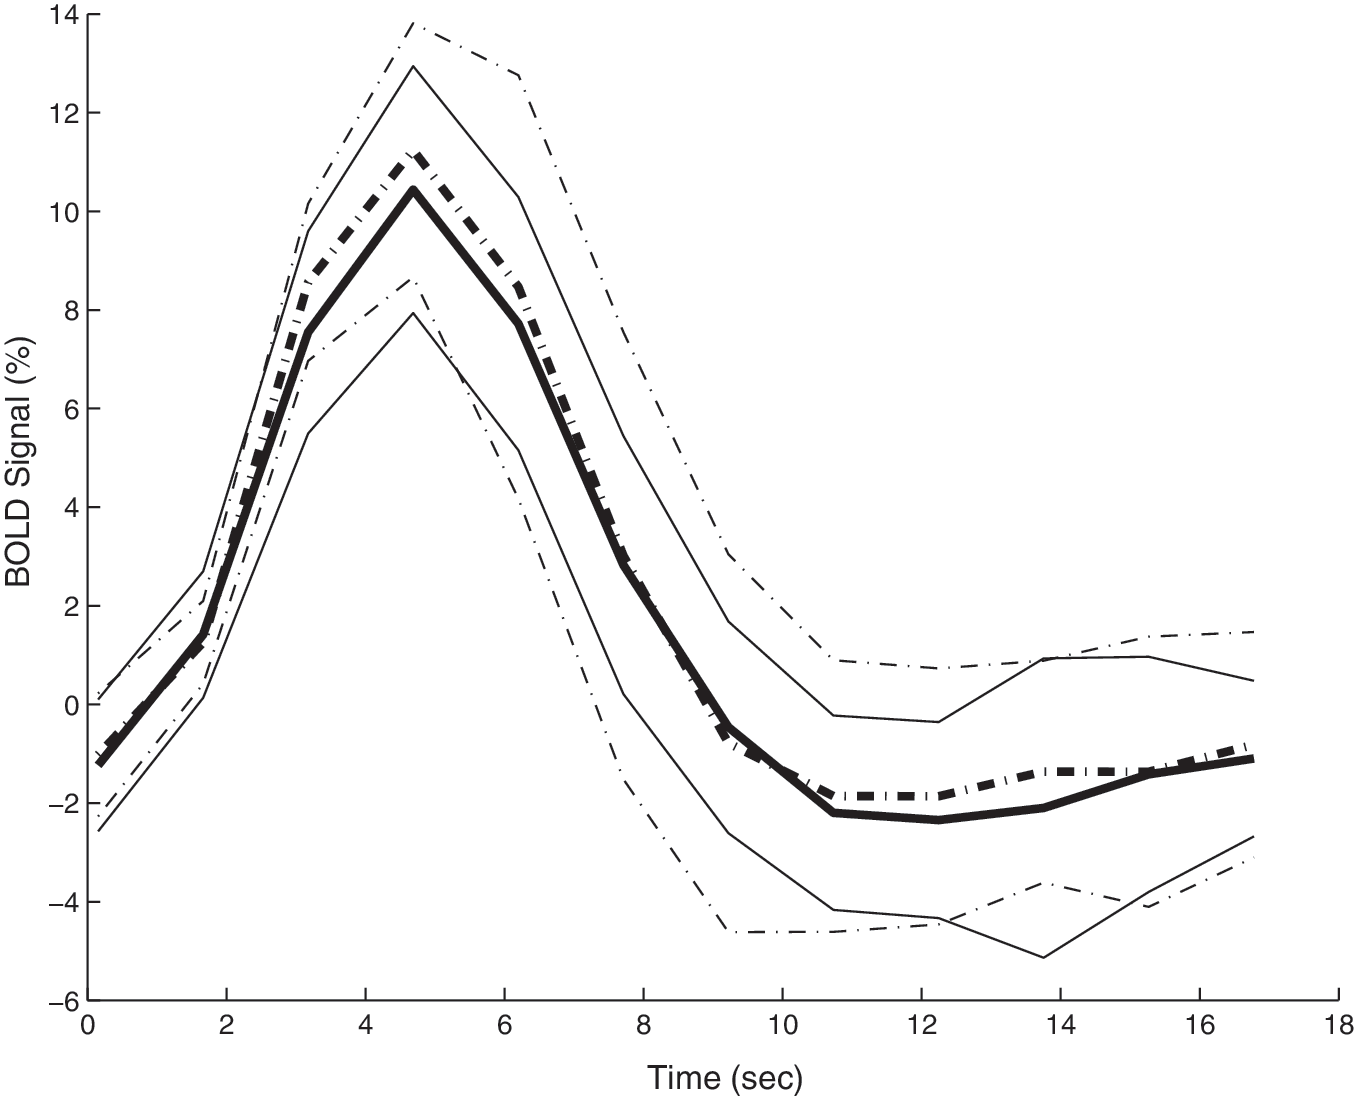
Comparison of group hemodynamic response (HDR) curves. Shown are the average (bold line) and standard deviation of all the single-stimulus normalized time courses of the TBI group (solid lines) and the control group (dashed lines; BOLD, blood oxygenation level–dependent).
Functional magnetic resonance imaging activation
Group comparison showed that the TBI patients had greater activation in the visual cortex ROI encompassing V1 and V2 during visual stimulation than control subjects (Fig. 4).

Group statistical map of stimulus-related activation in regions of interest (ROI) encompassing V1 and V2. Colored areas indicate clusters with increased activation in TBI survivors compared to control subjects (contrast: TBI > control). Activations are overlaid onto a standard Montreal Neurological Institute (MNI) template, with conventional orientation and presented as follows from left to right: sagittal, coronal, and axial brain images. The planes from stereotaxic space are indicated above the corresponding sections. The color bar indicates the z-score of individual voxels. All clusters are significant at p < 0.05, corrected for multiple comparisons (TBI, traumatic brain injury).
Diffusion tensor imaging
In the optic radiation FA values were significantly decreased in the TBI group (0.45 ± 0.018) compared to the control group (0.49 ± 0.013; p = 0.01 by Student's t-test). ADCmean values were increased in the TBI group (0.0019 ± 0.001 mm2sec–1) compared to the control group (0.00084 ± 0.00001 mm2sec–1), but not significantly (p = 0.337; Fig. 5). No correlation was found between FA value and mean reaction time for either the TBI or control group (by regression analysis).

Differential tractography from the optic radiation of TBI patients and healthy controls (n = 8/group). Group curves show the average proportion of the total volume of voxels in each increment of (
Blood oxygenation level–dependent signal versus fractional anisotropy
In control subjects there was a significant correlation between mean parameter estimates (mean PE) of BOLD signal beta value in the visual cortex ROI, and FA values in the optic radiation (r 2 = 0.52, p = 0.04), whereas TBI patients showed no such correlation (r 2 = 0.29, p = 0.16; Fig. 6). There was no significant correlation between ADCmean and FA values, or between ADCmean and mean PE for either group. There was also no correlation between FA and size of the area of activation for either group. No correlation was found between mean PE and either reaction time or accuracy for either group.
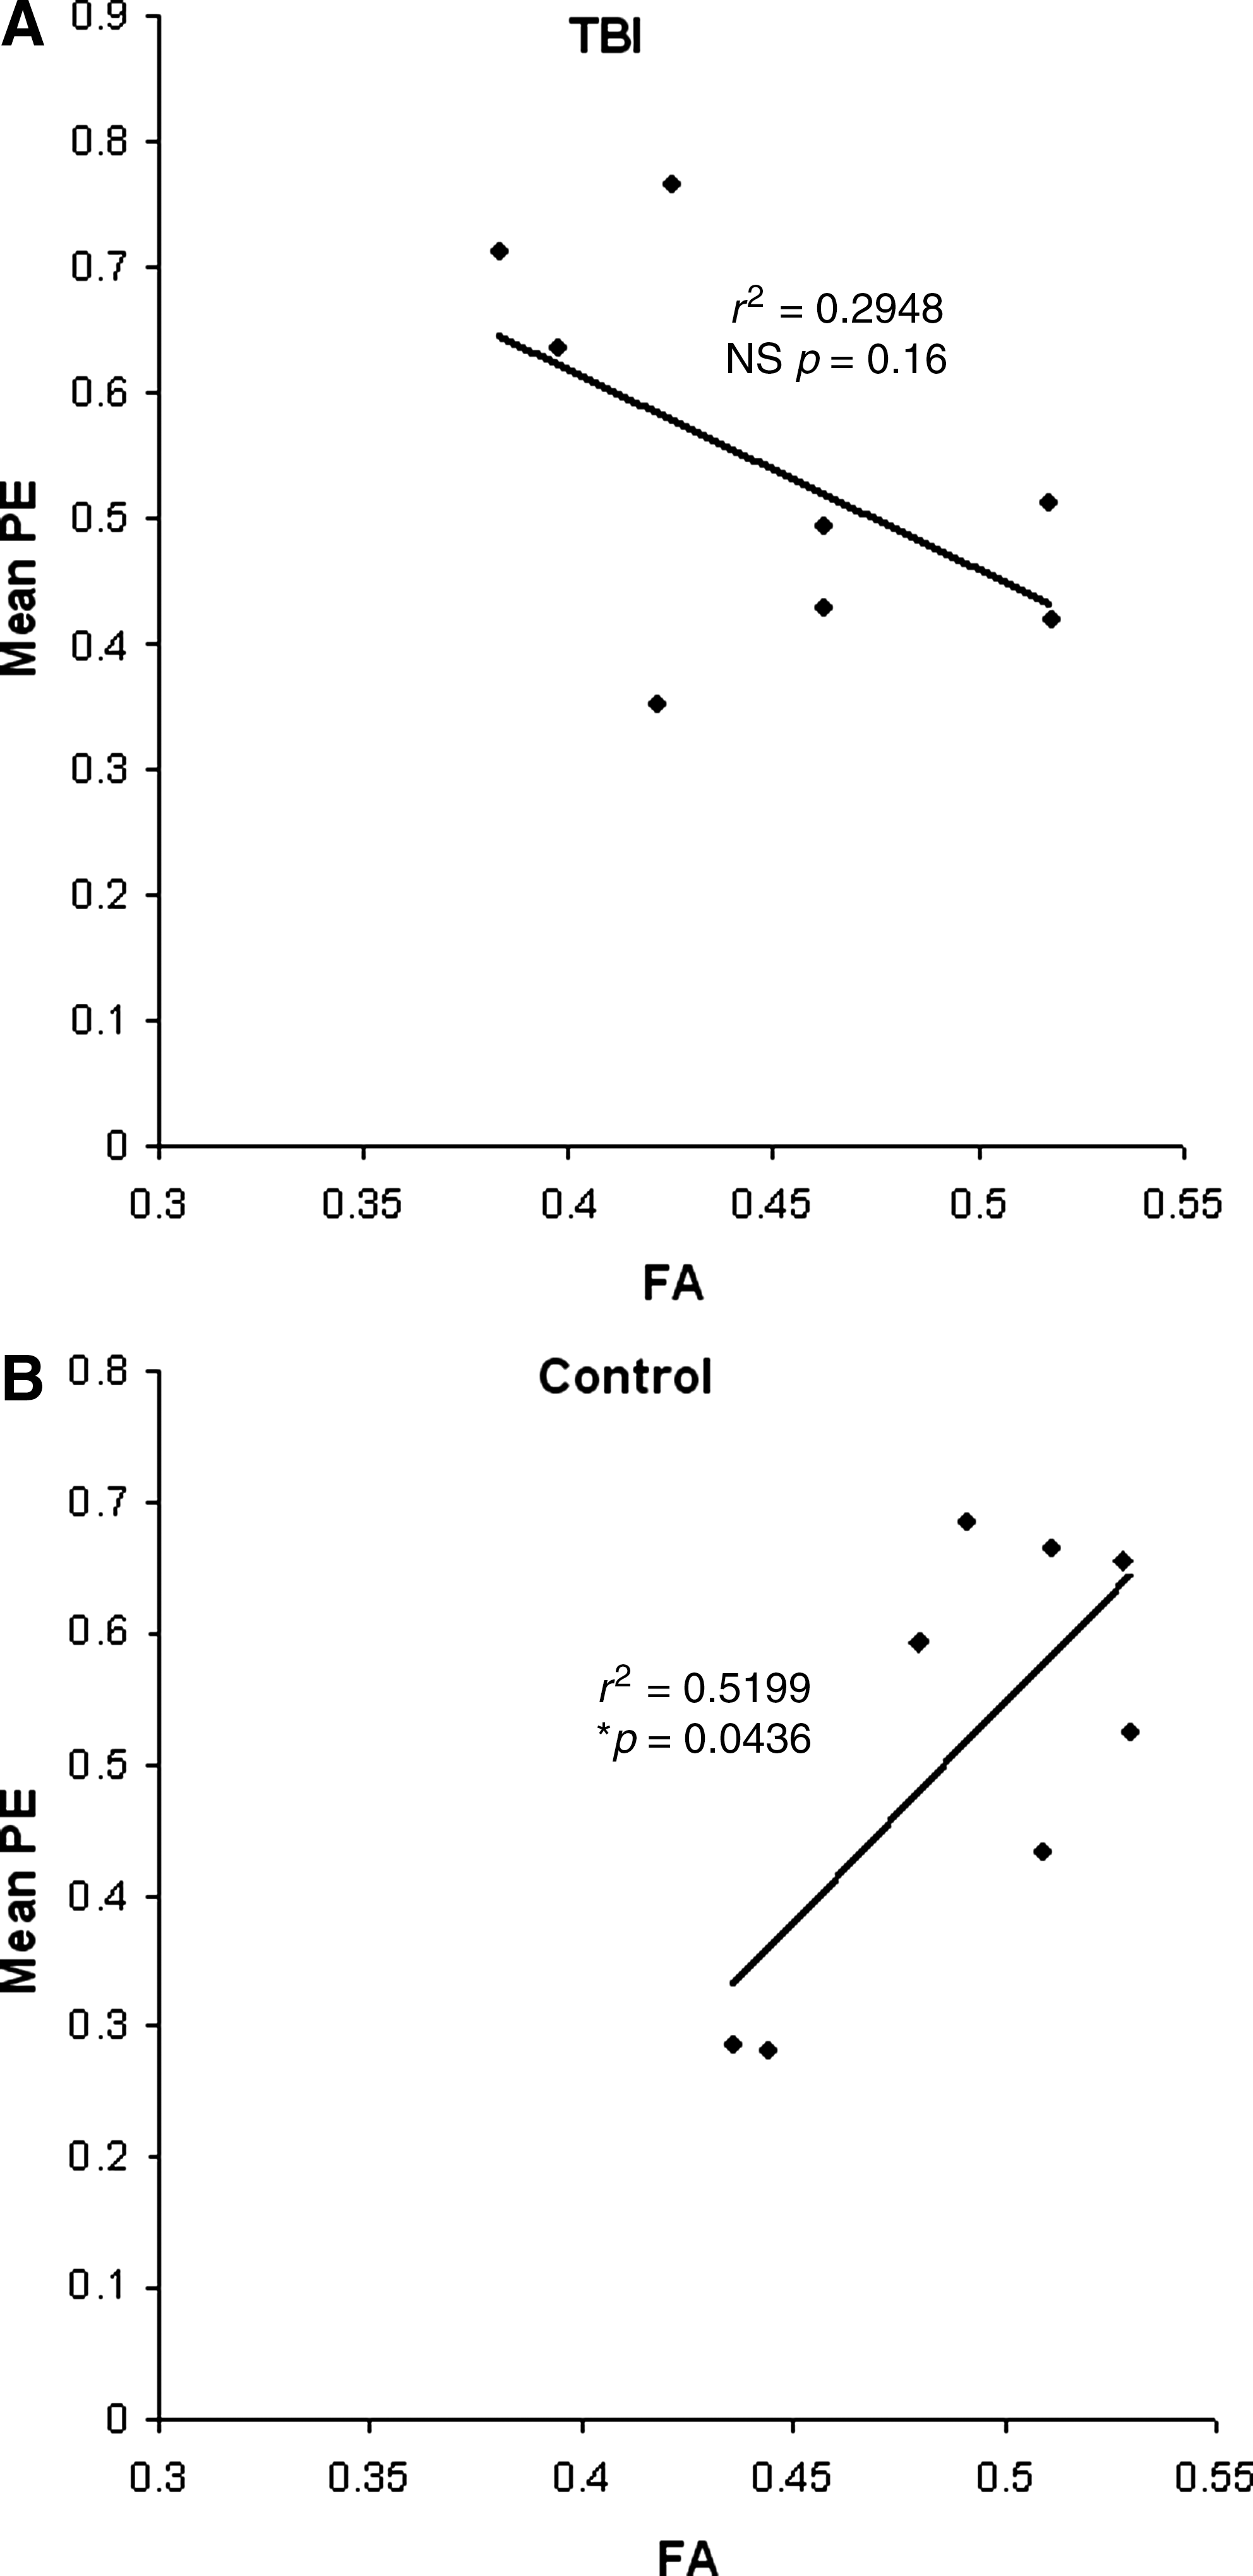
Regression analyses of the mean parameter estimates (PE), a measure of neuronal activation, from the visual cortex region-of-interest analysis (V1 and V2), and the fractional anisotropy (FA) values for each subject in the control (
Discussion
Compared to control subjects, TBI survivors demonstrated prolonged response time and increased area of activation in the visual cortex following brief visual stimulation. In addition to reduced FA in the optic radiation, an altered relationship between FA and BOLD signal parameter estimates was shown in TBI survivors. However, the HDR appears to be intact in the face of significant white matter damage and resulting FA reduction. The HDR is used, in the context of all BOLD fMRI studies, to make inferences about neuronal activity. The results of this study support the validity of using standard fMRI methodology to infer neuronal activity in severe TBI with widespread white matter changes.
Diffuse axonal injury affects both unmyelinated and large myelinated axons (Povlishock and Katz, 2005; Rodriguez-Paez et al., 2005). As speed of neurotransmission depends on axonal diameter and the thickness of the myelin sheet (Waxman, 1980), diffuse axonal injury will have particular impact on fast signal transmission. This is reflected as increased latency in evoked responses to simple visual stimulation (Lew et al., 2004; Sarno et al., 2000) in severe chronic TBI survivors. However, distorted white matter microstructure in the optic radiation as measured using DTI did not give rise to altered latency, peak, or duration of the HDR in the TBI group.
In fMRI the HDR is used as an indirect measure of neuronal activity. The HDR has very limited temporal resolution compared to methods that measure neuronal electrical activity directly, such as EEG-based techniques and magnetoencephalography. Also, the effect of the HDR is equivalent to that of a low-pass filter, further smoothing temporal variances of the neuroelectrical activity. These features of the HDR are often regarded as negative. However, in light of the present findings, this characteristic may also contribute to the validity of comparisons of BOLD fMRI results between TBI survivors and controls. The BOLD signal reflects spiking of input and intracortical processing (i.e., local field potentials), rather than cortical output activity (Buzsaki et al., 2007; Logothetis et al., 2001). Based on the present results local neuronal processing and its neurovascular coupling appear to be unaffected in severe TBI. However, further investigation using multiple techniques is needed to fully elucidate the physiological, metabolic, and structural changes that occur in the cortex following TBI.
The pathophysiology of severe TBI is complex. It is recognized that focal and diffuse pathologies coexist and cause morbidity (Graham et al., 2002; Povlishock and Katz, 2005). Despite complex changes to many physiological variables that contribute to neurovascular coupling, the findings of this study suggest that the shape of the HDR is unaffected. Indeed, the HDR appears robust enough to assume that basic fMRI experiments using standard methods and models will be valid, even in TBI patients with known FA changes. Thus it appears that diffuse white matter damage alone is insufficient to alter the HDR. This finding is contrary to the findings seen in individuals who have recovered from optic neuritis, in whom there is a persistent reduction in the BOLD amplitude (Langkilde et al., 2002). Both diffuse axonal injury and optic neuritis are white matter disorders, but clearly differences in their pathophysiologies affect cortical activity and neurovascular responsiveness to varying degrees in the two disorders. fMRI studies in different patient groups may therefore not be directly comparable, as the underlying pathological changes and neuroplasticity induced by the different disorders may give rise to differences in the HDR.
Even though the HDR in the TBI group was fully transposable with the control group's HDR, there was a significant difference in the area of activation. This difference probably arose from changes in cortical processing of the incoming information following diffuse white matter injury. Several lines of evidence support this hypothesis. The TBI survivors no longer displayed the positive correlation between FA and mean PE in the visual cortex found in the controls. The limited literature on the relationship between FA and neuronal activity suggest that increased FA gives rise to increased processing speed and timing of neuronal activation. Studies using visual stimuli combined with magnetoencephalography (Stufflebeam et al., 2008), or visual evoked responses (Butler et al., 2005), have shown an inverse relationship between FA and the latency peak of the early components of neuronal activity in the visual cortex. The results from the present study indicate that the level of BOLD activity in the visual cortex in healthy controls is determined by FA in the optic radiation, and hence increased speed and possibly timing of thalamo-cortical signaling. This relationship is lost in the TBI group. Loss of fast thalamo-cortical transmission in the optic radiation following diffuse axonal damage is expected, based on the finding that the large myelinated axons are especially vulnerable to traumatic changes (Rodriguez-Paez et al., 2005). Furthermore, thalamo-cortical neuroplasticity is extremely limited following injury to the early components of the visual system. The major contributor to functional improvement is cortico-cortical neuroplasticity within the visual cortex (Chow et al. 2009; Darian-Smith and Gilbert, 1994; Darian-Smith et al. 1995; for review see Barth, 2002, and Holtmaat and Svoboda, 2009). The observed loss of a relationship between the parameter estimates of the BOLD signal in visual cortex and FA in the optic radiation in severe TBI survivors is therefore not surprising. A combination of unmasking of neuronal circuits, strengthening of existing synapses, axonal sprouting, spine growth, and synapse formation in the upper cortical layers are considered central in this process of cortico-cortical reorganization. Even small changes in the number of synapses and the wiring between the neurons are thought to give rise to significant functional changes.
The larger area of BOLD activity in the visual cortex in the TBI group compared to the controls was most prominent in V2. This brain area is less well studied than V1, and its role in processing visual stimuli remains poorly understood (Boynton and Hegde, 2004). V2 neurons respond specifically to line combinations that produce angles (Boynton and Hedge, 2004), and the “H”s used in the brief visual stimuli may therefore have been particularly engaging for V2, and more so in the TBI group. The increase in the area of activation in the visual cortex in the TBI group compared to the controls in the present study is contrary to the results of a previous study encompassing almost the same TBI survivors, in which decreased visual cortex activity was found in a visual search task (Rasmussen et al., 2008). The duration of the stimuli is likely to have been a determining factor here. It has been shown that shorter periods of visual stimulation lead to more widespread visual cortex activation (Werring et al., 2000), whereas longer stimuli blocks lead to reduced areas of activation (Langkilde et al., 2002; Rombouts et al., 1998) in individuals who have recovered from optic neuritis compared to controls. Another possible explanation for the increased area of activation seen in the TBI group may be related to changes in levels of neuromodulators such as acetylcholine, due to disruption of fibers originating in the basal forebrain and/or brainstem. Acetylcholine, for instance, enhances thalamo-cortical input, while suppressing intracortical interaction (Hsieh et al., 2000; Kimura et al., 1999). Its presence in the control group may thus lead to more localized activation. Indeed, more widespread cortical activity is commonly reported in TBI patients (Christodoulou et al., 2001; Rasmussen et al., 2008; Sanchez-Carrion et al., 2008; Schroeter et al., 2009), but its origin remains speculative.
TBI survivors are known to experience a wide range of cognitive deficits, including impaired attention (Mathias and Wheaton, 2007), and information-processing speed (Fong et al., 2009; Lippert-Grüner et al., 2006; Mathias and Wheaton, 2007). The subjects in this study demonstrated significantly prolonged response time by TBI survivors in responding to visual stimuli compared to control subjects, which supports a deficit in processing speed. Although some members of the TBI group demonstrated poor accuracy in responding to the visual stimuli, there was no significant difference in accuracy between the TBI and control groups. Fong and colleagues (2009) similarly found significant differences in simple reaction time between outpatients with moderate to severe TBI and healthy subjects. It is thought that the diffuse axonal injury has a negative effect on transmission between cortical regions, leading to the observed increase in simple reaction time. We did, however, not observe any correlation between reaction time and FA in the optic radiation in either the TBI or the control group. This lack of correlation was not surprising, since reaction time depends on additional processing of the visual input in more frontal regions and the subsequent motor response. It should be emphasized that the TBI survivors participating in this study had widespread, significant FA changes throughout the brain, including the corticospinal tracts (Xu et al., 2007). It is thus clear that the slower response time seen in the TBI group can originate from impaired white matter integrity and connectivity in a number of different brain regions.
Many previous studies on the correlation between FA and processing speed or other cognitive tasks have found both positive and negative correlations (Baird et al., 2005; Butler et al., 2005; Stufflebeam et al., 2008; Tuch et al., 2005; Turken et al., 2008). These studies applied a whole-brain approach in their analyses. When exploring the relationship between FA and cognitive tasks at the whole-brain level, many different types of tracts will be included in the analysis, and the relationship between these tracts and the cognitive test applied may not be straightforward. The strength of the current study is the region-of-interest approach that specifically examines FA in the tract transmitting the visual input, and the resulting activity in the visual cortex. This approach also has its weaknesses. A standard mask of the primary visual cortex was used to extract the averaged fMRI time course for each of the subjects, after spatially normalizing their respective scan series to the standard space in which the mask had been drawn. Individual anatomical differences, as well as inaccuracies in the spatial normalization process, may lead to inclusion of voxels that do not belong to the visual cortex, or the exclusion of voxels that belong to it, with the corresponding bias in the average signal time courses. The option of drawing an individual mask for each subject was dismissed, as individual masks are still no guarantee of the selection of the exact visual area as defined by histological criteria. Although regional anatomical differences between the two population groups were not systematically assessed, no such effect was appreciated by observation of the images. Furthermore, the tractography for delineating the optic radiation is dependent on the analyst's skill and experience. In the present study an experienced clinical DTI analyst (J.X.) performed all analyses.
The inherent limitations of the small sample size studied also warrant mention. The lack of statistical power is illustrated by the lack of significance in the group difference in ADCmean, despite a twofold difference in group means and a 95-fold difference in standard error. Although the power of the statistical tests is limited by our sample size, the TBI severity of this sample may have contributed to a larger effect size. On the positive side the cohort was homogenous with regard to gender, ethnicity, and socio-economic background.
In conclusion we find the HDR in the visual cortex to be intact in the face of significant white matter damage and resulting FA changes in the optic radiation. However, the increase in the area of activity in V1 and V2 in the TBI group points to altered cortico-cortical processing, probably connected to the reduction in thalamo-cortical input. These findings support the validity of using standard fMRI methodology to study neuroplasticity in TBI survivors.
Footnotes
Author Disclosure Statement
No competing financial interests exist.