




Abstract
Although acoustic overstimulation has a major pathophysiological influence on the inner ear, central components of the auditory pathway can also be affected by noise-induced hearing loss (NIHL). The present study investigates the influence of a noise-induced temporary threshold shift (TTS) and/or permanent threshold shift (PTS) on neuronal cell densities in key structures of the central auditory pathway. Mice were noise-exposed (3 h, 5–20 kHz) at 115 dB sound pressure level (SPL) under anesthesia, and were investigated immediately (TTS group, n = 5) after the exposure, or 1 week later (PTS group, n = 6). Unexposed animals were used as controls (n = 7). Frequency-specific auditory brainstem responses (ABR) were recorded to examine auditory thresholds. Cell density was determined within the dorsal (DCN) and ventral (VCN) cochlear nucleus; the central nucleus of the inferior colliculus (ICC); the dorsal, ventral, and medial subdivisions of the medial geniculate body (MGBd, MGBv, and MGBm); and layer I to VI of the primary auditory cortex (AI I–VI). ABR thresholds were significantly elevated in the TTS group (52–69 dB SPL) and in the PTS group (33–42 dB SPL) compared to controls. There was a significant decrease in cell density only in the VCN of the TTS group (−10%), most likely induced by the acute overstimulation of neurons. Cell density was significantly reduced in all investigated auditory structures at 1 week post-exposure (PTS group), except in layer II of the AI (VCN: −30% and DCN: −30% (high-frequency); −39% (low-frequency); ICC: −31%; MGBd: −31%; MGBm: −28%; MGBv: −31%; AI: −10 to 14%). Thus there were dramatic changes within the neuronal cytoarchitecture of the central auditory pathway following a single noise exposure. The present findings should help clinicians to better understand the complex psychoacoustic phenomena of NIHL.
Introduction
N
Kane showed in 1974 that decreased or abolished cochlear input into the central auditory pathway reduces the number of dendritic spines at the terminals of auditory nerve fibers on cochlear nucleus (CN) neurons. Further, cell body and tissue shrinkage have been seen in the CN and the superior olivary complex (SOC) (Aarnisalo et al., 2000; Benson et al., 1997) as a result of NIHL. In addition, axon degeneration occurred in the CN (Kim et al., 1997, 2004) and in the trapezoid body (Jean-Baptiste and Morest, 1975) as a result of NIHL. Different research groups demonstrated that synaptic plasticity was markedly increased in central auditory structures by elevated expression of several neurotrophic proteins (Kraus et al., 2009; Suneja et al., 2005). Our group provided evidence that intense noise exposure leads to a massive loss of cell density in higher auditory structures such as the medial geniculate body (MGB) and the primary auditory cortex (AI) (Basta et al., 2005).
All of the animal experimental studies cited above noted central changes over an observation period of a few days up to a maximum of 1 month after inducing NIHL. Acute data (from hours to days after noise exposure) are almost completely absent in the literature. Only a few observations have been made of acutely-appearing plasticity markers after acoustic trauma or complete surgical removal of the cochlea, indicating that the auditory brainstem is primarily affected by early neurodegenerative processes (Gil-Loyzaga et al., 2010; Michler and Illing, 2002).
The most prominent feature of the acute phase is a temporary threshold shift (TTS), with a decrease in auditory acuity. This is due to both reversible and permanent mechanical damage to the cochlear hair cells and their stereocilia immediately after noise-induced trauma, as demonstrated earlier in detail (Henderson et al., 2006; Nordmann et al., 2000; Tsuprun et al., 2003). The acute permanent pathophysiological changes are highly relevant from a therapeutic perspective in humans for efforts to effectively prevent a permanent threshold shift (PTS, due to irreversible peripheral and central damage), and its sequelae of tinnitus and reduced speech intelligibility (Basta et al., 2005; Henderson et al., 2006; Hirose and Liberman, 2003; Yamashita et al., 2004).
The acute and long-term effects of noise may be correlated with specific structural changes within the central auditory pathway. The aim of the present study was therefore to investigate the influence of a noise-induced TTS (the stage immediately post-exposure), and/or PTS (7 days after noise exposure), on neuronal cell densities in key structures of the central auditory pathway, such as the dorsal and ventral cochlear nucleus (DCN and VCN), the inferior colliculus (IC), the medial geniculate body (MGB), and the primary auditory cortex (AI).
Methods
Eighteen young adult (30–50 days of age), normal-hearing mice (NMRI-strain) of both sexes were used for this study. The experimental protocol was approved by the Governmental Commission for Animal Studies. All efforts were made to minimize pain and discomfort for the animals.
Eleven mice were noise-exposed in a soundproof chamber (0.8 × 0.8 × 0.8 m, minimal attenuation 60 dB) for 3 h to broadband white noise (5–20 kHz) at 115 dB sound pressure level (SPL) under anesthesia (60 mg/kg ketamine and 6 mg/kg xylazine). Noise was delivered binaurally by loudspeakers (HTC 11.19; Visaton, Haan, Germany) placed above the animal's head. The speakers were connected to an audio amplifier (Tangent AMP-50; Aulum, Denmark) and a DVD player. SPL was calibrated by using a sound level meter (Voltcraft 329; Conrad Electronic, Hirschau, Germany) placed near the animal's ear. Anesthesia was controlled by using a video camera placed inside of the lighted chamber. Body temperature was maintained at 37°C with a heating pad (Thermolux CM 15W; Acculux, Murrhardt, Germany) placed under the animal. Five mice were investigated immediately after the noise exposure (TTS group), whereas the remaining six were kept in their cages (PTS group) to be investigated 7 days later. Seven unexposed animals were used as controls (control group).
On the day of sacrifice, frequency-specific (4, 8, 12, 16, and 20 kHz) auditory brainstem responses (ABR) were recorded in noise-exposed animals (TTS and PTS group) and in control animals under anesthesia to examine auditory thresholds. Acoustic stimulation was performed with the same set-up used for noise exposure. Auditory stimuli were delivered binaurally at different SPLs with a sinusoid generator (Model SSU2; Werk für Fernmeldewesen, Berlin, Germany). Frequency output was controlled and adjusted with a digital counter (1941A Digital Counter; Fluke, Scarborough, Ontario, Canada). Subdermal needle electrodes were placed at the vertex (active), mastoid (reference), and in one foot (ground). ABR recordings were carried out with a Viking IV® measurement system (Viasys Healthcare, Conshohocken, Pennsylvania). The brainstem responses were amplified (100,000 × ), filtered (bandpass 0.15–3 kHz), and averaged (300 × ) by the Viking IV® system. The amplitudes of the ABR waves were measured at different sound intensities by changing the attenuation of signal amplification. The amplitude-growth function was calculated for each tested frequency, and a linear regression was fitted to the linear portion of the data. The hearing threshold could be calculated for each frequency by extrapolating the linear amplitude-grow function of the regression line to zero. From these data, threshold differences (mean threshold shifts) were calculated between the control and the noise-exposed animals using the average values. Results are represented as mean relative hearing loss (±SE) in decibels (dB) of the experimental groups compared to controls.
After ABR recording, the animals were perfused via the left heart chamber with a fixation solution (4% formalin). The brains were carefully removed from the skull, embedded in paraffin, and sliced (10-μm sections) in the frontal plane using a microtome (Sartorius-Werke AG, Göttingen, Germany). The slices were stained on slides using a modified haemalaun-eosin staining method. To remove the paraffin from the tissues, the slices were washed twice for 10 min each in Rotihistol® (Carl Roth, Karlsruhe, Germany), and rehydrated in a descending ethanol series (90% and 70% ethanol), and distilled water (5 min each). The nuclei were stained for 4 min in haemalaun solution, washed in water for 1 min, and differentiated under flowing water for 10 min. Then the slices were stained for 3 min in 0.1% eosin, washed briefly in distilled water, and differentiated in 70% ethanol. The tissues were dehydrated in an ascending ethanol series (90% and 100% ethanol for 1 min each), and kept in Rotihistol for storage. The slides were mounted with Roti Histokitt® (Carl Roth).
The stained tissues were microscopically magnified (250 × , Eclipse E 200; Nikon, Tokyo, Japan), and the images were captured by a digital camera (Nikon Coolpix 5000). The cell density was determined within the DCN; VCN; central nucleus of the IC (ICC); dorsal, ventral, and medial subdivision of the MGB (MGBd, MGBv, and MGBm); and layers I–VI of the primary auditory cortex (AI I–VI and AI-1 to AI-6) by counting the number of visible nuclei. Only the fusiform layer was analyzed in the DCN because the cell distribution was widely variable in the entire nucleus, but the fusiform layer was subdivided into high- and low-frequency portions (DCN HF and DCN LF), according to Ehret and Fischer (1991) and Frisina and Walton (2001). The molecular layer of the cerebellar lobule IV/V (Cb) was used as a non-auditory control area. The brain areas were defined in accordance with the mouse brain atlas of Paxinos and Franklin (2001). The number of neurons was counted using a grid that was positioned to include as many neurons as possible within each structure (grid sizes: DCN HF and LF: 0.1 × 0.13 mm, VCN: 0.1 × 0.23 mm, ICC: 0.4 × 0.4 mm, MGBd: 0.21 × 0.2 mm, MGBv: 0.21 × 0.39 mm, MGBm: 0.1 × 0.39 mm, AI layers I–VI: 0.05 × 0.39 mm, Cb: 0.08 × 0.6 mm; Fig. 1). Because of potential tissue shrinkage during preparation, the numbers of neurons of the auditory areas of each animal were normalized using the cell density of the Cb. The mean relative density of each brain area was calculated using the results of 20 slices obtained from each animal. The data show the mean normalized cell numbers (±SE) in the unexposed control, TTS, and PTS groups. The percentages of changes were calculated in the experimental groups and compared to controls.
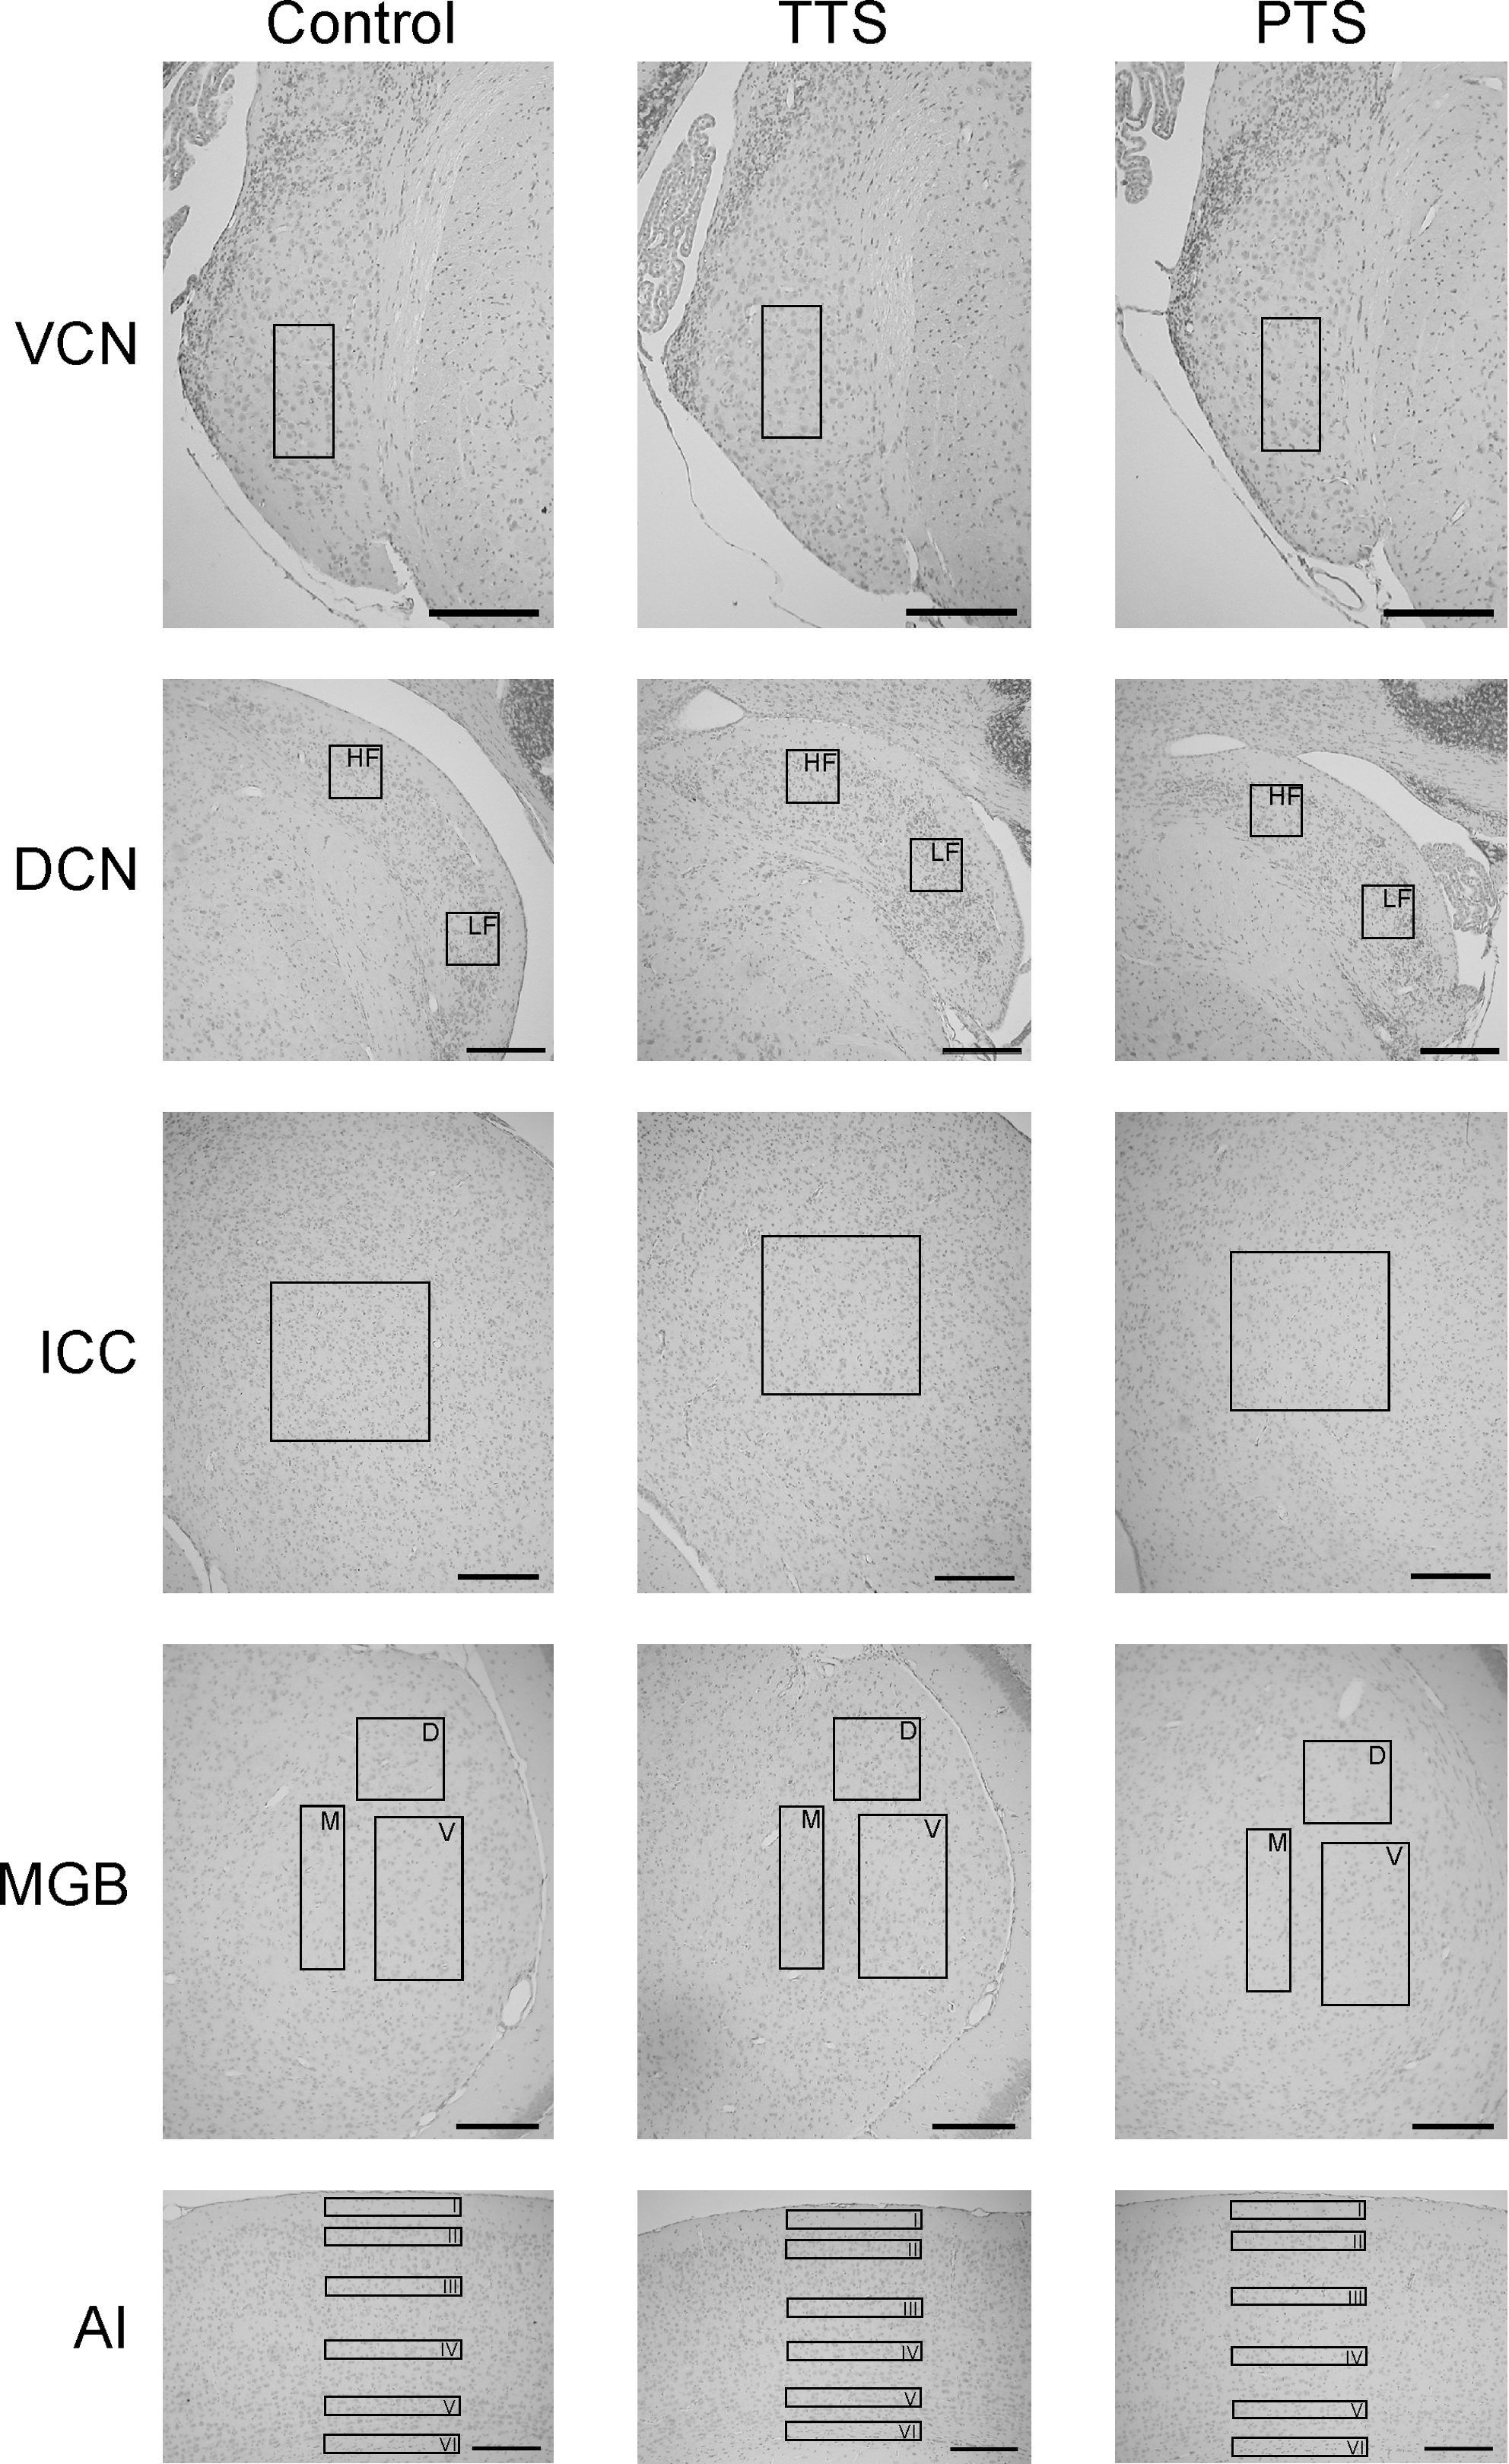
Photomicrographs of the haemalaun-eosin–stained auditory structures (DCN, dorsal cochlear nucleus; VCN, ventral cochlear nucleus; ICC, central nucleus of the inferior colliculus; MGB, medial geniculate body, AI, primary auditory cortex) of each study group (TTS, temporary threshold shift group; PTS, permanent threshold shift group; Control, control group). The rectangles indicate the positioning of the cell count grids. In the DCN, MGB, and AI, more than one area was examined, as shown by the boxes in the photographs (HF and LF indicate the high- and low-frequency areas of the DCN; D, M, and V indicate the dorsal, medial, and ventral subdivisions of the MGB; I, II, III, IV, V, and VI indicate layers I–VI of the primary auditory cortex; scale bars = 200 μm).
The resulting data (hearing thresholds and relative cell densities) were compared between the noise-exposed animals and the control group for each brain region using the U test (if the data were not normally distributed), or the t-test (for normally-distributed data). Data distribution was tested by applying the Kolmogoroff-Smirnoff test. SPSS software was used for all statistical analyses (version 10.0; SPSS Inc., Chicago, IL). The significance level for all statistical tests was p < 0.05.
Results
Hearing thresholds
The measured ABR thresholds were significantly elevated in the TTS group (n = 5; p < 0.001 for all tested frequencies), and in the PTS group (n = 6; p < 0.001 for all tested frequencies) compared to controls (n = 7). Threshold shift ranged within the investigated frequencies between 52 and 69 dB SPL (TTS group), and between 33 and 42 dB SPL (PTS group; Fig. 2). Recovery from TTS to PTS was also statistically significant, with the exception of the 4-kHz range (Fig. 2; p values: 4 kHz: 0.177, 8 kHz: <0.001, 12 kHz: 0.003, 16 kHz: <0.001, 20 kHz: 0.015). The t-test was used for all statistical testing.
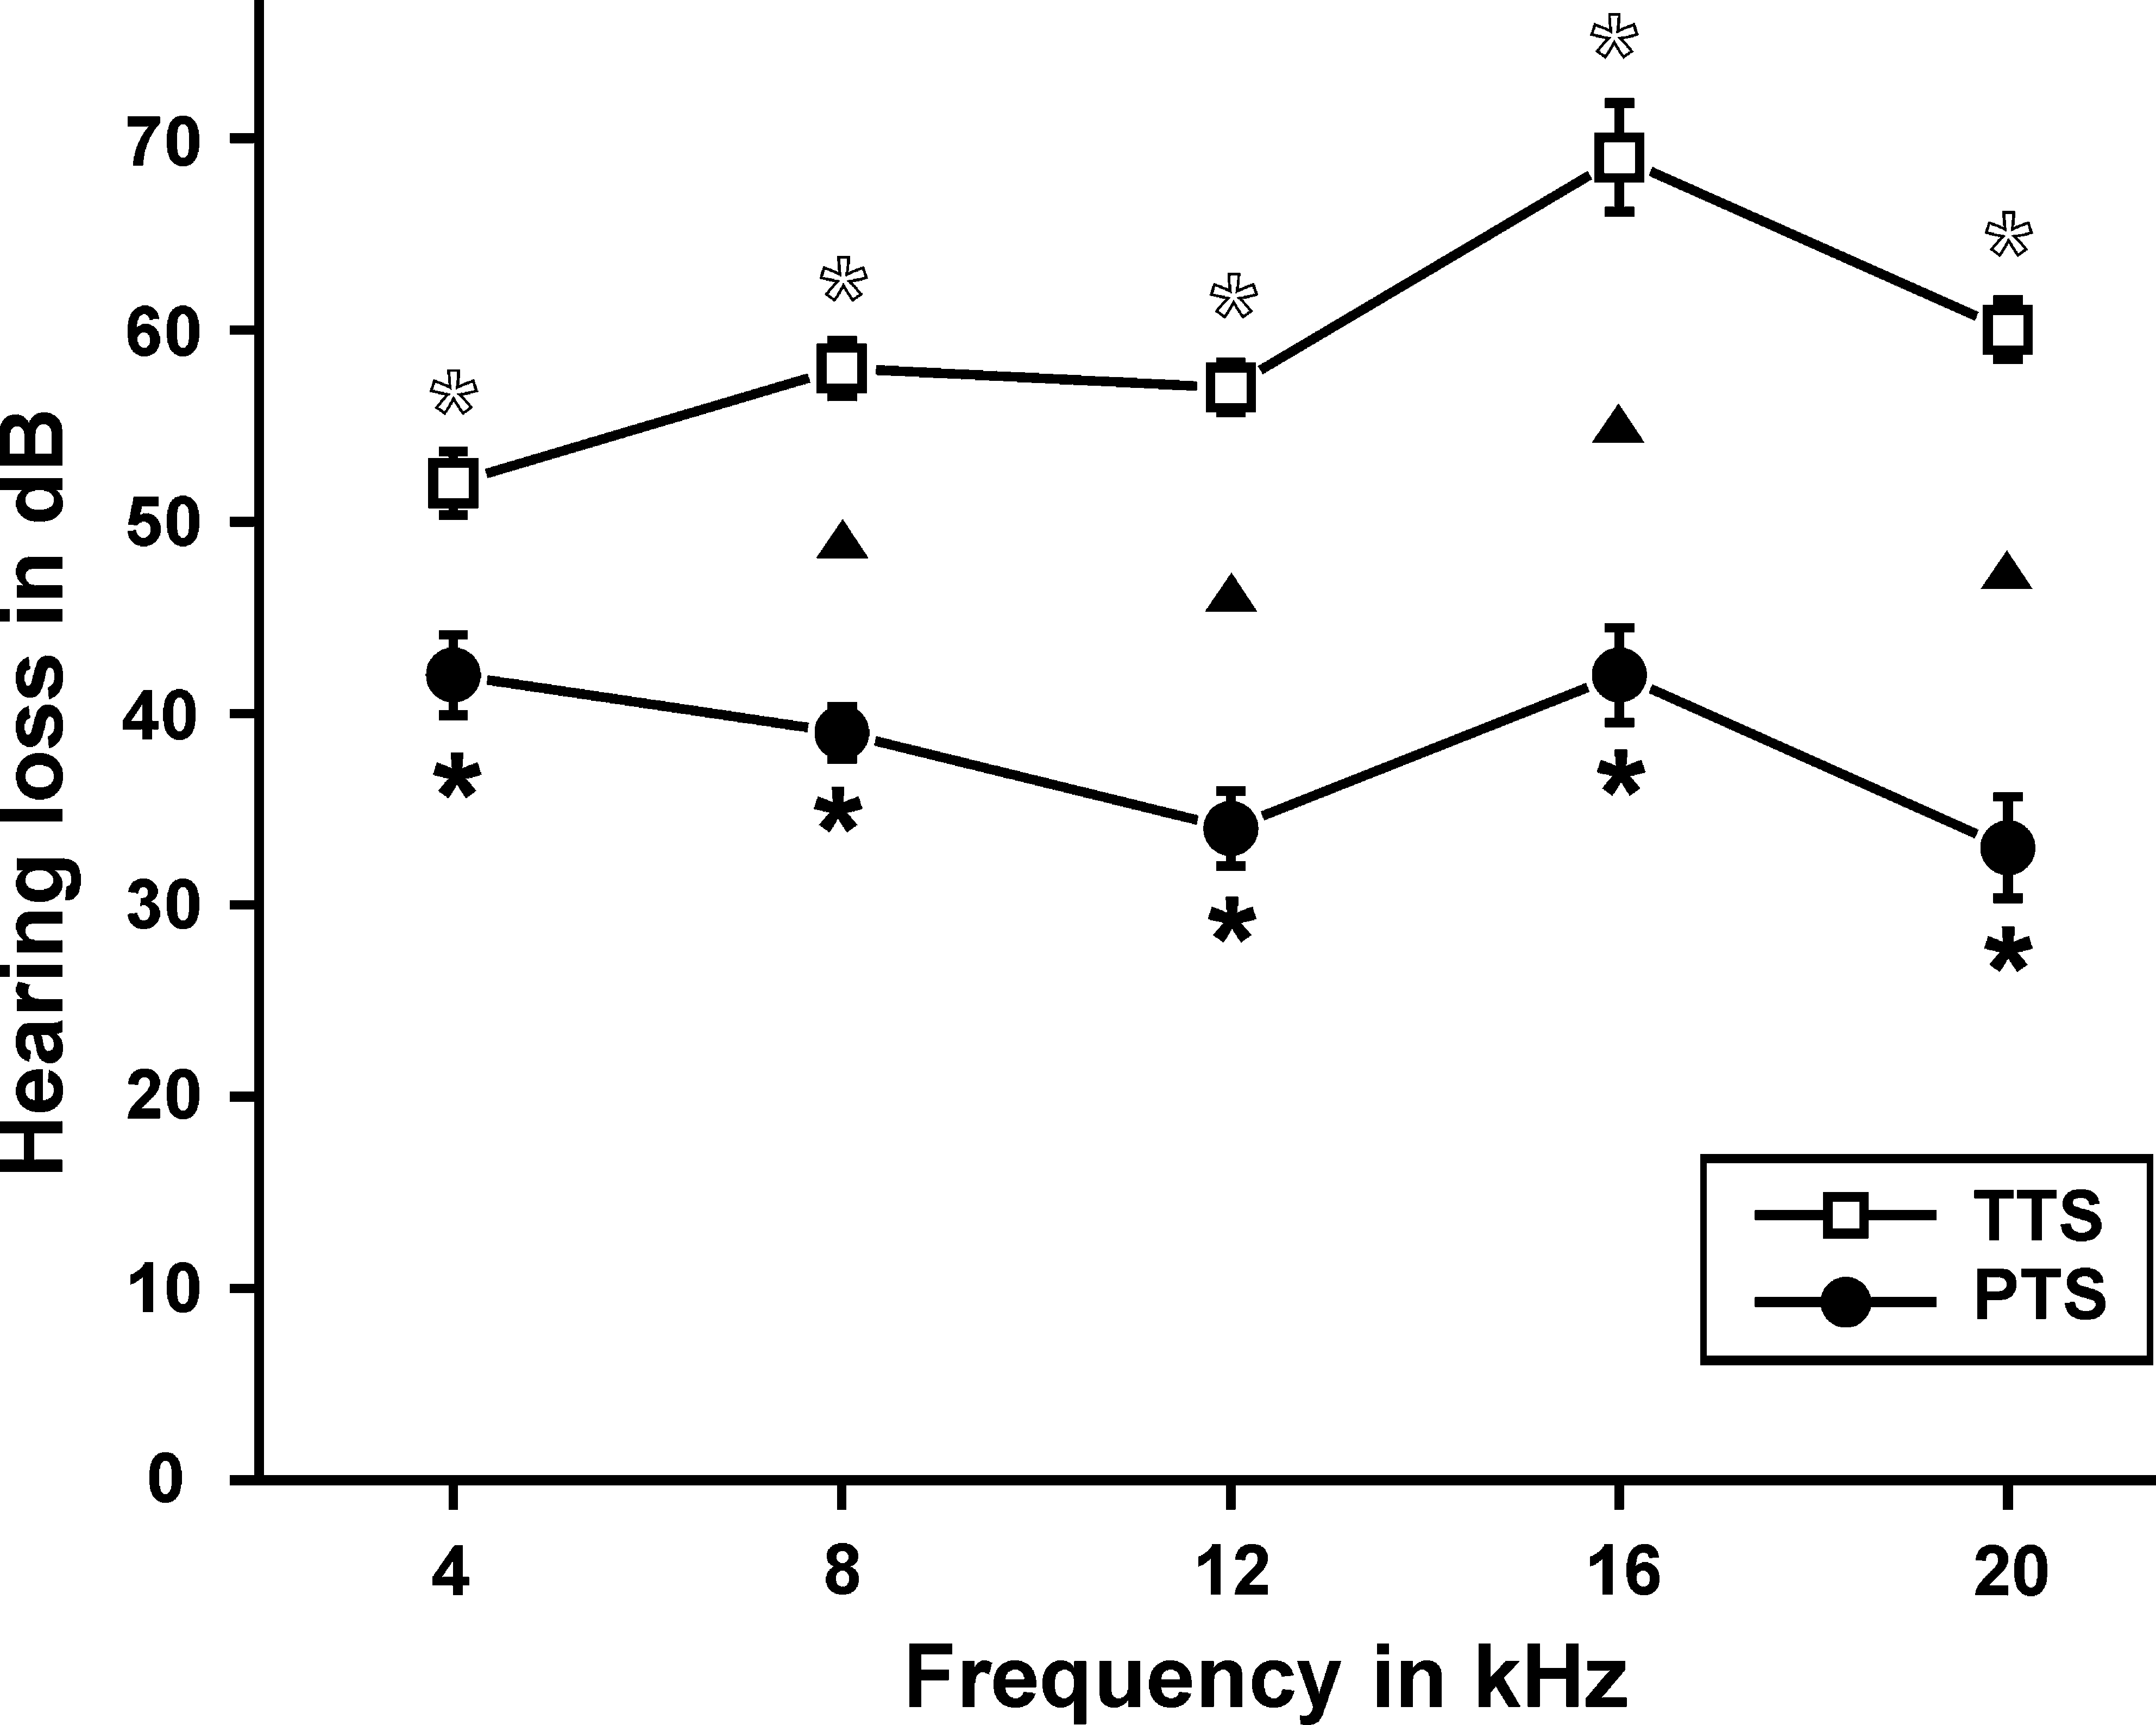
Threshold shift (mean ± standard error) of the auditory brainstem response (ABR) at different frequencies in noise-exposed mice (open squares, temporary threshold shift group [TTS], n = 5; solid circles, permanent threshold shift group [PTS], n = 6). Open and solid asterisks show significant differences with controls (n = 7). Solid triangles indicate significant differences between the treatment groups.
Effects of temporary threshold shift
There was a statistically significant decrease in cell density, from 105.5 ± 2.1 to 94.7 ± 1.5 (−10%), only in the VCN of the TTS group compared to controls (Fig. 3; p < 0.001 by t-test). This effect was not seen in any of the other investigated brain areas (Figs. 4 –7 p values: DCN HF [t-test]: 0.053; DCN LF [t-test]: 0.836; ICC [t-test]: 0.456; MGBd [U-test]: 0.174; MGBv [U-test]: 0.559; MGBm [U-test]: 0.518; AI-1 [t-test]: 0.287; AI-2 [t-test]: 0.563; AI-3 [t-test]: 0.738; AI-4 [U-test]: 0.166; AI-5 [U-test]: 0.882; AI-6 [U-test]: 0.397).

Normalized cell density (mean ± standard error) in the ventral cochlear nucleus (VCN) of the auditory pathway in the three study groups (TTS, temporary threshold shift group, n = 6; PTS, permanent threshold shift group, n = 5; control group, n = 7). Asterisks indicate significant differences between the groups.
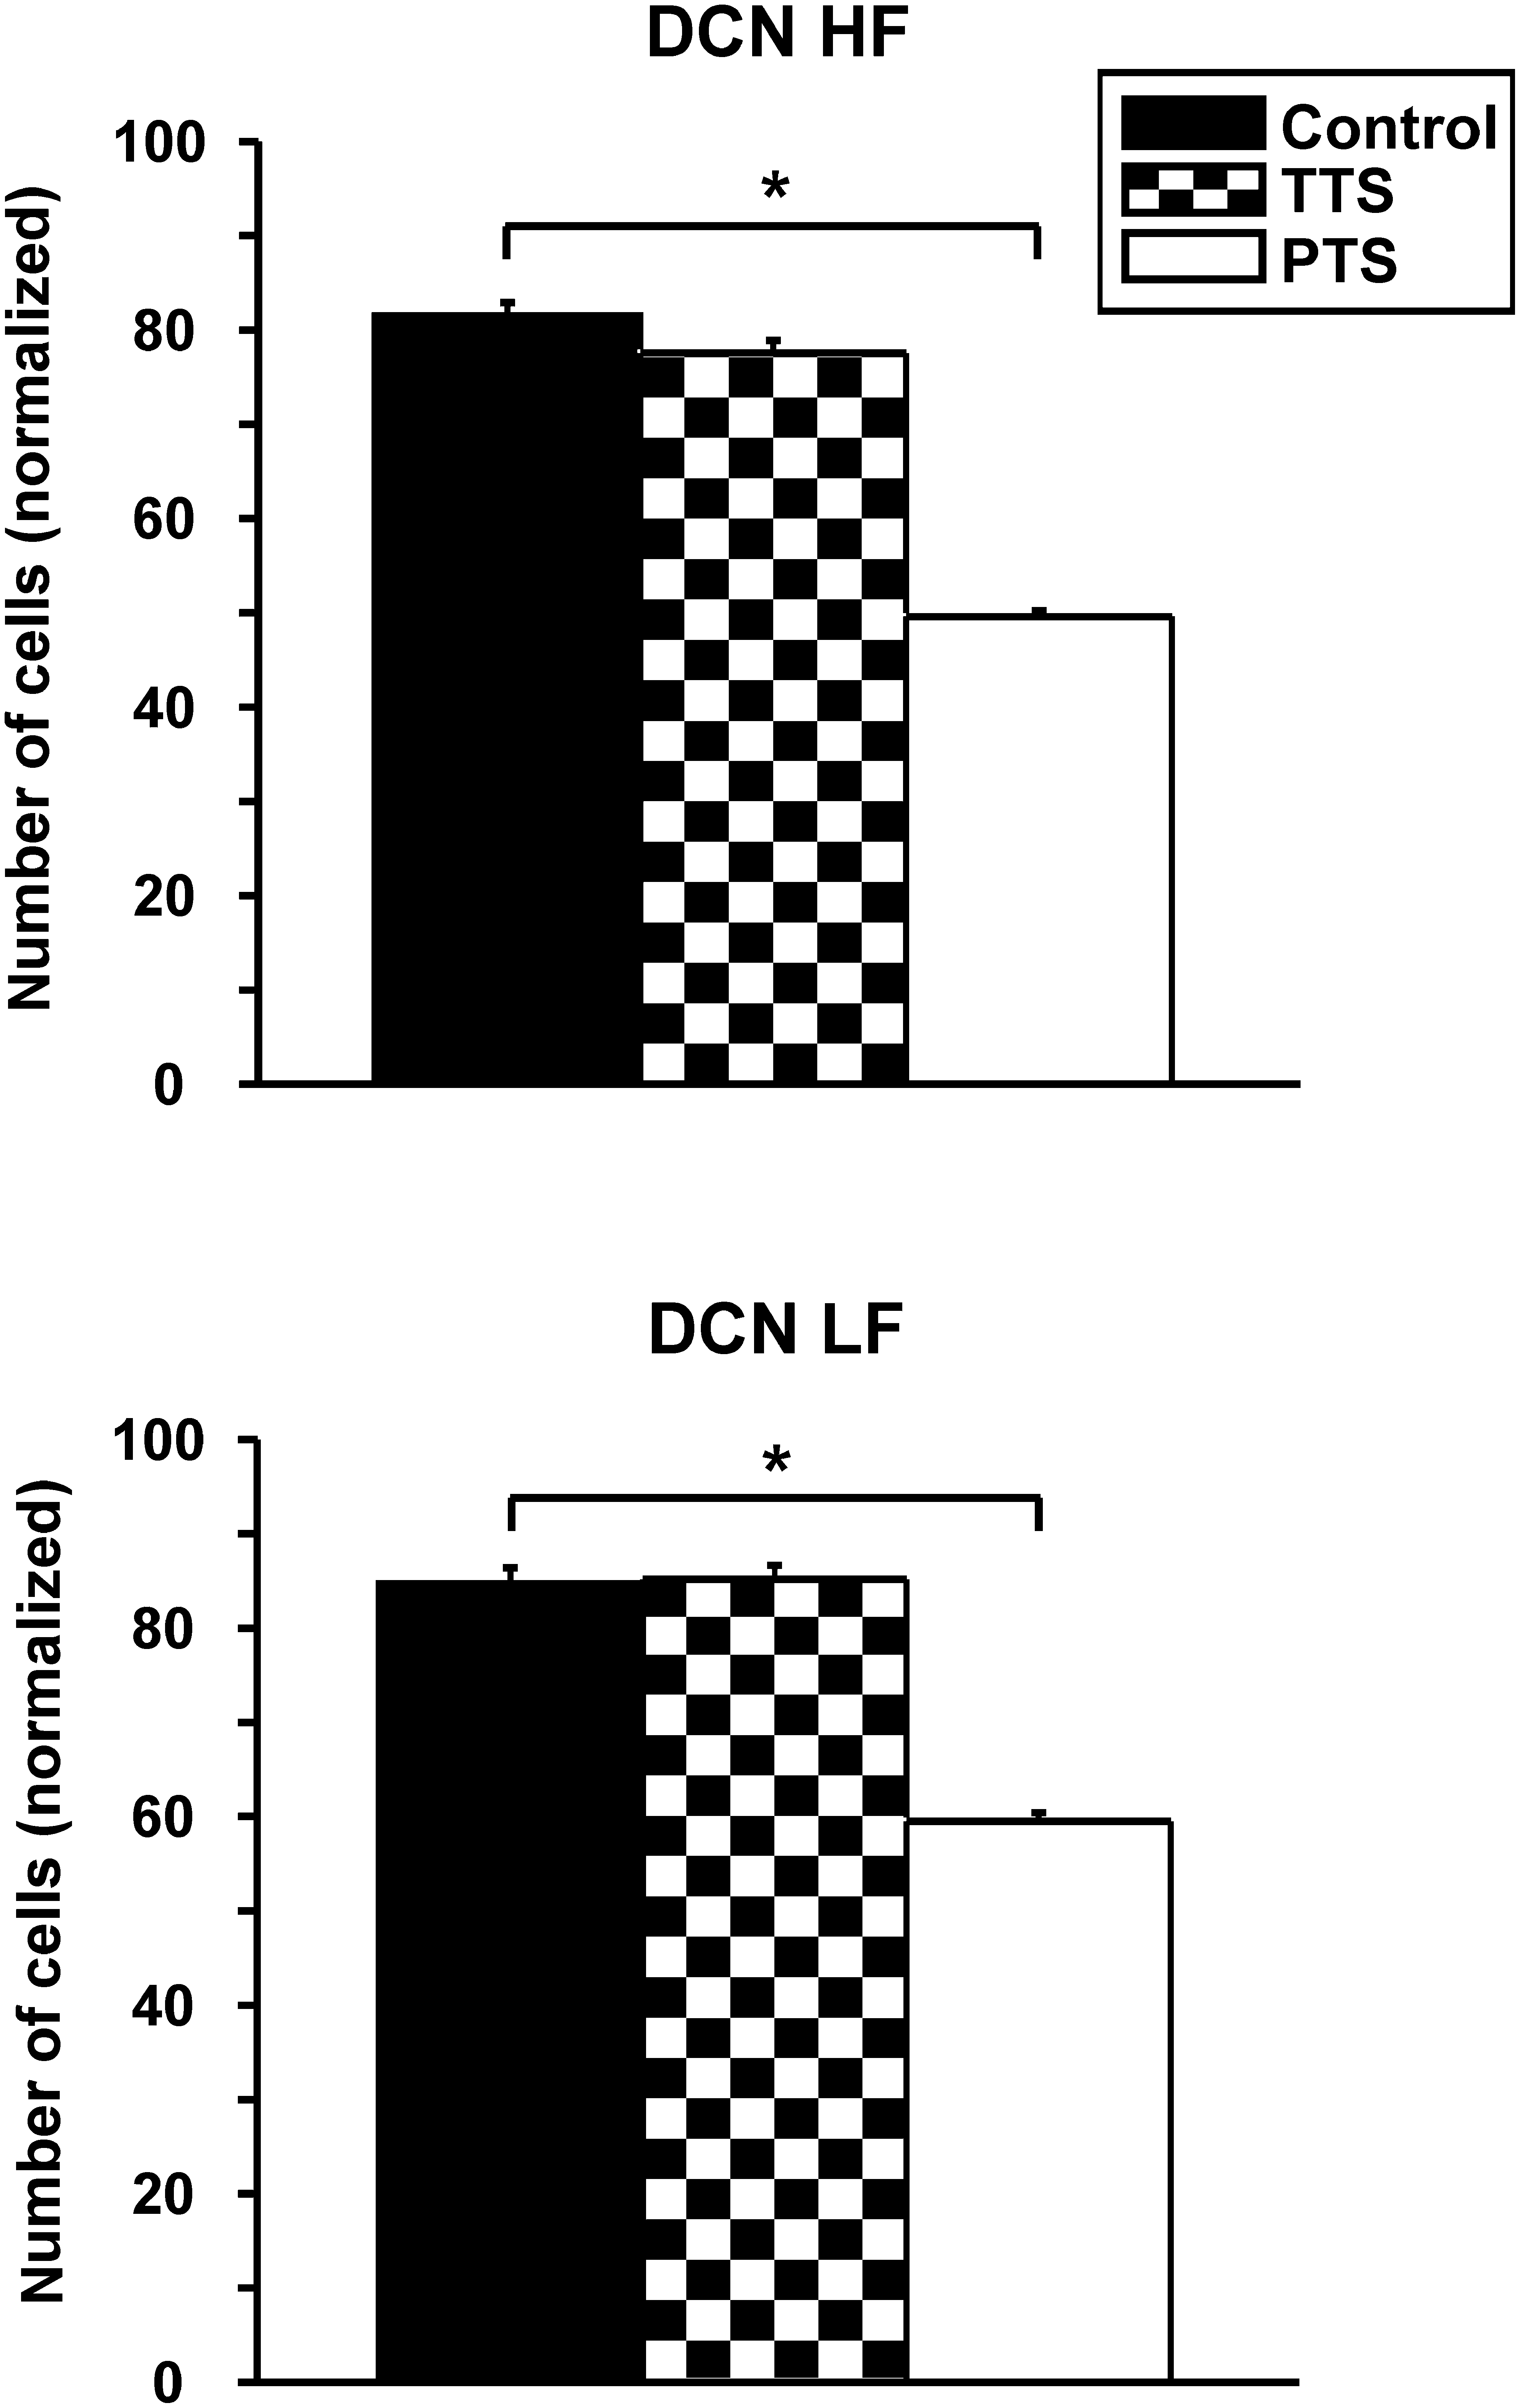
Normalized cell density (mean ± standard error) in the dorsal cochlear nucleus (DCN) of the auditory pathway in the three study groups (TTS, temporary threshold shift group, n = 6; PTS, permanent threshold shift group, n = 5; control group, n = 7). The DCN is subdivided into a high-frequency (DCN HF) and a low-frequency (DCN LF) area. Asterisks indicate significant differences between the groups.

Normalized cell density (mean ± standard error) in the central nucleus of the inferior colliculus (ICC) of the auditory pathway in the three study groups (TTS, temporary threshold shift group, n = 6; PTS, permanent threshold shift group, n = 5; control group, n = 7). Asterisks indicate significant differences between the groups.
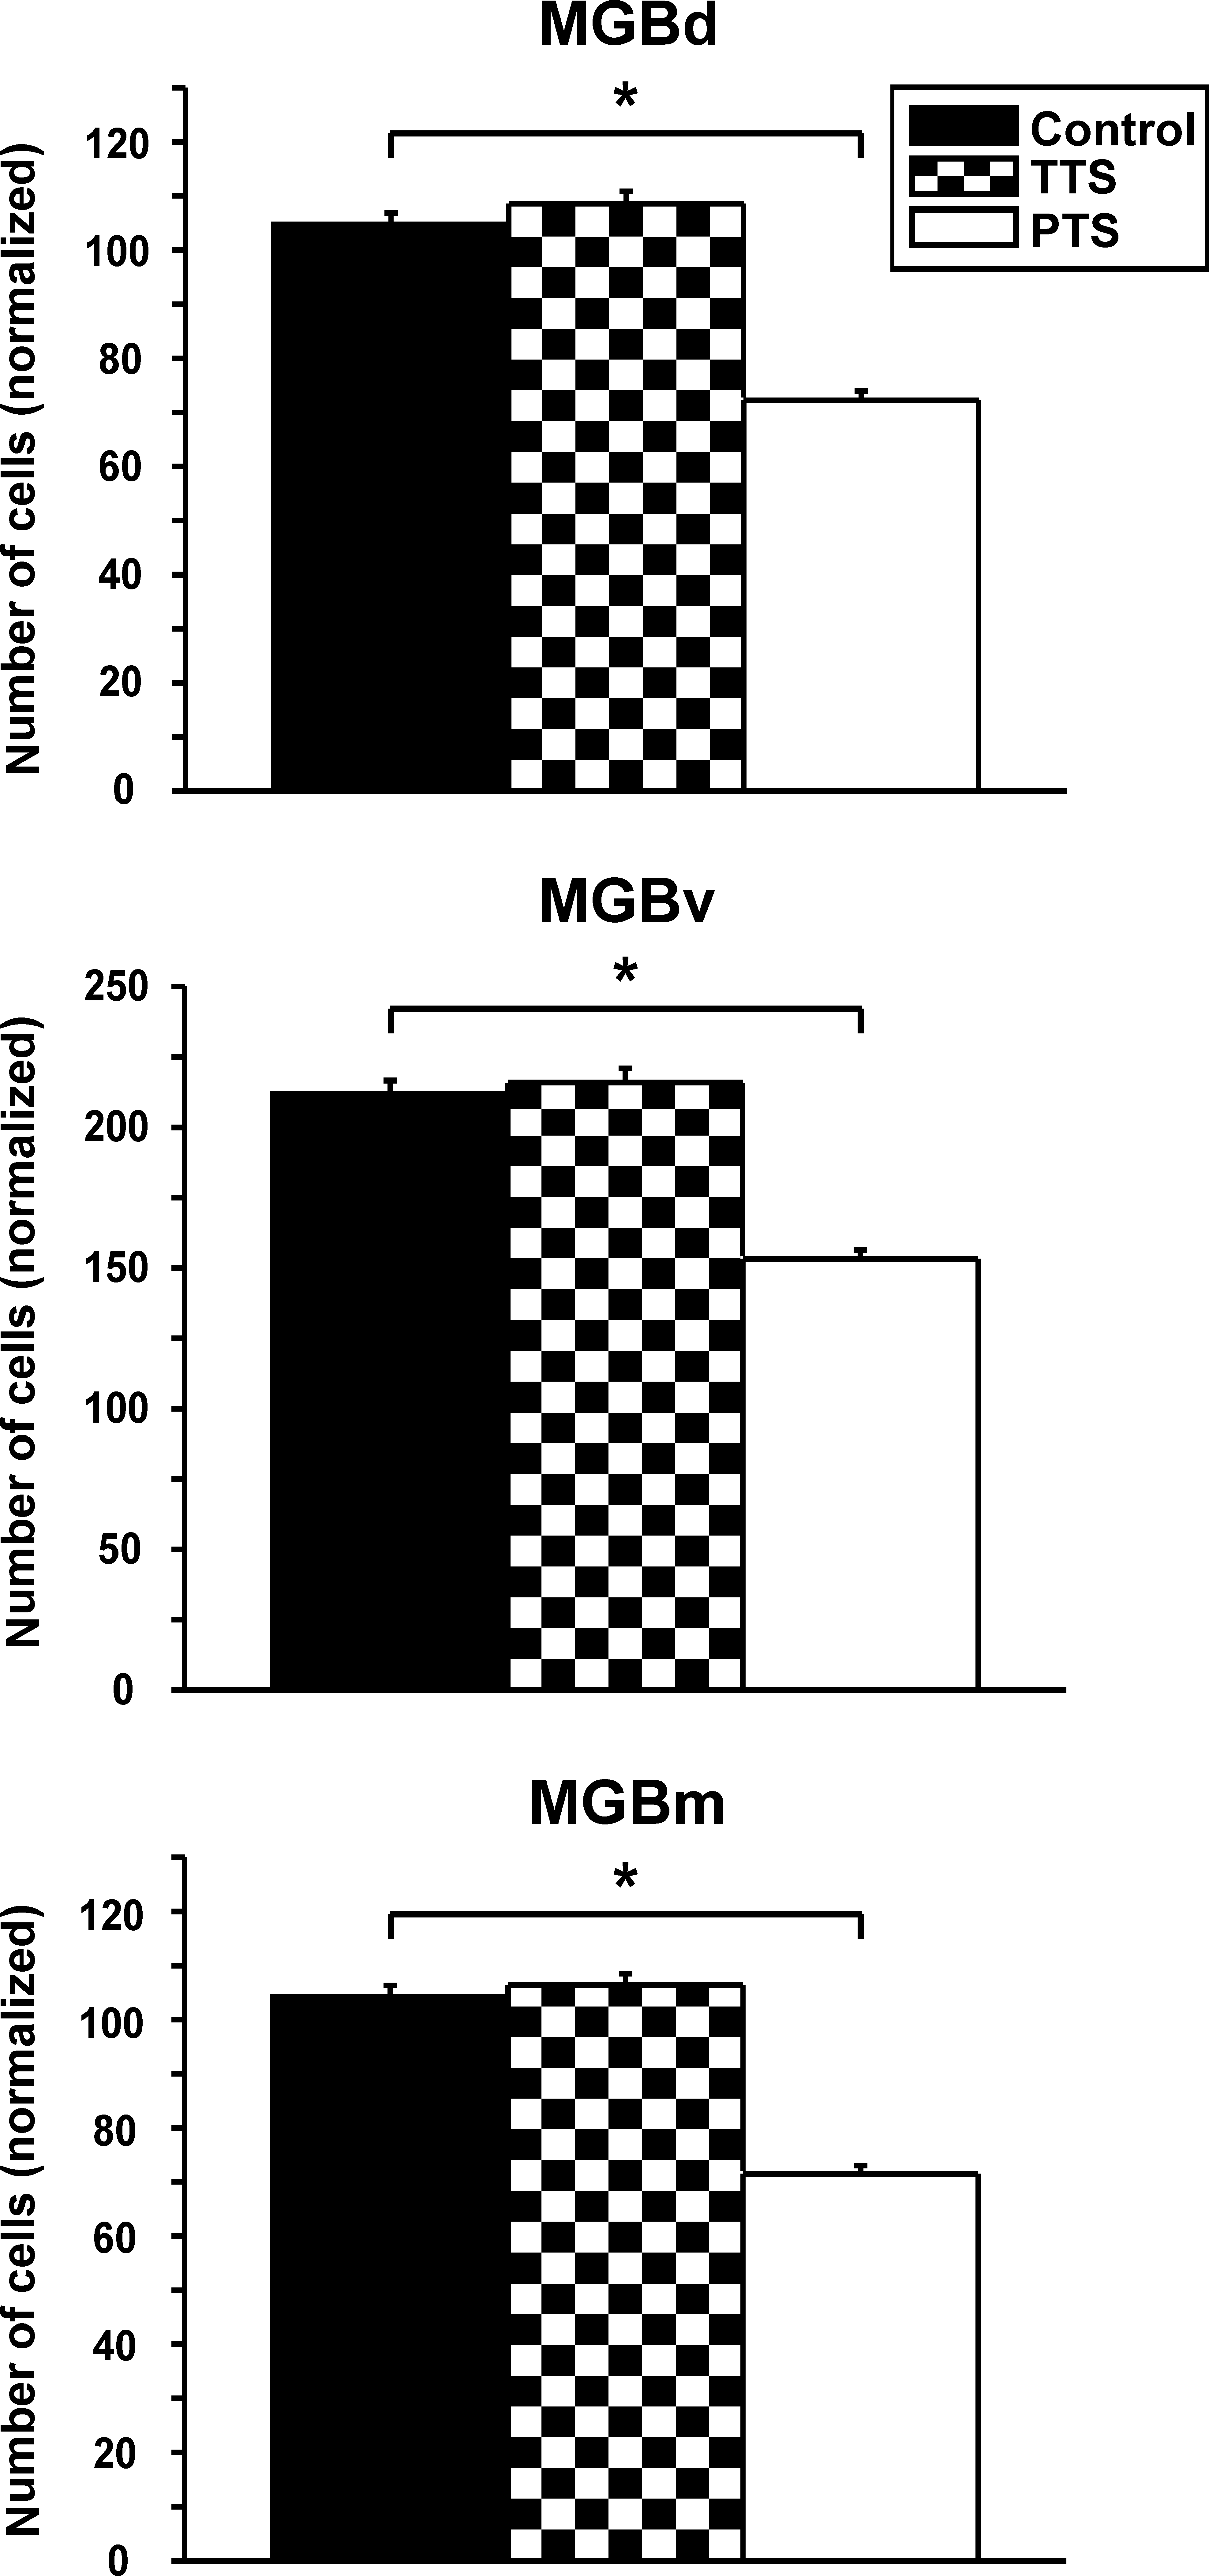
Normalized cell density (mean ± standard error) in the medial geniculate body (MGB) of the auditory pathway (subdivided into the dorsal, ventral, and medial portions of the MGB; MGBd, MGBv, and MGBm, respectively) in the three study groups (TTS, temporary threshold shift group, n = 6; PTS, permanent threshold shift group, n = 5; control group, n = 7). Asterisks indicate significant differences between the groups.
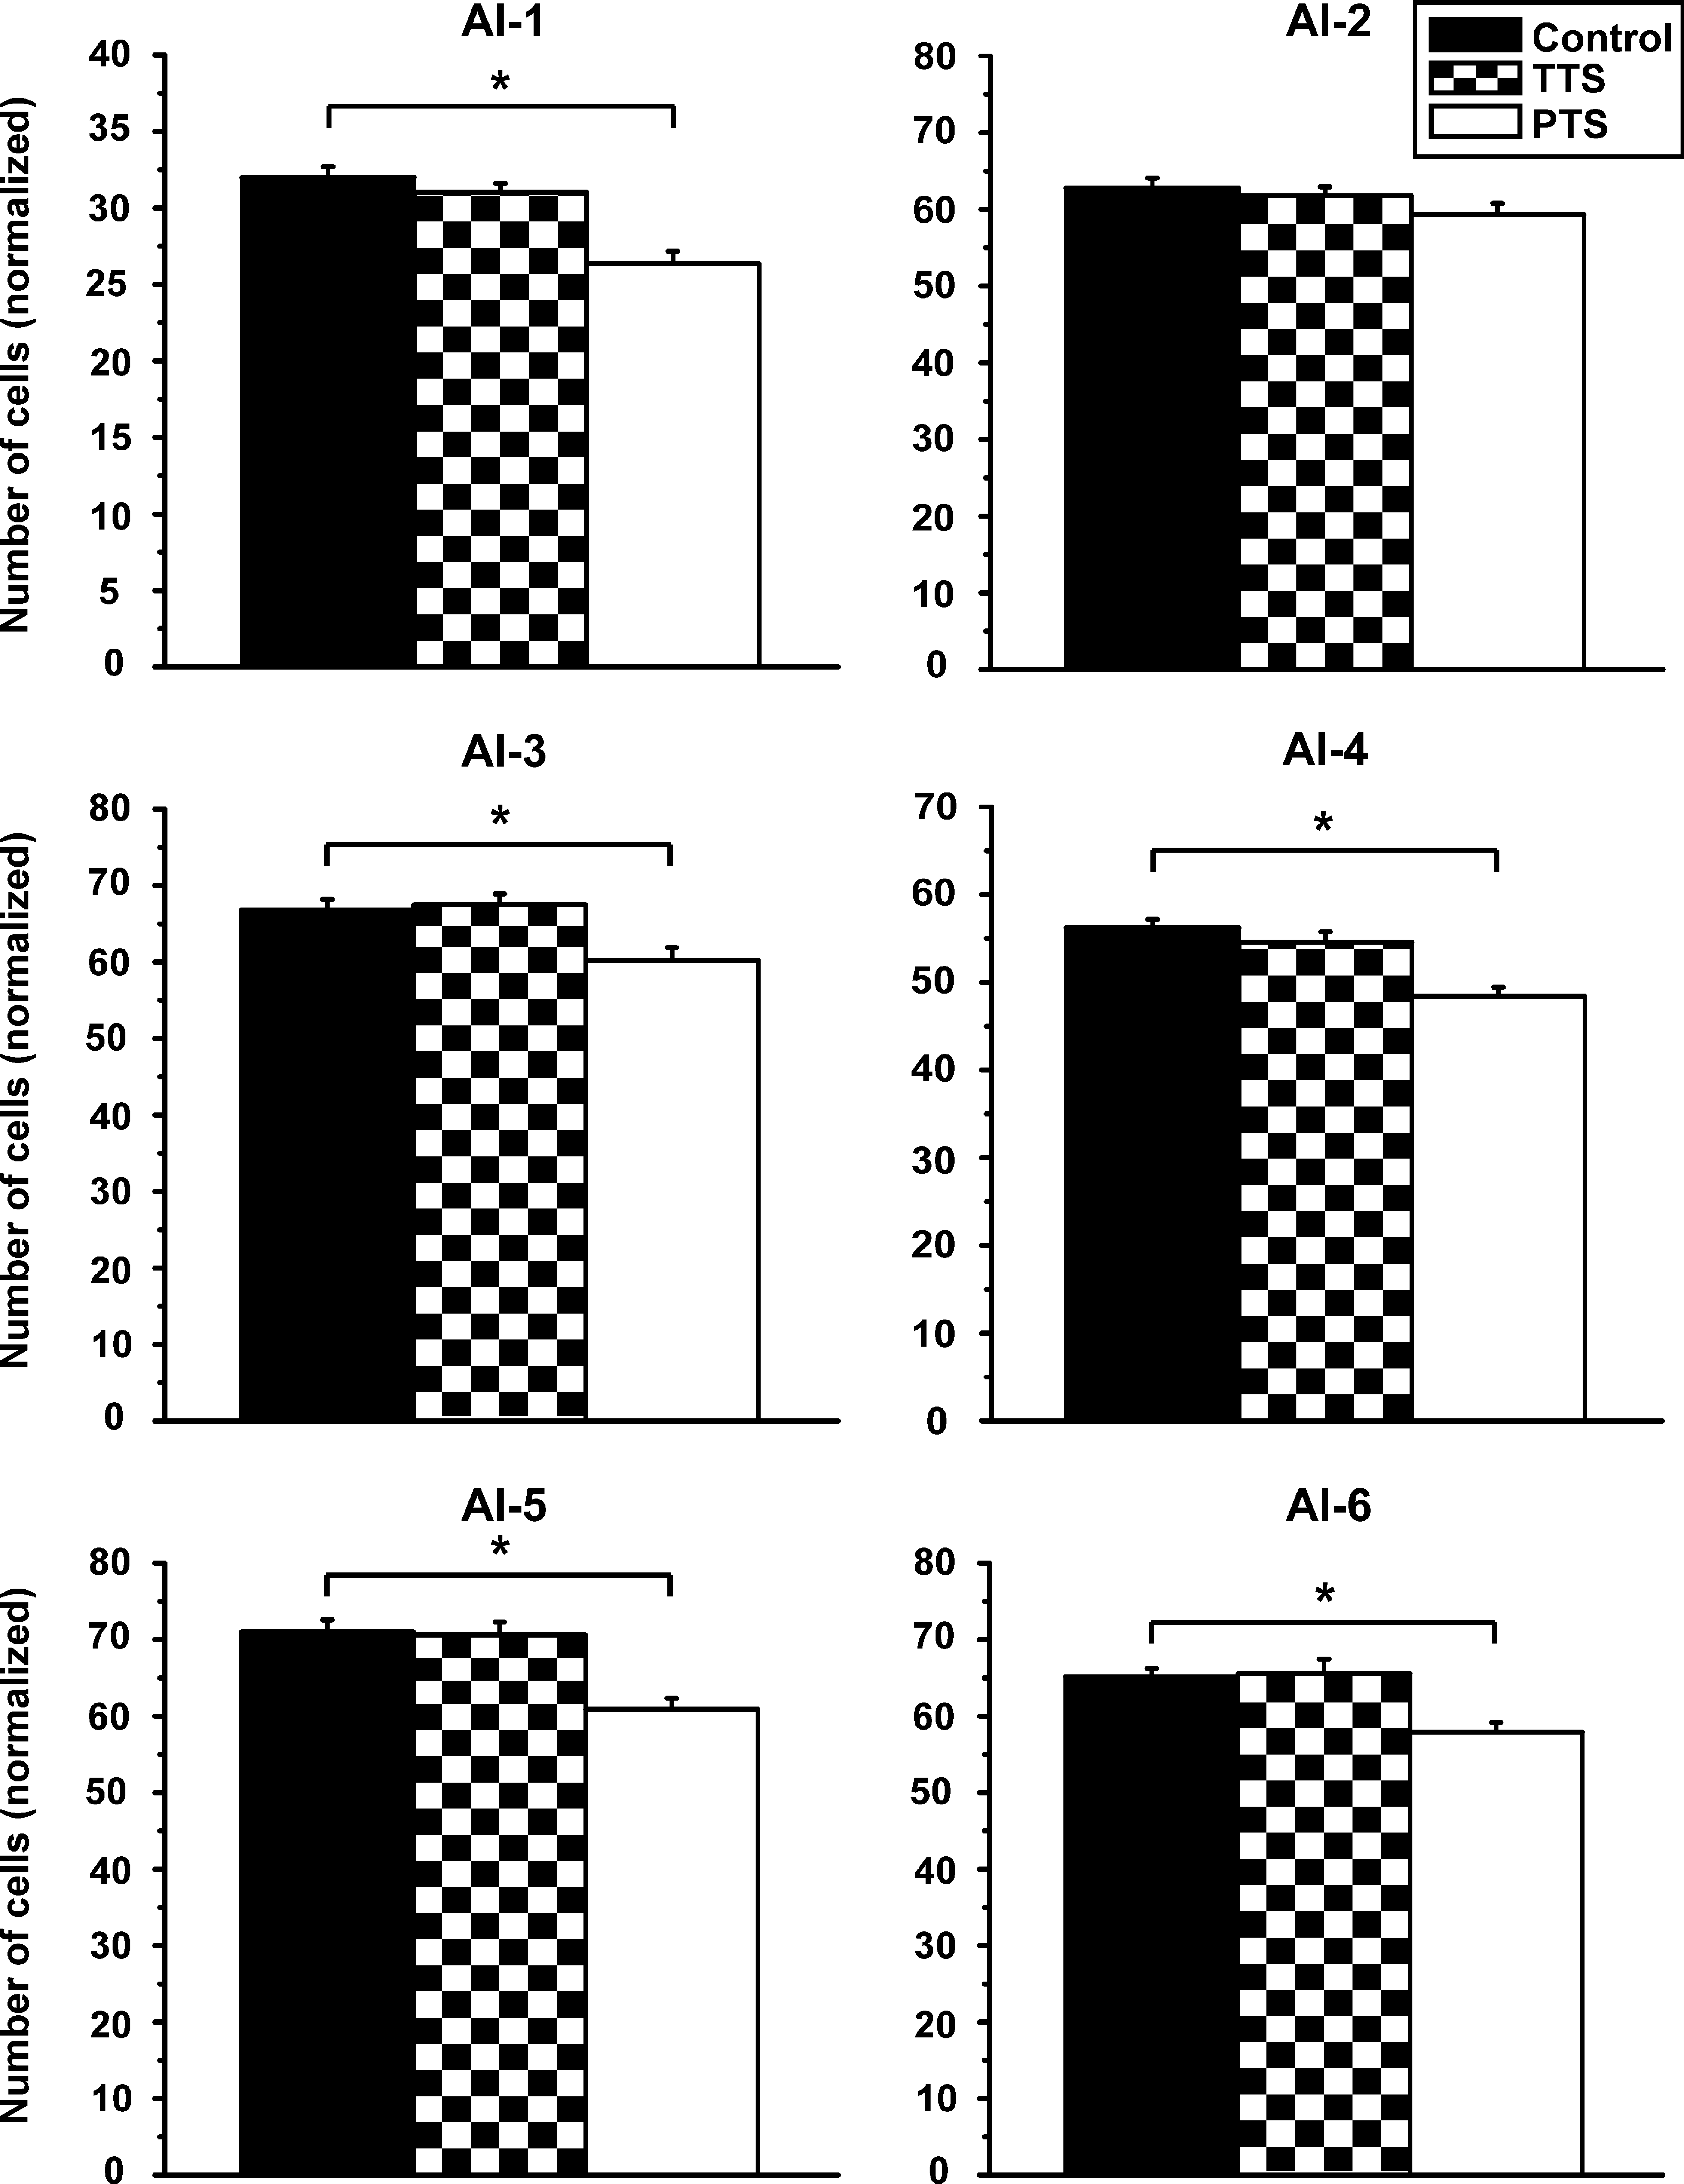
Normalized cell densities (mean ± standard error) in the different layers of the primary auditory cortex (AI; layers I–VI of the AI: AI-1, AI-2, AI-3, AI-4, AI-5, and AI-6) in the three study groups (TTS, temporary threshold shift group, n = 6; PTS, permanent threshold shift group, n = 5; control group, n = 7). Asterisks indicate significant differences between the groups.
Effects of permanent threshold shift
CN and ICC
Cell density was statistically significantly reduced in all investigated auditory structures at 1 week post-exposure (PTS group). This was true for the high-frequency (HF; p < 0.001 by U-test), as well as the low-frequency (LF; p < 0.001 by U-test) portion, of the DCN, where the normalized cell numbers were 81.5 ± 1.4 and 84.6 ± 1.7, respectively, in controls, and 49.6 ± 0.6 (−39%) and 59.4 ± 0.9 (−30%), respectively, in the PTS group (Fig. 4). Normalized means were decreased from 105.5 ± 2.1 to 73.4 ± 1.2 (−30%) in the VCN (Fig. 3; p < 0.001 by U-test), and from 503.3 ± 6.2 to 347.5 ± 7.0 (−31%) in the ICC (Fig. 5; p < 0.001 by U-test).
MGB
In the MGB, all three subdivisions were strongly affected at 1 week after the noise exposure. Cell numbers declined from 104.7 ± 2.2 to 72.3 ± 1.7 (−31%) in the dorsal part (p < 0.001 by t-test), from 212.0 ± 4.7 to 153.2 ± 3.2 (−28%) in the ventral part (p < 0.001 by U-test), and from 104.2 ± 2.1 to 71.5 ± 1.5 (−31%) in the medial part (p < 0.001 by U-test) of the MGB (Fig. 6).
AC
Cell loss was also detectable in the majority of the layers of the primary auditory cortex (Fig. 7). In layer I, the number of neurons was reduced by 18%, from 32.0 ± 0.7 to 26.3 ± 0.8 (p < 0.001 by t-test). This reduction was less pronounced, but also statistically significant, in layers III, IV, V, and VI in the experimental group compared to controls (layer III: 66.7 ± 1.4 to 60.1 ± 1.7 [−10%], p = 0.003 by t-test; layer IV: 56.2 ± 1.0 to 48.4 ± 1.0 [−14%], p < 0.001 by t-test; layer V: 71.1 ± 1.6 to 61.0 ± 1.5 [−14%], p < 0.001 by t-test; layer VI: 64.9 ± 1.0 to 57.6 ± 1.3 [−11%], p < 0.001 by t-test). No statistically significant effects were seen in layer II of the primary auditory cortex (Fig. 7; p = 0.088 by t-test).
Discussion
In the present study we have described for the first time dramatic changes within the neuronal cytoarchitecture of all key structures of the central auditory pathway following a single exposure to noise for just 3 h. Immediately after the acoustic stimulation, a marked reduction in cell density could be seen in the VCN. One week later, the cell density of all other investigated central auditory structures was also affected. These pathophysiological processes and their specific temporal expression pattern is in sharp contrast to the functional consequences of NIHL (i.e., the pure-tone hearing loss), for which TTS shows the highest and PTS the lowest threshold shift. According to our data, it appears likely that the TTS is closely linked to transient effects within the peripheral part of the auditory pathway (i.e., the cochlea), while PTS is more correlated with microstructural changes in the central auditory pathway. These findings fit well with the effects of long-term NIHL (PTS) seen in humans. In patients with tinnitus or hearing loss, a decrease in grey-matter volume within the central auditory pathway has been reported, which is combined with reduced speech intelligibility despite good tonal hearing (Harris et al., 2009; Landgrebe et al., 2009).
Central correlates of TTS
One important effect on peripheral structures that could contribute to the TTS is the partially-reversible destruction of sensory tissue (Henderson et al., 2006; Hirose and Liberman, 2003; Wagner et al., 2005). With a noise exposure paradigm similar to the one used in this study, Wang and associates (2002) were able to demonstrate acute irreversible changes in the morphology of stereocilia, followed by sensory degeneration. We believe that a similar effect on cochlear hair cells in the present study may be involved in short-term hearing loss (TTS), as well as in the PTS. Furthermore, the altered cytoarchitecture in the VCN may also contribute to the auditory symptoms due to the TTS. The reduced cell density in the VCN may be induced by the overstimulation of neurons, which is accompanied by an intense calcium influx. This in turn leads to toxic neurodegenerative processes such as necrosis or apoptosis (Hutchins and Barger, 1998; Mattson, 2007). Further, high levels of intracellular calcium trigger enhanced neurotransmitter release into the synaptic cleft, and can induce glutamate excitotoxicity due to changes in ionic homeostasis (Arundine and Tymianski, 2003; Greenwood and Connolly, 2007; Yu et al., 2001). Excessive neuronal activation can be followed by ischemia in the stimulated brain regions. This leads to the formation of reactive oxygen species (ROS) and free radicals, and to mitochondrial dysfunction that can induce cell death (Serrano and Klann, 2004). These mechanisms have been shown to produce apoptosis and necrosis in peripheral auditory structures (i.e., the hair cells) with NIHL, and that these processes begin immediately post-exposure (Henderson et al., 2006; Hoya et al., 2004; Nuttall, 1999). Similar effects may also be responsible for the acute changes in central auditory structures (i.e., the VCN) seen in the present study.
Kujawa and Liberman (2009) recently showed that primary neurodegeneration within the auditory pathway may occur over the short term. In their study, moderate (100-dB SPL octave band noise for 2 h) noise exposure caused completely reversible damage to the cochlea, but led to an acute loss of afferent nerve terminals and delayed degeneration of the cochlear nerve (Kujawa and Liberman, 2009). Comparable synaptic changes after high-level noise exposure are also assumed to have played a role in our study, contributing to acute hearing loss as well as to long-lasting central neurodegeneration caused by deafferentation.
It is unclear why acute central nervous system changes were only seen in the VCN. One explanation is that the excitotoxicity is caused by the stronger direct afferent cochlear input into the VCN compared with the DCN. The DCN receives stronger multisensory innervations than the VCN (Ferragamo and Oertel, 2001; Shore et al., 2008). Further, an acute effect may occur due to the high density of a particular AMPA receptor-type in the large end bulb of Held synapses in the VCN, requiring rapid transmission of auditory information from auditory nerve endings to the brainstem (Wang and Manis, 2008). These AMPA receptors mainly contain GluR3 and GluR4 subunits, and lack the GluR2 subunit (Wang et al., 1998). This GluR2-lacking AMPA type is calcium permeable, which could have profound effects on neuronal physiology, but may also be linked to excitotoxicity (Petralia et al., 2000). An additional protective mechanism may arise from short-term plastic changes in post-synaptic AMPA receptor densities during noise exposure, as have been demonstrated in the spiral ganglion neurons within the auditory nerve (Chen et al., 2009), or protection may be due to suppression by inhibitory interneurons of neural activity of neurons projecting from the CN to higher structures (Ryan et al., 1992).
Central correlates of PTS
There are several reports in the literature about the long-term destructive consequences of noise exposure for peripheral and central auditory structures (Gil-Loyzaga et al., 2009; Henderson et al., 2006), and the PTS demonstrated in the present study at 1 week post-exposure is similar to that observed in previous studies (Basta et al., 2005; Basta and Ernst, 2005).
The described decrease in cell density is also in accord with earlier studies that demonstrated anatomical changes related to apoptosis-inducing processes and tissue shrinkage (Aarnisalo et al., 2000), axon degeneration (Kim et al., 1997, 2004), and loss of synaptic connectivity (Benson et al., 1997; Kane, 1974) in the auditory brainstem. Further, changes in synaptic connectivity at the calyx of Held synapses in the trapezoid body (Jean-Baptiste and Morest, 1975), and a reduction of cell density in the MGB and primary auditory cortex (Basta et al., 2005), have also been observed. The large amount of cell loss seen in the present study is comparable to that shown in an earlier report (Basta et al., 2005). Similar observations have been made in other sensory systems after deprivation of external input (Kawabata et al., 2003; Mandairon et al., 2003; Xerri and Zennou-Azogui, 2003).
The lack of changes in layer II of the primary auditory cortex may be because this layer receives no direct input from subcortical auditory structures (Read et al., 2002). Therefore changes in auditory properties may influence layer II cells to a lesser degree. Neuronal injury may begin earlier in some cell types than in others, and thus the variety of tissues that make up the auditory pathway may be another explanation (Frisina and Walton, 2001).
The underlying mechanisms that contribute to the observed decline in cell density are not yet fully understood. One pathological mechanism may be that rapid neuronal depolarization and a hypoxic state during a critical period in a substantial population of neurons leads to a spreading depression that results in a collapse of evoked electric activity and tissue damage (Somjen, 2001).
Another possible explanation may be that the reduced peripheral input present after cochlear damage elicits plastic changes within the different auditory brain areas. Several studies have found long-lasting mechanisms indicating neural plasticity due to upregulation of some types of neurotrophins and growth-associated proteins in central auditory nuclei (Kraus et al., 2009; Suneja et al., 2005). Moreover, one characteristic feature of plasticity of the central auditory system is the deterioration of inhibition of the subcortical auditory nuclei and the auditory cortex, which can change dynamically (Syka, 2002). This remarkable adaptive nature of the plastic changes in auditory processing, which depends on sensory input alterations after noise-related injury (Dahmen and King, 2007), was also found in the present study.
The neural network induces apoptosis in neurons that are deprived of external input, whereas existing projections are strengthened, as can be seen during development of the nervous system (Gordon, 1995; Hutchins and Barger, 1998; Nelson and Turrigiano, 2008), and may be a result of optimizing energy demands (Hughes et al., 1999). Studies have shown that these mechanisms can be triggered by top-down processes from cortical structures (Kotak et al., 2005; Salvi et al., 2000; Syka and Rybalko, 2000; Turrigiano et al., 1998).
Taken together, these dynamic, plastic changes of the central auditory system seen after noise exposure may explain the remarkable effects we observed at 1 week post-exposure in our study.
Conclusion and outlook
Noise exposure has long-term detrimental effects on the auditory pathway, but causes only temporary damage to the sensory (cochlear) areas, and future studies should be carried out to identify the specific cell types that are involved, as well as the sequence of events that occur within this pathophysiological cascade.
The results detailed here may soon help clinicians to better understand the complex psychoacoustic consequences of NIHL, such as tinnitus, reduced speech intelligibility, and hyperacusis.
Footnotes
Author Disclosure Statement
No competing financial interests exist.