




Abstract
To verify the usefulness of diffusion tensor imaging (DTI) and fiber tractography (FT) compared with routine magnetic resonance imaging (MRI) in patients with cervical spinal cord injury, and to clarify the relationship between motor and sensory impairments and DTI and FT parameters, we performed routine MRI and DTI on 10 patients with chronic cervical spinal cord injury and on 10 controls. Quantitative parameters of DTI, such as fractional anisotropy (FA) and apparent diffusion coefficient (ADC), were calculated for each cervical cord level. FT parameters of imaginary crossing fiber numbers were also determined at the C3 level, from C3–C6, and from C3–C7, as well as each connection rate. All patients' clinical motor and sensory functions were examined using the International Standards for the Neurological Classification of Spinal Cord Injury (ISCSCI). FA values in the controls and patients were 0.76 ± 0.08 (mean ± standard deviation) and 0.58 ± 0.11, respectively, and ADC values in the controls and patients were 1.29 ± 0.75 × 10⁻³ mm2/sec and 1.26 ± 0.66 × 10⁻³ mm2/sec, respectively. In patients with cervical cord injury, abnormal cervical levels detected on routine MRI were not correlated with clinical findings and DTI parameters, but FA of DTI was correlated with motor function, as were imaginary crossing fiber numbers and connection rates of FT. Quantitative DTI and FT analyses were useful in the evaluation of patients with cervical spinal cord injury. The injured cervical spinal cord can be evaluated in more detail and more precisely using DTI and FT, for which findings are correlated with clinical findings such as neurological impairments.
Introduction
Clinical evaluation is generally performed to ascertain the neurological function of patients with SCI. The International Standards for the Neurological Classification of Spinal Cord Injury (ISCSCI; American Spinal Injury Association, 2003), revised from the American Spinal Injury Association (ASIA) scale in 2002, is widely used and is known to be well correlated with the functional status and prognosis of these patients. However, the clinical evaluation method has some limitations, because it depends on the patient's subjective information. For instance, it is difficult to differentiate between SCI and additional trauma to the peripheral nerves, musculoskeletal system, or brain, as well as pre-existing psychological problems (Shields et al., 2006; Tolonen et al., 2007). The precision of clinical evaluation is poor in children younger than 15 years (Mulcahey et al., 2007), and is insufficient for reliably monitoring the effects of therapy on the injured spinal cord (Dietz and Curt, 2006).
Conventional magnetic resonance imaging (MRI) is the imaging study of choice for assessing the spinal cord parenchyma (Scholtes et al., 2006), and performs best in showing extrinsic compression of the spinal cord (Miyanji et al., 2007). In several studies it was reported that abnormal MRI findings in the spinal cord, such as intramedullary hemorrhage, cord edema, and severe cord compression, may affect the clinical outcome (Miyanji et al., 2007; Selden et al., 1999; Shimada and Tokioka, 1999; Song et al., 2005). However, conventional MRI has low sensitivity for diffuse abnormalities in the white matter, thereby limiting the associations with clinical status (Bakshi et al., 2008). In a previous study researchers reported no correlation between intramedullary hemorrhage seen on conventional MRI at the acute stage and ASIA motor scores (Collignon et al., 2002).
Diffusion tensor imaging (DTI), which is an MRI technique for evaluating the translational diffusion of extracellular water molecules, has been used for quantitative evaluation of structural features and orientation of the central nervous system (Clark and Werring, 2002). DTI can even delineate axonal organization in white matter of the brain that appears normal on conventional MRI (Hesseltine et al., 2006; Mori and Zhang, 2006; Yu et al., 2008). Fiber tractography (FT) from DTI measurements is a technique that uses specialized tracing algorithms to obtain a three-dimensional reconstruction of white matter tracts in the central nervous system (Mukherjee et al., 2008a). This technique is commonly used for evaluating fiber directions and defects in the brain. In addition, DTI and FT can be applied to the spinal cord, because many tracts are located in the white matter of the spinal cord, and these bundles appear similar to those in the brain.
After DTI and FT were first applied to the human spinal cord in 1999 (Clark et al., 1999), their use was focused on multiple sclerosis (Hesseltine et al., 2006), transverse myelitis (Renoux et al., 2006), cervical spondylotic myelopathy (Demir et al., 2003), and cervical stenosis (Facon et al., 2005). Because the spinal cord is relatively small in size, DTI is less widely used for the spinal cord than for the brain. Motion artifact is caused by cerebrospinal fluid (CSF) pulsation and respiration, and by rapid spatial changes in the spinal column (Clark and Werring, 2002). DTI and FT for SCI have recently been applied to animals (Deo et al., 2006) and humans (Ellingson et al., 2008b; Shanmuganathan et al., 2008). However, no previous study has evaluated the usefulness of DTI and FT in patients with spinal cord injury. Moreover, the relationships among DTI and FT parameters and clinical status and functional prognosis in patients with cervical cord injury have yet to be addressed.
In this study, we aimed to evaluate the useful parameters of DTI and the FT patterns of normal subjects compared with patients with cervical spinal cord injury, and to clarify whether these parameters have clinical significance beyond those of routine MR imaging.
Methods
Subjects
We evaluated 10 patients with chronic cervical SCI (more than 1 month post-injury) and 10 controls. Among the 10 patients, 9 had a history of cervical cord trauma, and 1 had non-traumatic transverse myelitis. Of the patients with complete injury, was ASIA A, one was ASIA B (motor complete), and five had incomplete injury of the central cord (Tables 1 and 2). All patients had clinical symptoms and signs suggestive of cervical myelopathy, except for one patient who had recovered completely before MRI and DTI were performed (Tables 1 and 2). All controls were free of symptoms and signs suggestive of cervical myelopathy, and no visible cervical cord lesions were seen on conventional MRI. To improve the accuracy of clinical evaluation, patients who had any additional trauma to the peripheral nerves, brain, or bone, and young patients (<15 years old) were excluded. This research was done in accordance with a research protocol approved by the Institutional Review Board of Dankook University Hospital, Cheonan, Korea.
ASIA, American Spinal Injury Association; MRI, magnetic resonance imaging; DTI, diffusion tensor imaging; FT, fiber tractography.
Clinical evaluation
All patients received a physical examination using the ISCSCI to evaluate motor and sensory function at the time that MRI and DTI studies were obtained. We calculated the motor scores from C5 to T1, and the sensory scores from C2 to T1, separately from the total motor and sensory scores, so that clinical results could be compared with cervical cord abnormalities demonstrated by MRI, DTI, and FT.
MR data acquisition
Conventional sagittal T2-weighted images were acquired using a T2-weighted fast spin-echo (FSE) sequence (image matrix = 640 × 384; section thickness = 3 mm; no intersection gap; TR/TE = 5030/118 msec; echo train length = 23; FOV =260 mm; NEX = 2; scan time = 1 minute 42 seconds) using a 1.5-T MR scanner (Signa; GE, Milwaukee, WI). For DTI, diffusion-weighted single shot echo-planar images (EPIs) were acquired in the axial plane between spinal levels C2 and T1 (image matrix = 256 × 256; voxel dimension = 0.9375 × 0.9375 mm; section thickness = 4 mm with no intersection gap; FOV =240 mm; NEX = 1; scan time = 4 minutes 9 seconds; number of slices = 24–28, depending on the length of the entire cervical spine in each control and patient). Diffusion encoding was in 25 non-colinear gradient directions with 2 b values (b = 0 and 500 sec/mm2). To determine the corresponding spinal levels of the EPIs, we also obtained axial T1-weighted images at the same level as the EPIs in controls and patients (image matrix = 256 × 256; section thickness = 4 mm with no intersection gap; TR/TE = 500/10 msec; FOV = 240 mm; NEX = 2; scan time = 3 minutes 16 seconds; the number of slices was the same as for the EPIs).
Data analysis for DTI and FT
We determined spinal cord levels C3 to T1 using T2-weighted MRI matched to DTI. The investigator who analyzed the DTI and FT images was blinded to the clinical status of the patients before analysis. After the spinal level was determined using a T2-weighted sagittal image, we set the cervical cord levels in the sagittal plane, using the image showing the relationship between the spine and spinal cord levels for reference (Henry et al., 1985), and then matched the axial images with the FA map and T1-weighted images at the same level for each control and patient. The diffusion tensor measures (FA and ADC) were calculated on a voxel-by-voxel basis using dedicated software (MedINRIA Ver. 1.6.0, available free at
In addition to the tensor measures, three-dimensional fiber tracts were created using the principal diffusion directions method, for which the eigenvector corresponding to the largest eigenvalue is extracted from the diffusion tensor field generated from the DTI datasets in the region where diffusion was linear, typically for a FA thresholding value of 0.18, and an angulation threshold of 45°. To obtain reliable spinal cord anatomy, the algorithm employed in the software was optimized to take into account the FA values in neighboring voxels in white matter tracts mostly oriented in the longitudinal plane (
For FA and ADC analyses, two axial EPIs at each cervical cord level from C3 to T1 (C3, C4, C5, C6, C7, C8, and T1) were selected, and a total of 16 voxels in four directions (anterior, posterior, and both lateral) at each level were chosen, respectively, within the FA and ADC maps based on the procedure of Deo and associates (Deo et al., 2006). In selecting the regions of interest, we took great care to avoid regions of gray matter, blank areas, CSF partial volume effects, and motion artifacts. The mean values of FA and ADC were used for analysis of each cervical cord level. We set ROIs in the axial plane at three levels (C3, C6, and C7) of the cervical spinal cord; the program then calculated the numbers of imaginary fibers crossing the regions of interest at the C3 level, at the level between C3 and C6, and at levels C3 to C7 (Fig. 1). The connection rate at C6 or C7 was obtained as shown below:
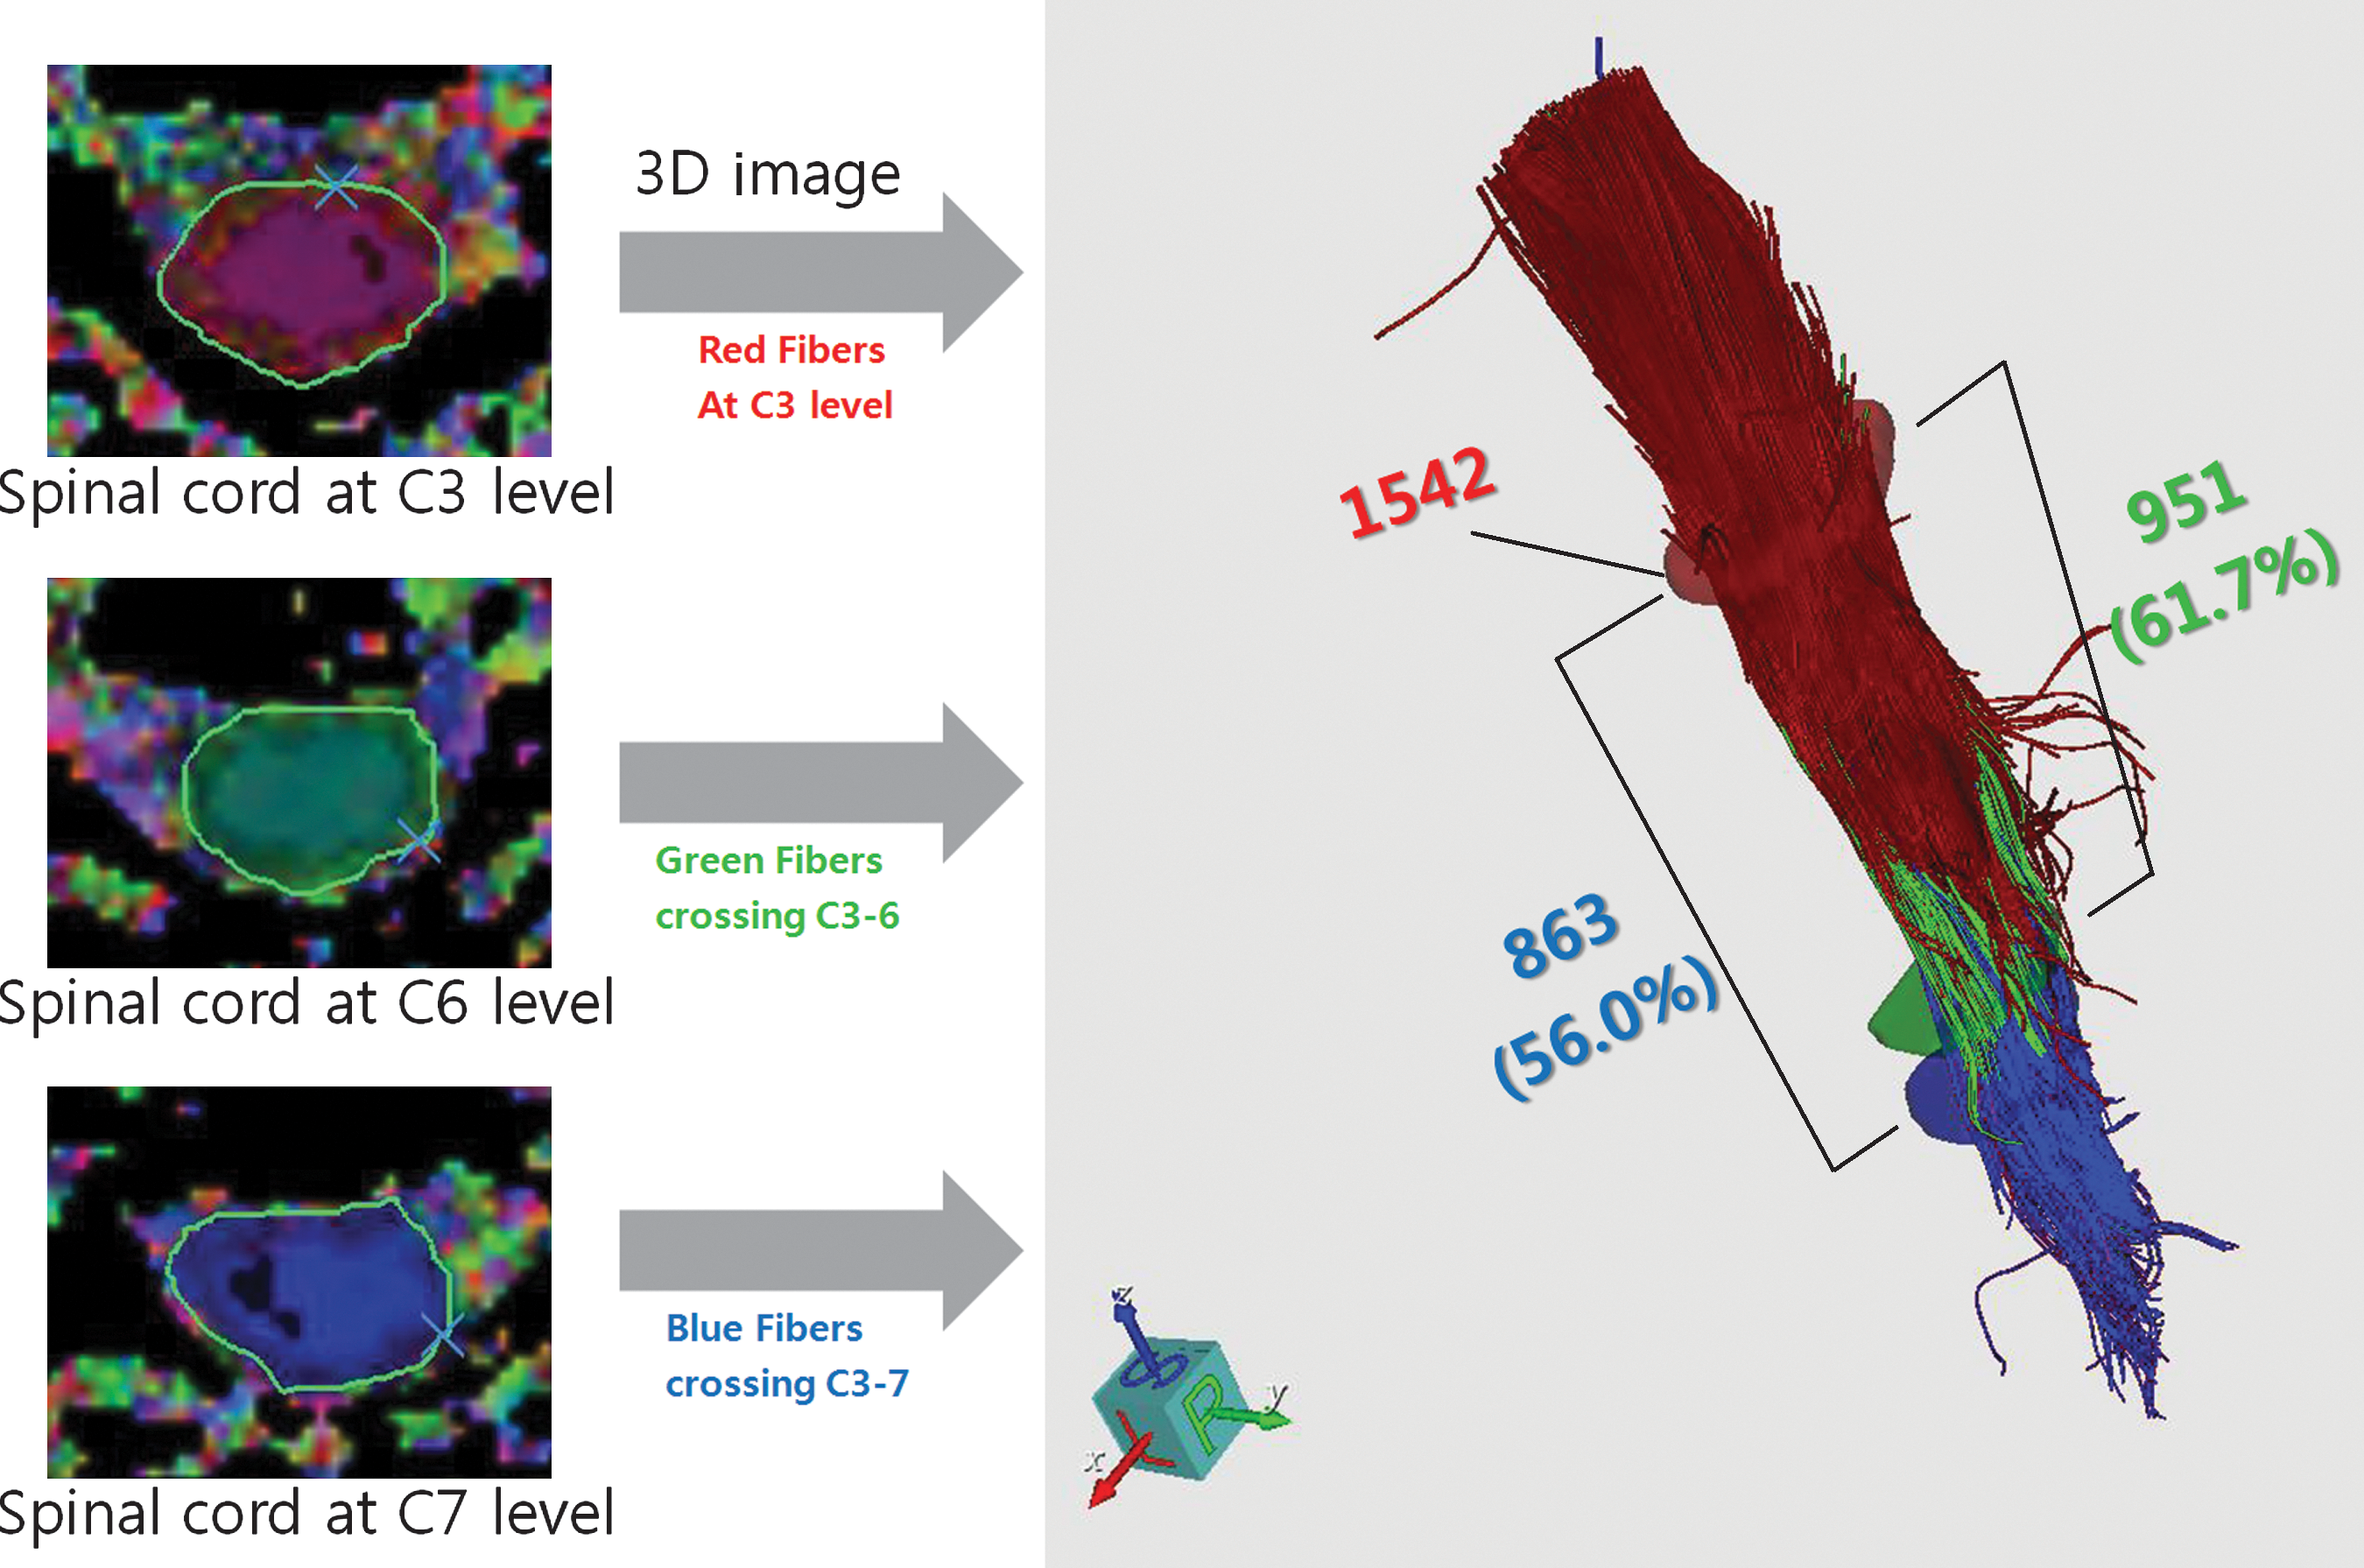
Examples of the fiber tractography analysis process. The regions of interest at the C3 (red), C6 (green), and C7 (blue) levels with the axial plane were set, and the imaginary fiber numbers crossing the C3 level (red number; 1542), crossing from C3 to C6 (green number; 951), and crossing from C3 to C7 (blue number; 863), and each connection rate (61.7% at the C6 level and 56.0% at the C7 level) were calculated. Color image is available online at
We compared the values of FA; ADC; imaginary fiber numbers at C3, from C3 to C6, and from C3 to C7; and the connection rates at C6 and C7 in the controls with those in the patients.
Statistic analysis
SPSS v. 15.0 (SPSS Inc., Chicago, IL) was used for data analysis. To verify whether the DTI parameters differed among each level from C3 to T1, one-way analysis of variance (ANOVA) was performed in the controls. Spearman's rho correlation analysis was used to determine correlations between clinical function and DTI and FT parameters. Significance was set at p < 0.05.
Results
The clinical profiles and conventional MRI findings of all patients at the time of taking the EPIs for DTI and FT are summarized in Table 2. Hemorrhage was not seen on initial MRI in any of the patients. In all patients, conventional MRI revealed cord edema at levels between C3 and C7. The level of injury did not change significantly from the time of initial MRI to the time of follow-up MRI. Initial clinical findings including motor and sensory status immediately after injury were not included because of concern that the presence of spinal shock and the poor cognitive state of the patients during this acute stage could make this assessment misleading (Knafo and Choi, 2008). T2-weighted MRI, motor and sensory function, and the DTI and FT values of all patients are shown in Figure 2, in which the blue bars indicate the spinal level with abnormalities found on conventional MRI, and the brown and yellow bars indicate the spinal levels showing complete paralysis and partial paralysis, respectively. The numbers in these bars represent the ASIA scores. The green and dark green bars indicate the spinal levels of abnormal FA and ADC, respectively. In patient A (the patient with complete injury), there was no visible connection crossing the lesion on FT. Minimal connections crossing the lesion were seen in patients B, C, and D, who had complete motor paralysis with sensory sparing. Patients E–I had incomplete injury of the central cord type, and their overall imaginary fiber numbers were higher than in patients with complete or motor complete paralysis. Three of these five patients even showed normal imaginary fiber numbers at the C3 level. While overall abnormal findings on T2-weighted MRI were restricted to only a few levels, motor and sensory dysfunction extended beyond the injury site, and were clearly apparent as DTI and FT abnormalities. Patient J had recovered completely by the time of the MRI and DTI evaluations; this patient's FA values and all FT parameters were normal, despite abnormal findings visible across three cervical levels on conventional MRI. In patient I, motor dysfunction was present only on the right side, and the imaginary fibers visible on FT were deviated to the left side.
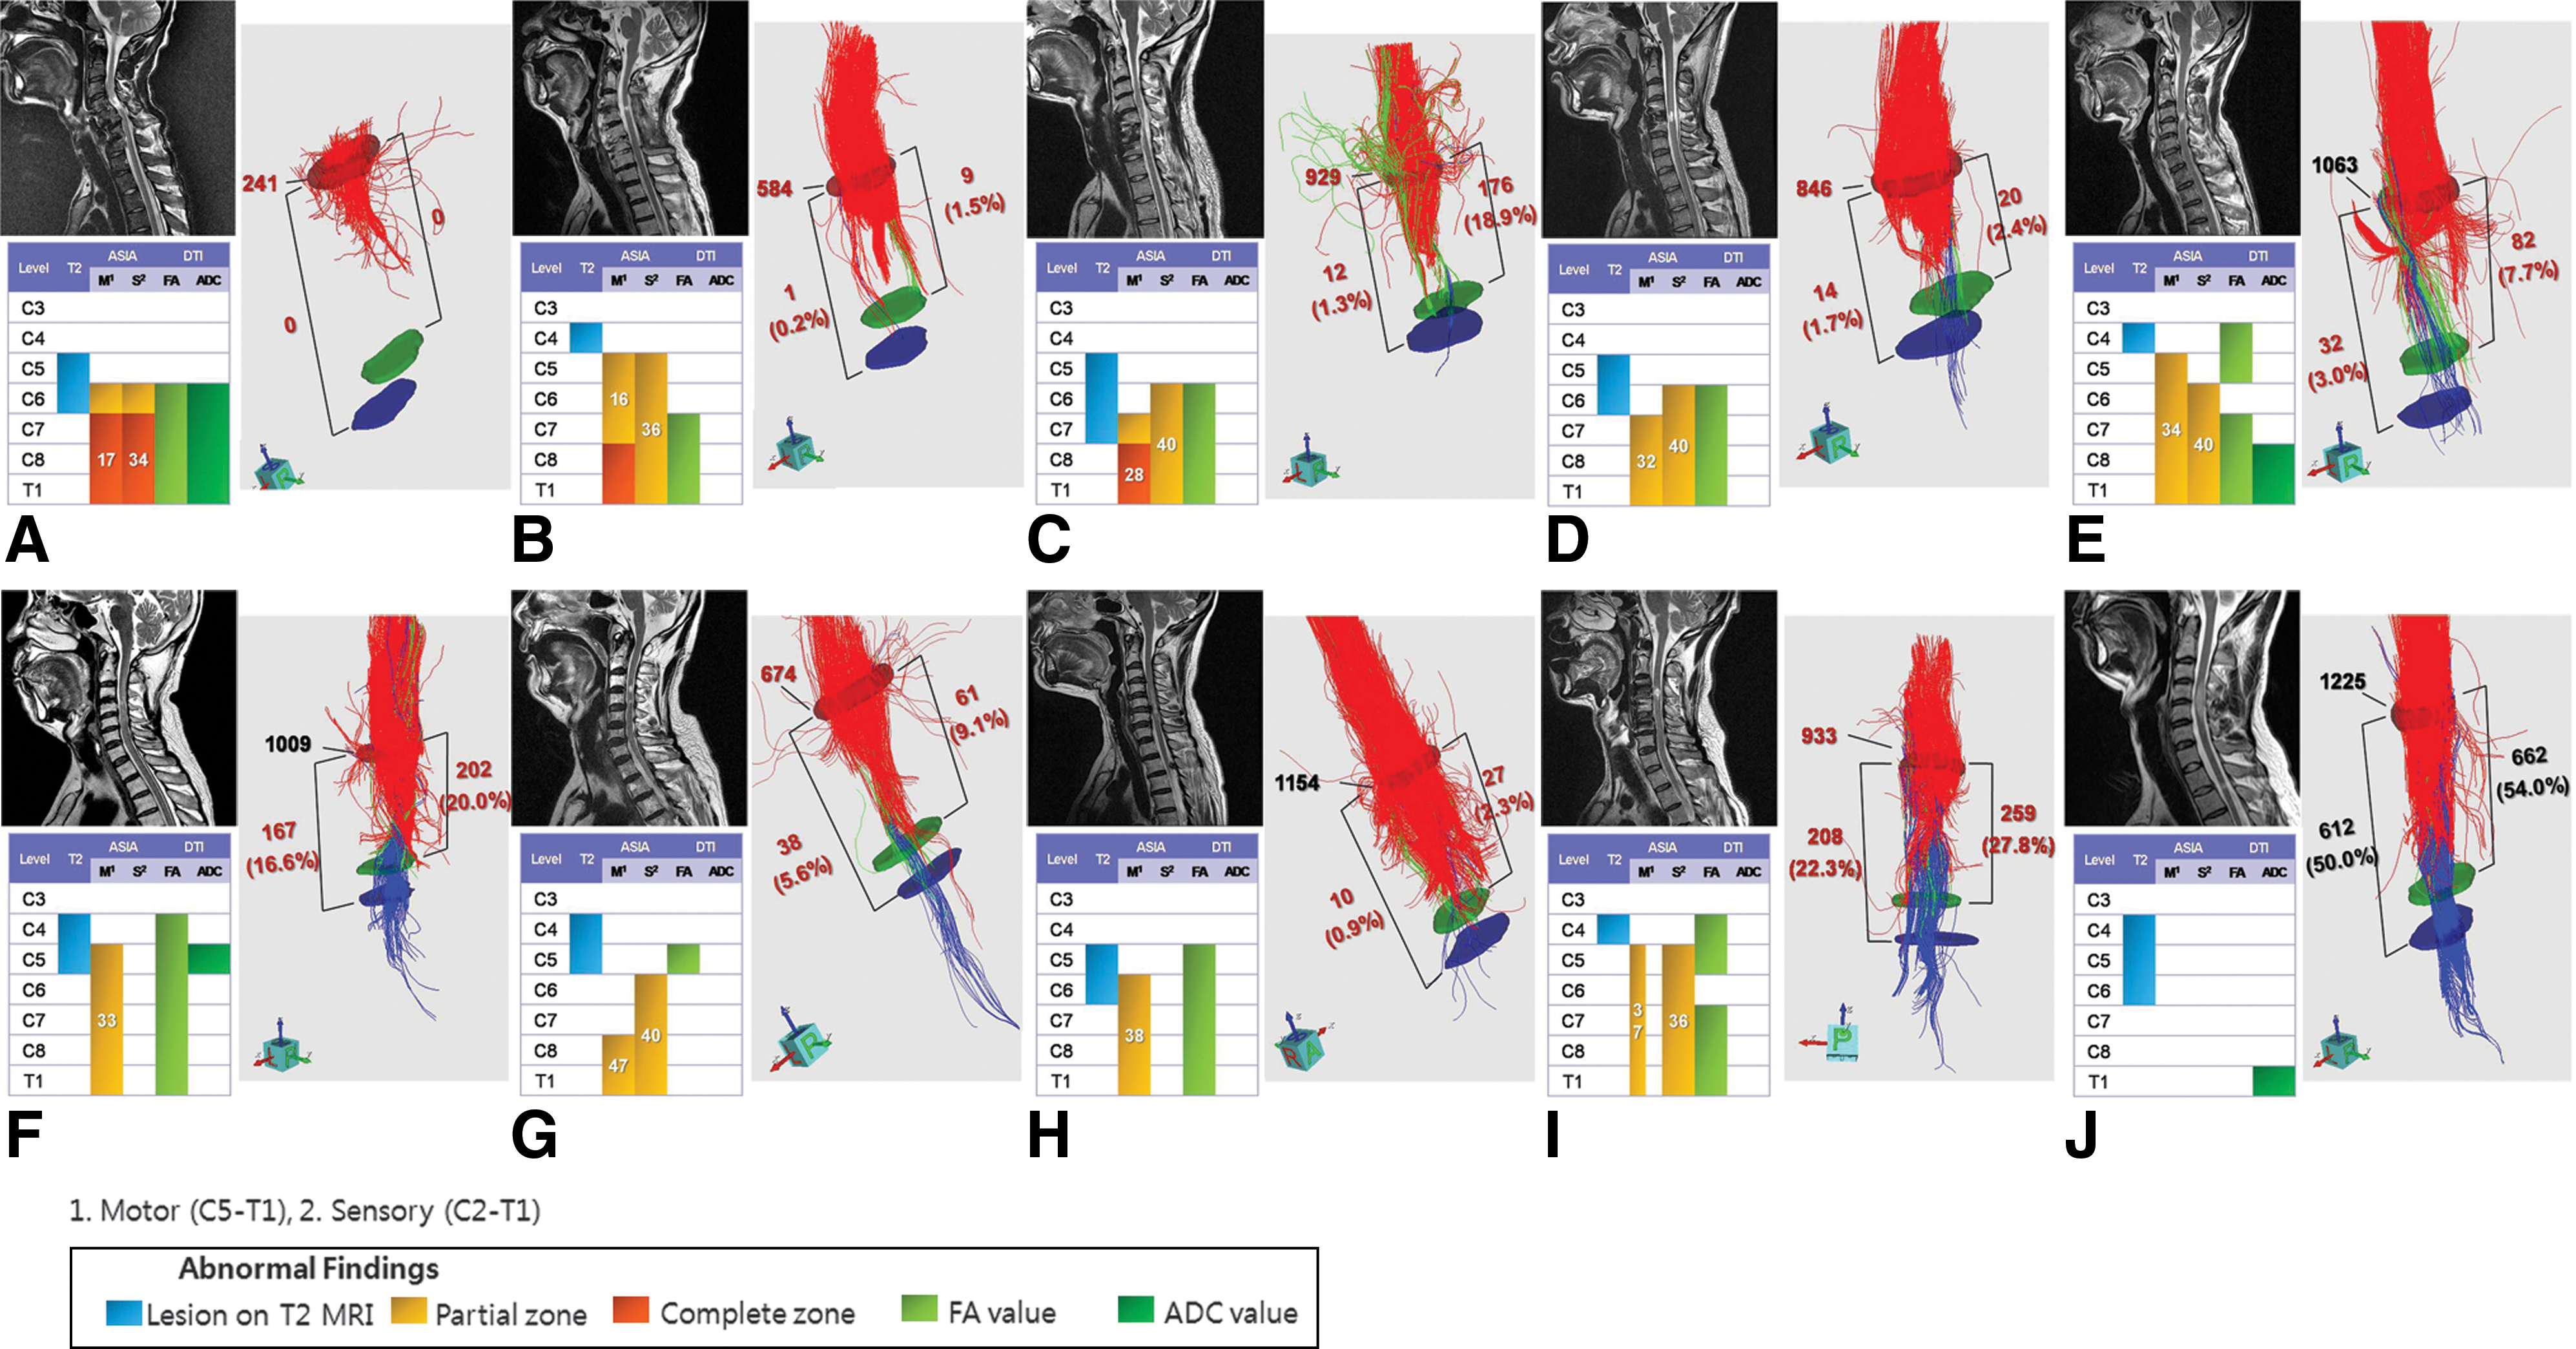
Comparison of T2 MRI, DTI, FT, and clinical status in 10 patients with cervical spinal cord injury. (
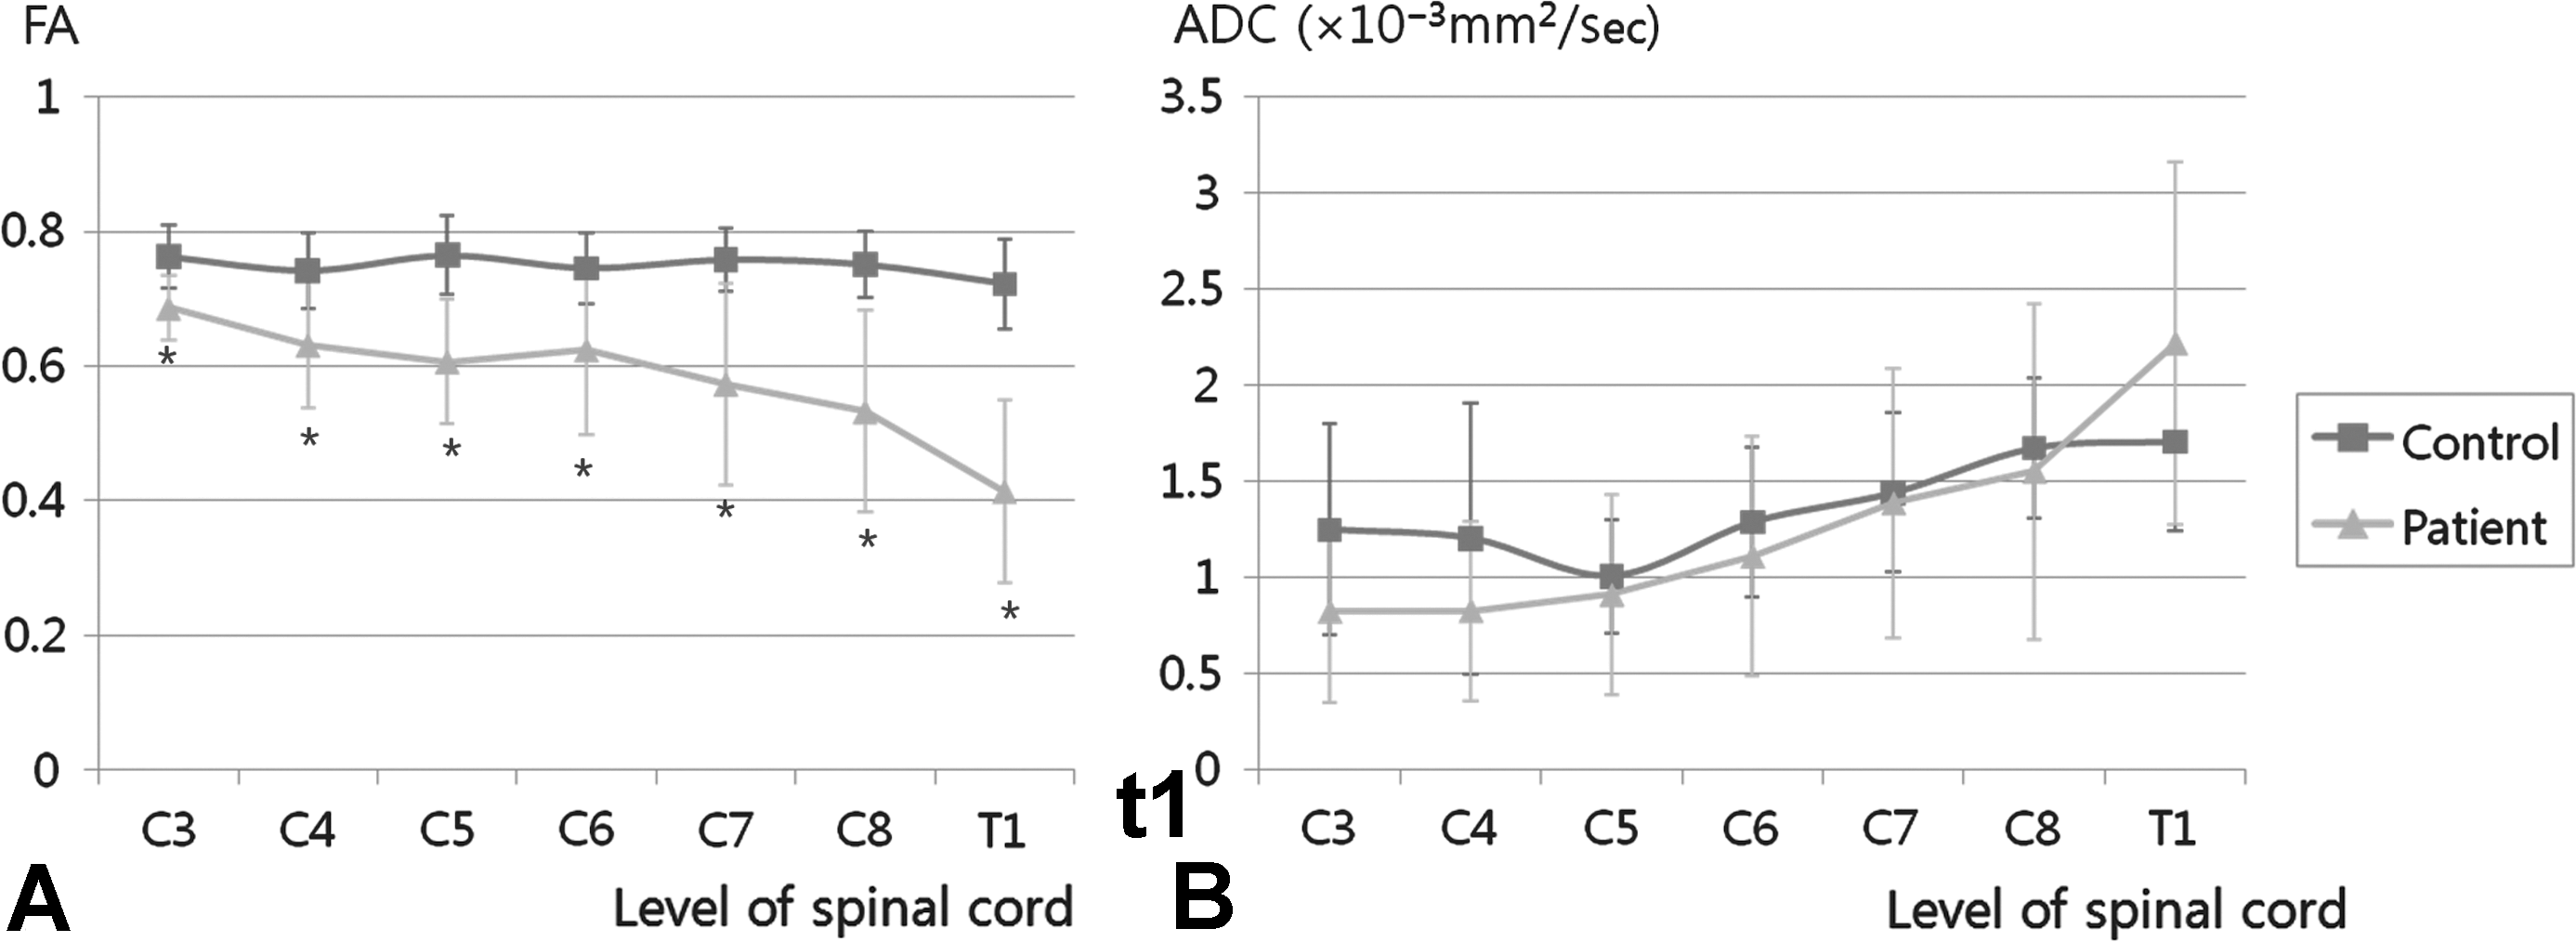
The FA values in the controls and patients were 0.76 ± 0.08 (mean ± standard deviation) and 0.58 ± 0.11, respectively, and the ADC values in the controls and patients were 1.29 ± 0.75 × 10⁻³ mm2/sec and 1.26 ± 0.66 × 10⁻³ mm2/sec, respectively. No statistically significant differences were found for FA values among the cervical levels in the controls. The FA values of all cervical spinal cords in patients with SCI were lower than those in controls (p < 0.05 by independent t-test), but the ADC values were not statistically significantly different between patients and controls (Fig. 3). The imaginary fiber numbers at the C3 level and the crossing fiber numbers from C3 to C6 and from C3 to C7 were 1442.1 ± 232.2, 940.0 ± 300.5, and 789.4 ± 226.0, respectively. The connection rates from C3 to C6 and from C3 to C7 were 64.6 ± 15.6% and 55.0 ± 15.5%, respectively (Table 3). The lower limits of the imaginary fiber numbers and connection rates at each level were determined by subtracting two standard deviations from the mean values (Table 3).
(
Among the patients, there was a strong correlation between the number of abnormal motor levels from levels C5 to T1 and the number of abnormal FA levels; however, the number of abnormal MRI levels and ADC levels were not correlated with the number of abnormal motor and sensory levels (Table 4). All imaginary fiber numbers and connection rates calculated using FT correlated with motor scores from levels C5 to T1 (Table 5).
p < 0.05 by Spearman's rho correlation analysis.
FA, fractional anisotropy; ADC, apparent diffusion coefficient; MRI, magnetic resonance imaging; DTI, diffusion tensor imaging.
p < 0.05, **p < 0.01 by Spearman's rho correlation analysis.
FT, fiber tractography.
Discussion
DTI is well established for evaluation of the brain, but not for the spinal cord, because of the relatively small size of the spinal cord, the motion artifacts due to CSF pulsation and respiration, and the rapid spatial changes in the spinal column (Clark and Werring, 2002). Because most of the nerve fibers in the white matter of the spinal cord are directed longitudinally and appear to be simpler than those in the brain, there should be less error in evaluating DTI parameters of the spinal cord. Spinal cord DTI can clearly show displacement and deformation of the white matter tract at the pathological level of the spinal cord (Vargas et al., 2008). Many researchers have recently demonstrated the usefulness of spinal cord DTI in the fields of multiple sclerosis (Hesseltine et al., 2006), transverse myelitis (Renoux et al., 2006), cervical spondylotic myelopathy (Demir et al., 2003), and cervical stenosis (Facon et al., 2005).
FA and ADC are widely used parameters for quantification of DTI, and many investigators report changes in these parameters in spinal cord lesions. FA values take advantage of the improved directional evaluation of water diffusivity in abnormal areas, and are generally decreased in the presence of local extracellular edema, or where a reduced number of fibers results in increased extracellular space clinically (Facon et al., 2005). ADC values are thought to be useful in monitoring the progression of recovery from SCI (Ellingson et al., 2008b). Renoux and associates (2006) found that FA values were decreased in abnormal areas seen on T2-weighted MRI, and in cases of neurological deficit without T2-weighted MRI abnormalities in patients with myelitis, but ADC values were variable. Facon and colleagues (2005) also found that FA values had much higher sensitivity and specificity than T2-weighted MRI and ADC values in patients with spinal cord compression. Ozanne and associates (2007) found that FA values in patients with poor clinical scores were decreased in cases of arteriovenous malformation of the spinal cord, but that the ADC values were variable. A previous in vivo study demonstrated that FA values of injured cords during an experimental period of 14–56 days after injury were lower than those of uninjured normal cords (Deo et al., 2006). The present results also show that the FA values of injured levels in patients with SCI are much lower than those of intact levels or controls, and that the ADC values do not differ between abnormal and normal levels in patients and controls.
FT, which is another important parameter of DTI measurement, can be used to better understand the three-dimensional structure of white matter tracts in the brain and spinal cord. Renoux and associates (2006) used FT to identify fiber interruptions in the spinal cords of patients with myelitis. Okada and colleagues (2007), using perinidal FA and the number of voxels along fiber tracts as determined by tractography, calculated left-to-right asymmetry indices to evaluate the corticospinal tract and optic radiation in the brain, while Stadlbauer and associates (2008a, 2008b) counted the number of fibers and the number of streamlines crossing two ROIs determined manually within white matter tracts in the brain. The latter authors used the number of fiber projections per voxel to measure the fiber density of selected fiber bundles.
The present data suggest that DTI parameters and calculation of imaginary fiber numbers in the spinal cord are effective for delineating the status of damage to the white matter tracts in patients with SCI. As summarized in Table 4, among the three DTI parameters, only the numbers for abnormal FA levels showed a statistically significant correlation with those for abnormal motor levels, but not for sensory levels. The present study is therefore the first to find a correlation between clinical data and DTI parameters. Although Deo and colleagues (2006) reported no correlation between hindlimb locomotor scores and FA values in rats after SCI, there were no data to enable a comparison of FT parameters with sensory and motor function. Ellingson and associates (2008a) found that patients with chronic cervical or thoracic spinal cord injuries showed lower FA values at the lesion sites, and that FA values were also lower in patients with complete injury. However, they did not compare DTI parameters with the clinical status of motor and sensory dysfunction separately, and no FT parameters were obtained. Detailed clinical data, such as the neurological level of injury, motor and sensory scores, and ASIA impairment scale assessments, are essential to establish prognosis for patients with SCI who have motor and sensory impairments; however, clinical data alone are subjective, and thus their usefulness is limited.
Based on the results of the present study, we suggest that it is possible to assess impaired motor function objectively using spinal cord DTI. Nevertheless, our findings do not imply that the level of abnormal FA values must correlate with the level of abnormal motor function. Motor pathways such as the corticospinal tracts are descending tracts; therefore abnormal direction of the efferent pathways expressed as abnormal FA values on DTI might affect motor function at lower levels of the spinal cord. In the present study, the starting level of abnormal FA values was more proximal than that of motor dysfunction in five of nine patients who showed motor dysfunction.
We found that most of the abnormal conventional MRI areas overlapped with the abnormal FA areas (8 patients, 80%), but conventional MRI did not show abnormalities in all abnormal motor levels, especially at levels caudal to the injured site. Wallerian degeneration generally begins to develop toward the distal part of an injured neuron just after axonal injury, and can be detected even at sites distant from the lesion in animal models (DeBoy et al., 2007; Zhang et al., 2009). The decrement of FA below the lesion was also observed in a human study in patients with chronic spinal cord injuries, and the decrement below the lesion was greater in complete injury than in incomplete injury (Ellingson et al., 2008a). Most of the patients with incomplete spinal cord injury in the present study showed more motor dysfunction than sensory impairment. Therefore, disruption and wallerian degeneration would be greater in motor tracts such as the corticospinal tract than in sensory tracts, and thus abnormal FA levels would be present in a descending pattern more than in an ascending pattern.
Another interesting finding is that all fiber numbers and connection rates calculated from FT crossing C3 to C6 levels and crossing C3 to C7 levels showed strong correlations with motor scores from C5 to T1 levels in all patients (p < 0.05). The relative fiber numbers at one ROI and those crossing two ROIs were measured to calculate the relative fiber density of the selected white matter tract and connection rate, to delineate the remaining axons present after SCI. We chose to select the ROIs in four directions based on Deo's procedure (Deo et al., 2006). Although some researchers have used sagittal plane images to analyze spinal cord DTI measurements (Facon et al., 2005; Renoux et al., 2006), high-resolution axial images can generate fiber tracts consistent with well-known cord anatomy (Wheeler-Kingshott et al., 2002). In the present study it was difficult to position the ROIs to ensure that all voxels contained white matter, as the area of the spinal cord is small in relation to the voxel size. The gray matter in the human spinal cord is butterfly-shaped and located at the central region of the cord. Therefore we believed that FA and ADC values would be best obtained by positioning four equidistant ROIs to avoid the grey matter.
There were several limitations in the current study. First, because it is not possible to test each axon or tract separately due to the large voxel size (0.93–0.95 mm) compared with the axon size, the fiber numbers calculated using FT are imaginary fiber numbers derived using mathematical algorithms. Therefore, this parameter is sensitive to the quality of the DTI raw data, and is affected by measurement noise (Mukherjee et al., 2008b). Second, because individual voxels are large enough to contain many fiber tracts, it was difficult to separate corticospinal and spinothalamic tracts with high accuracy. Sensory impairment was not correlated with the level of FA abnormalities and connection rate, but the inability to separate each pathway from the spinal cord can mask abnormalities within the sensory pathway. Therefore, we need to improve the quality of echo-planar images and further reduce the size of voxels in order to analyze individual fiber tracts, and to reveal the relationship between DTI and clinical findings and prognosis. Third, in the current study, we chose an arbitrary cut-off time of 1 month post-injury, a time when functional plasticity may still be occurring. In the future, it will be necessary to evaluate temporal changes in functional plasticity using serial DTI studies of SCI. Taken together, both the technological advances in spinal DTI, and the imaging markers specific for the underlying neurobiology of SCI, will provide significant contributions to the objective evaluation of SCI patients.
In summary, our study revealed the following findings: (1) quantitative DTI and FT analyses are useful in the evaluation of patients with cervical SCI; (2) it is possible to evaluate the injured cervical spinal cord in greater detail; and (3) injuries can be correlated with clinical findings such as neurologic impairments. To delineate the usefulness of DTI and FT more precisely, however, further studies of patients with acute-stage injuries are needed, with serial follow-up and matching of results with clinical status.
Footnotes
Acknowledgments
This work was supported by a Korea Research Foundation Grant (MOEHRD, Basic Research Promotion Fund no. KRF-2007-314-E00146), a World Class University (WCU) Project (no. R31-2008-000-100069-0), and a Priority Research Centers Program (no. 2009-0093829) through the National Research Foundation (NRF) funded by the Korean government. We thank Jang Geun Hwang, Weon Bae Kim, and Seok Tae Kim for technical assistance.
Author Disclosure Statement
No competing financial interests exist.