
Abstract
More than 85% of reported brain traumas are classified clinically as “mild” using the Glasgow Coma Scale (GCS); qualitative MRI findings are scarce and provide little correspondence to clinical symptoms. Our goal, therefore, was to establish in vivo sequelae of traumatic brain injury (TBI) following lower and higher levels of impact to the frontal lobe using quantitative MRI analysis and a mechanical model of penetrating impact injury. To investigate time-based morphological and physiological changes of living tissue requires a surrogate for the human central nervous system. The present model for TBI was a systematically varied and controlled cortical impact on deeply-anaesthetized Sprague-Dawley rats, that was designed to mimic different injury severities. Whole-brain MRI scans were performed on each rat prior to either a lower- or a higher-level of impact, and then at hourly intervals for 5 h post-impact. Both brain volume and specific anatomical structures were segmented from MR images for inter-subject comparisons post-registration. Animals subjected to lower and higher impact levels exhibited elevated intracranial pressure (ICP) in the low compensatory reserve (i.e., nearly exhausted), and terminal disturbance (i.e., exhausted) ranges, respectively. There was a statistically significant drop in cerebrospinal fluid (CSF) of 35% in the lower impacts, and 65% in the higher impacts, at 5 h compared to sham controls. There was a corresponding increase in corpus callosum volume starting at 1 h, of 60–110% and 30–40% following the lower- and higher-impact levels, respectively. A statistically significant change in the abnormal tissue from 2 h to 5 h was observed for both impact levels, with greater significance for higher impacts. Furthermore, a statistically significant difference between the lower impacts and the sham controls occurred at 3 h. These results are statistically substantiated by a fluctuation in the physical size of the corpus callosum, a decrease in the volume of CSF, and elevated levels of atrophy in the cerebral cortex.
Introduction
Neuronal/axonal injury has been implicated as the leading pathologic lesion of TBI, with secondary damage resulting from numerous neurodegenerative cascades (Smith and Meaney, 2000). Traumatic axonal injury, attributed to shear and tensile stresses, typically occur in the white matter of the cerebral hemispheres, corpus callosum, and brainstem, especially in severe TBI (Hurley et al., 2004). This pattern of injury is also supported by animal models of mild and moderate TBI (Hall et al., 2008), in which cortical contusions and axonal damage have followed in the well-characterized controlled cortical impact (CCI) model (Bramlett and Dietrich, 2002; Cherian et al., 1994; Dixon et al., 1991, 1999; Gilchrist, 2004; Graham et al., 2000; MacKenzie et al., 2002; Sklar and Elashvili, 1977; Smith et al., 1997; Yu et al., 2009), with continuing post-injury subcortical cell loss (Kuroiwa et al., 2007; Yu et al., 2009). Furthermore, evidence of apoptosis at sites distal to the primary injury site continues to be seen for several weeks in experimental TBI (Conti et al., 1998; Holmin et al., 1998; Williams et al., 2006). Secondary inflammation may also play a role in progressive neuronal degeneration (Holmin et al., 1998).
A striking and unpredictable discordance is often observed between the minimal findings of qualitative MRI and the extent of neurocognitive deficits exhibited by patients with mild TBI (Bigler, 2001; Bowen et al., 1997). Based on the involvement of complex neurocognitive pathways and the scarcity of clinical MRI findings, we tested the hypothesis that mild TBI is a diffuse disorder that affects the integrity of neurons and the substructures within the brain over time. The objective of this study was to establish the evolution of a brain injury in living tissue following the event of a primary injury for a period of 5 h post-injury. This 5-h period coincides with the average time that is typically associated with accident response and hospital admission for a TBI patient (Breen et al., 2000).
Methods
Animals
The experimental protocols employed in this study were approved by the Animal Research Ethics Committee, University College Dublin, and the Department of Health and Children (Ireland), in accordance with the European Community Directive (Subregion P41/05EC Subregion license number B100/3692). The experiments were carried out using male Sprague-Dawley rats supplied by Harlan U.K., with a body weight of 340–420 g. The animals were housed in a thermoregulated environment (22°C) with a 12-h light/dark cycle. Food and water were available ad libitum (EEC, 1986).
Controlled cortical impact
The CCI model employed in this study is shown in Figure 1, and was extended by Gilchrist (2004) beyond that developed by Dixon and associates (1991). The custom-designed CCI apparatus consists of a height-adjustable, double-action pneumatic actuator (20 mm bore diameter, 8 mm connecting rod diameter, and 125 mm stroke length; model number EM-25-50-N; Bimba Company, Monee, IL). The actuator was used to control the high-speed linear motion of the impactor tip, which is attached to a stainless steel mounting arc. The velocity of impact was measured during impact with four pre-positioned reed switches on the exterior of the actuator barrel and a storage oscilloscope during each experiment. The effective area of the actuator on the out-stroke was 314 mm2, and was 264 mm2 on the in-stroke. The thrust force applied on the out-stroke (i.e. during an impact experiment) varied linearly with the gauge pressure of the compressed air, and was verified experimentally (Colgan, 2009; Gilchrist, 2004). The outer reed switches allowed the velocity to be measured prior to impact, confirming the velocity of the piston to be linear at the end of the stroke (i.e., the actuator was not accelerating). The velocity measurements were systematically calibrated to ensure that the impact velocity remained consistent within the range of air pressures used, and were also constant throughout the final 15 mm of travel of the stroke. From this calibration analysis, it became clear that the actuator quickly accelerates at the beginning of the stroke, and that the velocity is constant (1.19 m/sec for a gauge pressure of 400 kPa) through the end of the stroke. The displacement and time were also verified after each individual experiment using a linear variable differential transducer.
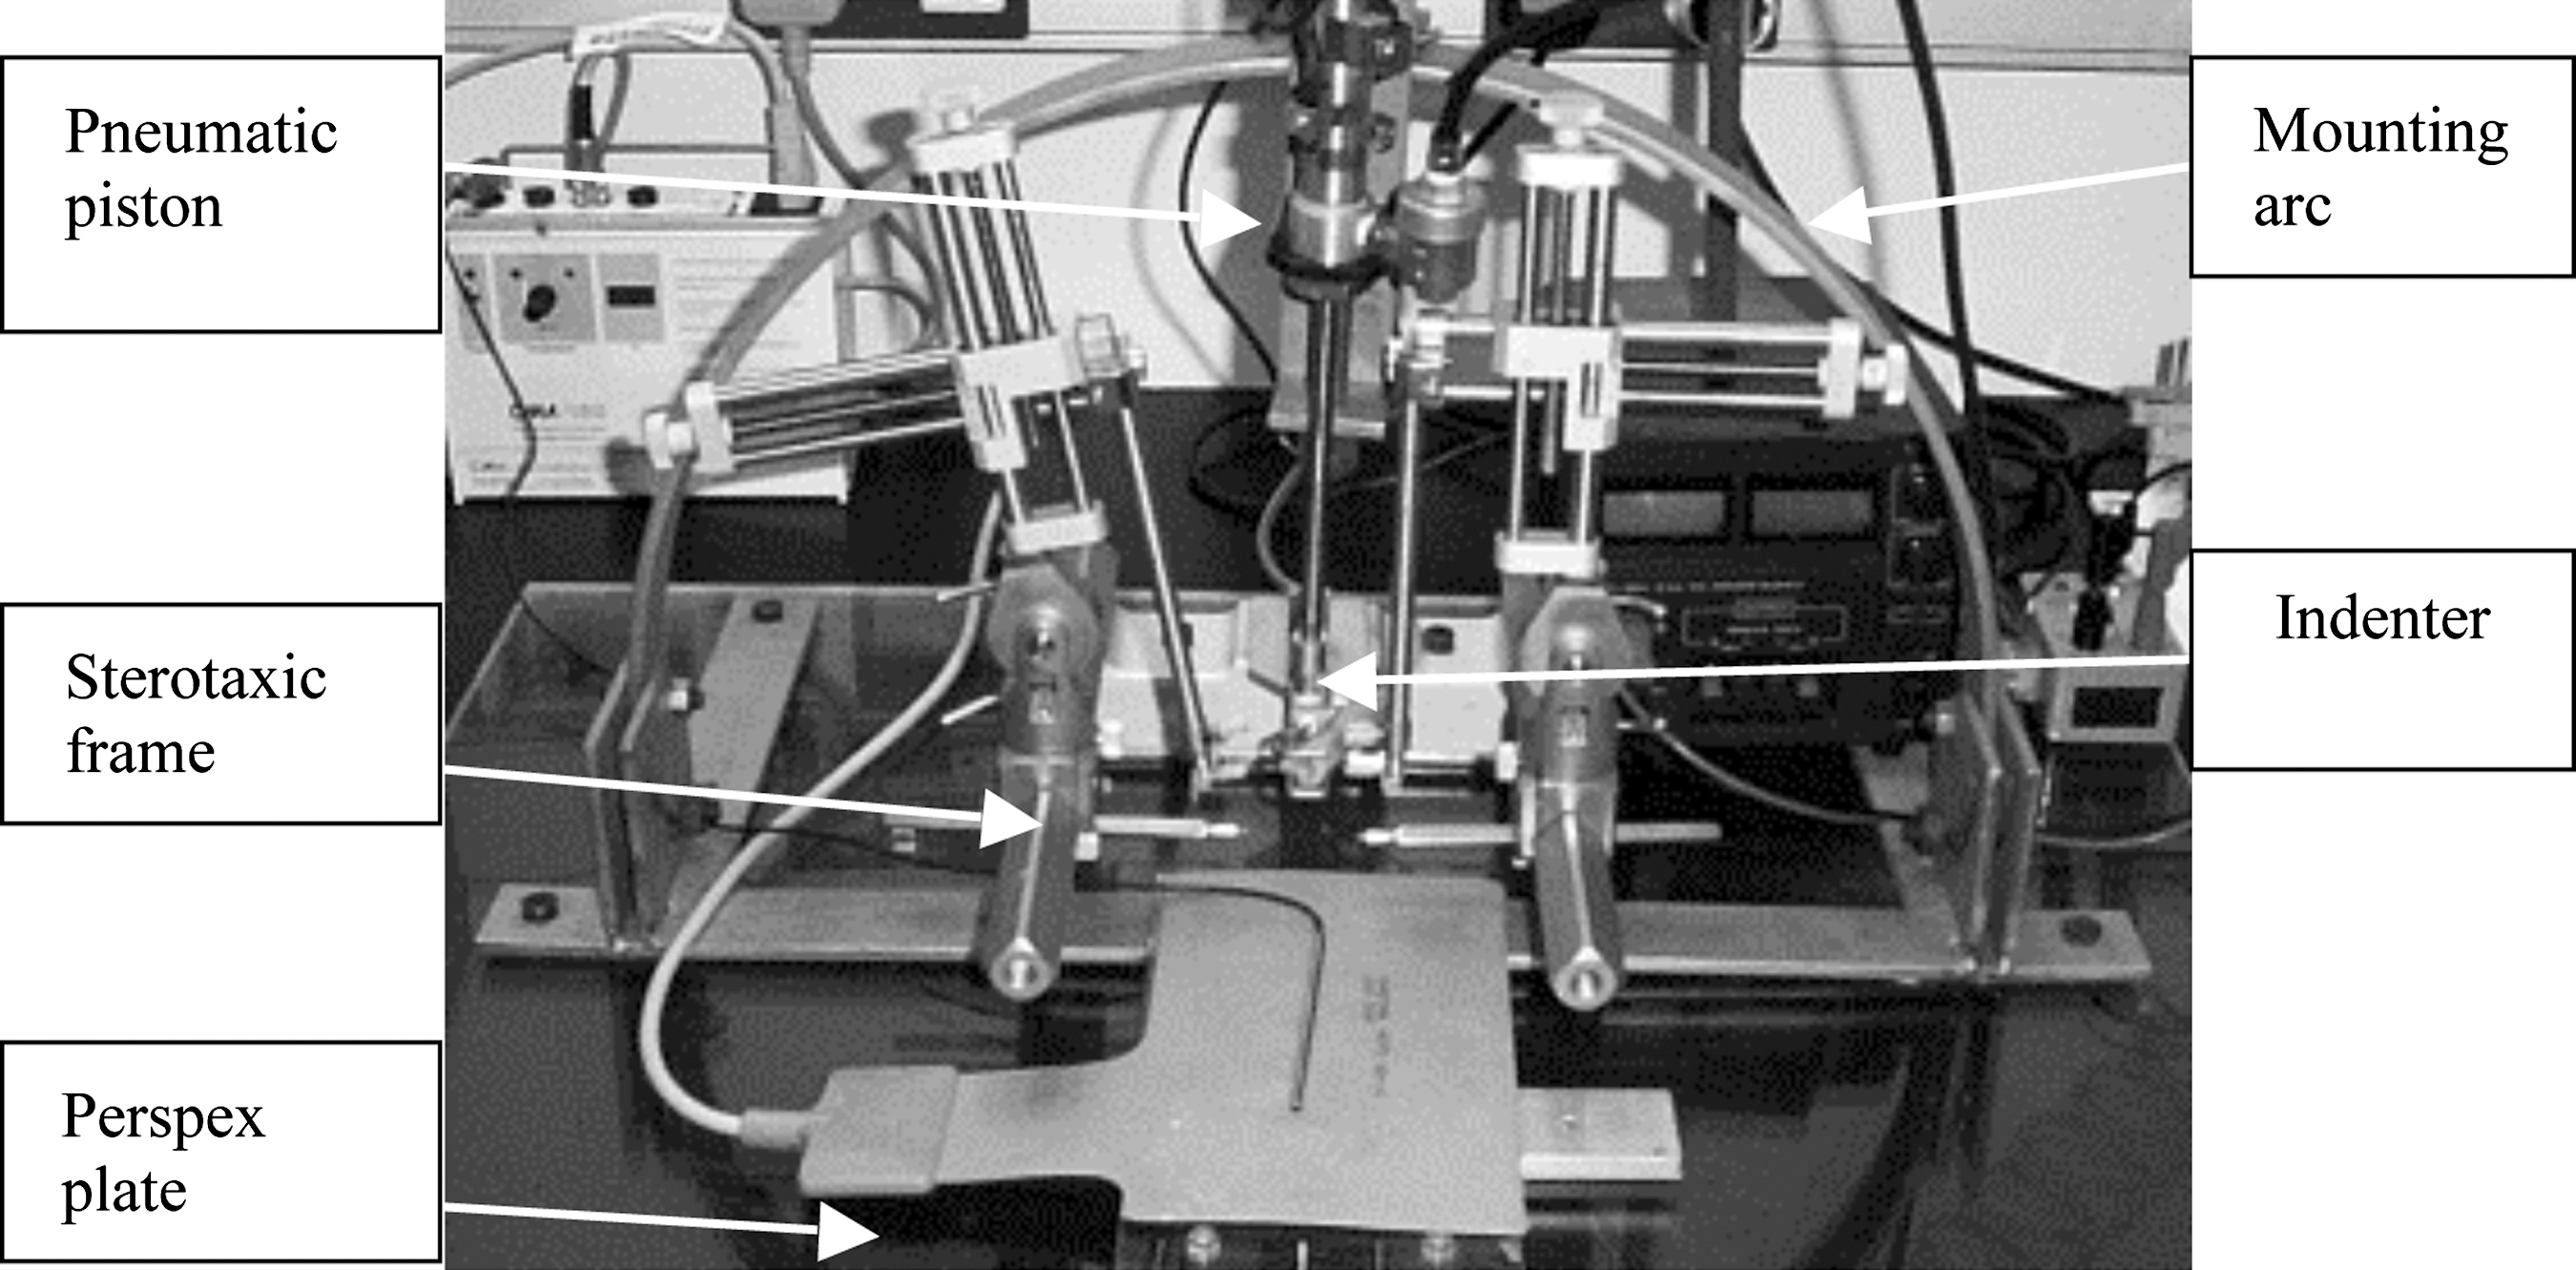
Controlled cortical impact tool developed for this study (rat not shown).
Intraperitoneal injections of the non-recovery anesthetic urethane (1.5 g/kg of 30% in 0.5% NaCl solution) were administered. When the pedal withdrawal reflex was lost, the rat was then moved to a Kopf stereotaxic frame (David Kopf Instruments, Tujunga, CA), where it was stabilized with sharp ear bars and an incisor bar set at −3.3 mm. A craniotomy 4 mm in diameter was carried out above the left frontal cortex, and a portion of the skull bone was removed, exposing the dura mater. The tip of the pneumatically-driven impactor (diameter 3.5 mm) was zeroed at the craniotomy at the level of the dura (co-ordinates from the bregma: anterior-posterior +2.7 mm, subregion medio-lateral −1.4 mm). This was defined as zero depth of penetration into the brain. Once zeroed, the tip was then withdrawn. Depending on the severity of the impact required, the piston was positioned to a depth of 0.87 mm (lower-impact level) or 2.62 mm (higher-impact level) using the rotating lever on the impactor. The depth of impact was based on the work of Cherian and colleagues(1994), who defined an indentation depth of 0.5–1 mm for low-impact (mild) injury, and a depth of 2–3 mm for high-impact (severe) injury. A pressure of 4 bars was released via an electronic trigger into the pneumatic ram, propelling the indenter at a velocity of 1.19 m/sec, striking the dura with an impact force of 128 N, and penetrating to the proper predefined depth. The velocities used in this work were slower than those used in other CCI experiments, including the 3 m/sec used by Dixon and associates (1991, 1999). The range of velocities used by others varied from 2 m/sec (Sutton et al., 1993) to 6 m/sec (Colicos et al., 1996). The velocity was verified intraoperatively using a storage oscilloscope (Gould Instruments, Longjumeau, France).
To prevent a temperature drop in the tissues exposed by the craniotomy (Nilsson et al., 1990), a lamp was placed at a predetermined distance (25 cm) from the head of the animal. Animals not surviving the 5-hour period post-impact were excluded from the study. A survival rate of 80% was achieved following higher-impact levels, and the mortality increased with increasing duration of urethane anesthesia. The survival test group contained 8 animals subjected to lower impacts, and 10 animals subjected to higher impacts, along with four sham (control) animals, which received the preparatory surgery but were not injured.
Experiment
MRI was performed at 7T using a Bruker Biospec 70/30 system (Bruker Biospin, Ettlingen, Germany), with a 70-mm volume coil for transmission, and an actively decoupled rat head surface coil for reception only (circular polarized). Prior to MRI, the animals were placed in a vented chamber and anesthetized with inhaled isoflurane (approx. 4% in air with an air flow rate of 400 mL/min) until pedal withdrawal reflex was lost. The rat was then placed supine in an acrylic glass cradle with a three-point fixation system (tooth-bar and ear-plugs). During MRI, the animals were inhalationally anesthetized (free breathing) with isoflurane (2–4% in air), and body temperature and respiration were monitored during image sequencing. The eyes were smeared with lubricant (Vidisic gel; Bausch & Lomb, Feldkirchen, Germany) to counteract corneal dehydration. The animal's temperature (37 ± 1°C) and respiration were monitored for the duration of the experiment (the body temperature was maintained during anesthesia by a circulating hot-water blanket). The animals each underwent a high-resolution scan (HR) and a proton density scan (PD) prior to impact and at hourly intervals for 5 h following impact. High-resolution images were acquired using a T1-weighted sequence (RT = 6733.4 msec; TE = 36 msec; flip angle = 180°; avg = 6; acquisition matrix =128 × 128; voxel size = 0.133 × 0.133 × 0.5 mm; acquisition time = 10 min and 46 sec; number of slices obtained = 58), followed by a proton density-weighted sequence (RT =1888.7 msec; TE =14.8 msec; flip angle = 180°; avg = 2; acquisition matrix = 300 × 220; voxel size = 0.234 × 0.234 × 0.5 mm; acquisition time =12 min and 7 sec; number of slices obtained = 58).
Magnetic resonance imaging: Brain volumetry
The HR and PD scans were used to assess whole-brain volume change, the intracranial pressure (ICP), and the substructure volumetric change. The whole-brain volume measurements were subsequently used to determine the variation of ICP. The established relationship between ICP and intracranial volume (Marmarou et al., 1975; Ryder et al., 1953; Sklar and Elashvili, 1977; Szewczykowski et al., 1977) is governed by the Monro-Kellie doctrine (Andrews and Citerio, 2004). In clinical practice, a measurement is made of the cerebrospinal fluid (CSF) expelled into a shunt or catheter, quantifying the pressure inside the skull and hence the change in brain volume. The elevated ICP level can then be related to the level of swelling that has occurred and is not subject to variations in head size. This provides a direct link between whole-brain swell measurements from experimentally-induced TBI and clinical assessment of the progressive effects of the TBI. ICP is measured in millimeters of mercury (mm Hg), and in humans it can vary by up to 20 mm Hg without being harmful (Marmarou et al., 1991; Self Learning Packet, 2004). By equating the average segmented sham volume with the uninjured 20-mm Hg ICP level, the range and change in ICP can then be estimated for the rest of the remaining mild and severe volumes. The calculated ICP values can then be associated with GCS scores and clinical findings of mild and severe TBI patients. This provides a relative link between the continuous assessment methods used in clinical practice and the experimental assessment of the evolution of TBI.
Rigid body volume registration (Friston et al., 1995) was performed on each rat's brain volume. Skull stripping was then performed to remove the bone and skin from the MR images, and a gaussian filter was applied to reduce noise (Fig. 2a and b). Retrospective entropy bias correction (Salvado and Wilson, 2004) was applied to correct for inherent MRI inhomogeneity (Fig. 2c).

Proton density intensity profile of (
High-resolution scans
The high-resolution scans were used to estimate the whole-brain volume change by selecting all pixels above the background signal intensity (S), from which a brain mask was constructed by (1) morphologic erosion, (2) recursive region growth, which retains connecting pixels, and (3) morphologic inflation to reverse the effect of erosion. The brain volume was calculated as the product of the number of pixels in the mask and the voxel size. A statistically-significant correlation (p = 0.05) was found between each of the pre-impacted rat brain volumes post-registration. Once the whole-brain volume was segmented and registered for each time period, the change in ICP was calculated by measuring the change in brain volume over time. A continuous assessment of the progression of injury severity can be quantified in accordance with established clinical assessment methods in human TBI patients (Steiner and Andrews, 2006).
Proton density scans
The PD scans provide greater accuracy in segmenting the structures of the brain once bias correction has been performed, as there are specific concentrations of protons in varying types of neural tissue (Salvado and Wilson, 2004). The subsequent segmentation then provides localized detail of the volume changes to the corpus callosum, CSF, and atrophy of the cerebral cortex.
Using an analytical model of signal intensity (Tofts, 2003; Eqn. 1), along with the measured proton density values for specific structures (Gutteridge et al., 2002), it is possible to calculate g, the relationship between signal intensity (S) and the concentration of free protons (PD), within the structures.
By measuring the signal intensity in CSF, which has a known PD of 100 pu, the specific relationship (g) can be calculated for the whole-brain volume. By applying Eqn. (1), the brain substructures with a specific signal intensity can be segmented by histogram equalization (Tofts et al., 2003) into CSF, grey matter, and white matter. From this model the rat brain was further segmented, and the volume changes to the corpus callosum, CSF, and atrophy of the cerebral cortex grey matter were measured.
Statistical analyses
A one-way ANOVA statistical analysis was used to compare the variability between the groups of sham, lower-, and higher-level impacts with respect to volume change and time for both the specific segmented regions and the whole-brain volume change. A separate univariate analysis was conducted for whole-brain volume change. The ICP was calculated with respect to time-based volumetric changes. In each case, the MR imaging measurements constituted the dependent variable, whereas the model included the sham subject group as a classification factor of change for which p < 0.05 was the level set for statistical significance.
Results
Three parts of the ICP-volume curve (Lofgren et al., 1973; Marmarou et al., 1991, 1975) were established (Fig. 3) by fitting a fourth-order polynomial trendline to the data points over the complete time course of injury observation for each animal. A flat part is seen at lower intra-cerebral volumes, where good compensatory reserve is found for the sham injury, and the ICP remains low and stable despite fluctuations in intracranial volume (Fig. 4). This is due to compensatory mechanisms, which reduce the volume of cerebrospinal fluid (Fig. 5) and intracranial blood inside the skull. Once the capacity of these mechanisms to cope with the fluctuations in the volume of liquid are exhausted, the curve rapidly turns upwards, in the manner of an exponential rise. This part of the curve represents low compensatory reserve, which is usually associated with mild and moderate TBI, where ICP increases considerably, even with relatively small increases in intra-cerebral volume. Finally, at high levels of ICP (i.e., severe TBI), the curve reaches a plateau, denoting terminal disturbance in cerebrovascular responses, when cerebral perfusion pressure is very low and ICP equals the mean arterial pressure. Tissue injury following the lower impact is time-dependent, such that in the early stages (1–2 h following impact) the data points are at the lower edge of the low compensatory reserve. However, 3–5 h after impact, the majority of data points are at the upper edge of the low compensatory reserve. This finding demonstrates the importance of timing in clinical prognosis following TBI. Thus it is possible that a clinical assessment made too early following TBI may underestimate the severity of injury. It has been shown that the later the GCS assessment is made, the better its prognostic value with respect to long-term mortality and total disability (Kraus and McArthur, 1996). Teasdale and Jennett have suggested that GCS measurements be standardized at 6 h post-injury (Teasdale and Jennett, 1976).

The change in intracranial pressure (ICP) levels in the rat: lower intra-cerebral volumes, low compensatory reserve, and terminal disturbance.

Volume change in the corpus callosum in the three study groups.
Depletion of cerebrospinal fluid (CSF) over the 5-h period in the three study groups.
A histological study (Cronin et al., 2008) of the induced impact injuries was performed using the same experimental set-up of this study. Histology indicated an impact-dependent increase in edema, parenchymal hemorrhage, and tissue disruption. The histology results illustrated that the lower impact level is associated with relatively less injury than the higher impact level, and the MRI images also demonstrate the staggered extent of damage following lower and higher levels of injury (Fig. 6).
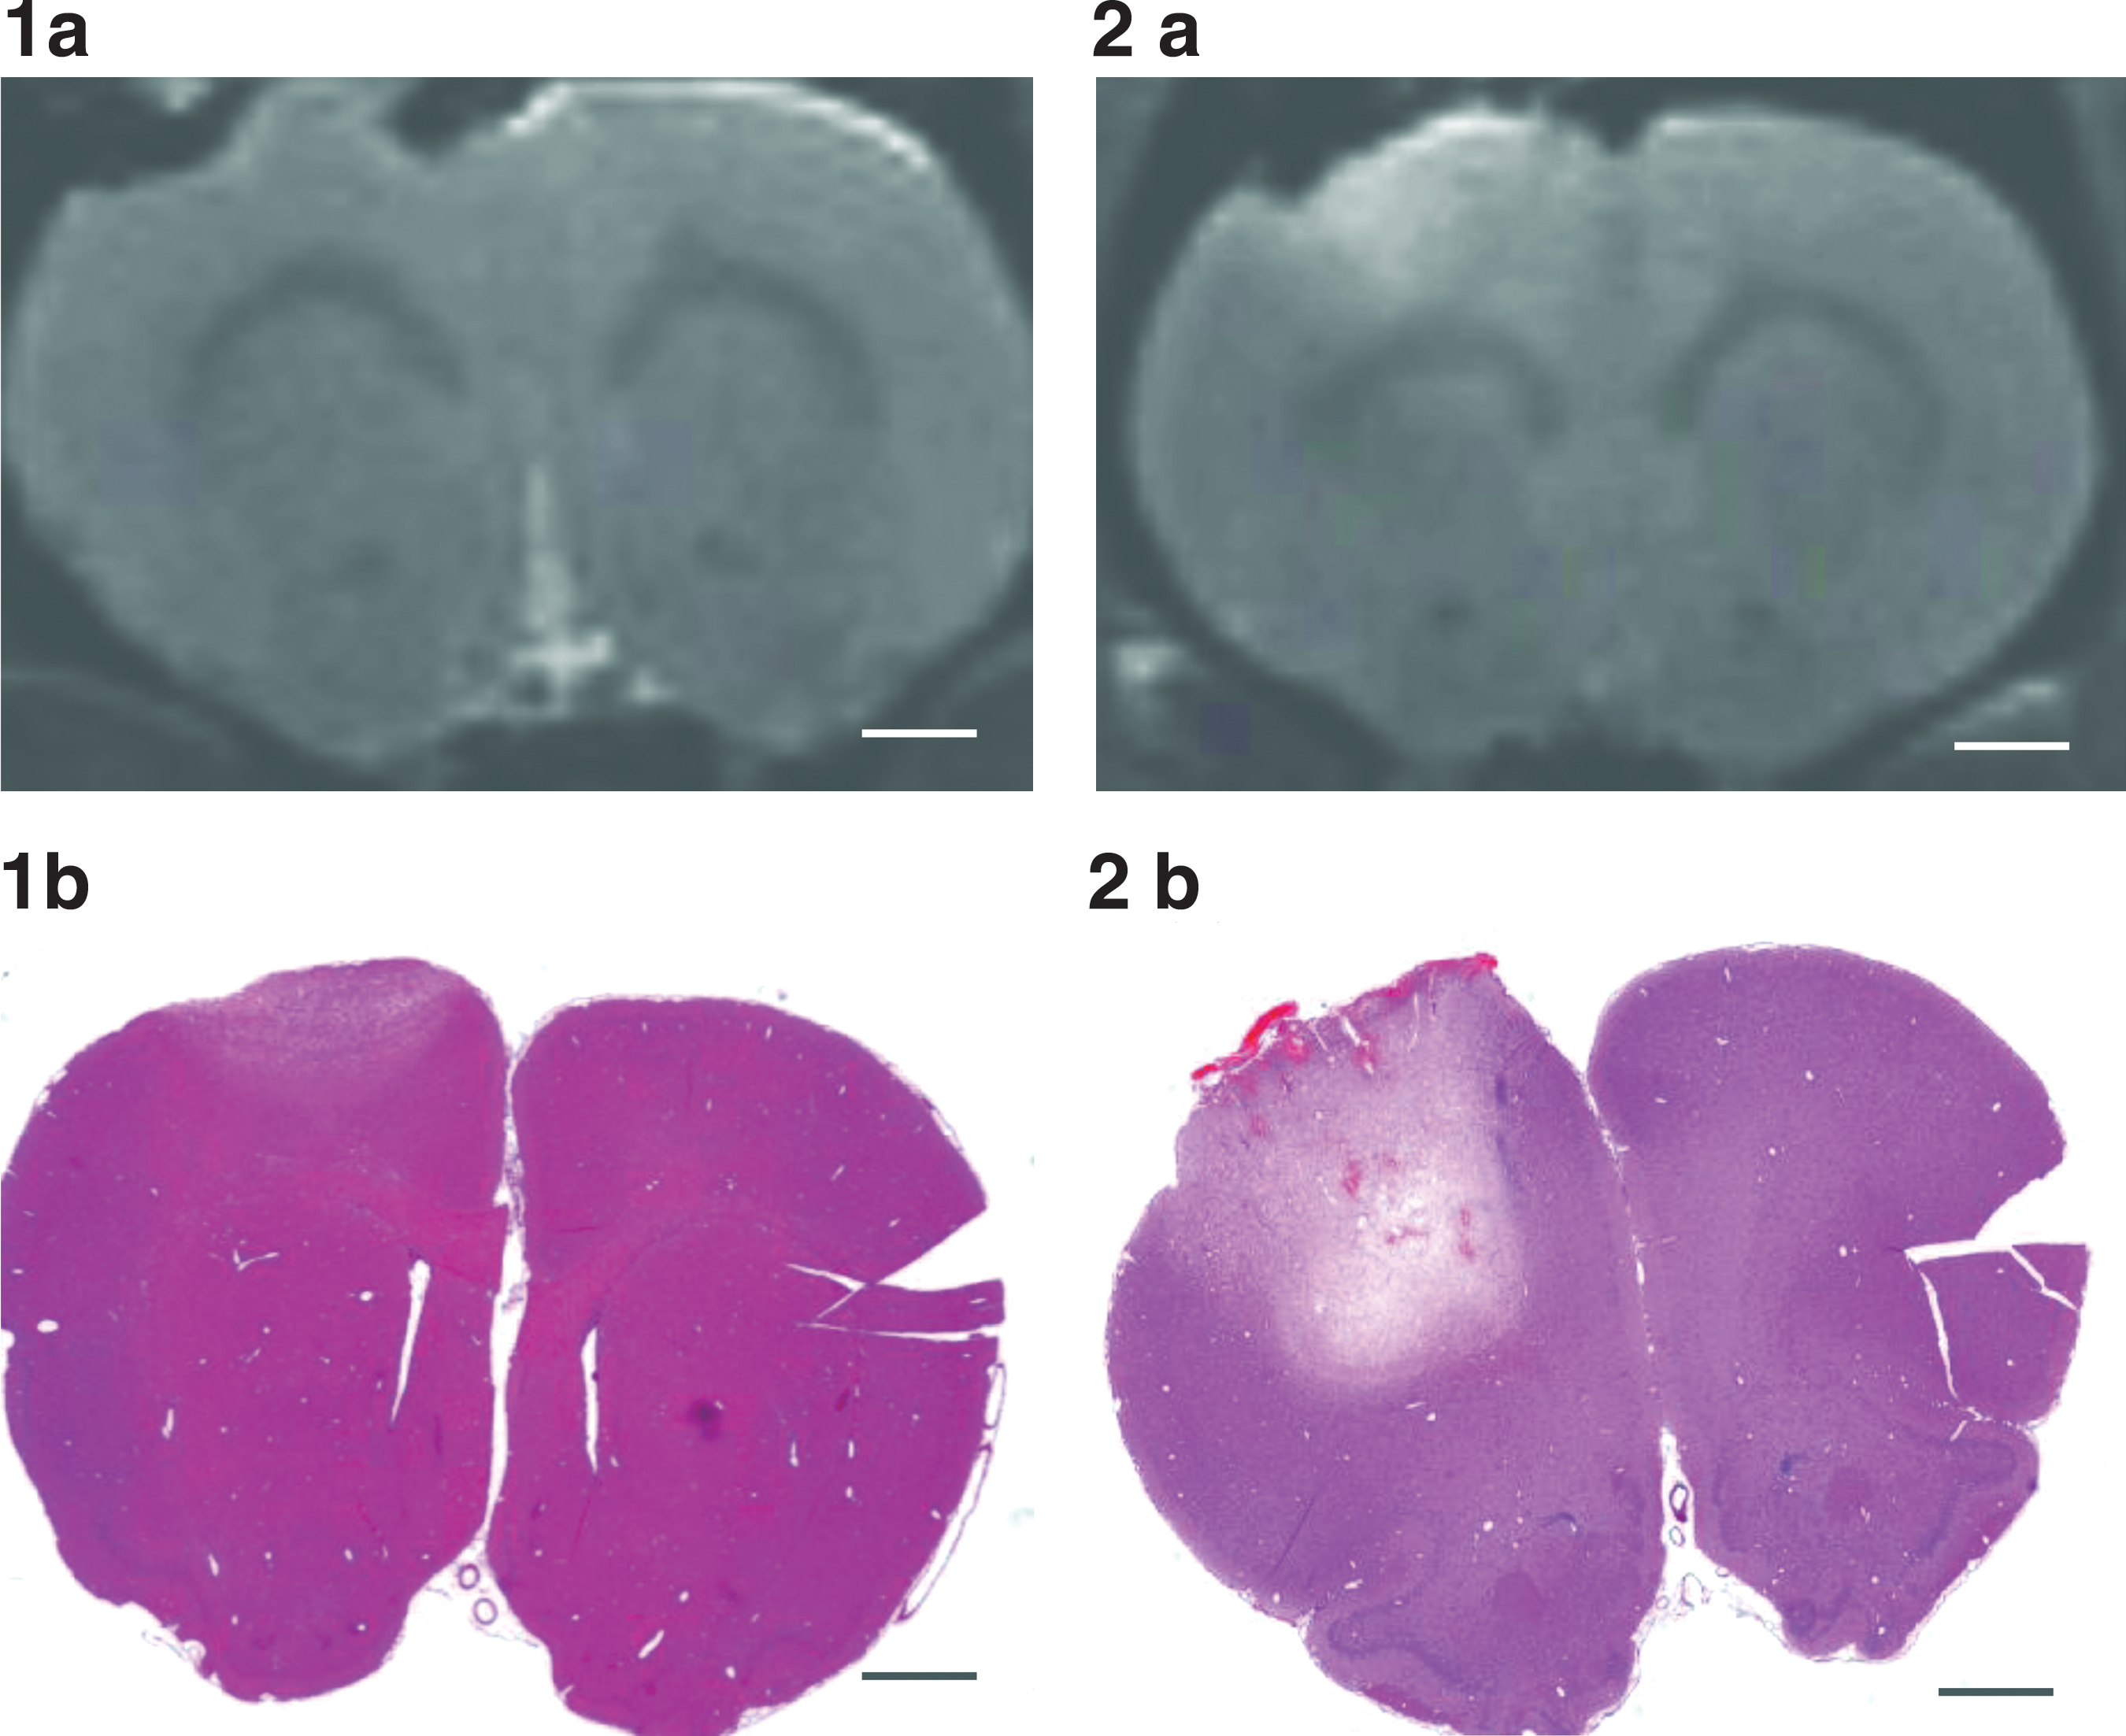
Histology and magnetic resonance imaging (MRI) of low- and high-impact animals at 5 h following controlled cortical injury: (
A 60–110% and a 30–40% increase in the relative volume of the corpus callosum (Fig. 4) was recorded 1–4 h following lower and higher impact levels, respectively, compared to sham impact (p ≤ 0.01 versus sham impact by one-way ANOVA). The increase in the volume of corpus callosum was transient in nature, and was not observed 5 h following either the lower or higher impact levels (p ≥ 0.05 versus sham impact by one-way ANOVA). However, a 5–53% decrease in the volume of the corpus callosum was observed 1–5 h following surgery in the non-impacted controls compared with the pre-surgery group. Furthermore, there was no difference in the low and high impacted groups compared with the pre-impact controls. Thus the increase observed following lower and higher impact may not be impact-related, but may in some way relate to surgery, possibly to anesthesia. Studies have shown (Whitfield and Douglas, 1989) that general anesthesia may be associated with structural changes in the brain at a molecular level, with white matter regions preferentially affected. Those studies demonstrated significant changes in MRI signaling in the corpus callosum during general anesthesia.
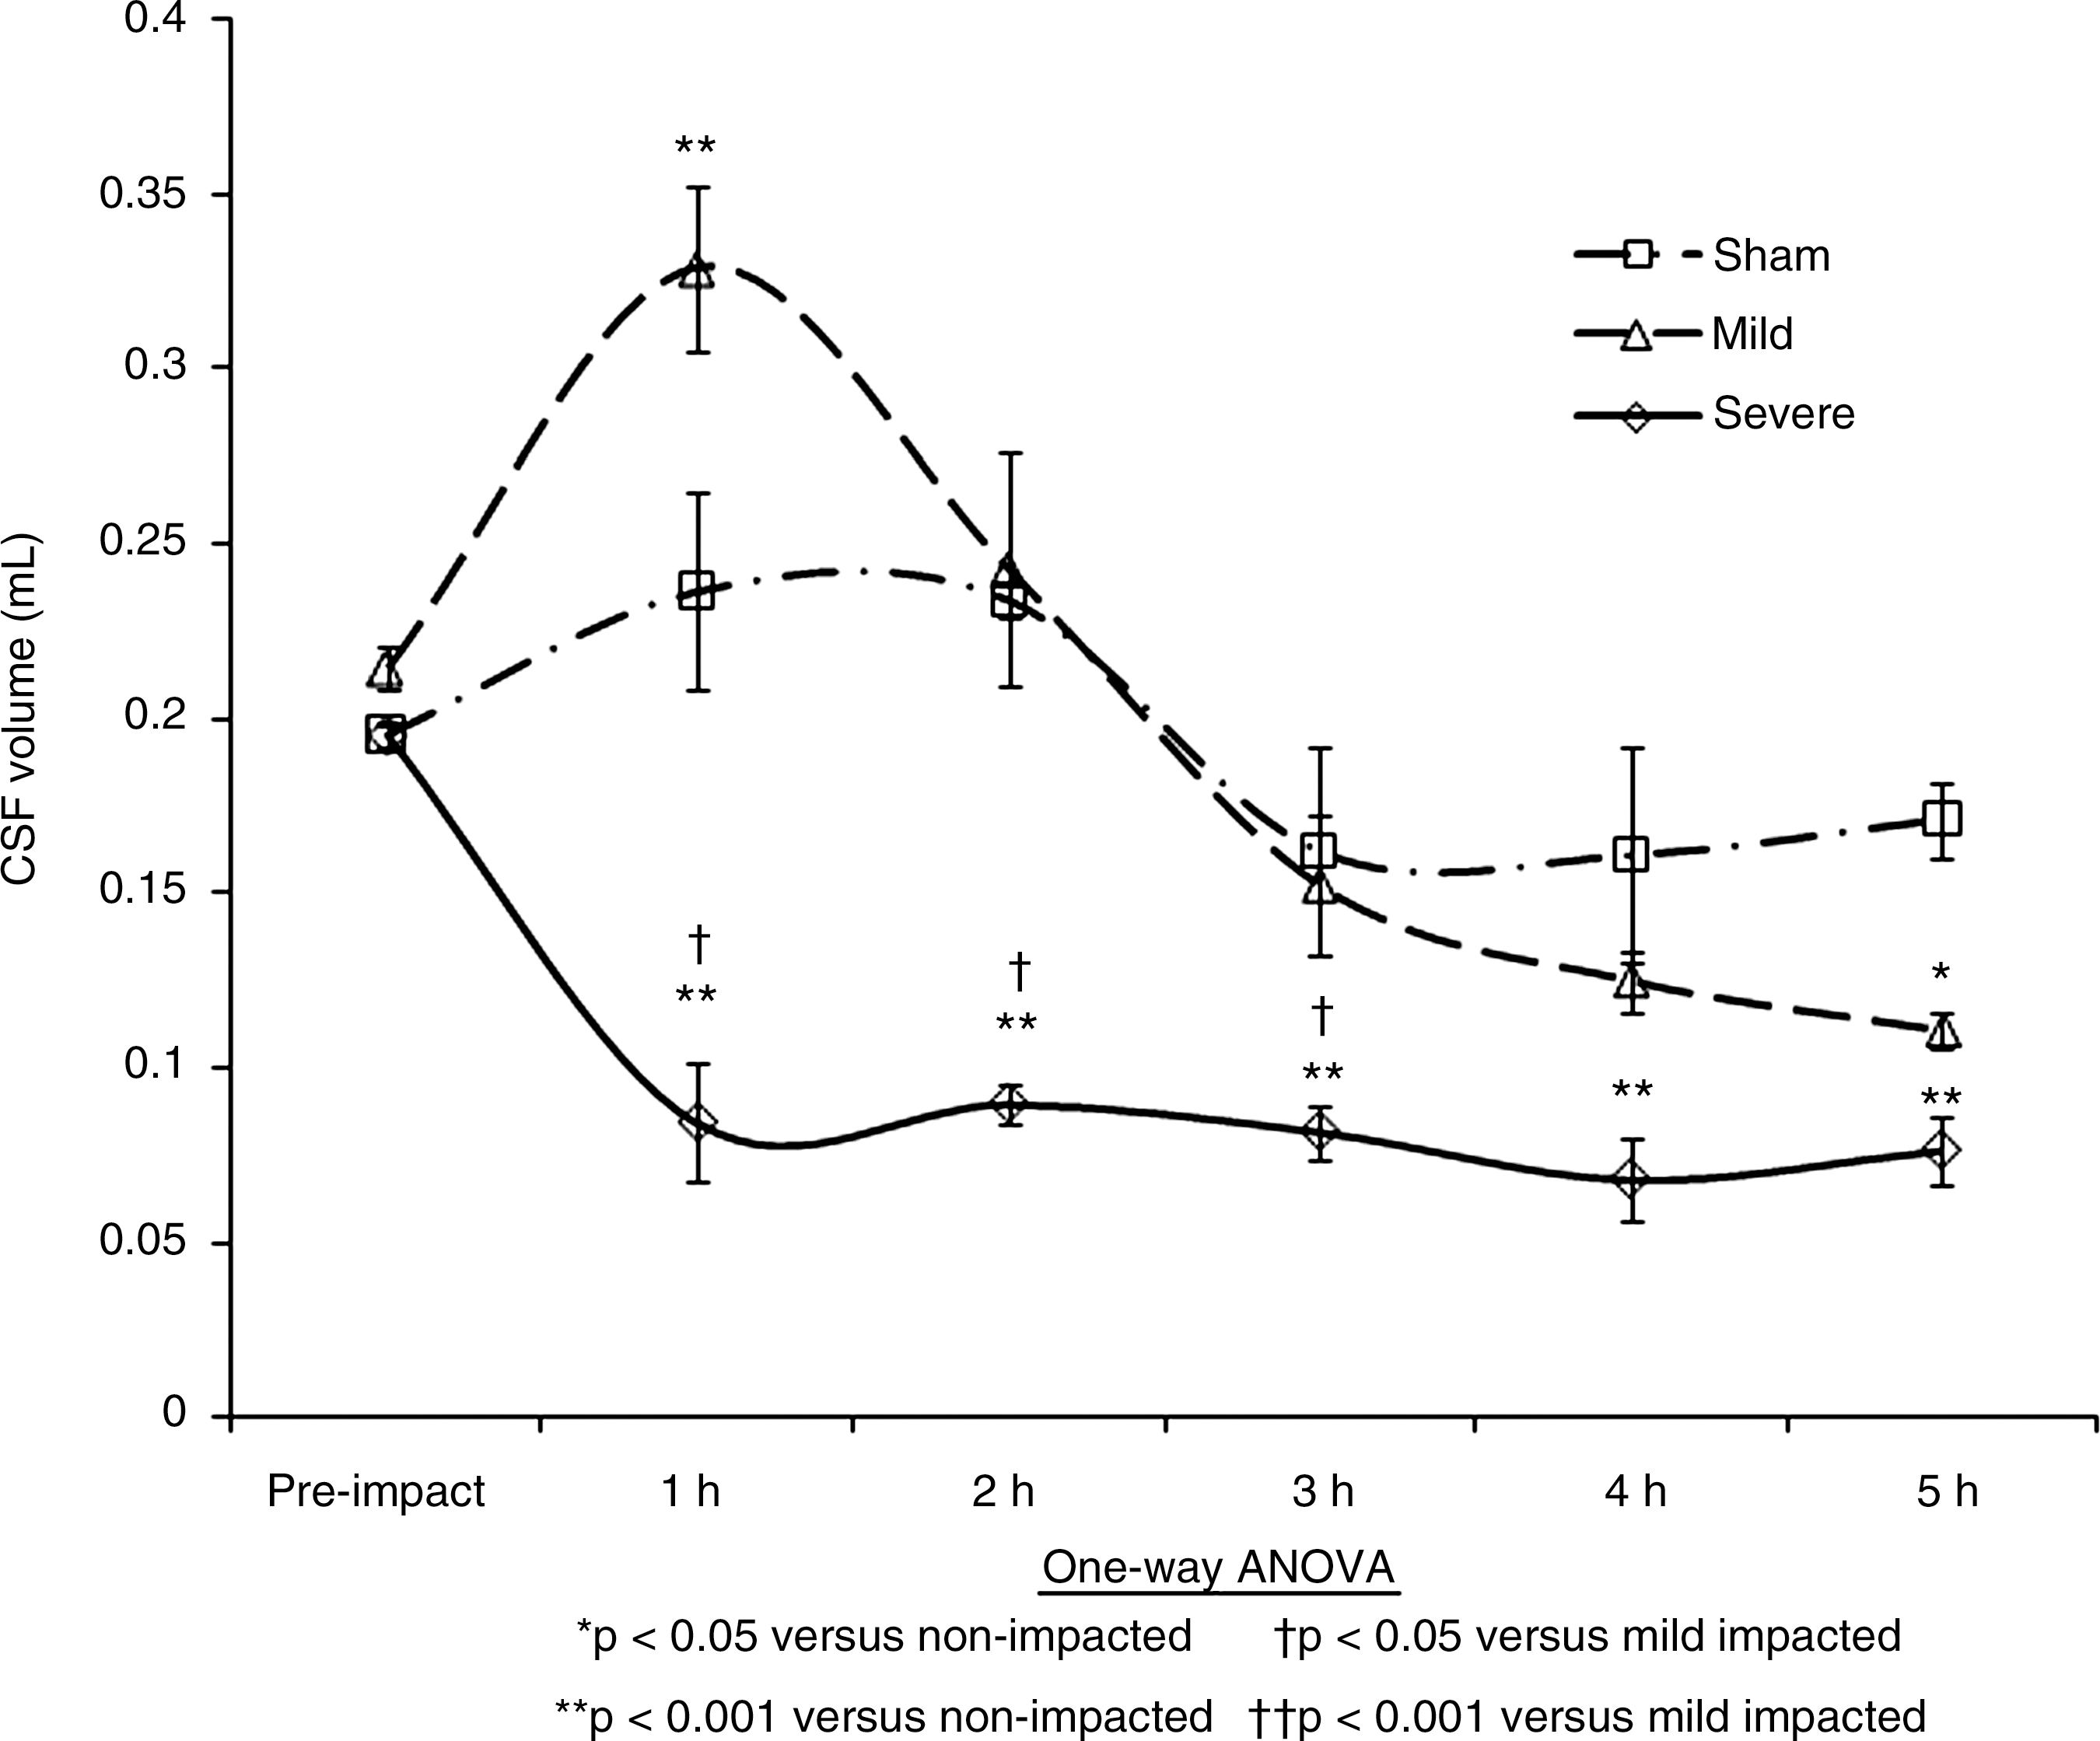
The second change measured using the PD scans at hourly intervals following impact was the volume of CSF within the head (Fig. 5). A reduction in CSF significantly influences the elasticity of mechanical properties of the brain tissue (Kuroiwa et al., 2007). As the volume of the brain reaches the terminal disturbance level of ICP, the elasticity of the brain tissue tends to reduce as the brain swells and the CSF is driven from the system (Gefen et al., 2003; Muthupillai et al., 1995; Sklar and Elashvili, 1977; Szewczykowski et al., 1977). The reduction in CSF can also lead to hyponatremia. This then leads to unresponsiveness, and if left untreated, can result in severe or permanent brain damage (Evans, 1996).
The broad trends of Figure 5 show that the volume of CSF drops immediately for the higher-level impacts, but more gradually (from 2 h to 5 h) for the lower-level impacts. Some fluctuations are also noted for the controls (i.e. non-impacted). Figure 5 shows an immediate depletion of CSF in the high-impact injury group after 1 h due to edema of the brain. For the lower-impact injuries there is a slow decrease from 2 to 5 h. Edema of the brain causes this steady reduction in CSF inside the cranium and a parallel elevation in the ICP curve. In the higher-injury cases, the CSF depletion and elevation of ICP into the terminal disturbance range occurs rapidly, while in the lower-impact cases this occurs slowly (from 2 h), and reaches the terminal disturbance level at 5 h.
Ischemic edema was quantified as indicated in Figure 7 in terms of the volume of abnormal or atrophied tissue. The level of atrophy in the tissue was measured by histogram classification of abnormal tissue in the cerebral cortex using the PD scans (Gutteridge et al., 2002; Tofts et al., 2003). An immediate change is seen at 1 h, with a steady increase in atrophy right through to 5 h for both impact levels. These findings are similar to those found in the literature (Kuroiwa et al., 2007).
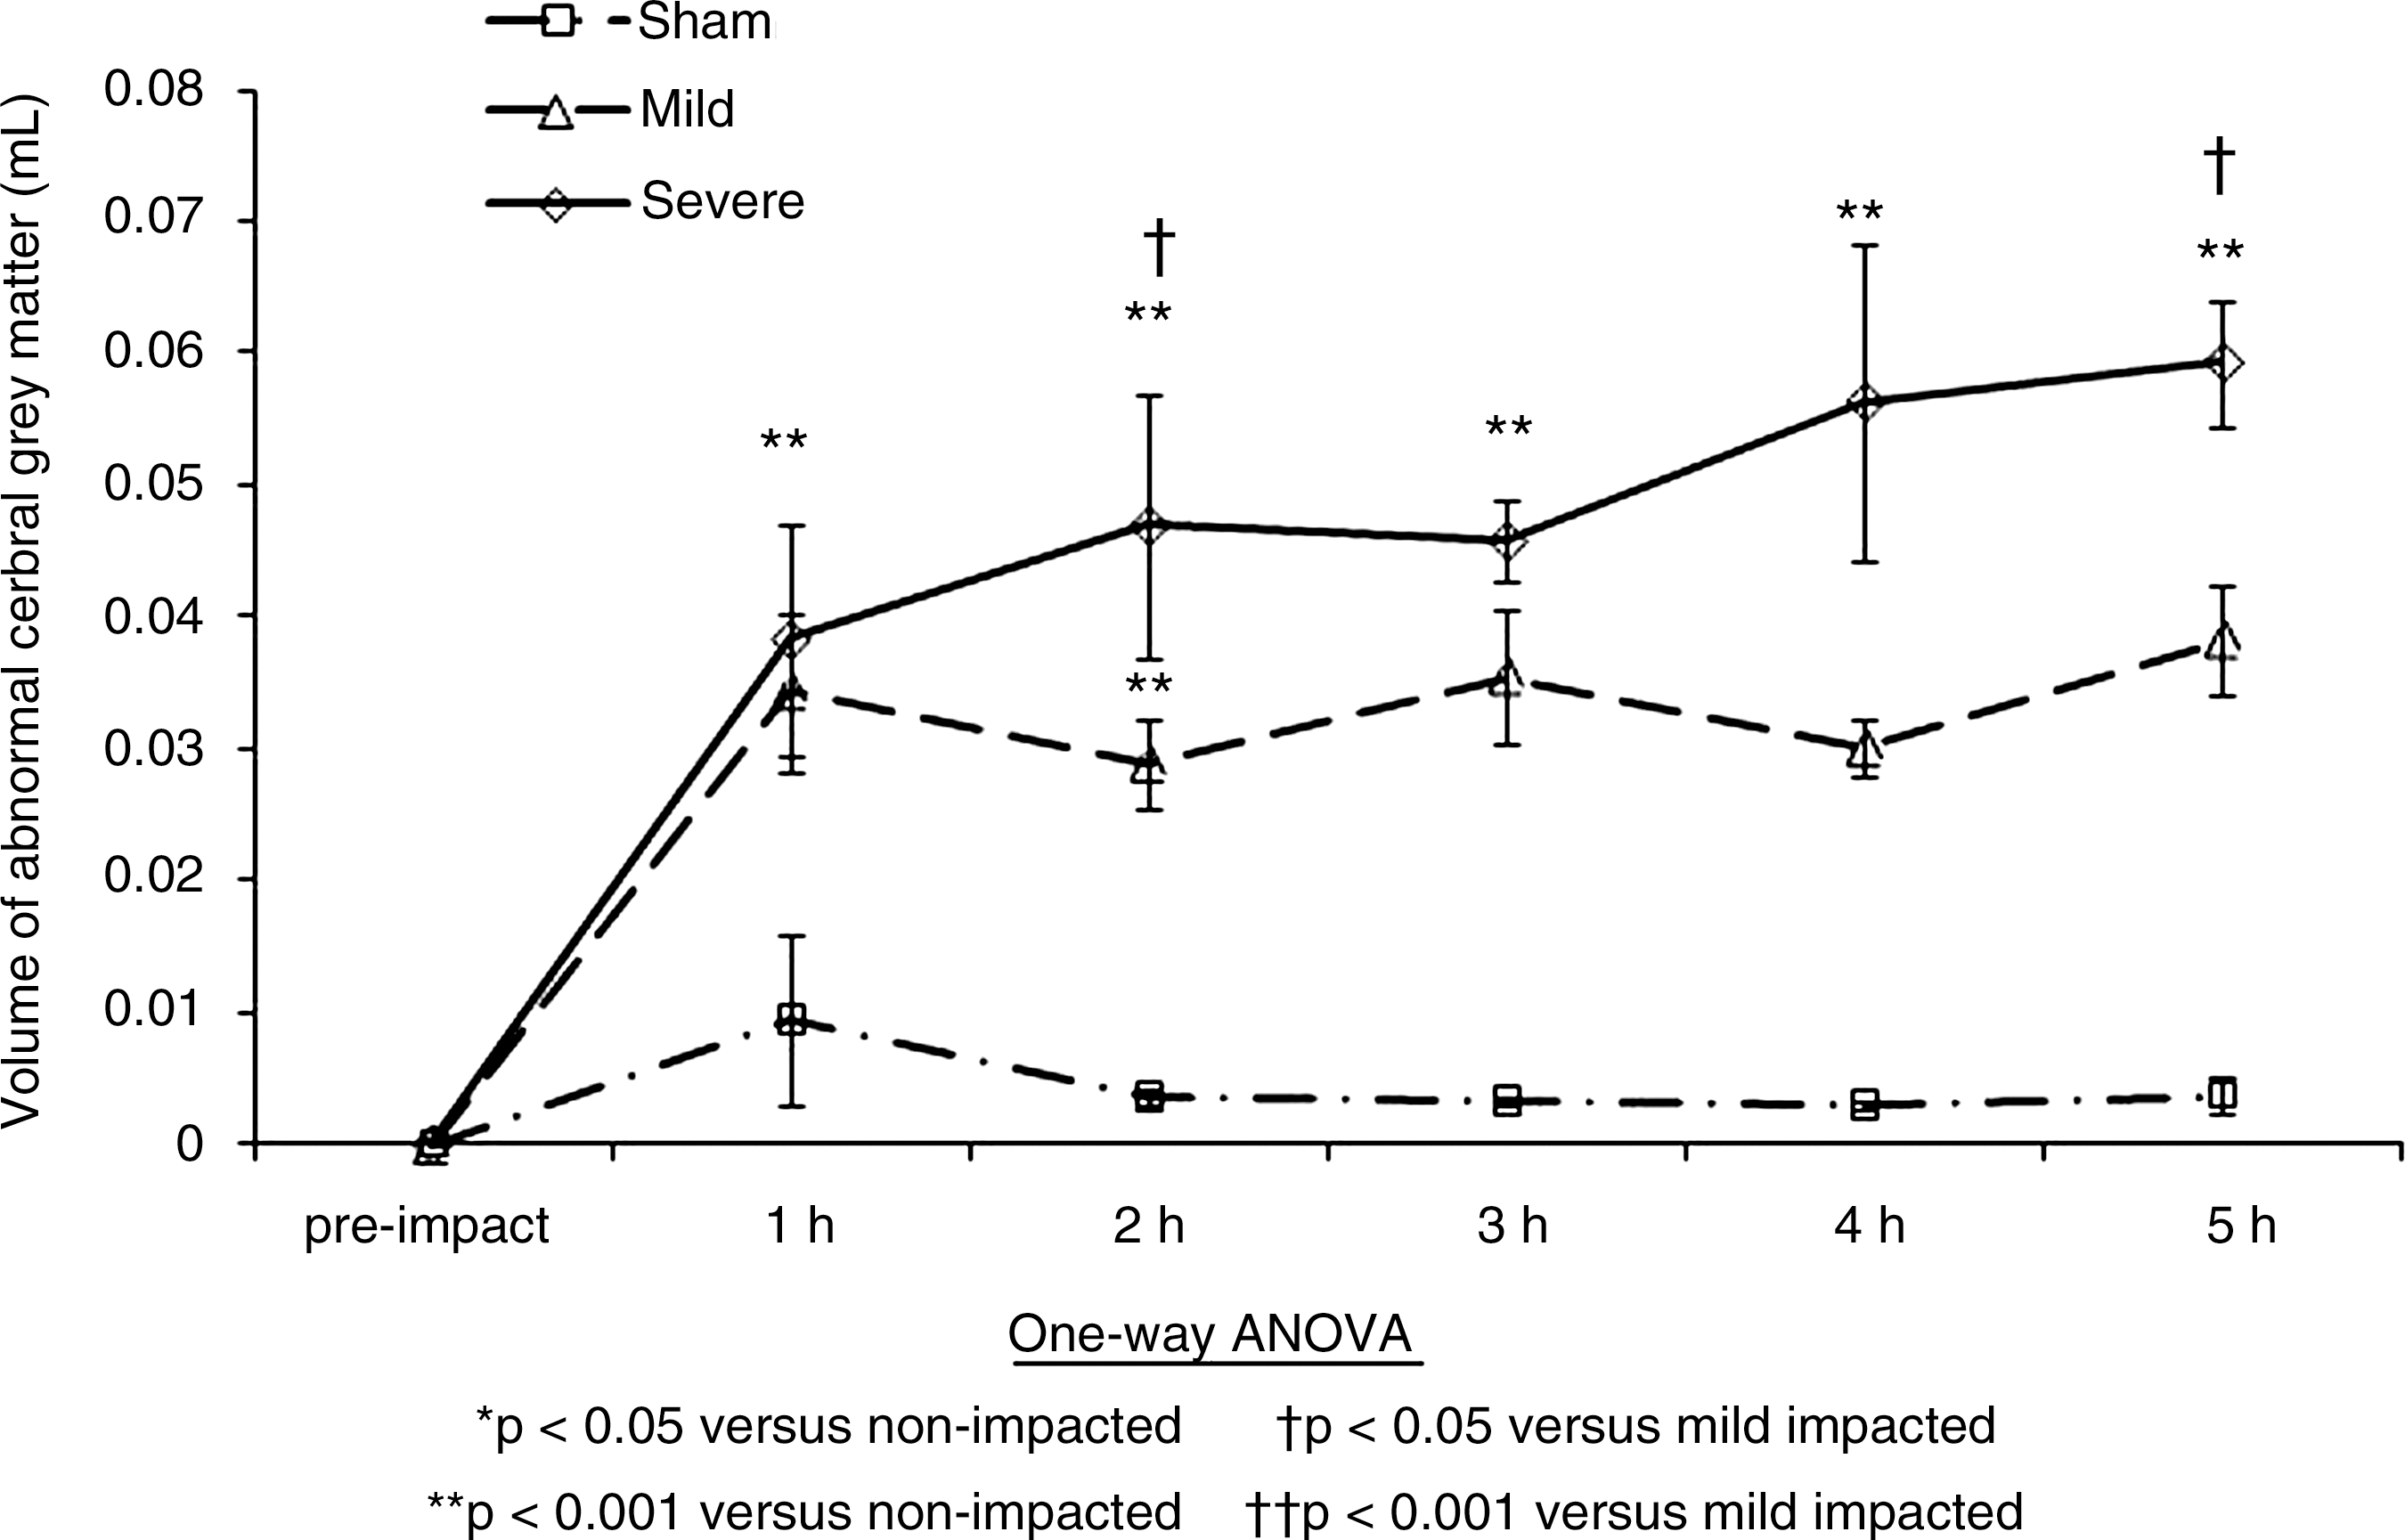
Abnormal tissue volume change in the cerebral cortex in the three study groups.
Discussion and Limitations
The MRI sequences show characteristic changes that are associated with head injury that are judged to be less severe or more severe in clinical terms. The traumatic axonal damage due directly to the cortical impact resulted in atrophy of the cerebral cortex. The swelling of the underlying tissue due to the induced traumatic axonal damage resulted in an increase in corpus callosum volume that disrupted normal brain function. The change in whole-brain volume expelled the intracranial CSF, adding to the secondary effects of the primary CCI injury. An increase in whole-brain volume at both the lower- and higher-impact levels, which resulted in an elevated ICP, was found. This change was observed in both relatively localized areas of the brain and throughout the whole-brain volume (Figs. 3 –7). The findings of the quantitative volumetric analysis of the PD scan statistically substantiated these findings. A statistically significant increase in the physical size of the corpus callosum (Fig. 4), and a reduction in the volume of CSF contained in the skull cavity (Fig. 5), was also found, with a corresponding increase in atrophied tissue in the cerebral cortex (Fig. 7). The volumetric analysis demonstrated a change in the low-impact group from 3 h, and an immediate change in the high-impact group from 1 h and 2 h. The quantitative MRI volumetric findings demonstrated the clinical hallmarks of an elevated ICP with decreased cerebral blood flow, and an increase in atrophy of neural tissue. These physiological changes were further substantiated by the histological studies, which illustrated the pathological response of the tissue.
A statistically significant increase in atrophy in the cerebral cortex was found for the high- and low-impact groups from 1 h onward. However, in terms of limitations of the present work, the variability in the surgical procedure and the effect of the drilling procedure on each animal cannot be fully characterized. There is great variability in the reported values of impact velocity, site of impact, penetration depth, and indentor diameter, in the literature. The velocity of the indentor at the time of impact in our CCI experiments was among the slowest reported in other animal investigations of TBI. The ability of neural tissue to absorb impact energy depends on both the amount of deformation and the loading rate (i.e., both the strain and the strain rate). Any preferential orientation of the neural tissue fibers (i.e., anisotropy), with respect to the line of action of the force applied by the indentor would also affect both the severity and extent of injury to the neural tissue. This would be evident from both histological and MRI examinations. The slow-impact loading rates used in this study could have led to levels of injury and tissue responses that were greater and more variable in the outer regions of the brain tissue than if faster impact speeds had been used. A further limitation of the CCI method used in animal studies of TBI is the reduced brainstem deformation that is normally associated with human focal injury to the cerebral cortex. This is due to the orientation of the quadrupedal rat brain with regard to the line of action of the indentor.
Conclusions
The MRI results showed classical symptoms of clinical TBI sequelae when elevated ICP was present. The increase in brain volume and the reduction in CSF caused elevated ICP in the cranium. The increase in ICP caused reduced cerebral blood flow, which is associated clinically with patients who have suffered a TBI (Steiner and Andrews, 2006).
The reduced CBF caused secondary atrophy of the brain tissue over the 5h study period. The effects of atrophy were seen in PD images as increases in abnormal tissue and ischemic tissue, with a higher level of variability seen following low-level impacts (Figs. 4, 5, 7). The low-impact group was less affected, but displayed more variability in their results than the high-impact group, which had more pronounced and consistent outcomes than the low-impact group.
The measured parameters within the MRI scans showed an increase in ICP, which led to secondary effects due to hypoxia, hyponatremia, compression injury, and changes in vital white matter structures. The rapidly progressing secondary effects resulted in progressive neuronal degeneration. The high-impact group had a more pronounced and consistent outcome than the low-impact group. However, the low-impact group displayed less change due to the primary injury in the first hour compared to that seen in the high-impact group. Also, over the time course of injury observation, further degradation of the structures occurred, such that at the 5h time point, in the low-impact group the changes seen were similar to those observed in the high-impact group at the 2h time point. This implies that clinical intervention in the first 2 h following lower-level impacts would provide a superior prognosis for a human TBI patient. The findings detailed here validate the hypothesis that TBI following lower-level impacts is a diffuse disorder that affects the integrity of neurons, and that a quantitative MRI assessment of TBI patients would correspond more closely to the observed clinical symptoms, particularly in situations involving mild injury, than is the current clinical practice when using qualitative MRI. It will be of particular interest in future studies to investigate the relationship between factors that reduce inflammation (e.g., cooling or pharmacological agents), and the subsequent changes in ICP and their related MRI measures.
Footnotes
Acknowledgments
We thank Mr. Gregory Byrne (University College Dublin) for his assistance in building the CCI apparatus, and Dr. Christian Kerskens (Trinity College Dublin) for his assistance in computer-assisted image analysis. This work was funded under an Enterprise Ireland basic research grant (SC/2003/029), using MRI facilities that were funded by the Programme for Research in Third Level Institutions by the Higher Education Authority and Science Foundation Ireland.
Author Disclosure Statement
No competing financial interests exist.