




Abstract
Monitoring of cerebrovascular pressure reactivity (PRx) has diagnostic and prognostic value in head-injured patients, but requires invasive monitoring of intracranial pressure (ICP). Near infrared spectroscopy (NIRS) is a noninvasive method that is suitable for continuous detection of cerebral blood volume changes. We compared a NIRS-based index of cerebrovascular reactivity, called total hemoglobin reactivity (THx), against standard measurements of PRx in a prospective observational study. Forty patients with closed-head injury were monitored daily with arterial blood pressure (ABP), ICP, and a NIRS-based total hemoglobin index. PRx and THx were calculated as the moving correlation coefficients using 5-min time windows between 10-sec averaged values of ICP and ABP, and total hemoglobin index and ABP, respectively. A total of 120 recordings were performed between the median first (IQR 0.75–2) and fourth (IQR 2–6) day after head injury, giving a total duration of 1760 hours. PRx and THx demonstrated a significant association across averaged individual recordings (r = 0.49, p < 0.0001), and across patients (r = 0.56, p = 0.0002). Assessment of optimal cerebral perfusion pressure (CPP) and ABP using THx was possible in about 50% of recordings, and showed a significant agreement with the optimal CPP and ABP assessed with PRx. THx may be of diagnostic value to optimize therapy oriented toward restoration and continuity of cerebrovascular reactivity, especially in patients for whom direct ICP monitoring is not feasible.
Introduction
A method of continuous assessment of cerebral autoregulation with the aid of computational methods was introduced in the mid-1990s (Czosnyka et al., 1997), when an index of PRx was proposed. The index is calculated as the moving correlation coefficient between slow-wave fluctuations (20 sec to 2 min in length) in ABP and ICP. Values of PRx between −1 and +1 with negative or zero value reflects normal intact PRx, whereas positive values reflect passive nonreactive vessels. The ability to assess the cerebrovascular pressure reactivity reliably has been established by comparison with several other validated techniques. PRx is a strong independent predictor of outcome, as was shown in an analysis of 398 head-injured patients (Zweifel et al., 2008). PRx can also be used for assessment of a patient's optimal cerebral perfusion pressure (CPPOPT), or the CPP at which the pressure reactivity is the strongest. This follows from the notion that too low or too high CPP levels are detrimental to the brain, potentially leading to ischemia and brain edema, respectively. A recently-published study using invasive brain tissue oxygenation monitoring gave support to this concept (Jaeger et al., 2010). Moreover, Steiner and associates showed that patients who were treated with a mean CPP close to the CPPOPT were more likely to have a favorable outcome than those whose mean CPP was further away from the CPPOPT (Steiner et al., 2002). This finding led to a suggestion in the latest guidelines for the management of severe traumatic brain injury of the individualization of CPP (Bratton et al., 2007a).
Although continuous assessment of pressure reactivity using PRx has diagnostic value to assess CPPOPT and prognostic value for predicting outcome, its use is reserved for patients who undergo invasive ICP monitoring. A noninvasive equivalent would make a substantial contribution to optimization of blood pressure in those with mild to moderate head trauma, in whom invasive ICP monitoring is not indicated or is not feasible.
Near infrared spectroscopy (NIRS) is a noninvasive monitoring modality suitable for continuous monitoring of changes in cerebral blood volume that has been shown to have a strong correlation with ICP in the slow-wave frequency spectrum from 0.005–0.04 Hz in a piglet model (Lee et al., 2009). Furthermore, the authors showed that the hemoglobin volume reactivity index correlated significantly with PRx and demonstrated accuracy in the detection of the lower limits of autoregulation.
We hypothesized that slow waves of a NIRS-derived total hemoglobin index would be coherent with slow waves of ICP in head-injured patients. We further hypothesized that the total hemoglobin reactivity (THx) calculated with the total hemoglobin index correlates with PRx, and that continuous recording of THx provides similar information about the optimal ABP and CPP as PRx. To verify these hypotheses, we compared THx and PRx in 40 closed head-injured patients in whom invasive ICP was monitored.
Methods
All patients included in this study were admitted to the Neurosciences Critical Care Unit at Addenbrooke's Hospital (Cambridge University Hospitals NHS Foundation Trust) with the diagnosis of traumatic brain injury between June 2008 and June 2009. Data obtained in this study were acquired as part of a research project investigating cerebral physiology and metabolism following TBI, which was approved by the local research ethics committee. Written informed consent was obtained from the next of kin of each patient.
Patients
Inclusion criteria were: age over 16 years, closed-head injury, availability of intracranial pressure monitoring, and informed consent. Basic clinical data were collected and neurological status was assessed. CT scans were graded according to the modified Marshall CT scan classification (Hiler et al., 2006; Marshall et al., 1991). Frontal contusions were defined as intraparenchymal hyperdensity surrounded by hypodensity. The patients were managed according to Addenbrooke's Neurosciences Critical Care Unit protocol, which includes sedation with propofol and fentanyl, paralysis with atracurium, and support of CPP (Menon et al., 2004).
Near infrared spectroscopy
The NIRO 200 monitor (Hamamatsu Photonics U.K. Ltd., Hertfordshire, U.K.) can be used to monitor cerebral tissue oxygenation and cerebral total hemoglobin. It uses one emitting laser diode to generate three wavelengths of infrared light (775, 810, and 850 nm), and two detecting photodiodes to measure light attenuation at different frequencies and different degrees of separation from the source. Using a mathematical model based on light diffusion equations, rather than the modified Beer-Lambert law, uncalibrated concentrations of oxygenated (cO2Hb) and deoxygenated hemoglobin (cHb) are calculated. Derived variables include the tissue oxygenation index [a percentage value of cO2Hb/(cO2Hb + cHb)], and the total hemoglobin index (the sum of cO2Hb and cHb). It has been shown that these indices are not affected by the extracranial circulation and that they are independent of hemoglobin concentration, skull thickness, and the area of the cerebrospinal fluid layer underlying the optodes (Al-Rawi et al., 2001; Yoshitani et al., 2007).
Signal acquisition
ABP was measured directly from the radial or femoral artery with an intravascular line connected to a pressure transducer (Baxter Healthcare Corp. CardioVascular Group, Irvine, CA). ICP was monitored using an intraparenchymal probe (Codman ICP MicroSensor; Codman & Shurtleff Inc., Raynham, MA). These signals were digitized using an A/D converter (DT9801; Data Translation, Marlboro, MA), sampled at frequency of 50 Hz. NIRS THI signal was measured bilaterally over the frontal areas using the NIRO 200 monitor, and digitally transferred to the recording computer at a frequency of 2 Hz. All data acquisition and real-time analysis was done using a laptop PC running ICM + software (Smielewski et al., 2005). The NIRS monitoring system was applied only when ICP monitoring was available. NIRS data were recorded every day until ICP monitoring was removed. Prior to analysis, signal artifacts such as those due to arterial line flushing were removed.
Coherence analysis
Welch's method was used for spectral analysis of ICP and total hemoglobin index waveforms. Periods of uninterrupted recordings of ICP and total hemoglobin index were analyzed within a spectral range of 0.0055–0.5 Hz using a moving 12-min window composed of eight segments with 50% overlap. From each such window the maximum value of coherence within the spectral band of slow waves was calculated and plotted every 10 sec. An averaged value across the whole recording produced the coherence result for further statistical analysis.
Calculation of autoregulation indices
Input signals of ABP, ICP, and total hemoglobin index were subjected to a 10-sec moving average filter. Left and right recorded total hemoglobin index values were averaged. Indices of cerebrovascular pressure reactivity of ICP (PRx) and volume reactivity (THx) were calculated every 10 sec as moving correlation coefficients between filtered signals of ABP and ICP, and ABP and total hemoglobin index, using a 300-sec time window. Greater (positive) PRx and THx values indicate worse pressure reactivity, while smaller values (zero or negative) indicate better pressure or volume reactivity, respectively. A reliable assessment of the cerebrovascular pressure reactivity requires averaged values obtained over a recording interval of at least 30 min to increase the signal-to-noise ratio.
Determination of optimal ABP and CPP
For the determination of ABPOPT and CPPOPT in individual patients, ABP and CPP values were divided into bins of 5 mm Hg, and PRx and THx were averaged within these bins. The value for ABPOPT/CPPOPT was accepted if the graph showed a distinct valley with a minimum value for mean PRx or THx (see Fig. 4 for examples).
Statistical analysis
Discrete variables were summarized using counts (percentage), and continuous variables using medians (IQR, interquartile range) or means (SD, standard deviation). Variables were averaged within individual recording sessions as well as within patients to avoid the effect of multiple sampling. Correlation analysis of PRx and THx was performed using Pearson's method, as variables were normally distributed. Bland-Altman plots were performed, using difference PRx-THx and ratio PRx:THx against the mean. Previously it has been demonstrated that in a series of head-injured patients mortality rose from 20% to 70% when averaged PRx increases above a threshold of 0.3 (Balestreri et al., 2005). To detect impaired PRx above 0.3, receiver-operating characteristics (ROC) with the area under the curve (AUC) were calculated for individual recordings. Correlation analysis of CPPOPT and ABPOPT assessed with PRx and THx were performed using the Spearman-Rank correlation. For paired comparison of optimal assessed CPP and ABP with PRx and THx, Wilcoxon's signed rank test was used. Results were accepted as statistically significant if the p value was <0.05.
Results
In this prospective observational study, 40 patients with closed head injury were enrolled. The characteristics of the patients are presented in Table 1. In each patient 120 recordings were performed on daily basis. The median (IQR) time of initiating data recording was the first day after head injury (IQR 0.75–2 days), and data collection ceased at a median of 4 days (IQR 2–6 days) following TBI. The total duration of all recordings was 1760 h, with an average of 14.6 h per recording interval.
According to Marshall (Marshall et al., 1991).
Values are presented as median [lower quartile; upper quartile] or counts (%).
GCS, Glasgow Coma Scale; GOS, Glasgow Outcome Scale.
Coherence analysis
For each recorded file (n = 120) time trends of 10-sec averages of total hemoglobin index and ICP revealed the presence of variable intensity in the slow-wave spectrum. Coherence analysis indicated a good level of association between the two trends (coherence value of ICP and total hemoglobin index = 0.65; SD ± 0.11) in a frequency band from 0.0055–3 cycles/min (Fig. 1). This finding demonstrates that the same slow waves of cerebral blood volume are similarly represented by ICP and total hemoglobin index signals.
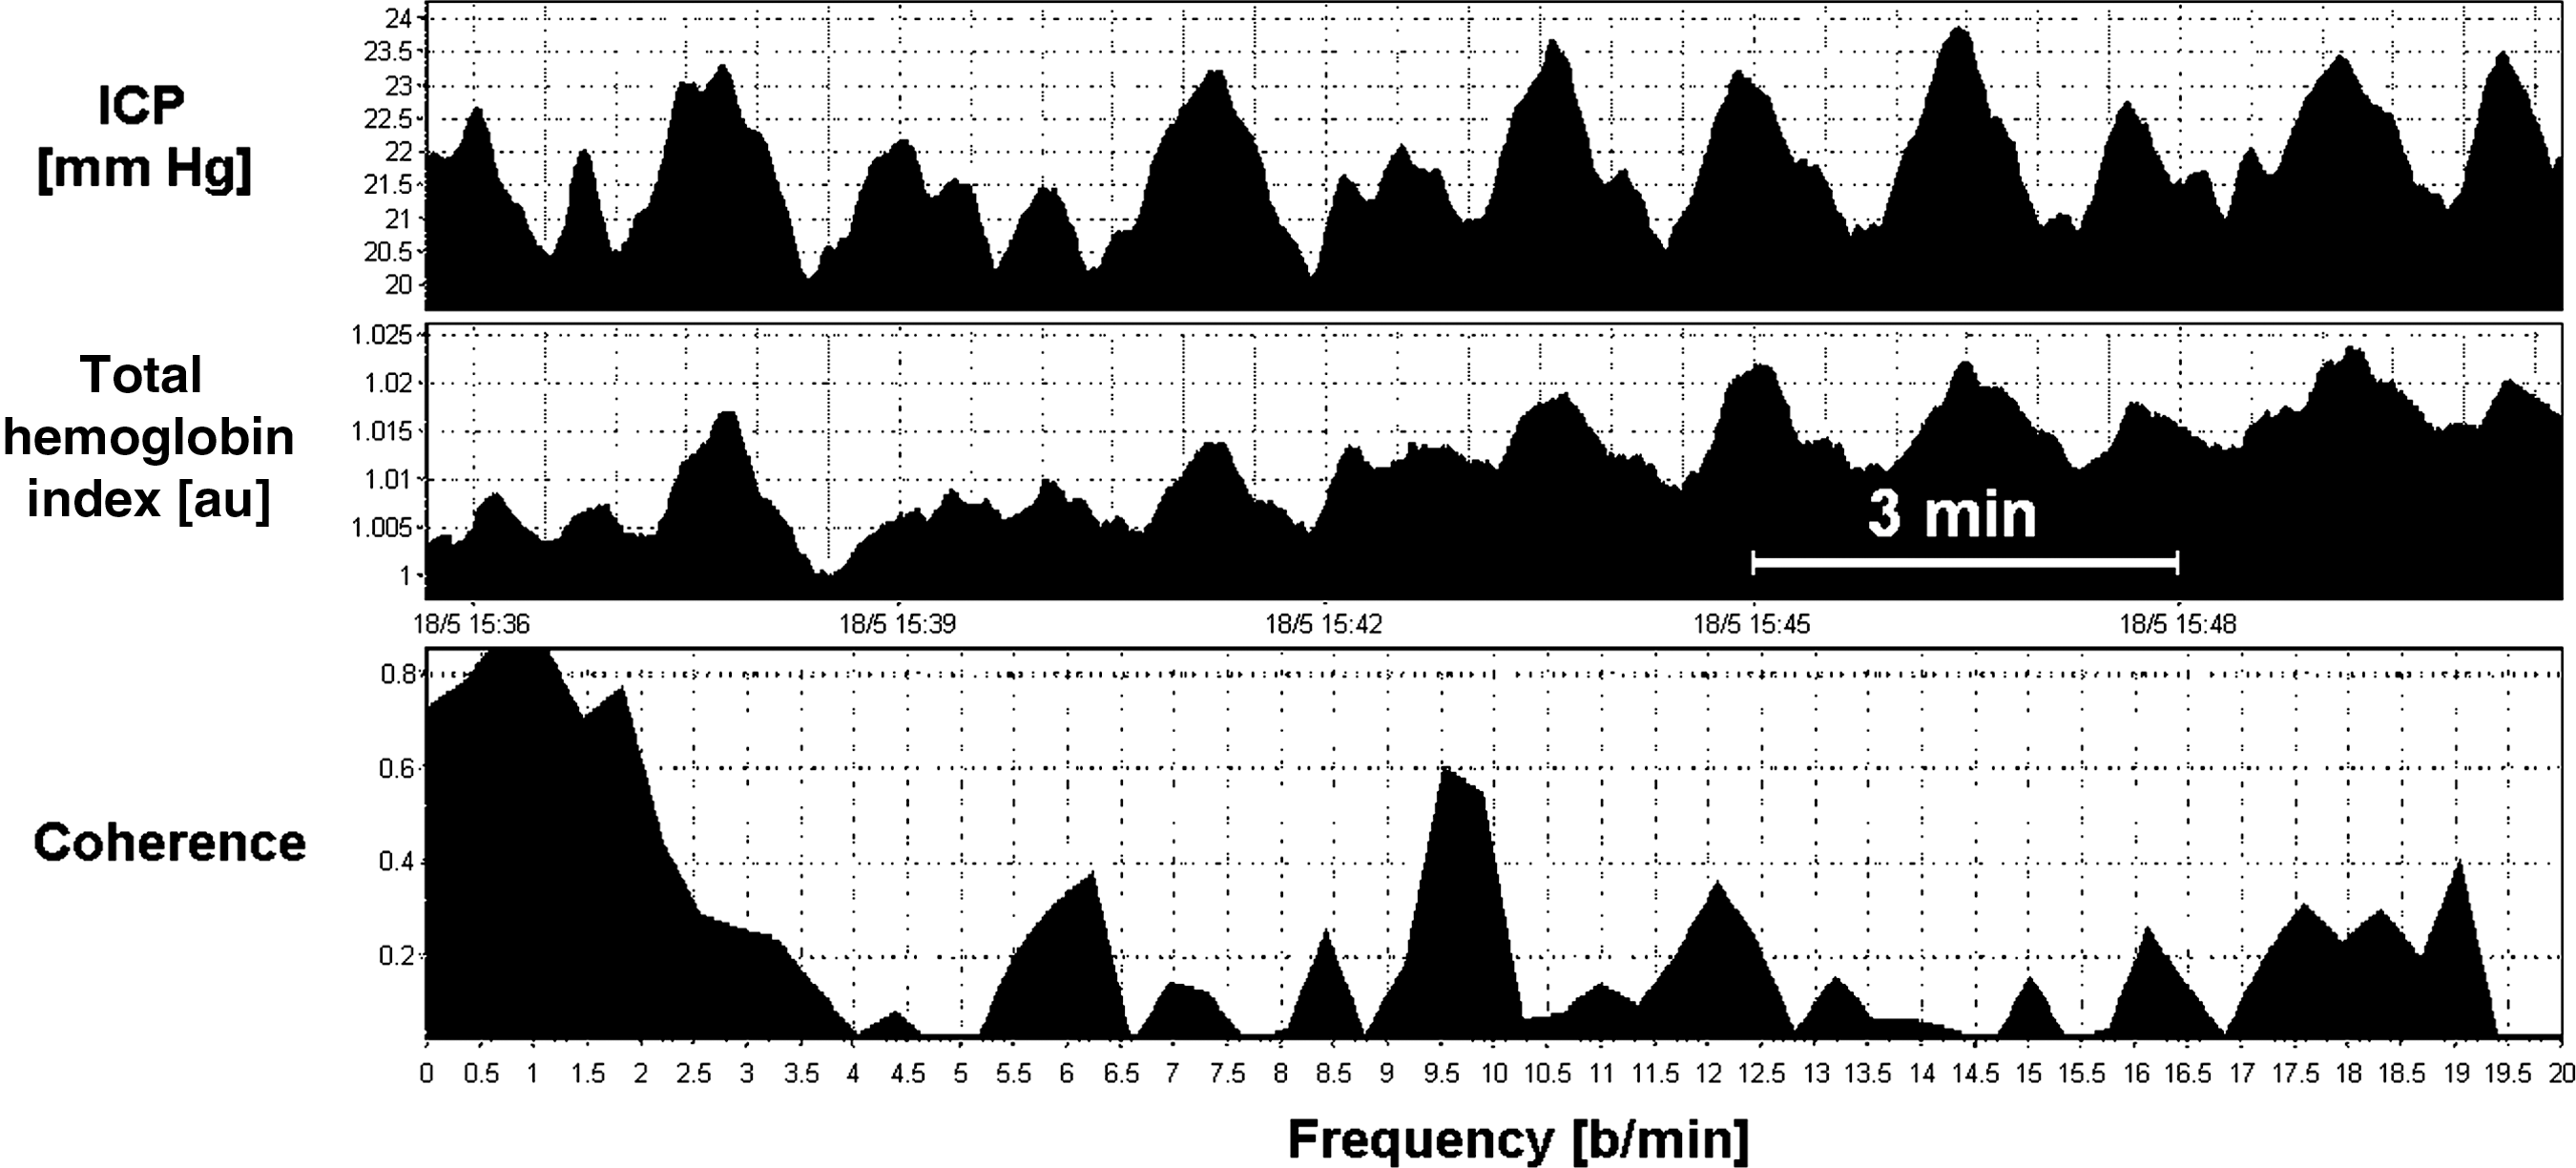
Slow waves of intracranial pressure (ICP) and blood volume, represented by total hemoglobin index measured with near infrared spectroscopy (NIRS). Both signals were subjected to a moving-average filter with a time window of 10 sec. The bottom graph shows the high coherence between ICP and total hemoglobin index waves in the 0.055–3 cycle/min frequency band (b/min, beats per minute).
Association of PRx and THx
Individual recordings revealed similar presentations of the recording intervals of PRx and THx (Fig. 2). Linear regression showed a highly significant correlation between PRx and THx (r = 0.49, p < 0.0001; Fig. 3A) across averaged individual recordings. To correct for the effect of multiple sampling, indices were averaged for each patient, and Pearson's correlation calculation was repeated. Corrected for each patient, the correlation between PRx and THx was 0.56 (p = 0.0002; Fig. 3C). The corresponding prediction model of PRx (averaged for all patients) was PRx = 0.01 + 0.7 × THx. The standard deviation of the residuals was 0.12. The Bland-Altman method showed bias across the range of measurements, which was 0.004 for all 120 recordings (Fig. 3B), and 0.02 averaged for each patient (Fig. 3D). The bias changed with the mean value.
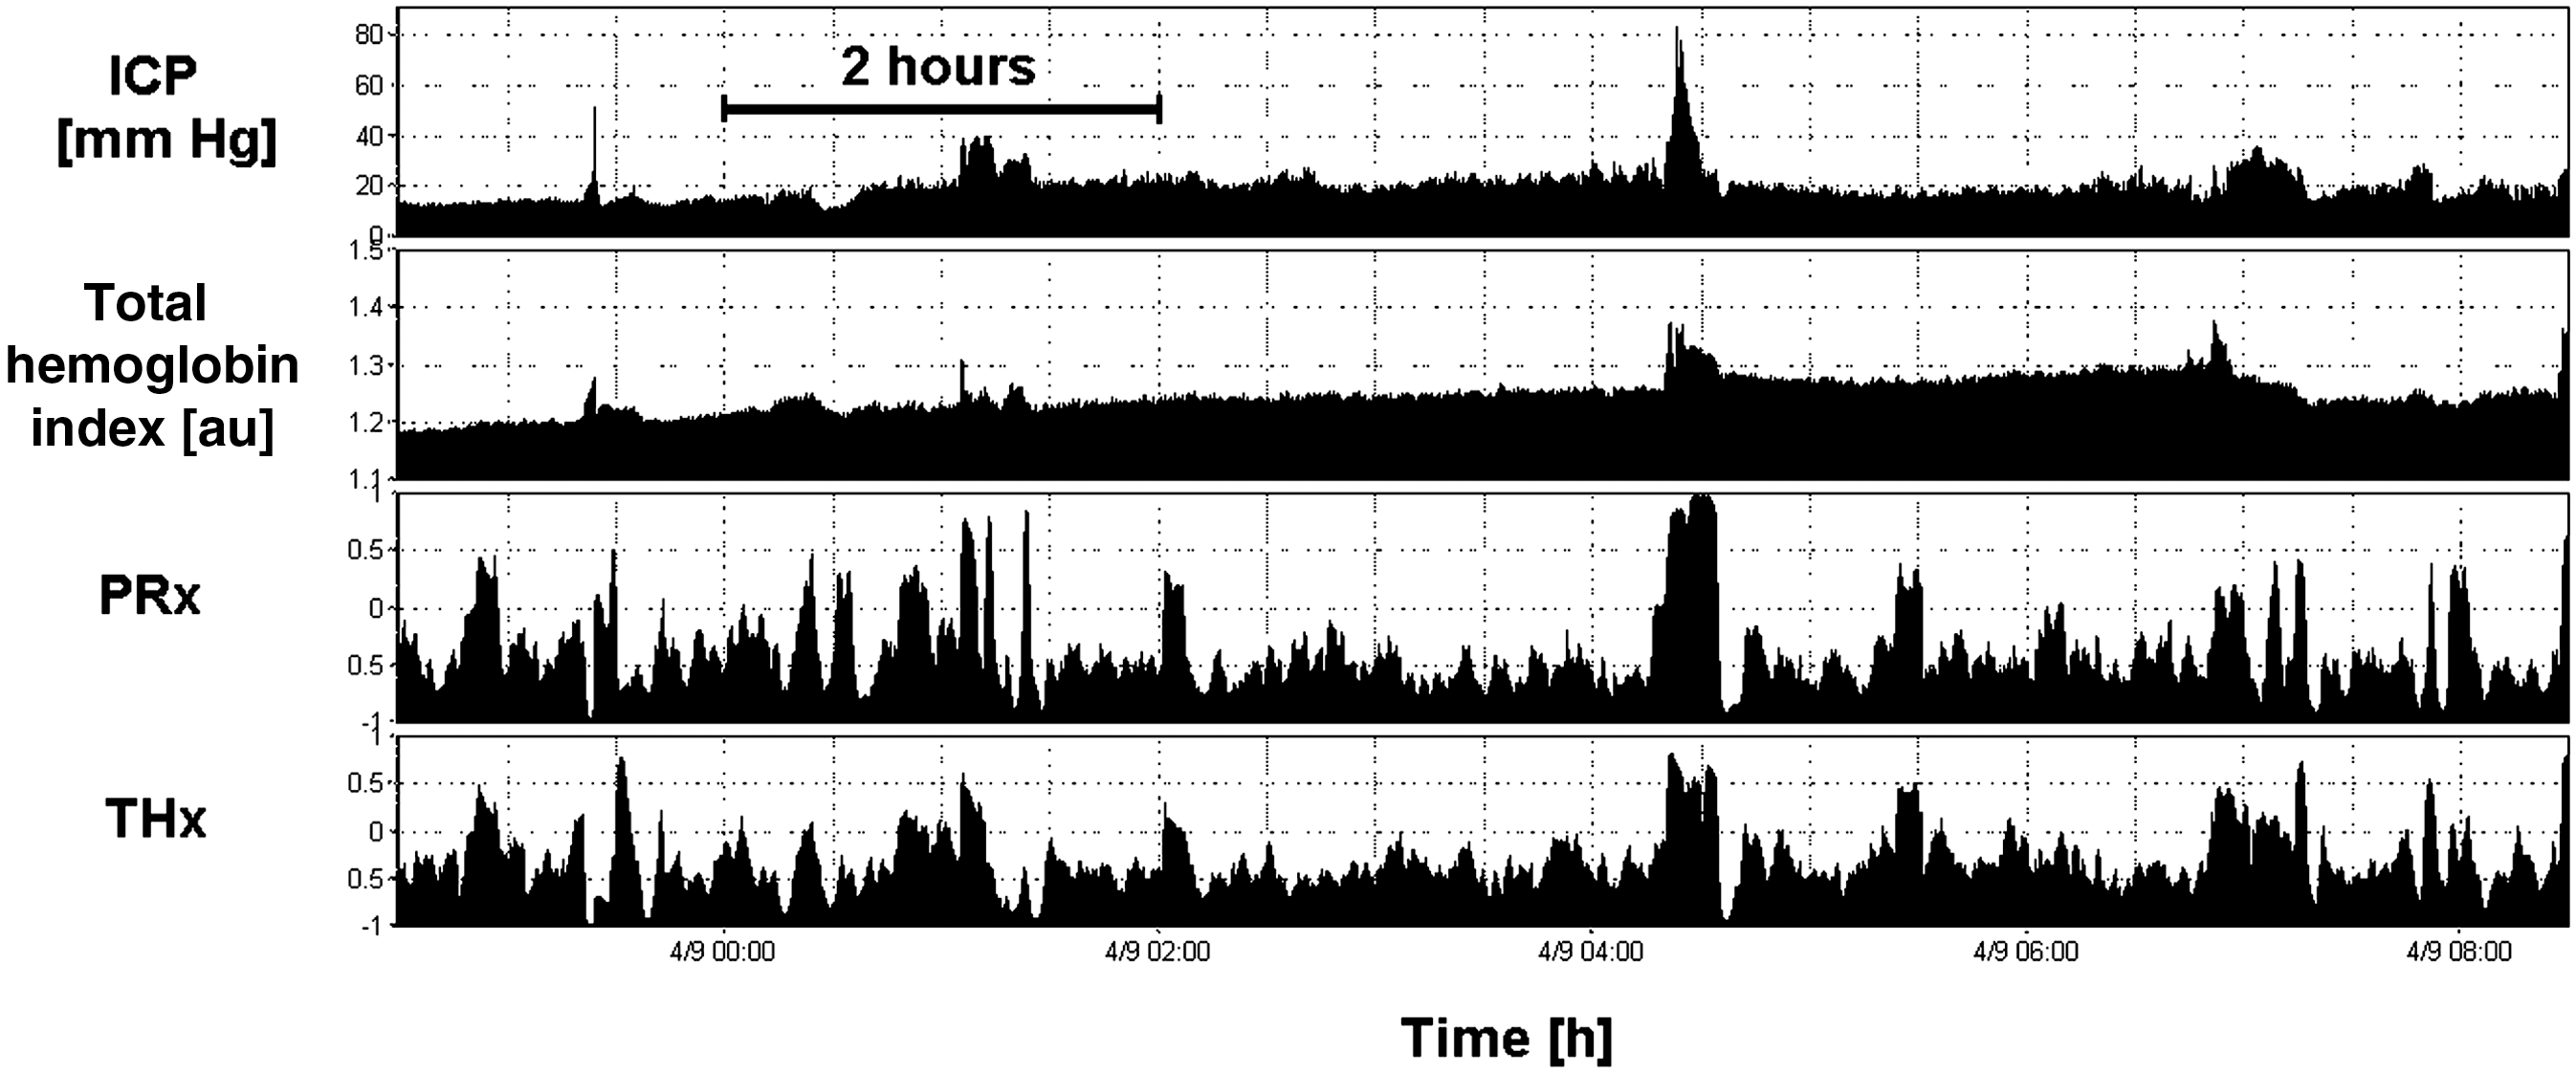
Intracranial pressure (ICP) and total hemoglobin index presented over a recording interval of 10 h. Pressure reactivity assessed with PRx and THx showed similar patterns during the recording session. Averaged value for PRx was –0.40 and for THx was −0.33, indicating intact cerebrovascular pressure reactivity as assessed with both methodologies (PRx, cerebrovascular pressure reactivity; THx, total hemoglobin reactivity).
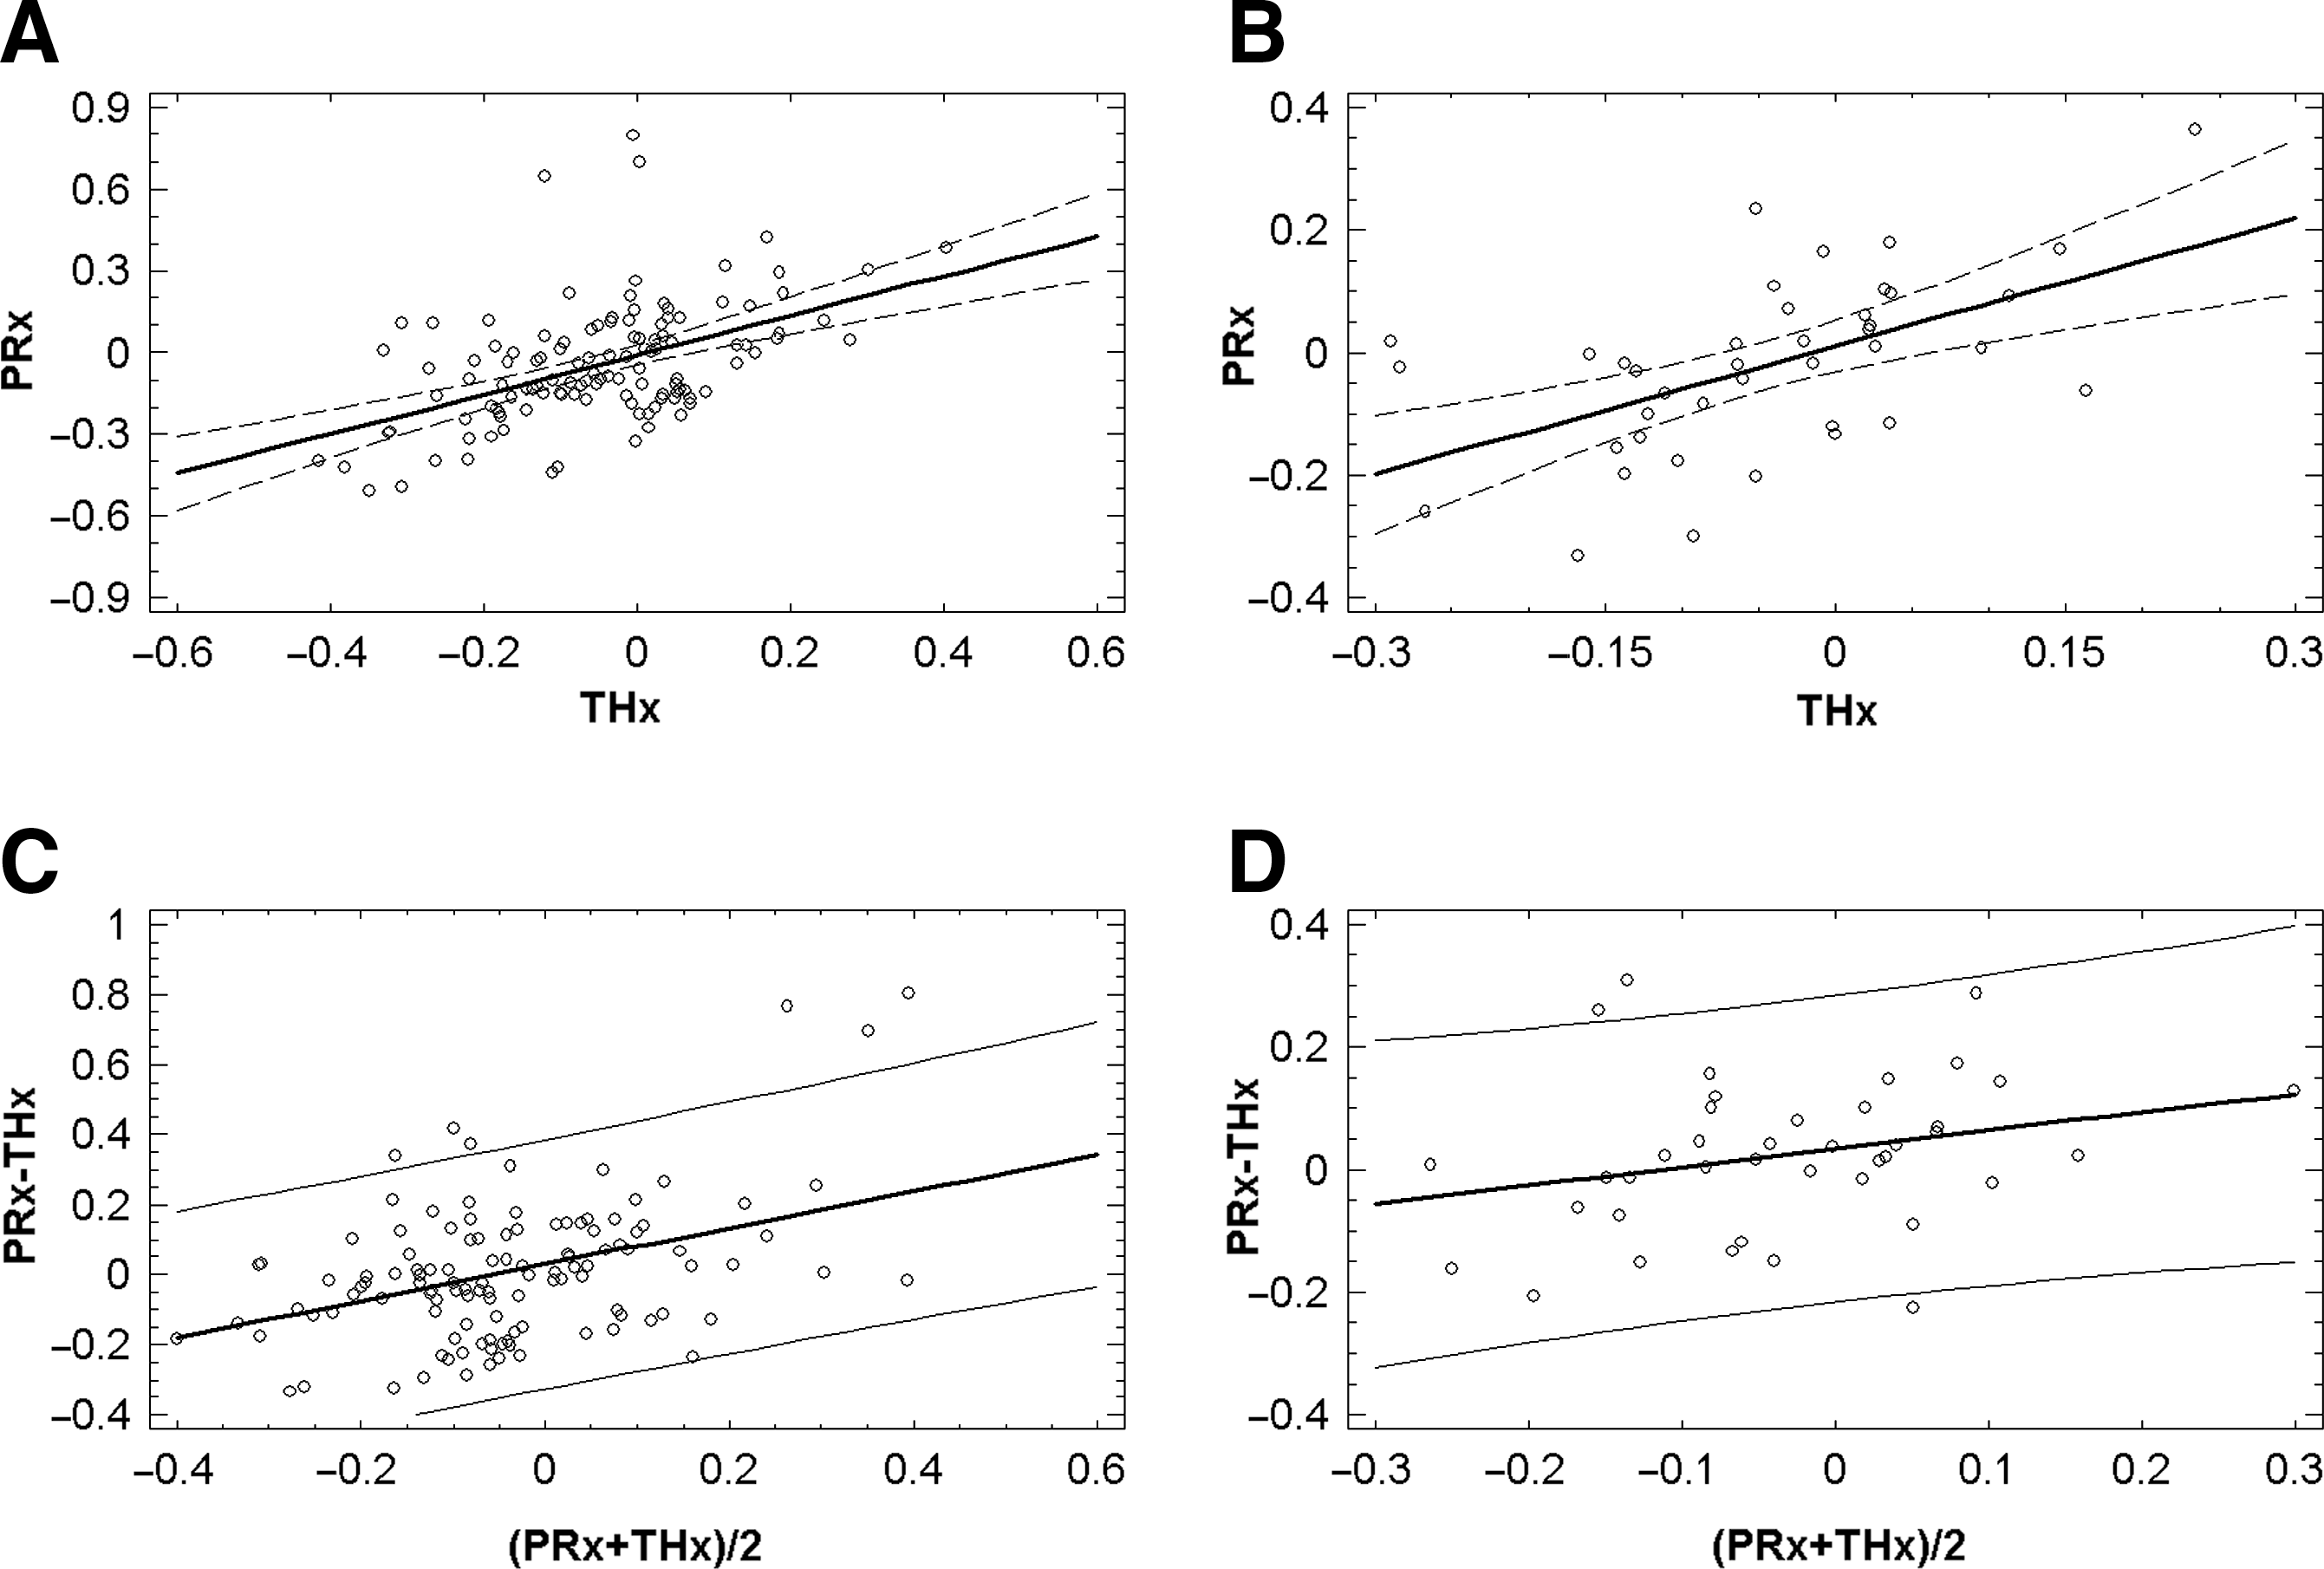
Linear regression
As frontal contusions could be a confounding factor that might influence the NIRS recording, we excluded eight patients from the analysis. After excluding these patients, the correlation between PRx and THx increased to 0.65 (32 patients; p < 0.0001).
Taking an averaged PRx value above 0.3 over one recording interval to indicate disturbed cerebrovascular reactivity, 7 out of 120 recordings met this criterion. The AUC of THx to diagnose impaired PRx > 0.3 was 0.772 (95% CI 0.59,0.96; p = 0.016; Fig. 4).
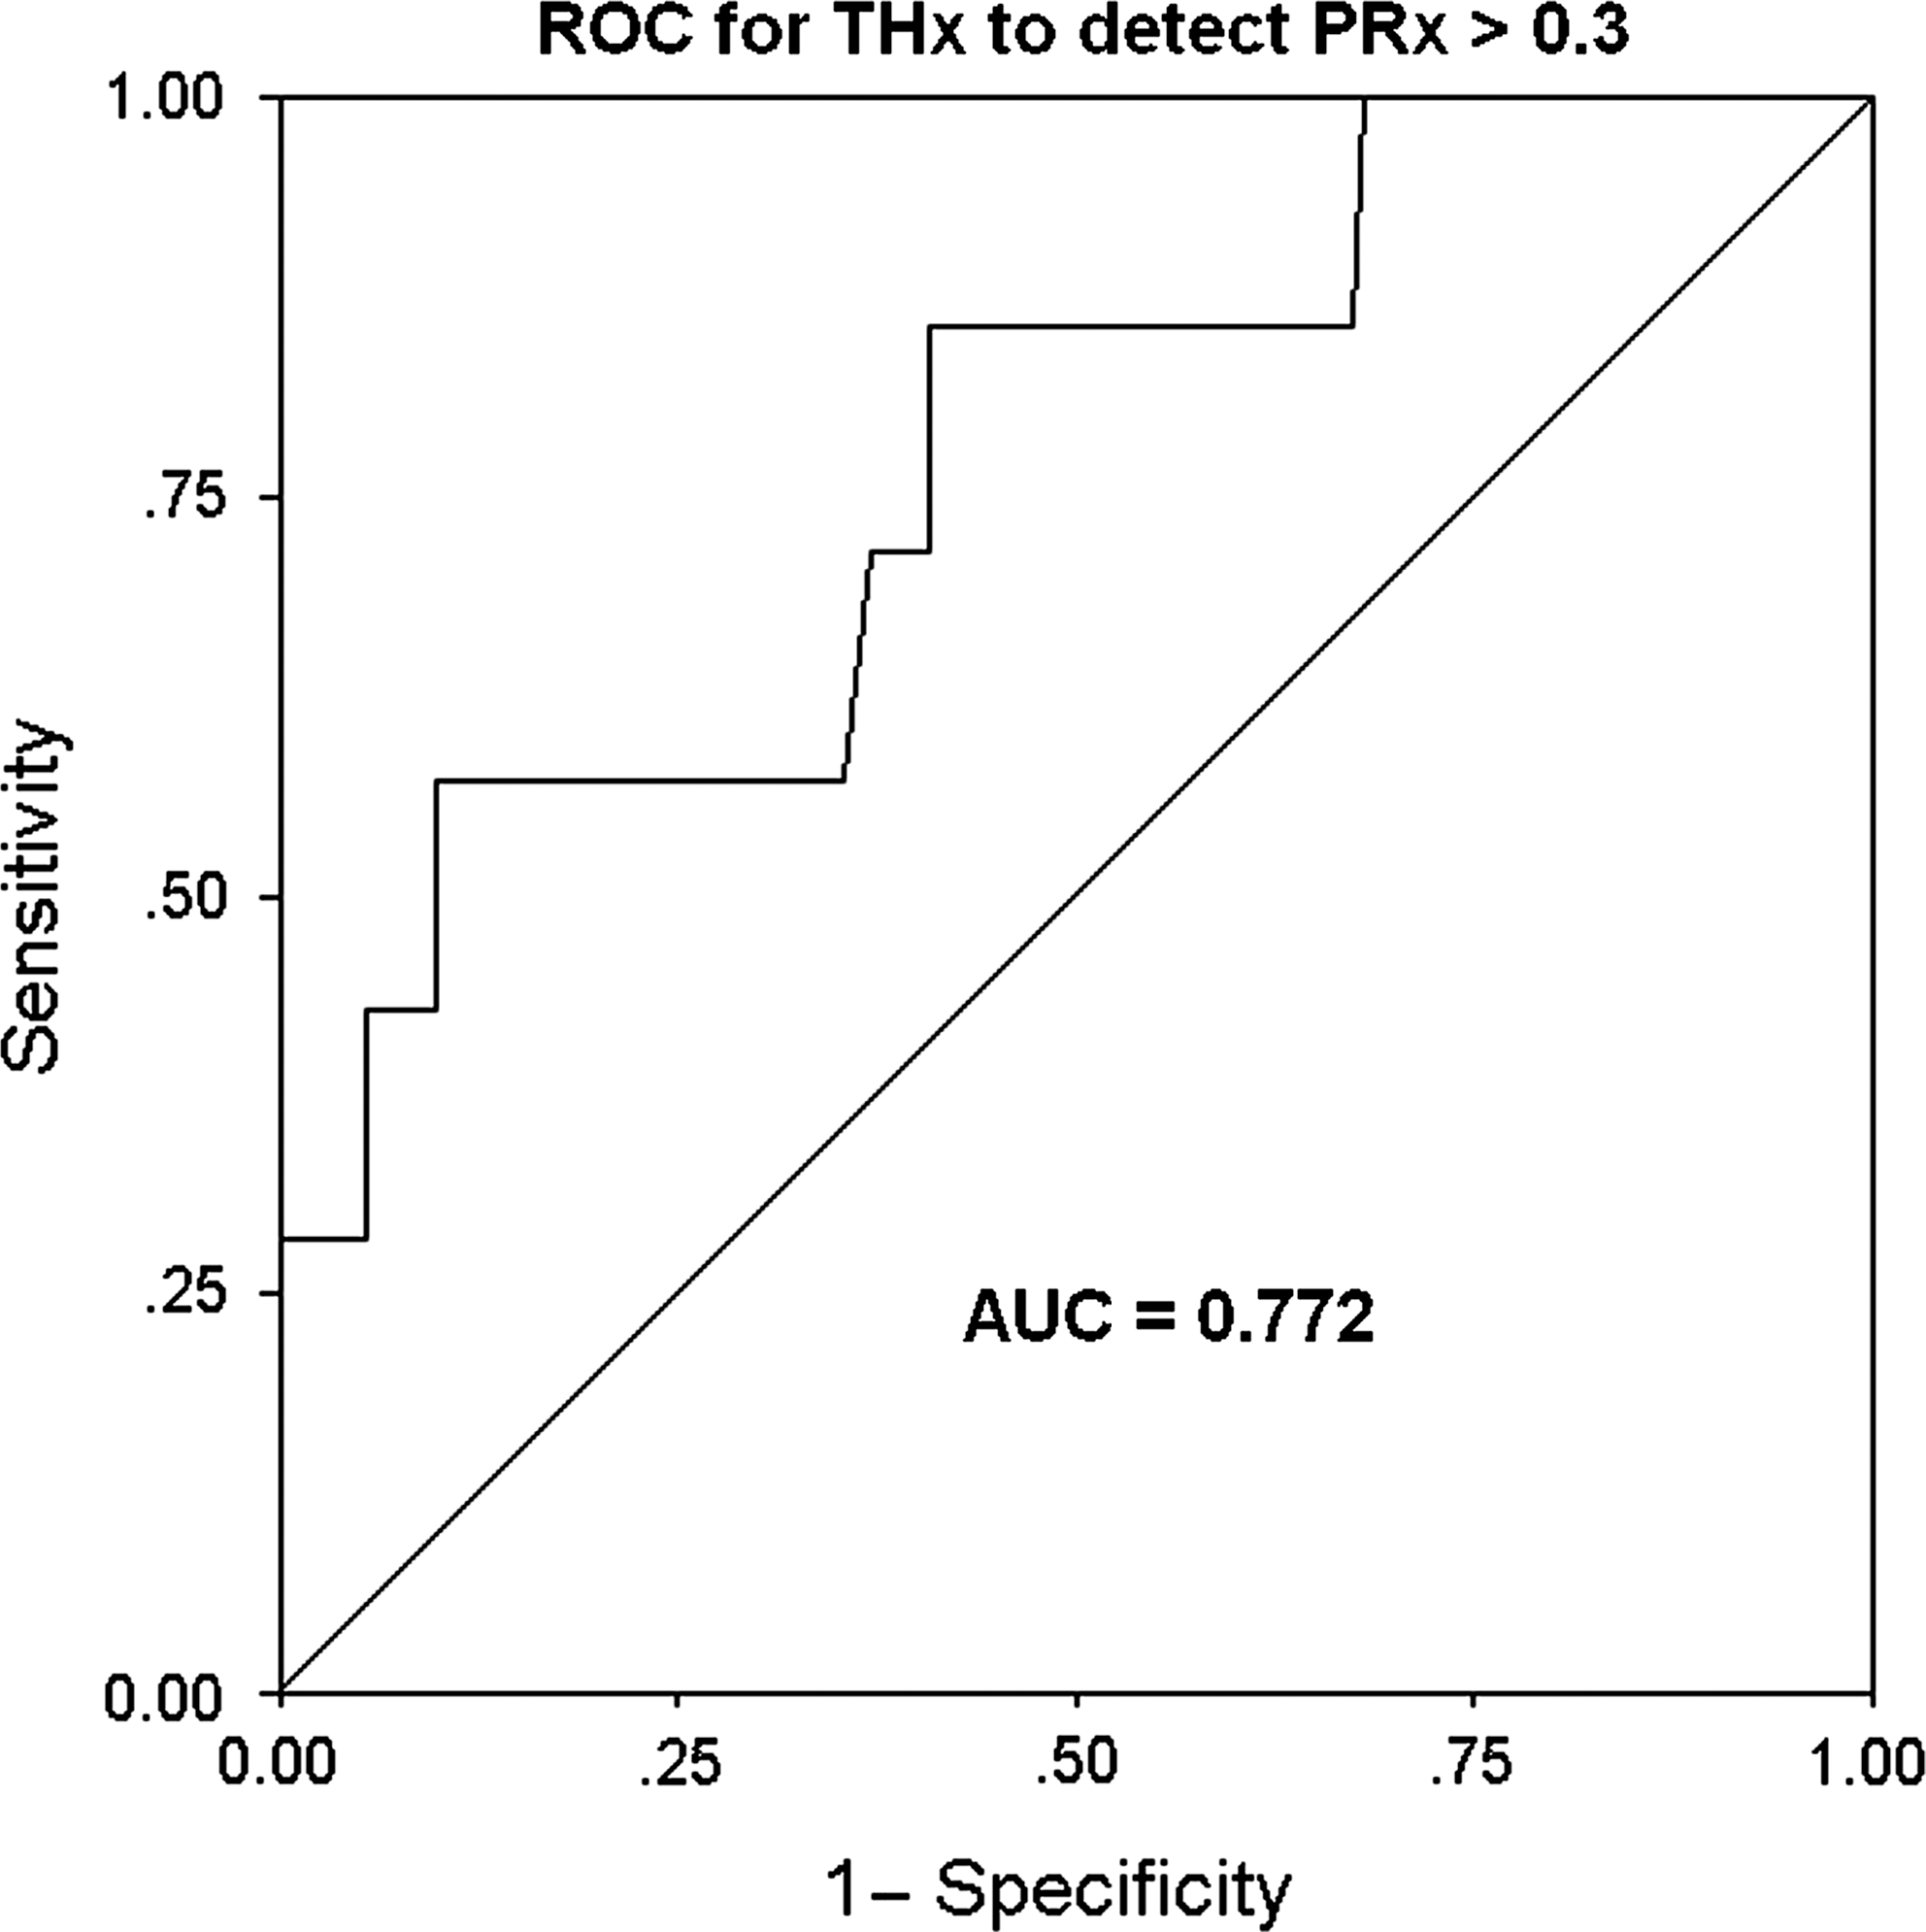
Receiver-operating characteristics curve for THx to diagnose impaired cerebrovascular reactivity (defined as PRx > 0.3) in 120 measurements (AUC, area under the curve; PRx, cerebrovascular pressure reactivity; THx, total hemoglobin reactivity).
Determination of optimal cerebral perfusion pressure
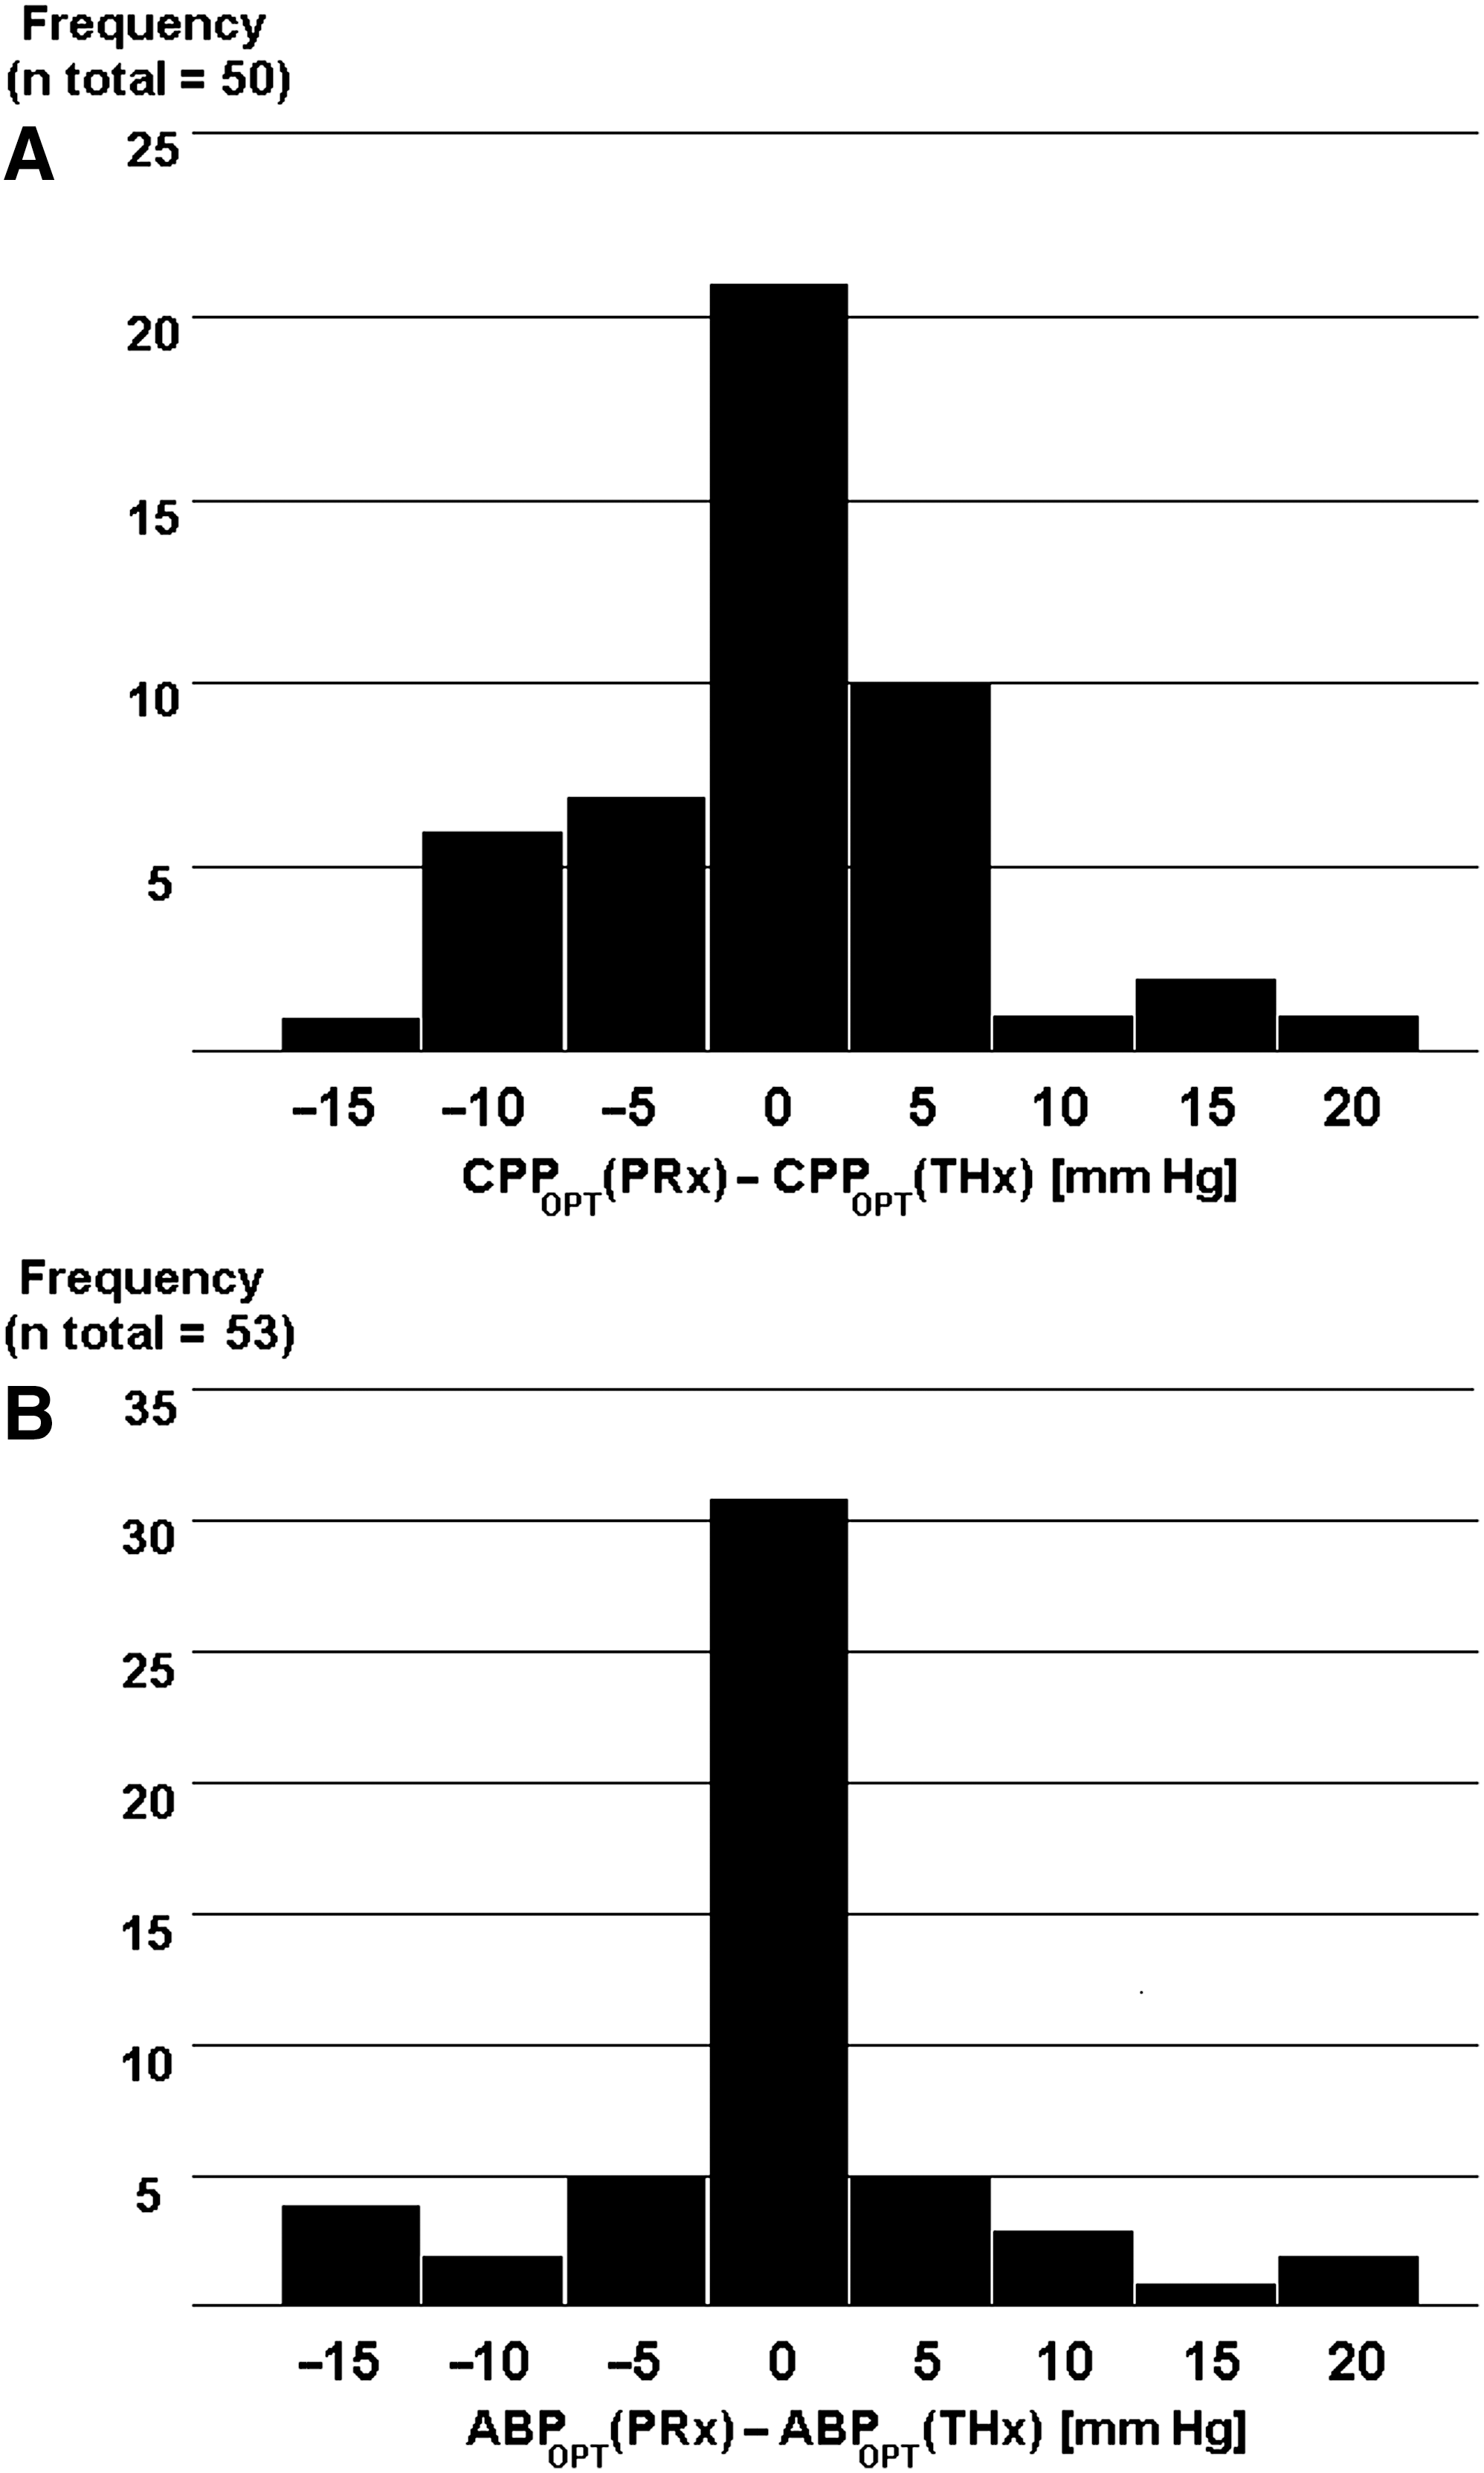
With PRx, determination of an individual's CPPOPT was possible in 72 recordings (60%), and with THx in 59 recordings (49.1%). An example of the determination of CPPOPT is shown in Figure 5A. A direct comparison of CPPOPT assessed either with PRx or THx was possible in 50 measurements (41.7%). Absolute differences of the assessment of CPPOPT (PRx) and CPPOPT (THx) are shown in Figure 6A. There was a significant correlation between PRx- and THx-assessed CPPOPT in these 50 recordings (r = 0.74, p < 0.0001), and there was no significant difference in direct paired comparison with the signed rank test (p = 1.0). The average bias of PRx- and THx-assessed CPPOPT was ± 4.5 mm Hg.
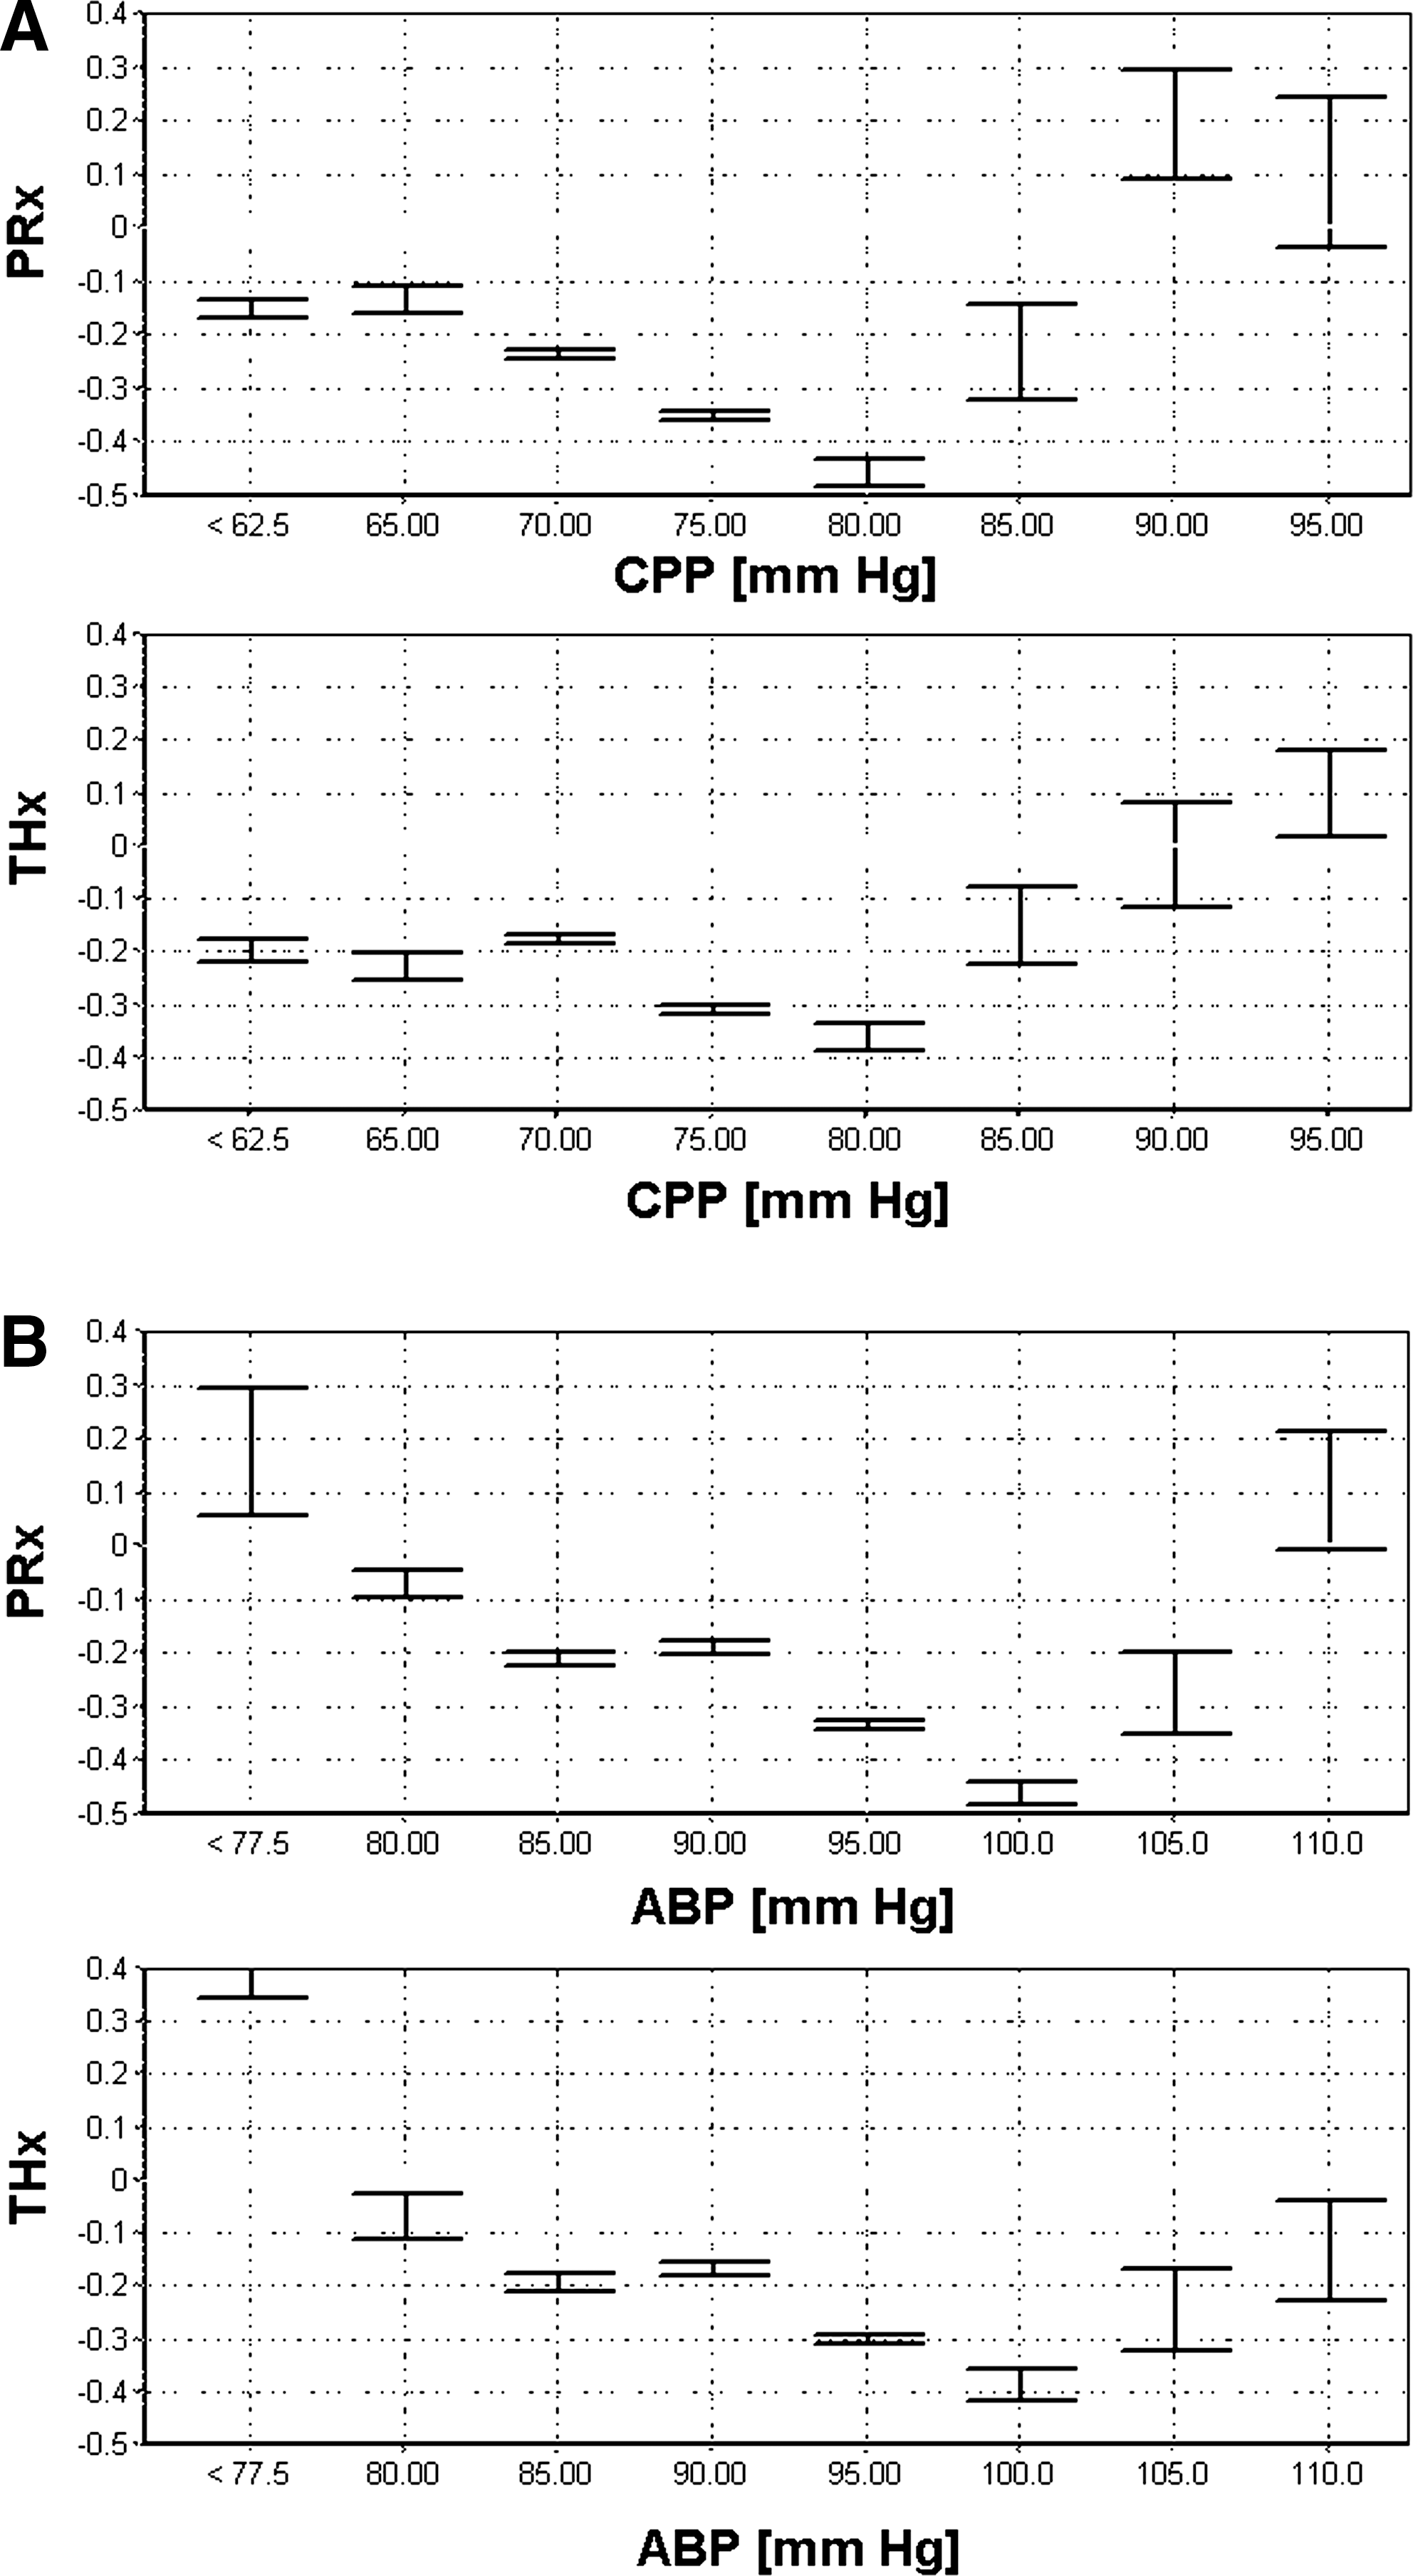
Examples of pressure reactivity index (PRx and THx) versus cerebral perfusion pressure (CPP) plots that allow determination of optimal CPP (CPPOPT) and optimal arterial blood pressure (ABPOPT) in an individual patient recorded over a time span of 10 h. CPPOPT as assessed with both PRx and THx was 80 mm Hg
Determination of optimal arterial blood pressure
Determination of ABPOPT was possible in 76 (63.3%) recordings using PRx, and in 60 (50%) using THx (Fig. 5B). In 53 recordings (44.1%), a direct paired comparison was possible and the signed rank test showed no difference (p = 1.0). The differences between ABPOPT (PRx) and ABPOPT (THx) are displayed in the frequency histogram (Fig. 6B). The average bias was ± 4.06 mm Hg between PRx- and THx-assessed ABPOPT, and the correlation was 0.82 (p < 0.0001).
Discussion
Our results show that THx, a noninvasively assessed cerebrovascular (volume) reactivity index determined using NIRS, showed a significant correlation with the validated ICP-derived cerebovascular pressure reactivity index PRx. This result is a consequence of the fact that slow waves of intracranial blood volume, which are synchronous with ICP slow waves, are reflected by the NIRS-derived total hemoglobin index. High coherence between NIRS-assessed cerebral total hemoglobin and ICP slow waves has been previously demonstrated in piglets (Lee et al., 2009). We confirmed these results in this study of head-injured patients.
Noninvasive detection of ICP slow waves has been described previously with an ultrasonic time-of-flight intracranial blood volume monitor (Ragauskas et al., 2005), or by analysis of Doppler ultrasound-derived blood flow velocity (Schmidt et al., 1997). But unlike NIRS, transcranial ultrasound requires precise probe placement, and its utility for continuous prolonged assessment of cerebrovascular pressure reactivity is limited (Steiner et al., 2009).
The phenomenon of fluctuations of the total hemoglobin index, which are synchronous with slow waves of ICP, presents new opportunities for the continuous noninvasive monitoring of cerebrovascular pressure reactivity using NIRS. Lee and associates demonstrated in piglets that the NIRS-derived hemoglobin volume reactivity correlated significantly with PRx, and that it was highly accurate for detecting the lower limit of autoregulation (Lee et al., 2009). In the present study, this methodology was used systematically for the first time in a clinical trial in adults, allowing demonstration of a significant correlation between the established PRx and the new NIRS-based index, THx.
The aim of introducing a new, near-infrared-based, cerebrovascular reactivity index was to achieve noninvasive assessment of optimal ABP, similarly to the way PRx is used to assess optimal CPP (Steiner et al., 2002). Unlike CPP, which requires highly invasive ICP measurement, continuous monitoring of arterial blood pressure is performed routinely in critical care and intraoperatively. In settings in which there are no clinical indications of increased intracranial pressure ICP monitoring is inappropriate, and ABP provides an acceptable approximation of CPP. In such cases, optimizing ABP would be equivalent to optimizing CPP. In the present study, a direct comparison of ABPOPT and CPPOPT values assessed with THx and PRx, respectively, showed significant agreement (Figs. 5 and 6), when the comparison was possible. Assessment of CPPOPT and ABPOPT using THx was successful in about 50% of recordings. For PRx, it was possible in about 60%. Our success rate was similar to the results reported by Steiner and colleagues (Steiner et al., 2002), but in our study we focused on individual recordings, in addition to individual patients. In another study, in patients with intracerebral hemorrhage, the investigators were able to identify CPPOPT in 32% of patients with a mean recording time of 95 h (Diedler et al., 2009). In our data, however, the majority of recordings that yielded CPPOPT and ABPOPT were significantly shorter (average time of 12.6 h) than those for which such an assessment was impossible (average time 17.7 h; p = 0.0122). The shortest recording interval was 140 min, and this seems to suggest that optimization of ABP and CPP may be feasible, even with short monitoring intervals of just over 2 h. Other reasons for an inability to ascertain an optimal CPP and ABP may be that the optimal value changes over the recorded time interval (e.g., by increasing ICP), or because the range of CPP and ABP interrogated during a given recording period lie just outside of the optimal values. Other factors such as selection of vasopressors and sedatives, or selection of hypertonic fluids, have previously been cited as potential factors that may prevent identification of optimal values (Steiner et al., 2002). Overall, the assessment of ABPOPT and CPPOPT requires further investigation.
The convenient and noninvasive nature of NIRS measurement makes this methodology ideally suited for use in patients in whom invasive ICP monitoring is not feasible, or when the indications for ICP bolt insertion are not clear. ICP monitoring has associated risks that must be outweighed by its benefits, which can be achieved by selecting patients that are at risk for intracranial hypertension (Bratton et al., 2007b). In patients with moderate head injuries and fluctuating clinical indications, and in comatose patients with unclear etiologies, continuous, noninvasive assessment of a NIRS-based cerebrovascular reactivity index might fill the gap between clinical observation alone and invasive ICP monitoring. The application of NIRS for the continuous assessment of cerebrovascular reactivity in premature infants may also be of benefit, as in these patients excessively low or high blood pressure levels can have highly detrimental effects (Soul et al., 2007). A noninvasive neuro-monitoring system that allows optimization of cerebrovascular reactivity in sensitive regions of the premature brain might afford better neuroprotection (Lee et al., 2009). Optimization of blood pressure to avoid cerebral ischemia or hyperperfusion have been also proposed in other clinical situations, such as in patients undergoing cardiac surgery or those in hepatic comas, for whom NIRS might help maintain cerebral perfusion within autoregulation boundaries (Harris et al., 1993; Toftengi and Larsen, 2004). With the use of the NIRS-based THx, all of these hypotheses can be tested without invasive ICP monitoring.
Limitations
The linear correlation coefficient between PRx and THx, 0.49 for individual recordings and 0.56 for all patients, cannot be considered particularly high. A potentially significant factor contributing to the differences seen in THx and PRx is that THx-assessed cerebrovascular reactivity is limited to the frontal brain region (i.e., the region under the NIRS sensors). Also, PRx reflects the vascular reactivity of the entire cerebrospinal system. Furthermore, imaging studies in head-injured patients have demonstrated local heterogeneities of cerebral autoregulation around contused areas (Steiner et al., 2003). In our data, the correlation between PRx and THx did increase when patients with frontal contusions were excluded from the analysis, suggesting that frontal contusions may limit the usefulness of this method for the noninvasive assessment of cerebrovascular reactivity.
We could not demonstrate any significant association in our cohort between age, GCS score on admission, CT scan classification, PRx, THx, and mortality or GOS scores at 6 months post-injury. The sample size was limited and the recording times could not be standardized, as the NIRS monitoring system had to be shared among patients, making uninterrupted monitoring impossible. Nevertheless, the significant correlations seen between PRx and THx, coupled with the evidence of significant correlations of PRx with outcomes in larger studies (Czosnyka et al., 1997; Steiner et al., 2002; Zweifel et al., 2008), indicate that THx may follow the same pattern. However, verification of this assertion requires further investigation.
Conclusion
ICP slow waves can be detected with NIRS, and the NIRS-derived cerebrovascular reactivity index, THx, correlated significantly with the ICP-derived index, PRx. Noninvasive assessment of the optimal ABP and CPP is feasible with this methodology. This method may be of particular benefit in patients in whom invasive ICP monitoring is not feasible, unavailable, or particularly risky. Prospective clinical trials are needed to prove that ABP optimization would be beneficial in such patients.
Footnotes
Acknowledgment
This work was supported by the National Institute of Health Research, Biomedical Research Centre (Neuroscience Theme), the Medical Research Council (grants G0600986 and G9439390), and NIHR Senior Investigator Awards (to J.D.P. and D.K.M.); and also by the Swiss National Science Foundation (PBBSP3-125550 to C.Z. and PASSMP3-124262 to E.C.), Bern, Switzerland. E.C. was additionally supported by the SICPA Foundation, Lausanne, Switzerland. P.J.A.H. is supported by an Academy of Medical Science Health Foundation Senior Surgical Scientific Fellowship.
Author Disclosure Statement
C.Z. received a travel grant from Hamamatsu Photonics, Welwyn Garden City, Hertfordshire, U.K. The software used for brain monitoring (ICM + ;