




Abstract
Trauma to the spinal cord creates an initial physical injury damaging neurons, glia, and blood vessels, which then induces a prolonged inflammatory response, leading to secondary degeneration of spinal cord tissue, and further loss of neurons and glia surrounding the initial site of injury. Angiogenesis is a critical step in tissue repair, but in the injured spinal cord angiogenesis fails; blood vessels formed initially later regress. Stabilizing the angiogenic response is therefore a potential target to improve recovery after spinal cord injury (SCI). Vascular endothelial growth factor (VEGF) can initiate angiogenesis, but cannot sustain blood vessel maturation. Platelet-derived growth factor (PDGF) can promote blood vessel stability and maturation. We therefore investigated a combined application of VEGF and PDGF as treatment for traumatic spinal cord injury, with the aim to reduce secondary degeneration by promotion of angiogenesis. Immediately after hemisection of the spinal cord in the rat we delivered VEGF and PDGF and to the injury site. One and 3 months later the size of the lesion was significantly smaller in the treated group compared to controls, and there was significantly reduced gliosis surrounding the lesion. There was no significant effect of the treatment on blood vessel density, although there was a significant reduction in the numbers of macrophages/microglia surrounding the lesion, and a shift in the distribution of morphological and immunological phenotypes of these inflammatory cells. VEGF and PDGF delivered singly exacerbated secondary degeneration, increasing the size of the lesion cavity. These results demonstrate a novel therapeutic intervention for SCI, and reveal an unanticipated synergy for these growth factors whereby they modulated inflammatory processes and created a microenvironment conducive to axon preservation/sprouting.
Introduction
Vascular endothelial growth factor (VEGF) is a potent stimulator of angiogenesis, and acute delivery of recombinant VEGF (Widenfalk et al., 2003), or cells overexpressing VEGF (Liu et al., 2010) can increase angiogenesis outside the epicenter of the lesion after spinal cord contusion injury, rescuing cells locally from ischemic death, reducing tissue loss, and improving behavioral outcomes (Kim et al., 2009; Widenfalk et al., 2003). VEGF did not increase angiogenesis at the epicenter of the lesion, and without treatment robust vessel growth can occur acutely near the lesion epicenter, only to recede at later time points (Casella et al., 2002), perhaps because of a lack of maturation of newly-formed blood vessels (Jain, 2003). Although VEGF can initiate angiogenesis, other factors are usually required for mature vessel formation (Yancopoulos et al., 2000); one of these is platelet-derived growth factor (PDGF), which stimulates smooth muscle cell migration, promoting blood vessel stability and maturation (Darland and D'Amore, 1999; Hellstrom et al., 1999). When delivered in combination VEGF and PDGF stimulated a prolonged and robust angiogenic response (Chen et al., 2007; Hao et al., 2007; Richardson et al., 2001). This led us to consider dual growth factor delivery to promote angiogenesis after SCI in an attempt to reduce secondary degeneration.
SCI elicits a complex spatio-temporal response in the injured tissue, such that a particular growth factor treatment may be useful during a limited period only, complicated by the fact that most growth factors have multiple cell targets. For example, delayed delivery of VEGF can exacerbate the injury by increasing microvascular permeability (Benton and Whittemore, 2003); it can break down the blood–spinal cord barrier and enhance monocyte cell extravasation preceding angiogenesis in the adult brain (Croll et al., 2004); and it can hasten antigen clearance in the skin (Kataru et al., 2009). PDGF can enhance early phagocytic activity of neutrophils (Wilson et al., 1987) and monocytes (Bezuidenhout et al., 2007), and modulate the activity of T-cells (Daynes et al., 1991). Although neither growth factor is directly proinflammatory, in the presence of a pre-existing inflammatory microenvironment they can be immunomodulatory. Both growth factors target receptor tyrosine kinases expressed on macrophages/microglia, and signal through a multitude of pathways, including both the Janus kinase/signal transducer and activator of transcription (JAK/STAT; Vignais et al., 1996), and mitogen-activated protein (MAP) kinase signaling pathways (Tchaikovski et al., 2008), which are involved in transcription of both pro- and anti-inflammatory responses in macrophages/microglia. When delivered adenovirally to ischemic muscle, VEGF and PDGF in combination resulted in a prolonged increase in vascular perfusion, an effect mediated via recruitment of inflammatory cells rather than directly via angiogenesis (Korpisalo et al., 2008). This led us to include an analysis of inflammatory cell populations after VEGF and PDGF treatment of the injured spinal cord.
In this study VEGF and PDGF were delivered to the site of injury after hemisection of the rat spinal cord. Two modes of delivery were attempted: acute delivery using a polymer gel, and prolonged delivery using an osmotic minipump, with the aim to investigate whether combined growth factor delivery could reduce secondary degeneration after the initial traumatic damage to the spinal cord.
Methods
Preparation of patch and pump implants
A layered hydrogel patch was made with an impermeable layer and a reservoir layer beneath it to which the growth factors were added in phosphate-buffered saline (PBS) as a solvent (Fig. 1a) The reservoir layer consisted of 0.17 mL of 40% (w/w) Pluronic F127 (Sigma-Aldrich, St. Louis, MO) containing 5 μg of recombinant human vascular endothelial cell growth factor-165 (VEGF; Invitrogen, Carlsbad, CA), and 5 μg of recombinant mouse platelet-derived growth factor-BB (PDGF-BB; Invitrogen), a thermally gelling triblock copolymer, 0.14 mL of 50% (w/w) polyethylene glycol-8000 (PEG-8000; Sigma-Aldrich), 68 μL of polyethylene glycol diacrylate (Sigma-Aldrich), and 10 μg of the water-soluble photoinitiator 2 hydroxy-4′-(2 hydroxyethoxy)-2-propiophenone. This was placed in a 5×5-mm silicone mold and polymerized under high-intensity broad-spectrum ultraviolet light for 10 sec. The impermeable layer (0.17 mL 40% [w/w] Pluronic F127, 100 μL polyethylene glycol diacrylate, and 10 μg photoinitiator) was placed on top of the already polymerized reservoir layer and polymerized as described above. The control gels were synthesized in the same manner but without the addition of growth factors. All gels were stored at −20°C until needed.
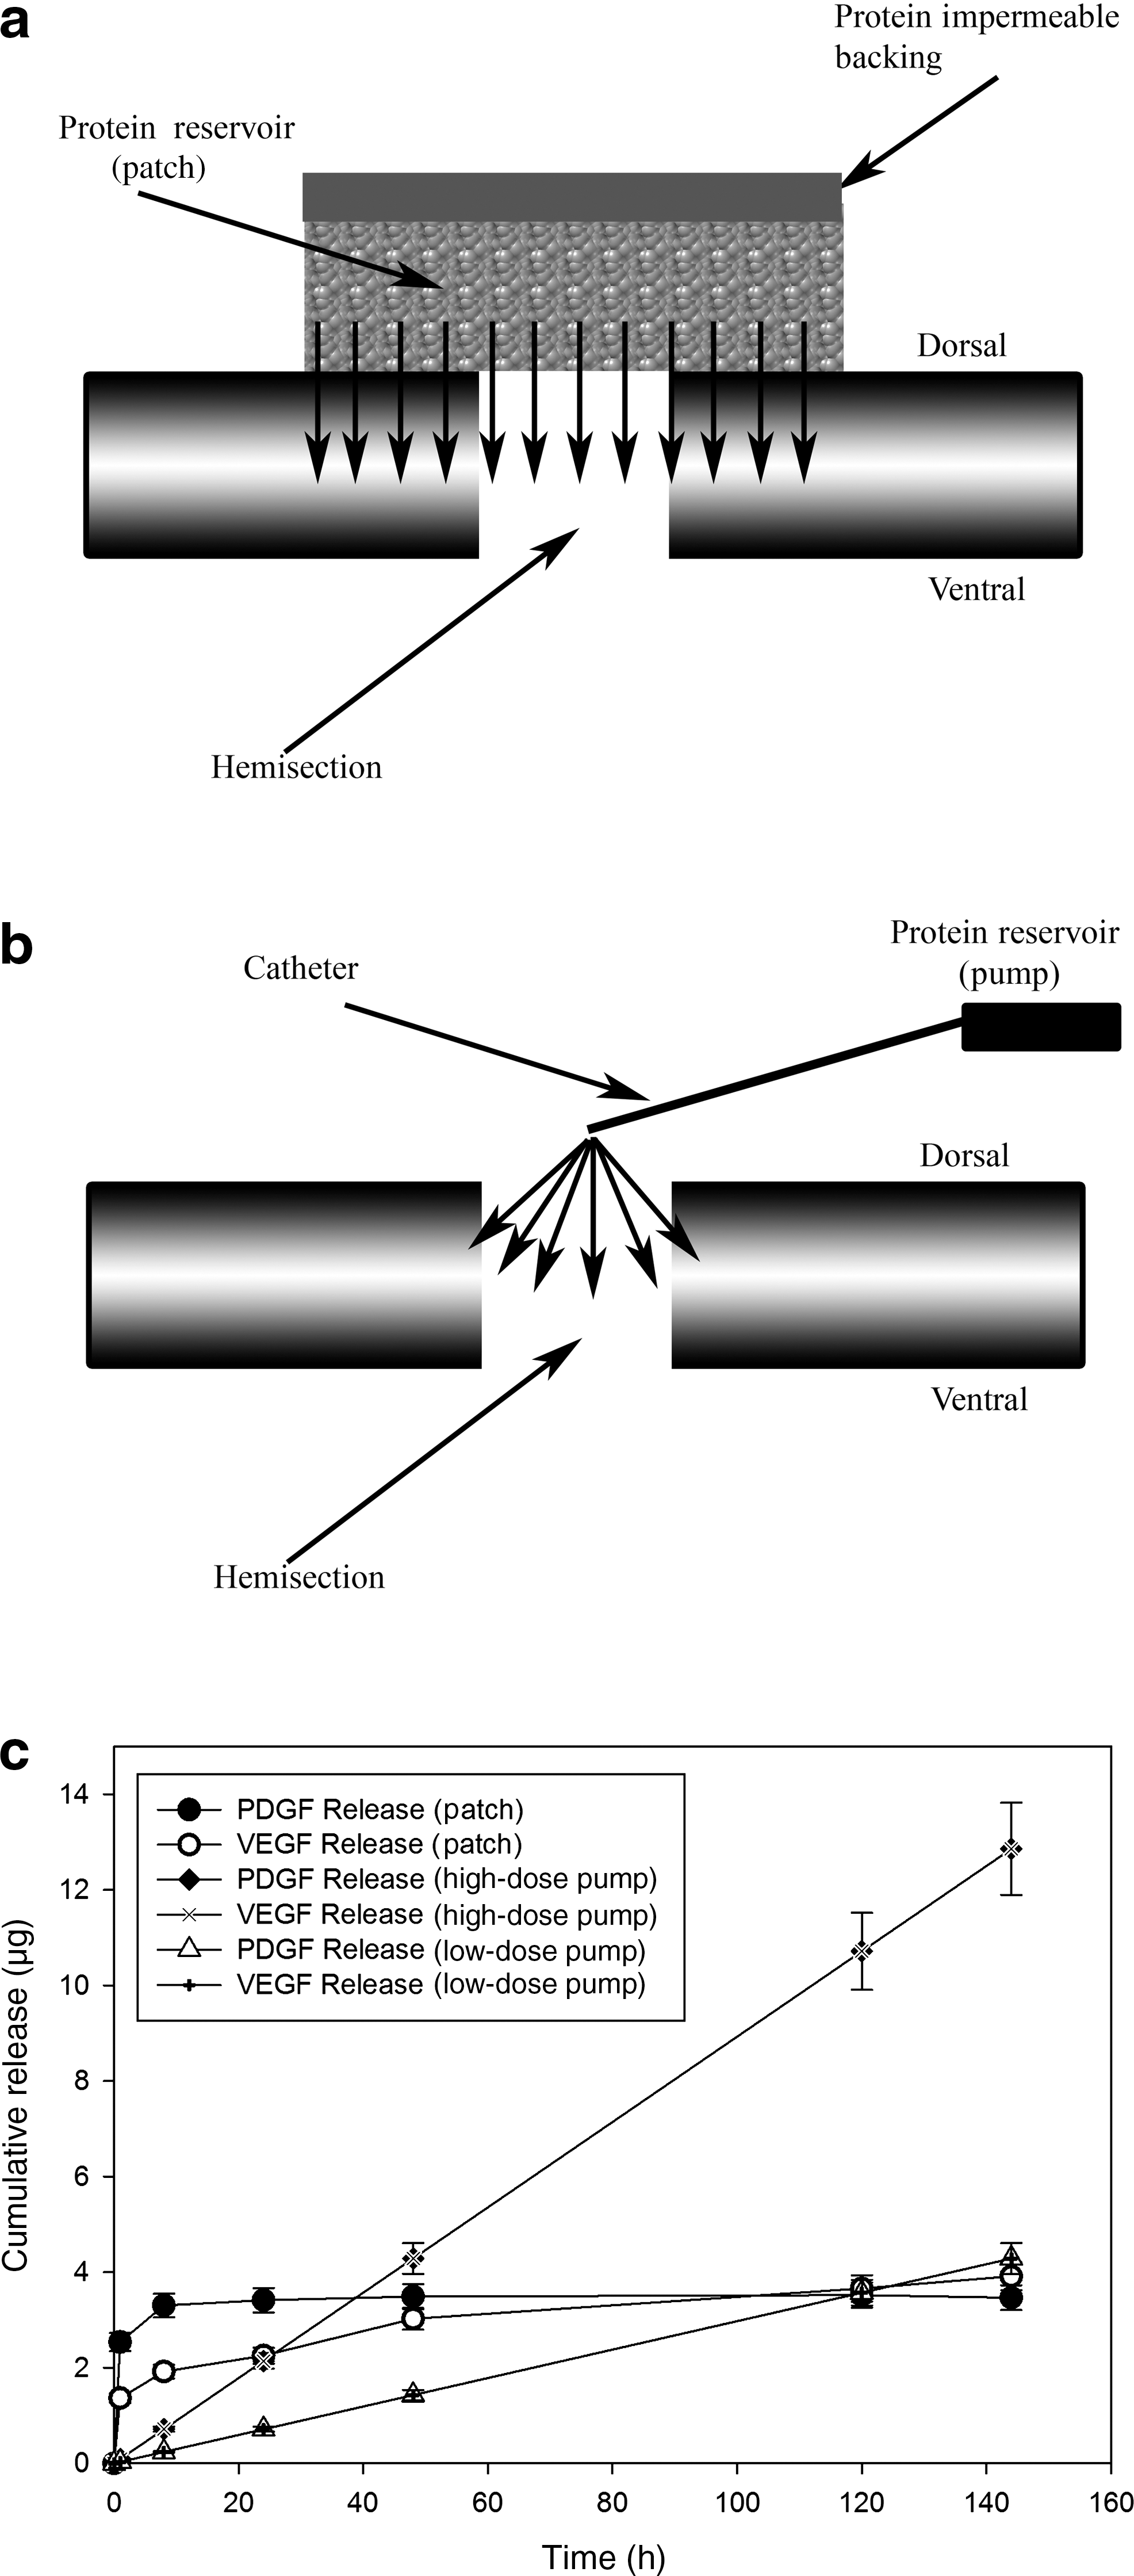
Patch and pump, implantation, and delivery profiles. (
The mini-osmotic pump (Alzet® Model 2001; 1 μL/h for 7 days) was weighed prior to loading, and then filled with VEGF (Quantikine®; R&D Systems Inc., Minneapolis, MN) dissolved in 168 μL PBS, using a blunt-tipped 27-gauge filling tube provided by the manufacturer (Fig. 1b). For combined treatments the doses of growth factors were 5 μg of each (low-dose), or 15 μg of each (high-dose). For single growth factor treatments 15 μg of either growth factor was used. The filled pump was weighed and the net weight of the growth factor solution loaded was recorded. A catheter (15 cm long) was then connected to the pump and the pump was primed with 0.9% sterile saline solution at 37°C overnight before the pump was implanted.
Quantification of growth factor release
Four individual patch implants containing VEGF and PDGF were placed in 1 μL PBS at 37°C. At different times between 1 and 240 h later, the 1 μL was collected and replaced with 1 μL fresh PBS, also at 37°C. The concentration of VEGF and PDGF of each time sample were determined using commercially-available ELISA kits according to the manufacturer's instructions (R&D Systems).
Two osmotic pumps loaded with 5 μg VEGF and 5 μg PDGF were connected to an intrathecal catheter. The tip of the catheter was placed inside a conical tube containing 200 μL PBS and the solution was changed every 24 h. The concentration of growth factors released was quantified using MicroBCA protein assay kits according to the manufacturer's instructions (Thermo Scientific, Fremont, CA).
Animal surgery
Adult male Wistar rats (for the patch experiments: 400 g, 20–25 weeks old; for the pump experiments: 300 g, 20–25 weeks old) were anesthetized (70 mg/kg Zoletil 100 IP; Virbac Laboratories, Carros, France; 20 mg/kg xylazine IP; Troy Laboratories Pty. Ltd., Glendenning, N.S.W., Australia), and laminectomies were performed at T10. Lateral hemisections were performed using iridectomy scissors followed by a cut with the tip of a 28-gauge needle to ensure a complete hemisection.
For the patch experiments animals were then randomly assigned to survival period groups (1 month or 3 months), and treatment and control groups (lesion control, gel control, growth factor treatment; n=5 per group at each survival point). In the treatment and gel control groups the implant was placed directly in contact with the dura. The laminectomy was covered by suturing muscle and skin layers above.
For the pump experiments, an additional hemi-laminectomy was performed at T12 and the catheter was passed under the T11 lamina ipsilateral to the lateral hemisection. The tip of the catheter was carefully placed on top of the lesion and sutured to the muscle to keep it in place. Mini-osmotic pumps were implanted in a subcutaneous pouch over the right flank and attached to the implanted catheter. The animals were then randomly assigned to treatment and control groups (LC: lesion control, n=6; SVC: saline vehicle control, n=6; LDP: low-dose pump, 5 μg VEGF + 5 μg PDGF, n=6; HDP: high-dose pump, 15 μg VEGF + 15 μg PDGF, n=6; VEGF: 15 μg VEGF, n=3; PDGF: 15 μg PDGF, n=3). The laminectomies were covered by suturing muscle and skin layers above them.
All procedures were approved by the animal ethics committees of the Queensland University of Technology and Griffith University according to the guidelines of the National Health and Medical Research Council of Australia.
Tissue preparation and immunofluorescence histology
At 1 or 3 months the animals were sacrificed by anesthetic overdose (1.5 mL sodium pentobarbital IP), and perfused transcardially with 200 mL PBS, followed by 200 mL Zamboni's fixative solution (pH 7.2). The spinal cord in the region of the lesion was dissected out and post-fixed in Zamboni's fixative solution overnight at 4°C. The spinal cord was then dehydrated (sequential transfers through 50%, 70%, and 100% ethanol solutions, 1 h each), and then embedded in polyethylene glycol (Bard and Ross, 1986), after which 40-μm horizontal sections were cut using a Leica RM2255 rotary microtome.
The sections were washed with PBS-Triton (0.1% Triton-X100 in PBS) for 10 min. The sections were permeabilized in dimethyl sulfoxide for 20 min and washed three times in PBS-Triton for 15 min. After washing, the sections were blocked with 10% donkey serum (Sigma-Aldrich) and 0.1% Triton-X100 in PBS for 1 h, anti-neurofilament 200 (NF200), and mouse monoclonal antibody (1:800 Chemicon, Temecula, CA); anti-glial fibrillary acidic protein (GFAP), rabbit polyclonal antibody (1:2000; Dako North America, Inc., Carpenteria, CA); anti-smooth muscle actin, mouse monoclonal antibody (1:1000; Sigma-Aldrich); anti-ionized calcium binding adaptor molecule 1 (IBA-1), rabbit polyclonal antibody (1:2000; Wako Chemicals USA, Inc., Richmond, VA); and neuron/glia type 2 antigen (NG2) rabbit polyclonal antibody (1:500 Chemicon). The sections were washed three times in PBS-Triton and incubated with Alexa Fluor 594 donkey anti-mouse IgG (A-21203, 1:800; Life Technologies, Carlsbad, CA), or donkey anti-mouse or Alexa Fluor 488 donkey anti-rabbit IgG (A-21206, 1:400; Life Technologies) overnight at room temperature. The sections were washed three times in PBS-Triton and mounted with slide mounting medium with 4,6-diamino-2-phenylindole (DAPI; Vector Laboratories, Burlingame, CA).
The specimens were visualized on an Axio Imager Z1 epifluorescence microscope with Apotome, using 5× and 20× Plan-Apochromatic objectives (n.a.: 0.30 and 0.75, respectively), and an oil immersion 63× Plan-Apochromatic objective (n.a: 1.40). Standard wide-field images and serial optical sections were captured on an AxioCam Mrm camera using AxioVision software. Data were generated, manipulated, and analyzed using AxioVision. Standardized exposure times were used for each primary/secondary combination (40 msec for GFAP/Alexa Fluor 488, 80 msec for NF-200/Alexa Fluor 594). Figures were compiled in Adobe Photoshop 11. All quantifications of histological measurements were performed blinded to the treatment of the animals.
Quantification of lesion cavity size
The size of the lesion cavity was measured at the center of the spinal cord, and assessed by the presence of the central canal in these horizontal sections, cross-checked to ensure that this midline section was midway through the stack of serial horizontal sections taken from the dorsal to the ventral surface. There was occasionally a discrepancy between these two midline indicators due to minor variations in the orientation of the cord during embedding, in which case we used the latter direct measurement of the slice position. The tissue sections were inspected to ensure they were structurally complete, except for the lesion, and stained for GFAP and NF200. After staining, a mosaic of nine adjacent images were taken of the lesion site and surrounding tissue using a 10× objective. These were compiled into a single image using AxioVision 4.7, and fluorescence images were complied for both secondary antibodies to define the lesion size by the margin of NF200 and GFAP immunoreactivity. The lesion cavity size was measured by outlining the margin of the immunopositive area with the AxioVision measuring tool. The measurements of the midline lesion area were averaged for all 5 animals per group. All image analysis was performed with the observer blinded to the treatment group.
Quantification of blood vessel density
Total blood vessel density was determined from tissue sections taken 140 μm ventral to the midline section. These sections were stained for GFAP to determine the lesion margin, and smooth muscle actin (SMA) was used to identify mature blood vessels. Images were taken 200 μm from the GFAP-defined lesion margin. The area of tissue staining positive for SMA was measured by manually outlining the SMA-positive areas using the AxioVision 4.7 measuring tool, and the density was determined as the percentage of the overall field of view that was outlined as positive for SMA. This was repeated at four locations around the lesion margin for each animal, then averaged across all animals in each treatment group. Differences in the mean blood vessel density were tested using analysis of variance (ANOVA). All image analysis was performed with the observer blind to the treatment group.
Quantification of gliosis
Gliosis was quantified as previously described and validated (Romero-Sandoval et al., 2008). Three dimensional Z-stack mosaic images (3×5-μm slices) were taken 200 μm from the GFAP-defined lesion margin (at least 5 positions per slide) in sections dorsal and ventral to the midline section. GFAP staining was quantified from the pixel intensity in these images. Care was taken to keep all variables constant across all animals. All sections were processed in the same manner for immunofluorescence, and the same microscope settings and imaging variables were used for all tissue sections, with exposure time fixed at 40 msec. The images were imported into Adobe Photoshop CS2 without altering the image settings. A 200×200-μm box (i.e., one-quarter of the original image) was chosen from the original images to provide a homogeneous field free of blood vessels, autofluorescence, and other artifacts. These cropped images were analyzed using MatLab® embedded with Image Processing Toolbox 6.2 with the threshold intensity of 10 (>10=bright; <10=dark). Data were presented as a percentage of bright pixels in the whole cropped images. All image data was subjected to manual verification and analyzed using Sigma Plot 9.0. All image analyses were performed with the observer blinded to the treatment group.
Quantification of microglia/macrophage size distribution
Three dimensional Z-stack mosaic images were taken at 200 μm from the GFAP-defined lesion margin. Macrophages/microglia were counted was performed using the set of 3D stereological rules described by Williams and Rakic (Williams and Rakic, 1988). Briefly, using a 20×objective, five optically defined counting boxes 300×300×25 μm3 were identified around the lesion perimeter in each of five tissue sections taken dorsal and ventral to the midline section of the horizontally sectioned cord (n=25 fields per animal, 5 animals per group). In each of these fields the total number of IBA-1-immunopositive cells was counted, using DAPI to identify the cell nucleus, and IBA-1 to identify the cell body, and the size of the cell body at the area of greatest cross-section was measured using the AxioVision measuring tool. Cells were only measured if they were entirely contained within the box or intersected the top, rear, or right optical planes (Williams and Rakic, 1988).
IBA-1-positive cells were classified into classes based on their soma size and morphology, which indicate the activation state of microglia/macrophages (Choo et al., 2008; Giulian, 1987; Glenn et al., 1992; Sheng et al., 1998; Stence et al., 2001). The cells were classified as: resting, a small ramified appearance, cell body cross-sectional area of 20–30 μm2; primed/activated, a larger cell (cross-sectional area of 30–150 μm2) with none or few thick processes; or phagocytic, very large cell (cross-sectional area greater than 150 μm2), without processes. All image analysis was performed with the observer blinded to the treatment group.
There is recent evidence for a subpopulation of IBA-1-positive anti-inflammatory microglia that co-stain with an antibody to NG2 co-staining (Smirkin et al., 2010). Spinal cords were immunostained with antibodies to IBA-1 and NG2 and analyzed for co-expression in the same cells using a confocal laser scanning microscope. Typically, Z-stacks were acquired and a cross-sectional profile was assessed using Leica Microsystems LAS AF software (version 1.8.2, build 1465) to ensure that co-staining occurred at the same location in all three dimensions and truly represented co-localization of the antibodies.
Behavioral analysis
In the patch experiment, functional recovery was evaluated using the Basso-Beattie-Bresnahan (BBB) open-field locomotion scale. This is an observer-rated test which assigns a score between 0 and 21, representing the extremes of no hindlimb movement and normal locomotion, respectively (Basso et al., 1995). This is a well-validated scale, although it has limitations when applied to a hemisection model (Kwon et al., 2002). Rats were evaluated at different times after lateral hemisection and treatment (1 day, 1 month, and 3 months). Behavioral analysis was performed by trained investigators who were blinded to the treatment group.
Statistical analysis
ANOVAs were performed for lesion size measurements made at individual time points and immunostains. Post-hoc analysis of significant differences was performed using the Fisher least significant difference (LSD) test (α=0.05, n=5 animals in each case). A Kruskal-Wallis ANOVA on ranks was used to compare GFAP density between groups. Post-hoc analysis was performed using Dunn's method (α=0.05). A minimum of 30 individual tissue samples across animals were used for each group. An ANOVA was used to examine statistically significant differences between microglia/macrophage populations. Post-hoc analysis of significant differences was performed using the Fisher LSD test (α=0.05). Each measurement was made from a minimum of 17 tissue samples across animals. The BBB scores were analyzed by ANOVA.
Results
Acute VEGF/PDGF patch delivery reduced lesion cavity size
In vitro testing, which approximates in vivo release, showed that 70% of the growth factors were delivered from the patch within 48 h and that VEGF and PDGF had similar release curves (Fig. 1c). At 1 and 3 months following injury and patch implantation there were dramatic histological differences between the treatment and lesion control groups (Fig. 2a–d). The lesion cavity was defined in two ways: by the margin of axons using NF200 immunoreactivity (Fig. 2f), and by the margin of astrocytes using GFAP immunoreactivity (Fig. 2e). Examination of the treated lesion 1 month after injury showed that the cavity defined by GFAP immunoreactivity was filled with NF200-positive axon fibers and IBA-1-positive macrophages/microglia (Fig. 3a–c). In the control animals at 1 month there were no tissues within the GFAP-defined lesion cavity (Fig. 3d–f). By 3 months in the treatment group the lesion cavity was filled with NF200-positive axons and IBA-1-positive macrophages/microglia (Fig. 3g–i) whereas control lesion cavities remained empty of cells, forming a typical post-hemisection cystic cavity (Fig. 3j–l).
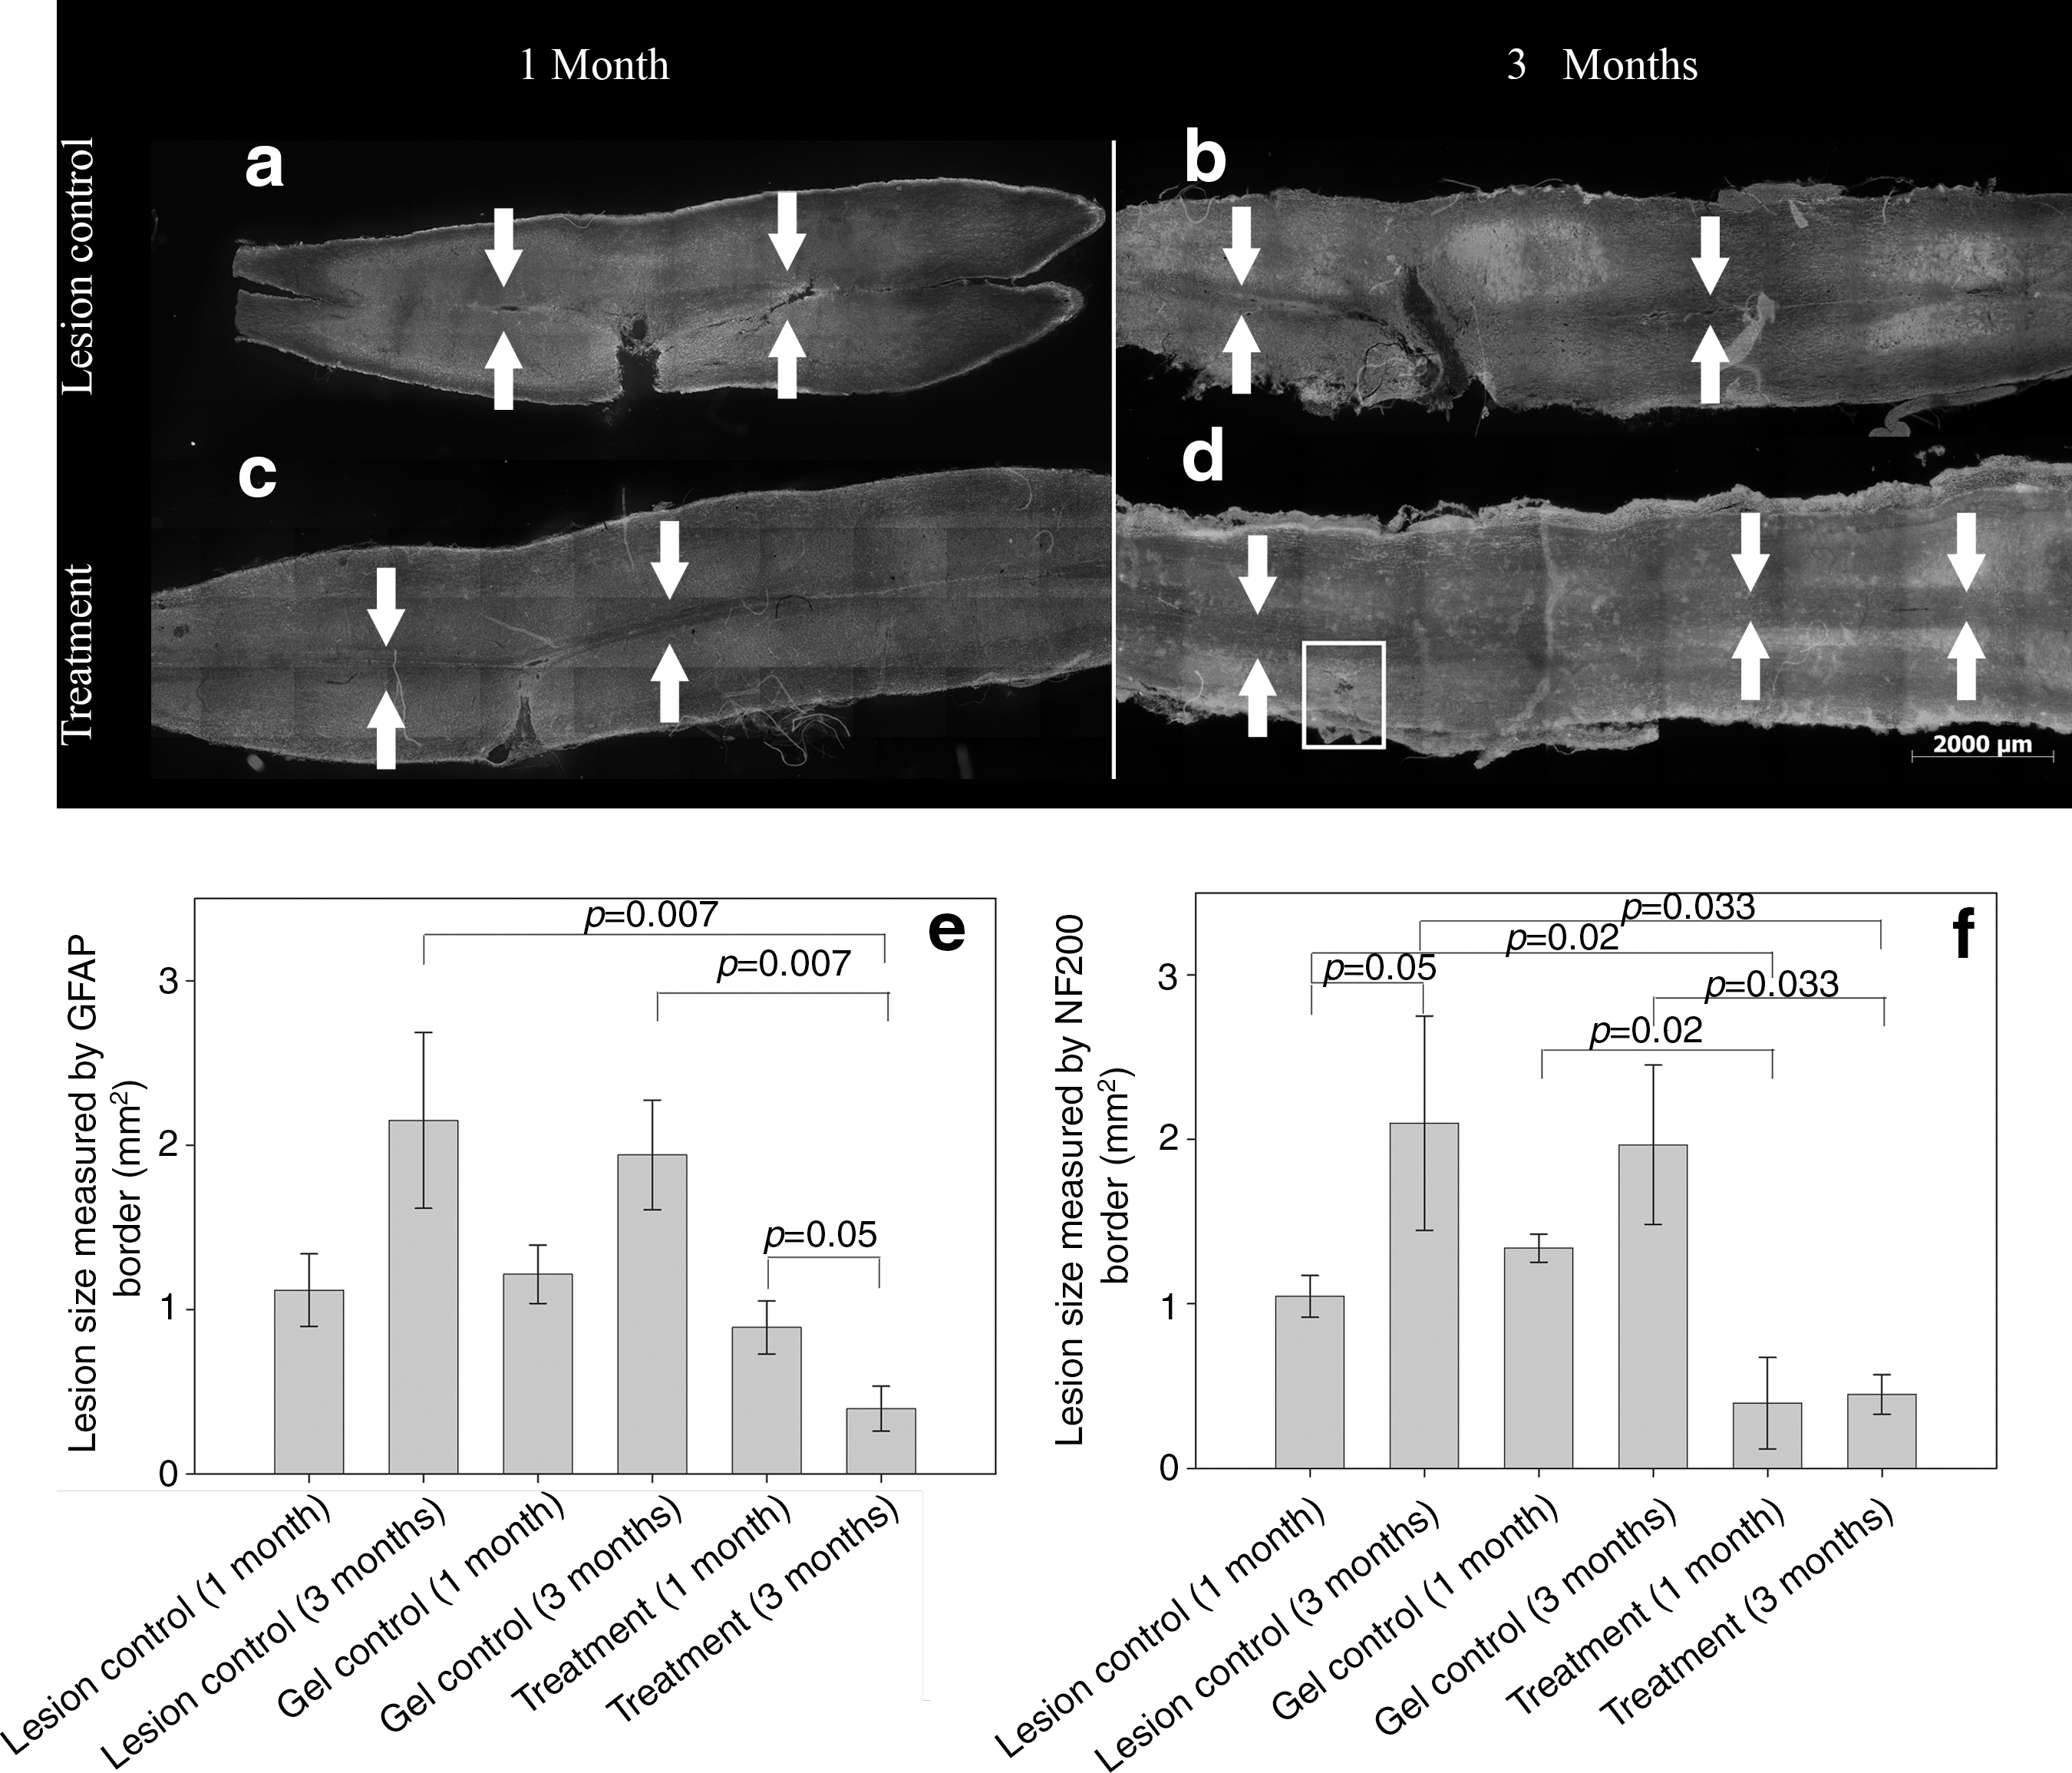
Treatment with vascular endothelial growth factor (VEGF) and platelet-derived growth factor (PDGF) delivered from a patch reduced the size of spinal cord lesions. Shown are combined neurofilament 200/glial fibrillary acidic protein (NF200/GFAP) black and white images of whole spinal cords harvested at 1 and 3 months post lesion: (
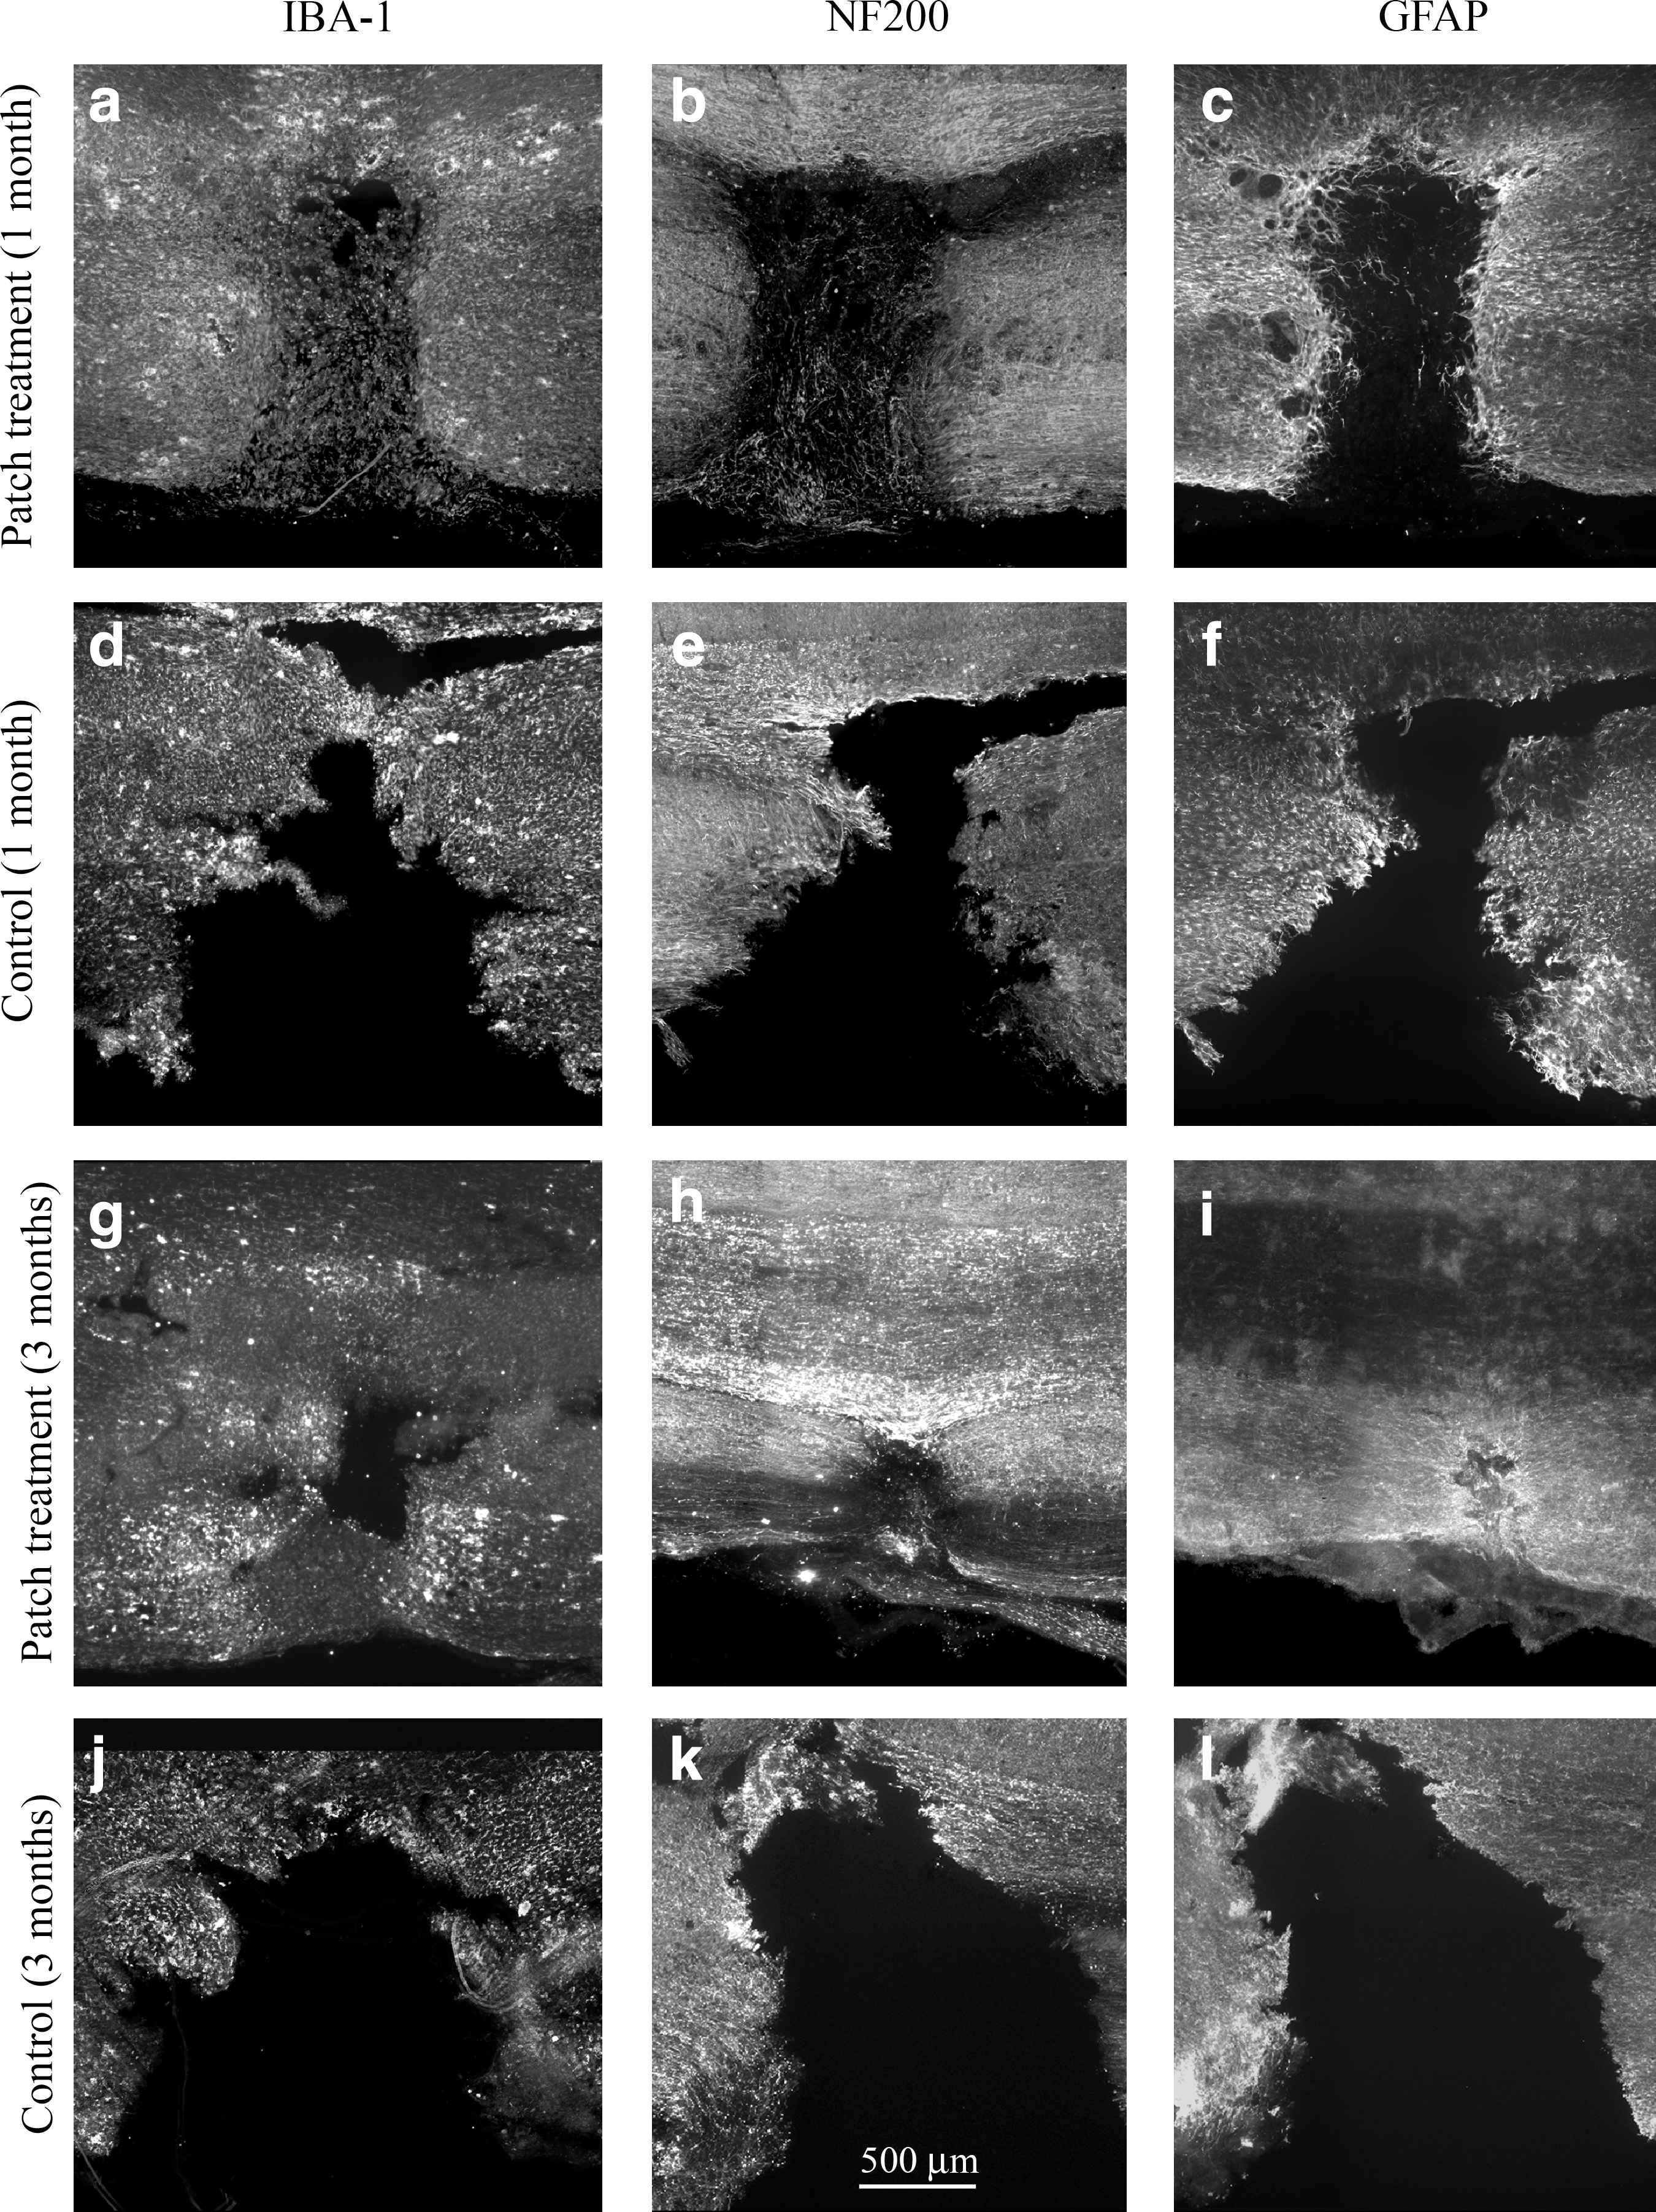
Treated lesions were filled with ionized calcium binding adaptor molecule 1 (IBA-1) and neurofilament 200 (NF200). Combined growth factor treatment resulted in the lesions being filled with IBA-1 and NF200 by 1 month (
In the VEGF/PDGF-treated spinal cords, compared to the controls, at 1 month after injury there was a significant reduction in lesion cavity size based on NF200 immunoreactivity, with the treated cords measuring approximately one-third the size of the controls (Fig. 2f). Three months after injury, the lesion cavity in the treated cords remained the same size as at 1 month, whereas the control lesion cavities increased in size, with the treated lesion cavities only one-fifth the size of the untreated lesion cavities (Fig. 2f). When the lesion cavity was defined by the GFAP-immunoreactive margin there was no significant difference between the treatment and control groups at 1 month (Fig. 2e). At 3 months the GFAP-defined lesion cavity was reduced compared to 1 month, and similar in size to the NF200-defined cavity (Fig. 2e and f), and significantly smaller than the control lesion cavities, which had increased in size from 1 to 3 months (Fig. 2e).
Acute VEGF/PDGF patch delivery did not alter blood vessel density
The blood vessel density in the tissue surrounding the lesion cavity was determined from the SMA immunoreactivity in the tissue 200 μm from the GFAP-defined margin of the lesion cavity (Fig. 4). Compared to the uninjured control animals (Fig. 4c), both the treatment and control groups (Fig. 4a and b) had significantly higher blood vessel densities, but there was no effect of VEGF/PDGF treatment on blood vessel density (Fig. 4d).
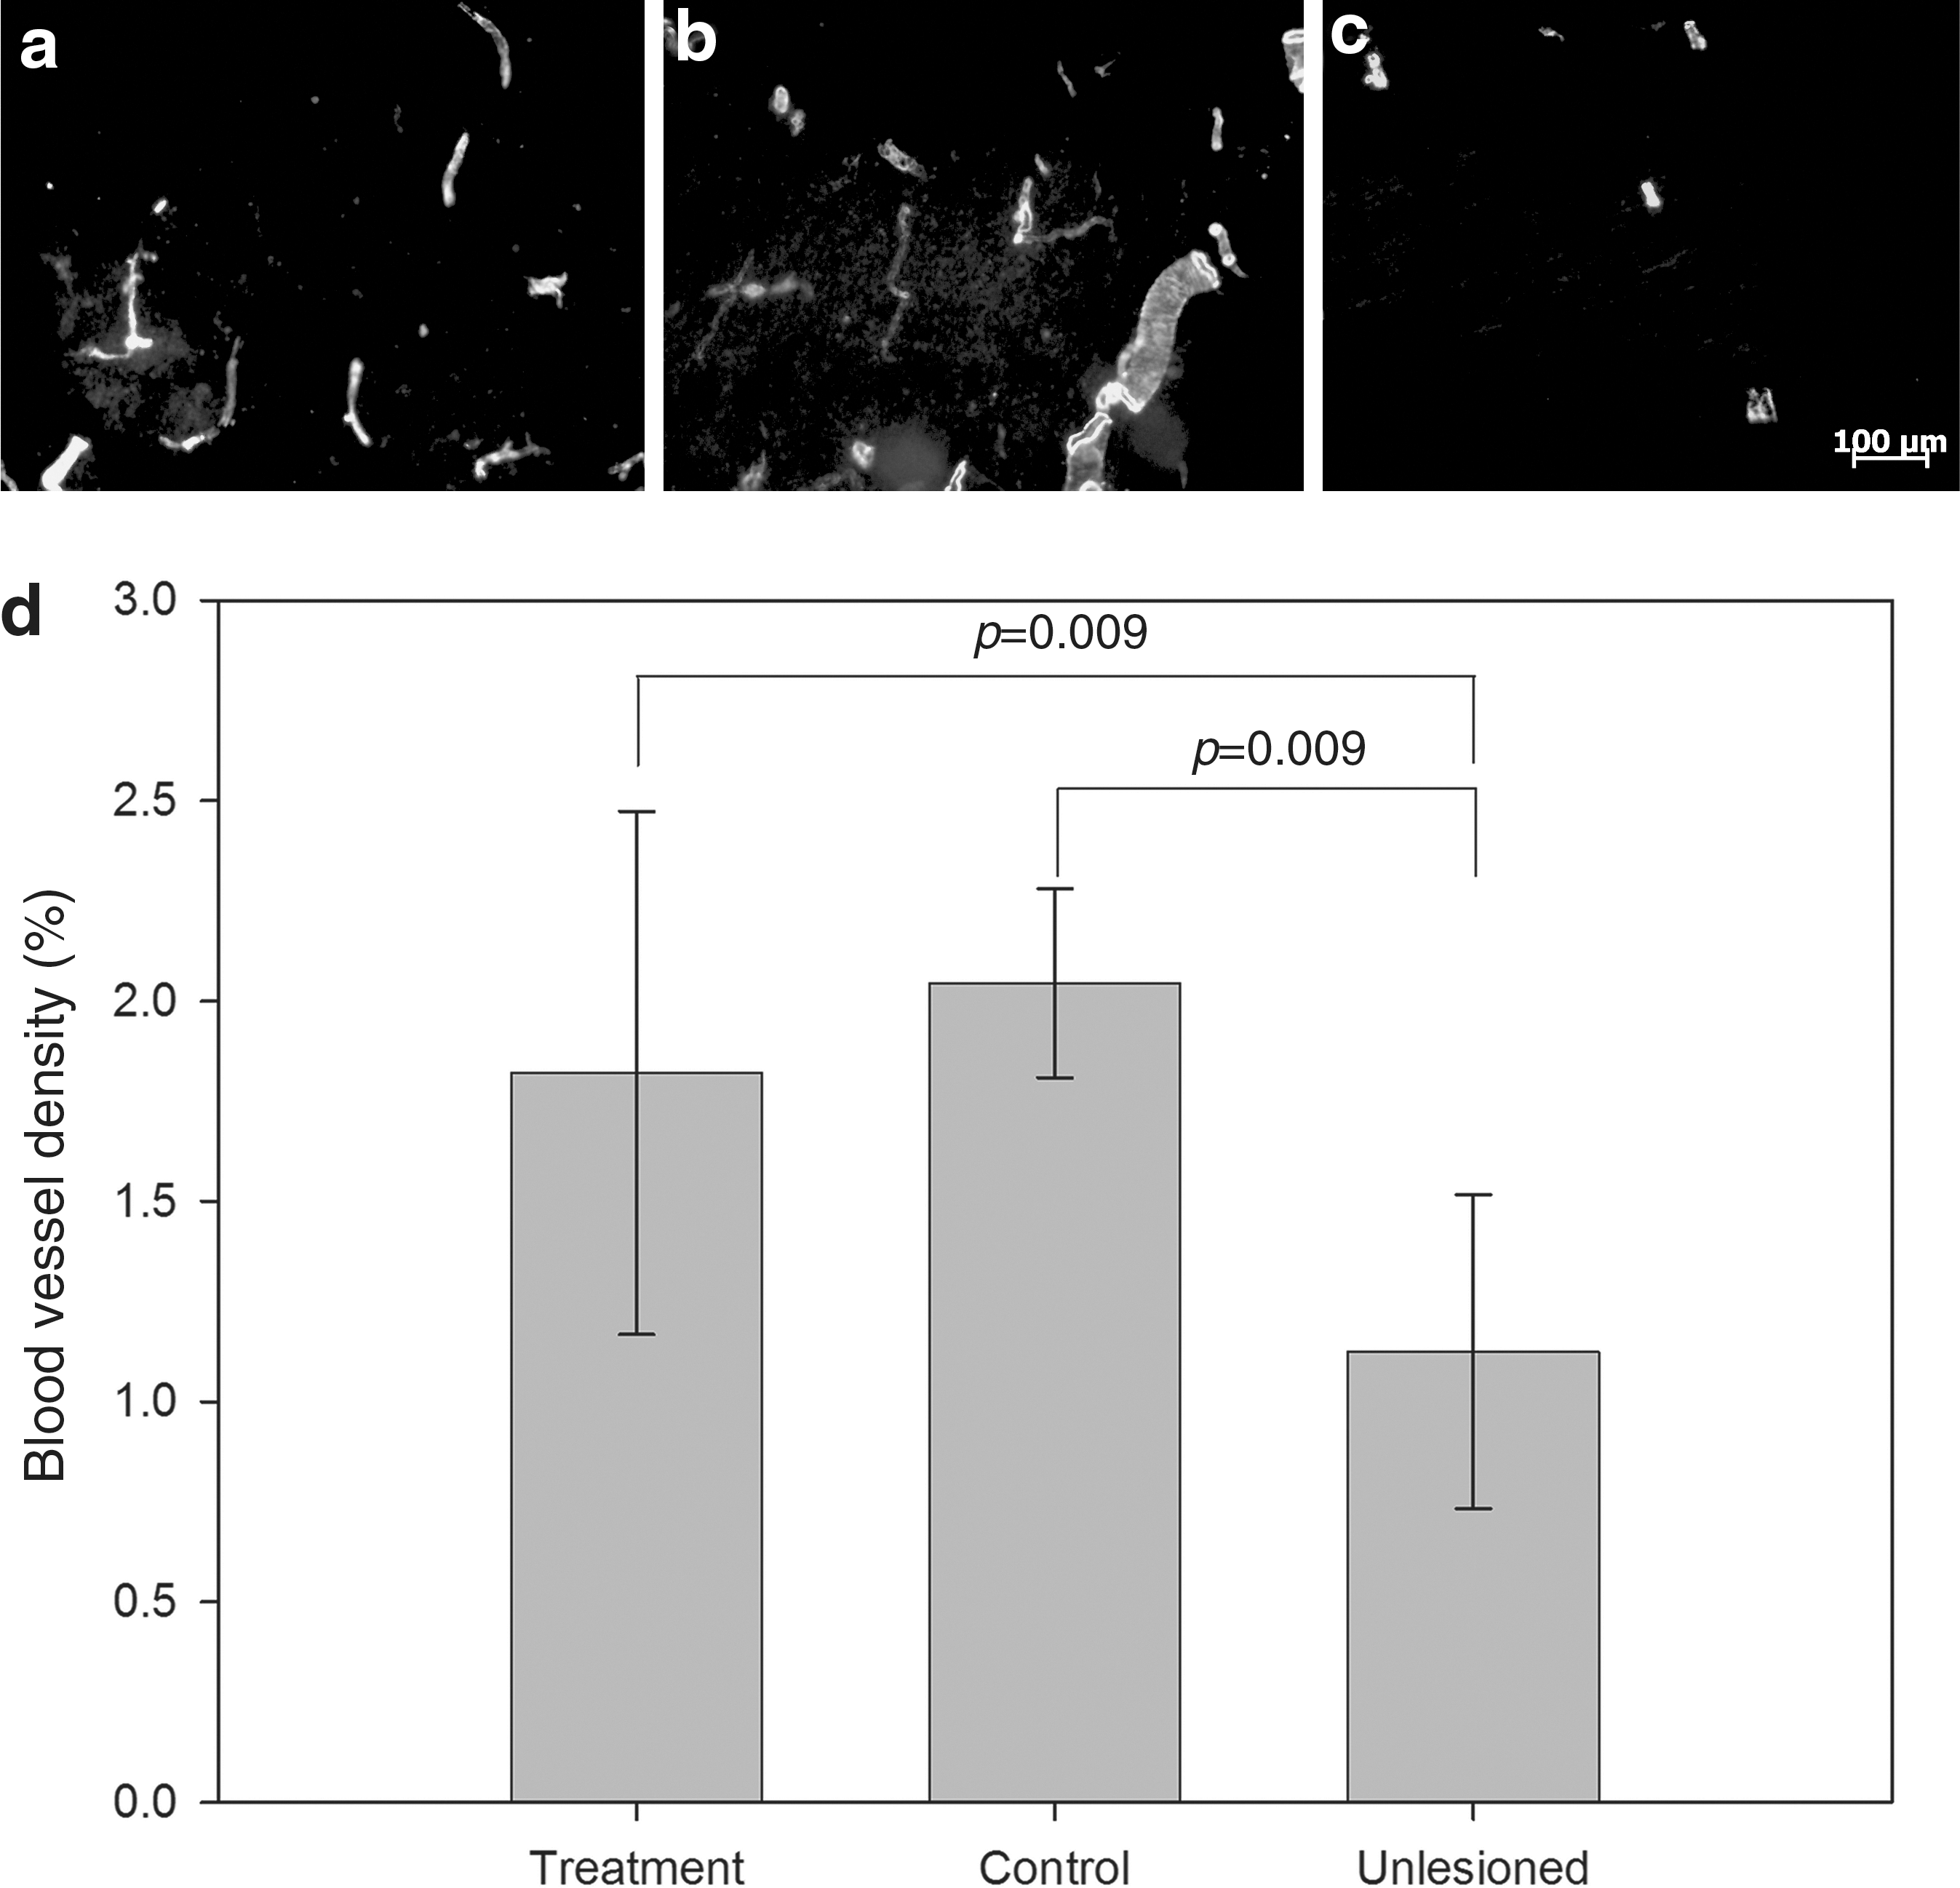
Delivery of a combination of vascular endothelial growth factor/platelet-derived growth factor (VEGF/PDGF) did not enhance angiogenesis over the endogenous angiogenic response to injury. Representative immunofluorescence images showing smooth muscle actin (SMA) staining for (
Acute VEGF/PDGF patch delivery reduced gliosis
Gliosis was quantified by measuring the density of GFAP immunoreactivity in the tissue 200 μm from the GFAP-defined margin of the lesion cavity (Fig. 5). Astrocyte morphology is an indicator of their response to injury: unreactive astrocytes have long, thin branched processes, whereas reactive astrocytes have an enlarged cell soma with thicker and shorter processes (Norenberg, 1994; Pekny and Nilsson, 2005). This morphological change is captured by the intensity of GFAP staining, from images collected in a standardized manner (Romero-Sandoval et al., 2008). Surrounding the lesion cavity in the control group, the GFAP immunoreactivity was more extensive and the astrocyte morphology indicative of reactive astrocytes at 1 and 3 months (Fig. 5a and b). In contrast, in the treatment group astrocyte morphology was indicative of less reactivity at 1 month and unreactive morphology at 3 months (Fig. 5c and d). The density of GFAP immunoreactivity, quantified from automated image pixel counting, indicated significantly less GFAP immunoreactivity in the tissue in the treatment group at 3 months, compared to the control group at the same time (Fig. 5e). There was also a significant reduction in GFAP immunoreactivity in the treatment group compared at 1 and 3 months (Fig. 5e).
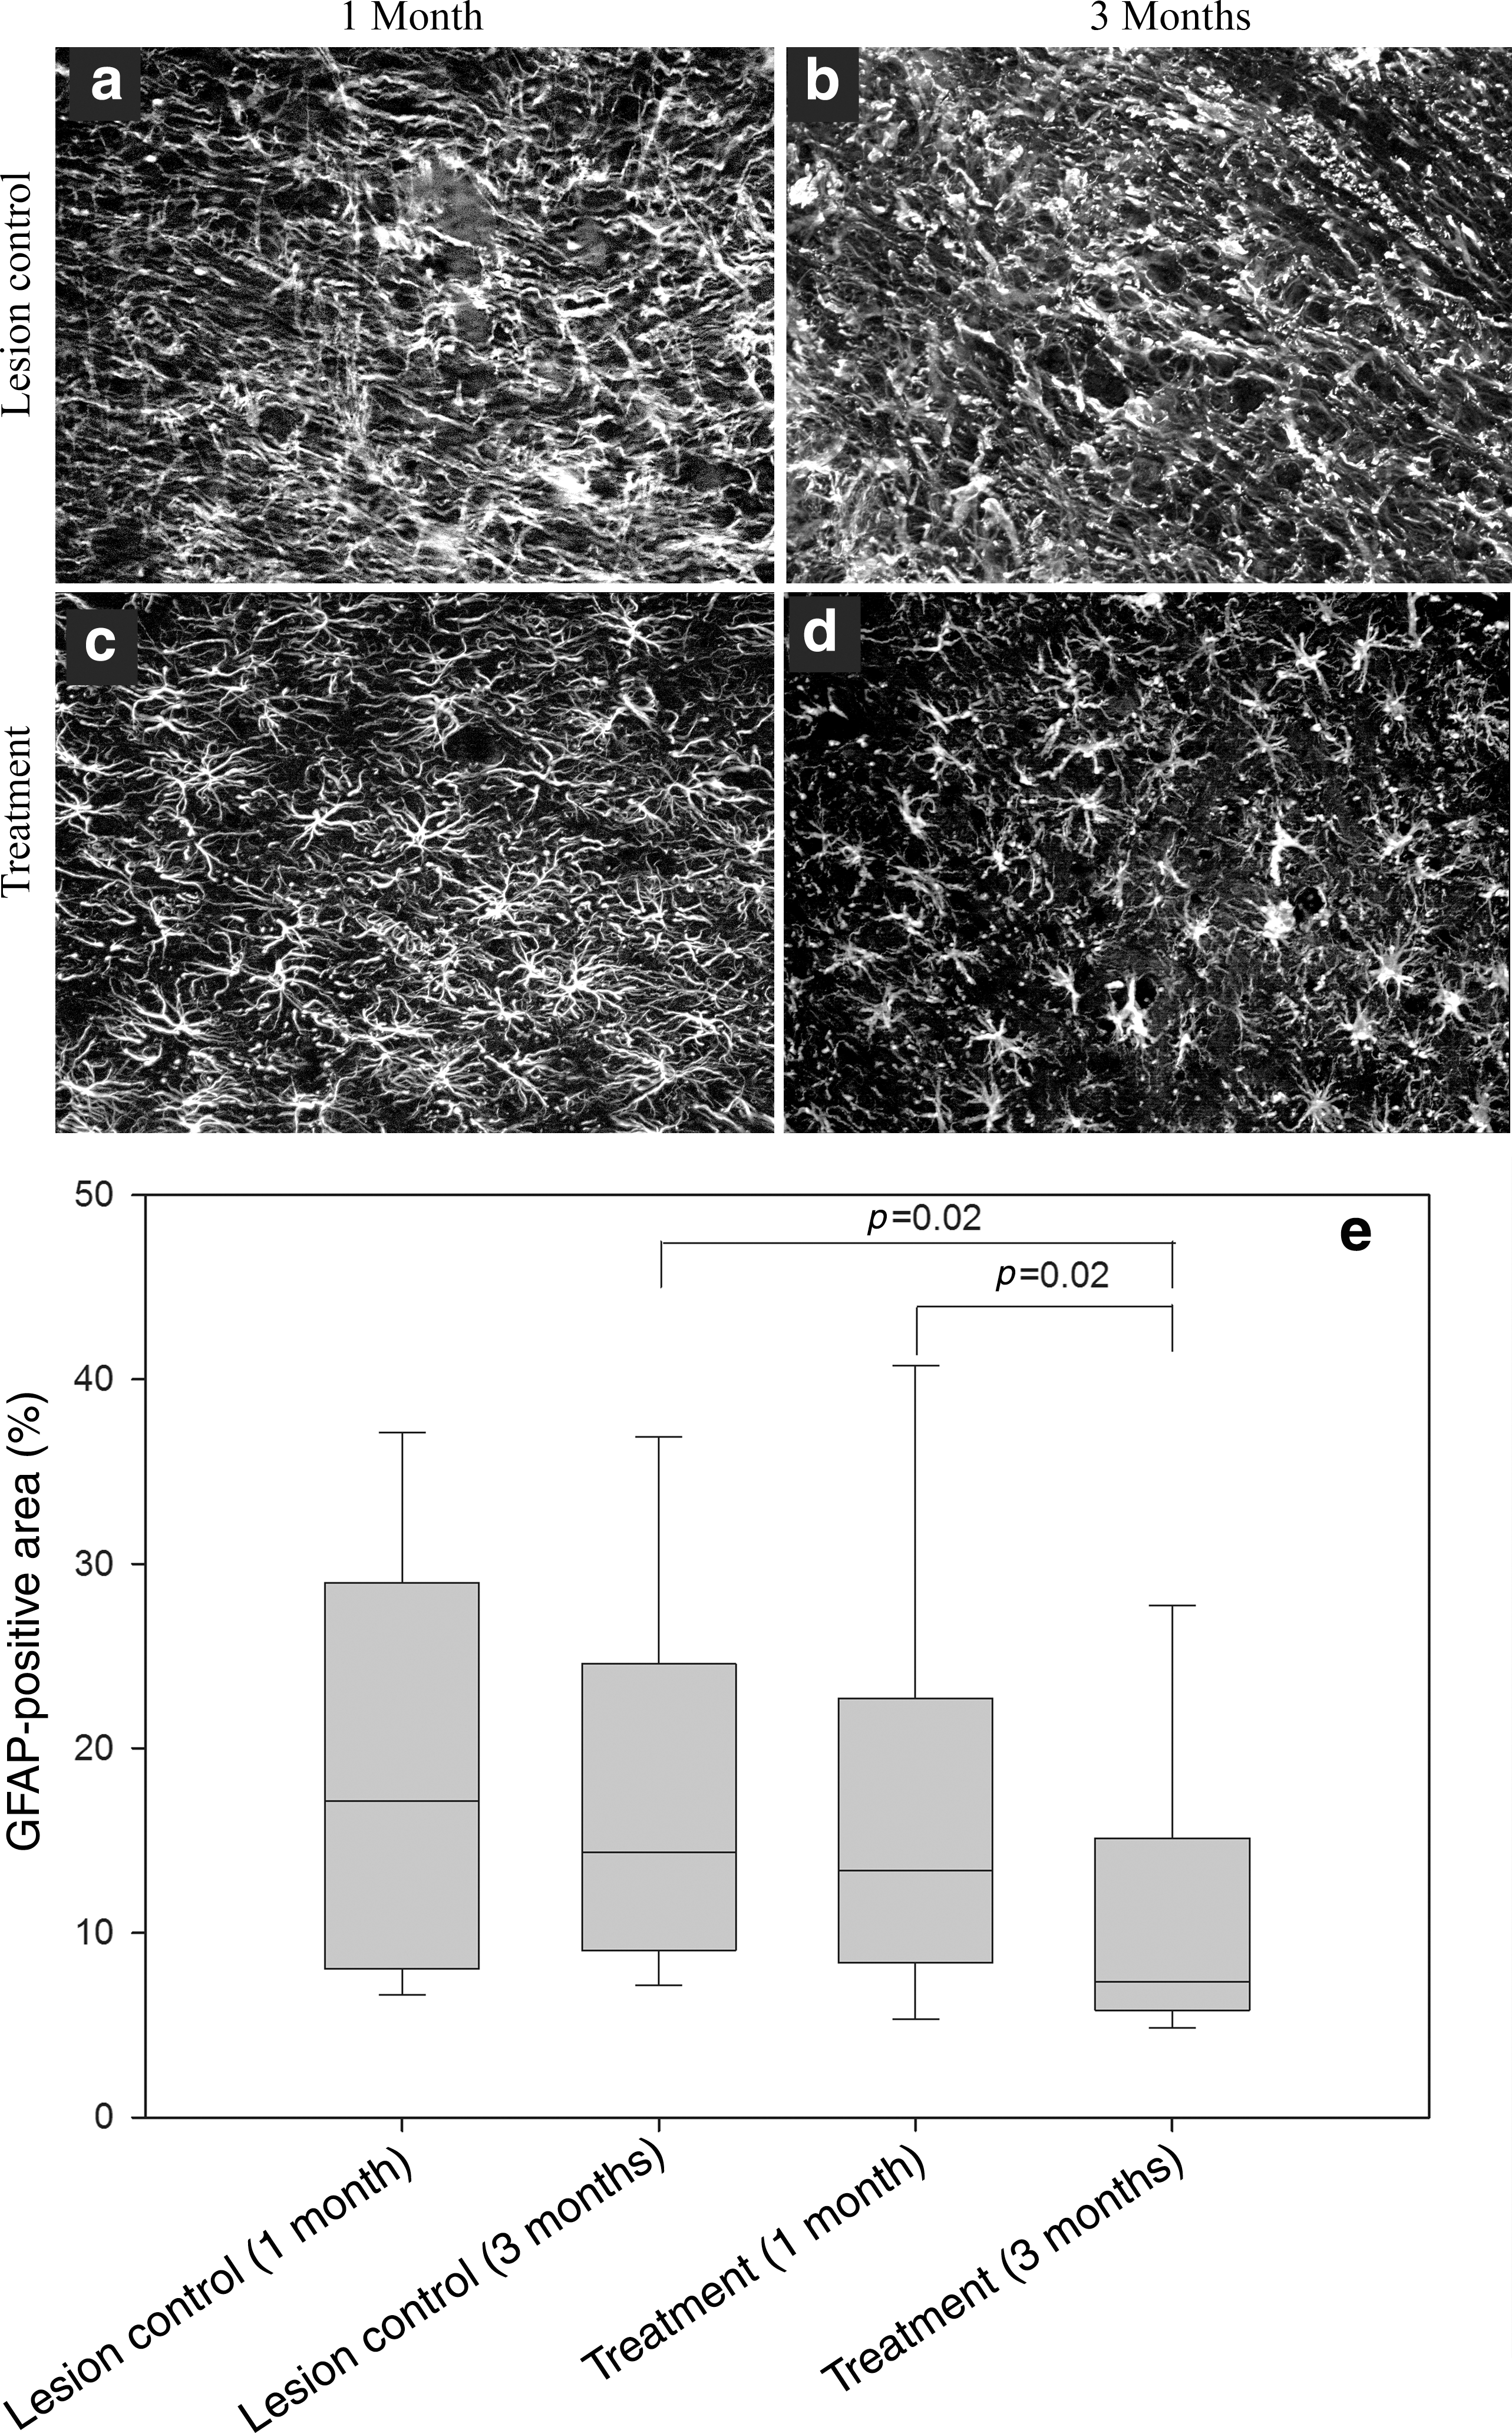
Treatment with vascular endothelial growth factor and platelet-derived growth factor (VEGF and PDGF) reduced astrogliosis. Glial fibrillary acidic protein (GFAP) immunofluorescence images taken 200 μm from the lesion (
Acute VEGF/PDGF patch delivery modulated the macrophage/microglia response to injury
Resident microglia and macrophages derived from circulating monocytes were investigated by quantifying the IBA-1-positive cells in the tissue 200 μm from the GFAP-defined margin of the lesion cavity (Fig. 6). There were stark differences in the morphology of macrophages/microglia in treatment and control tissues. The IBA-1-positive cells in the control group were moderately sized and branched (Fig. 6a and b), whereas those in the treatment group were large, with few, small processes (Fig. 6c and d). At 1 and 3 months the IBA-1-positive cells were larger in treated animals than in controls, and generally larger than those observed in undamaged spinal cord at a distance from the lesion cavity. There was a significant increase in the density (cells/mm3) of IBA-positive cells in all lesioned animals compared to healthy spinal cords (p<0.05, data not shown). In the treatment group at 1 month there was a significant reduction in IBA-1-positive cells compared to controls (13,798±1077 cells per mm3 versus 24,190±1706 cells per mm3, respectively; mean±SEM; p<0.001). A similar observation was made at 3 months (10,561±952 cells per mm3 versus 16,695±440 cells per mm3, respectively; mean±SEM; p<0.001). In the treatment group the reduction in IBA-1-positive cell numbers at 3 months compared to 1 month was statistically significant (p<0.001).
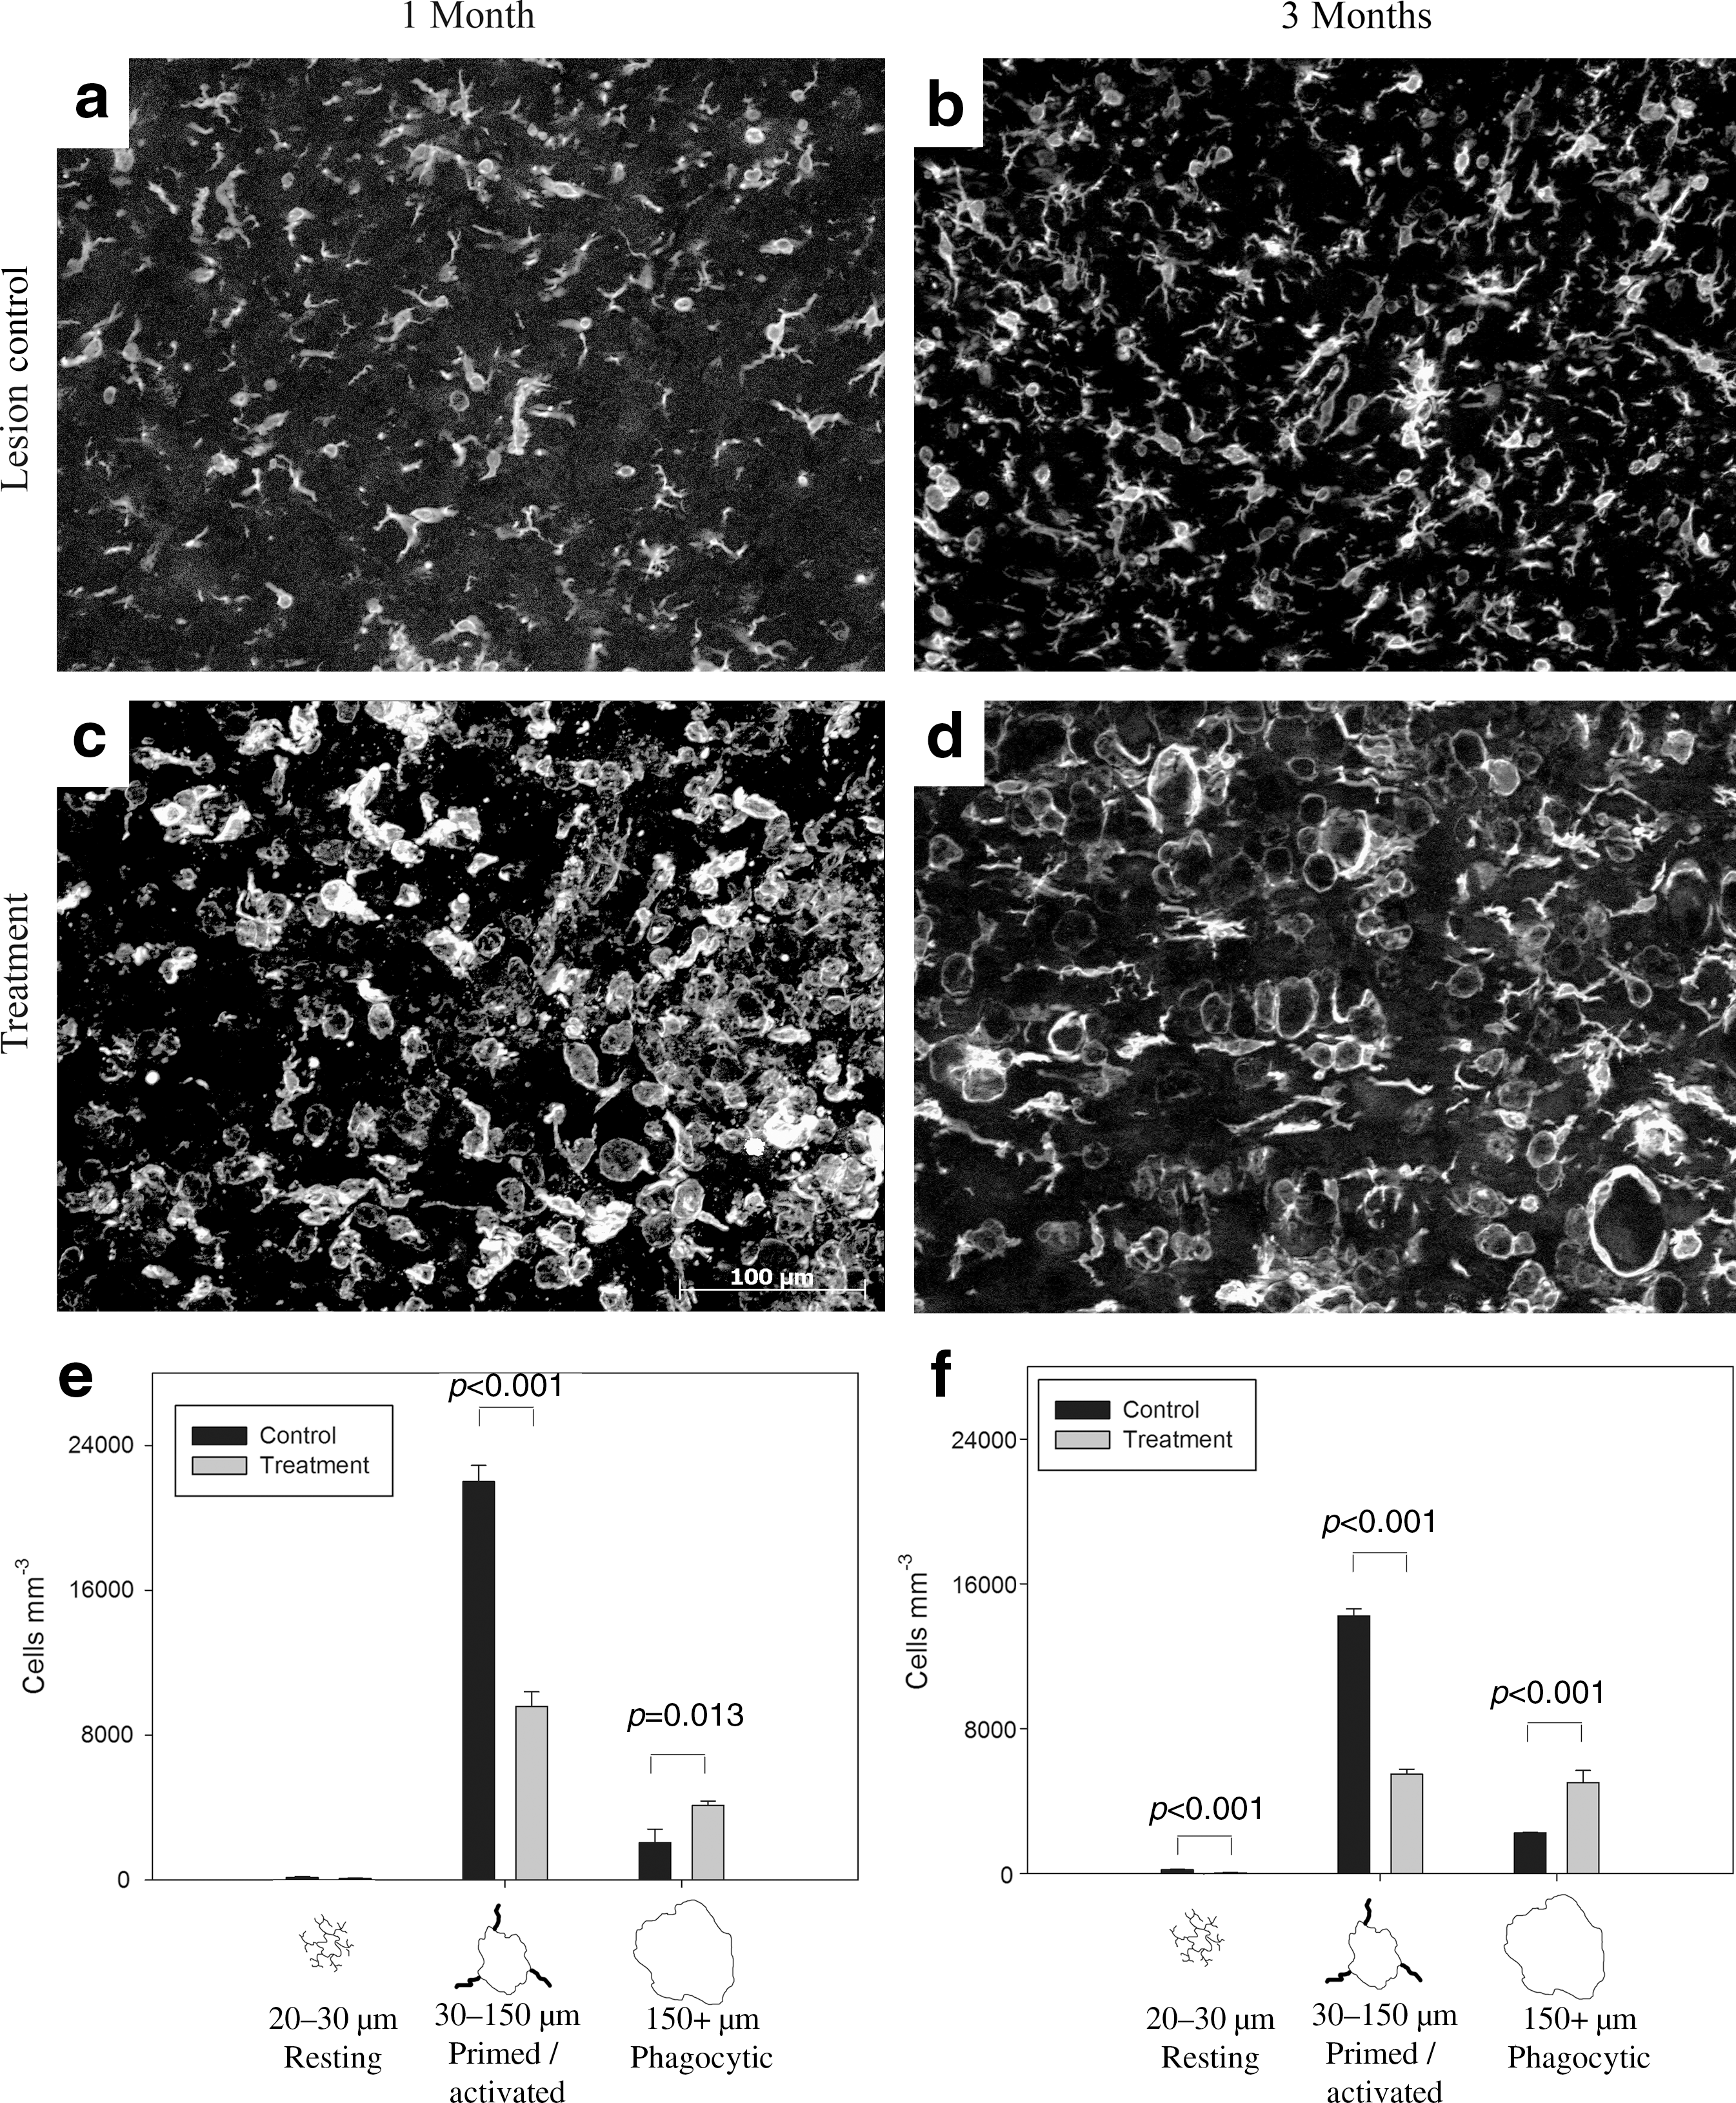
Treatment with vascular endothelial growth factor and platelet-derived growth factor (VEGF and PDGF) altered the inflammatory cell population. Representative ionized calcium binding adaptor molecule 1 (IBA-1) immunofluorescence images 200 μm from the 1-month lesion control group (
VEGF/PDGF altered the distribution of morphologies of IBA-1-positive cells (Fig. 6e and f). One month after injury, there were significantly fewer primed/activated cells in the treatment group compared to the control group (p<0.001), and a significant increase in phagocytic cells, which comprised 29.5% of the total IBA-1-positive population in the treatment group compared to 8.5% in the control group (p<0.013). The proportions of cell types were similar at 3 months, with significantly fewer primed/activated cells in the treatment group (p<0.001), and more phagocytic cells (p<0.001). The proportion of phagocytic cells was 47.5% in the treatment group at 3 months, compared with 13.5% in controls.
Acute VEGF/PDGF patch delivery did not improve behavioral recovery
One day after lateral hemisection all animals had a BBB score of 2 or 3. One month later the scores had risen, with similar scores obtained by the rats in all groups (lesion control: 9.6±2.7; gel control: 10.2±2; treatment: 8.2±1.8; mean±SEM). At 3 months the BBB scores were not significantly different from the scores at 1 month (lesion control: 11.5±3.3; GEL Control: 10.3±2; treatment: 9.6±0.2).
Prolonged VEGF/PDGF pump delivery reduced lesion size dose-dependently
In vitro testing of mini-osmotic pumps loaded with 5 μg (low-dose) and 15 μg (high-dose) VEGF and PDGF showed a sustained release, with 0.7 and 2.1 μg of the proteins released every 24 h by the low-dose and high-dose pumps, respectively (Fig. 1c). More than 95% of the VEGF/PDGF was released after 7 days. These values probably reflect release dynamics in vivo, because release from these pumps is independent of physiological conditions (Bittner et al., 2000).
Combined VEGF/PDGF treatment reduced or eliminated the lesion cavity, as assessed by NF200- and GFAP-immunoreactivity (Fig. 7). In contrast, when the growth factors were delivered alone (VEGF or PDGF), the lesion cavity size was much larger than any of the control animals at 1 and 3 months (SVC and LC). This is strong evidence of a synergy between the action of the two growth factors in the injured spinal cord. Similar observations were made when the lesion cavity was assessed by NF200-immunoreactivity (Fig. 7a–e), or GFAP-immunoreactivity (Fig. 7f–j). The effect of the combined VEGF/PDGF treatment was dose-dependent, with a significantly larger reduction seen in lesion cavity size in the high-dose compared to the low-dose group (Fig. 7e and j; HDP versus LDP). At 3 months the NF200-immunoreactive axons often filled the lesion cavity, making the lesion site difficult to locate (Fig. 7d, inset), and eliminating the lesion cavity altogether (Fig. 7e).
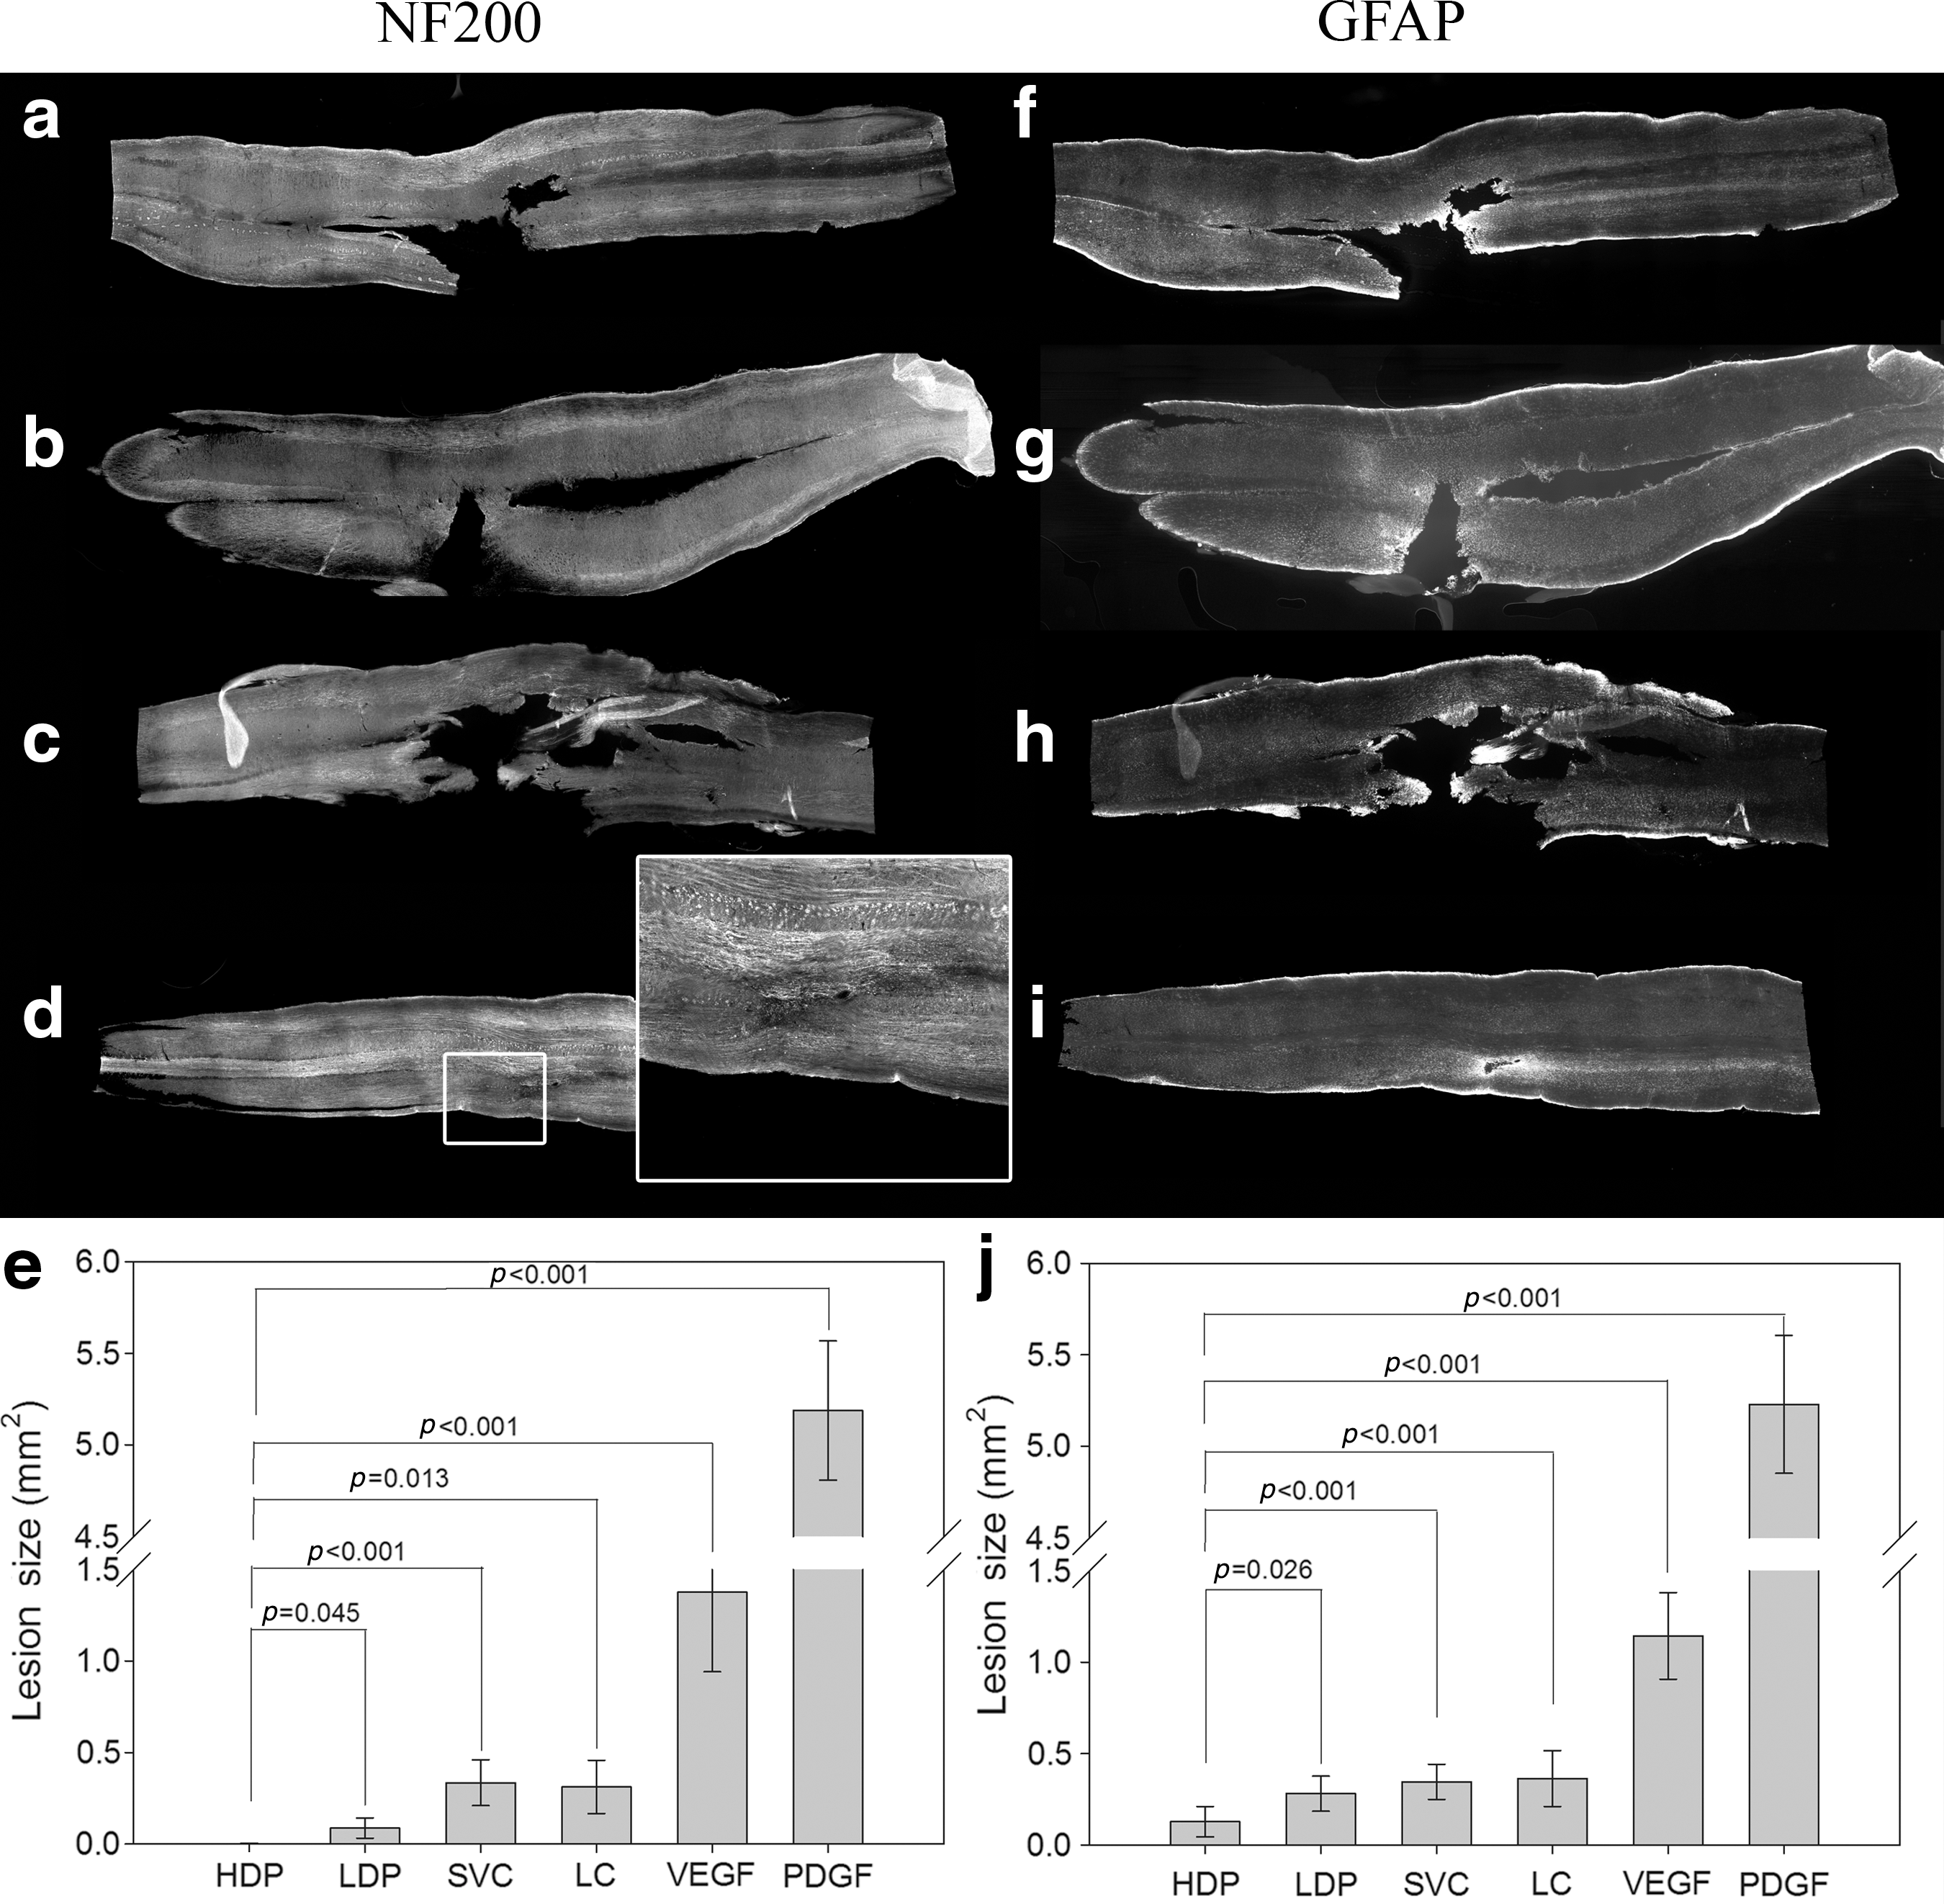
Treatment with vascular endothelial growth factor and platelet-derived growth factor (VEGF and PDGF) delivered by a mini-osmotic pump reduced the size of spinal cord lesions. Shown are whole spinal cords harvested at 1 month post-lesion stained for neurofilament 200 (NF200) or glial fibrillary acidic protein (GFAP) (
Prolonged VEGF/PDGF pump delivery modulated the macrophage/microglia response to injury
As with the patch delivery, the IBA-1-positive cells were quantified in the tissue 200 μm from the GFAP-defined margin of the lesion cavity at 1 month (Fig. 8). After combined VEGF/PDGF treatment, in both the HDP and LDP groups there were significant alterations in the distributions of the morphological classes of IBA-1-positive cells (Fig. 8). Overall there was a statistically significant difference between cell size distribution in the treatment groups and control groups (p<0.001). The high-dose and low-dose treatment groups had significantly more phagocytic cells (p<0.001), with 18.6% and 19.3% phagocytic cells (for the LDP and HDP groups, respectively) in the total IBA-1-positive cell population, compared to 3.6% in the control groups (LC and SVC). There were significantly fewer primed/activated cells in the treatment groups compared to the controls (LDP: p<0.001; HDP: p=0.008).
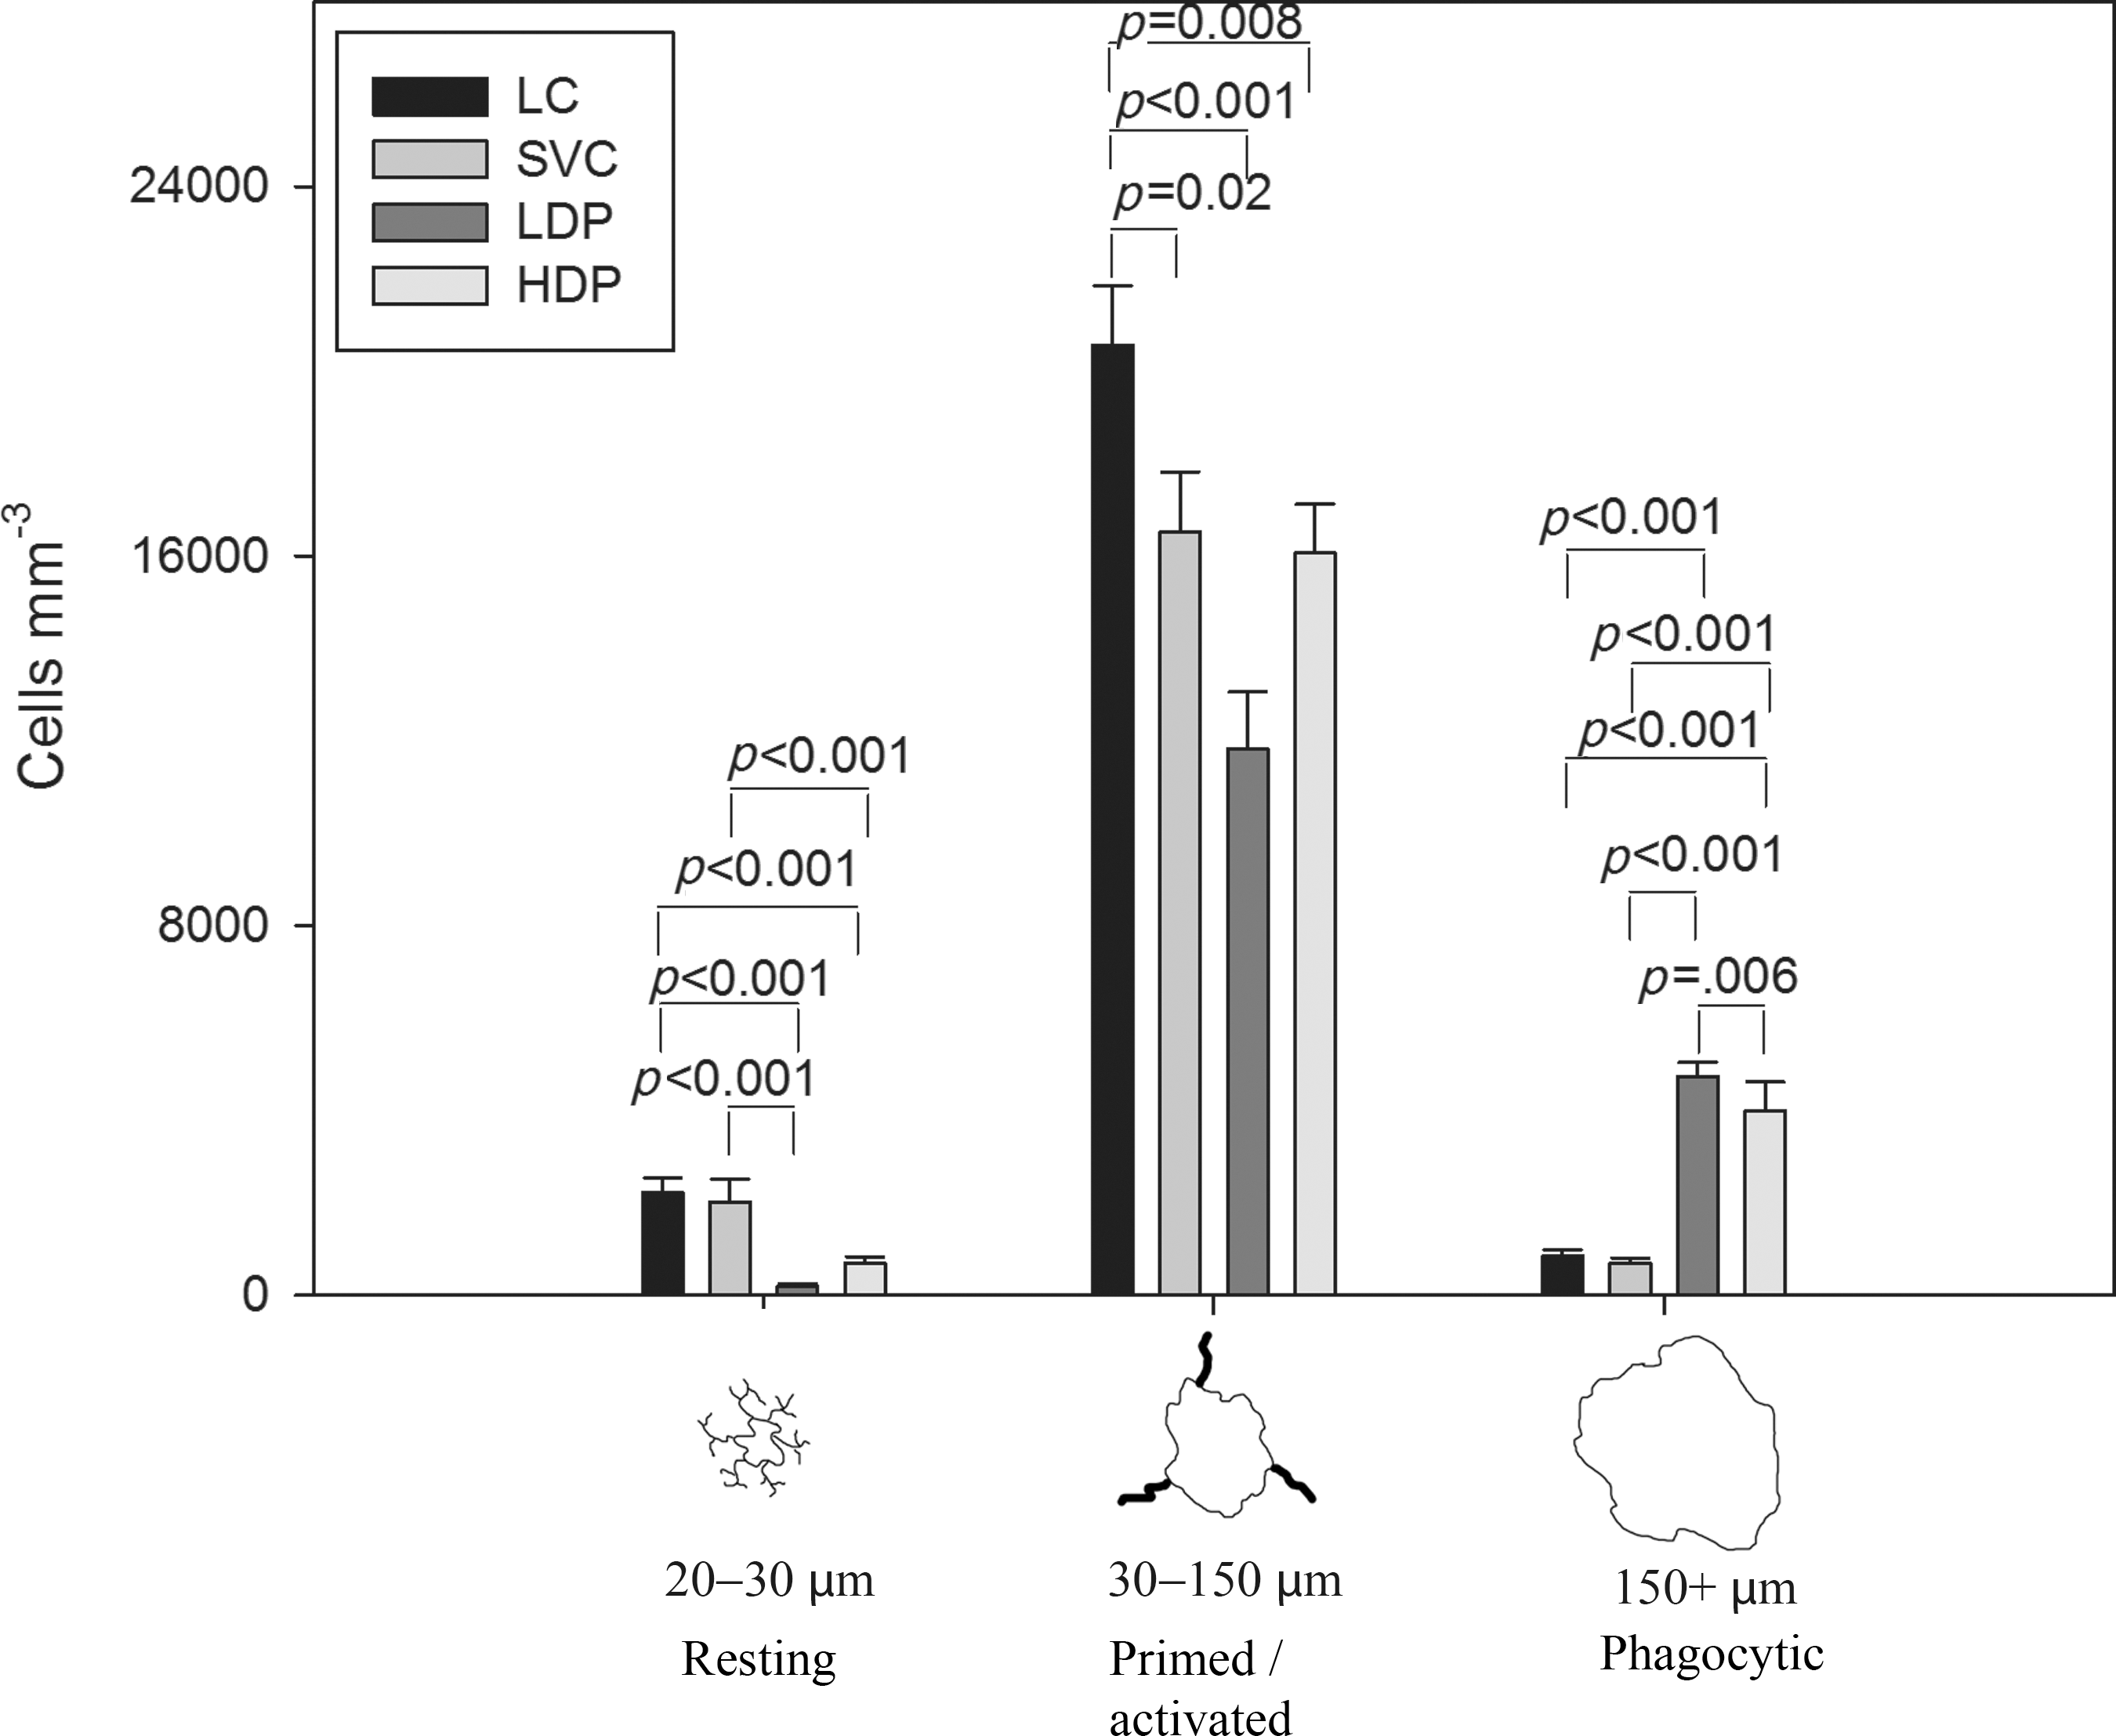
Vascular endothelial growth factor and platelet-derived growth factor (VEGF and PDGF) delivered by an osmotic pump significantly affected the inflammatory cell population. The density of IBA-1-positive cells surrounding the lesion at 1 month was significantly different between the treatment and control groups (SVC, saline vehicle control; HDP, high-dose pump; LDP, low-dose pump; LC, lesion control).
Prolonged VEGF/PDGF pump delivery induced a subpopulation of IBA-1-positive cells also expressing NG2
The IBA-1-positive cells that co-stained with NG2 were quantified in the tissue 200 μm from the GFAP-defined margin of the lesion cavity at 1 month (Fig. 9). In all groups cells were identified that were immunopositive for IBA-1-1 (red) and NG2 (green). As previously seen, IBA-1 staining in the lesion control group (Fig. 9a and c), the VEGF-alone group (Fig. 9d and f), and the PDGF-alone group (Fig. 9h and j) revealed stellate macrophages/microglia with thick processes, indicative of an active morphology. In contrast, the microglia/macrophages in the high-dose VEGF/PDGF group were large, rounded, and without processes, indicative of a phagocytic morphology (Fig. 9k and m). Moreover, in the high-dose VEGF/PDGF group, there was a large number of IBA-1-positive cells that co-expressed NG2 (Fig. 9l and m). The control group showed the least evidence of NG2 staining (Fig. 9b and c), the NG2 staining in the PDGF group was sparse (Fig. 9i and j), and in the VEGF group there were a few small, isolated NG2-positive cells (Fig. 9e and f), that resemble oligodendrocyte precursors (Jones et al., 2002). These latter cells were not IBA-1-positive.
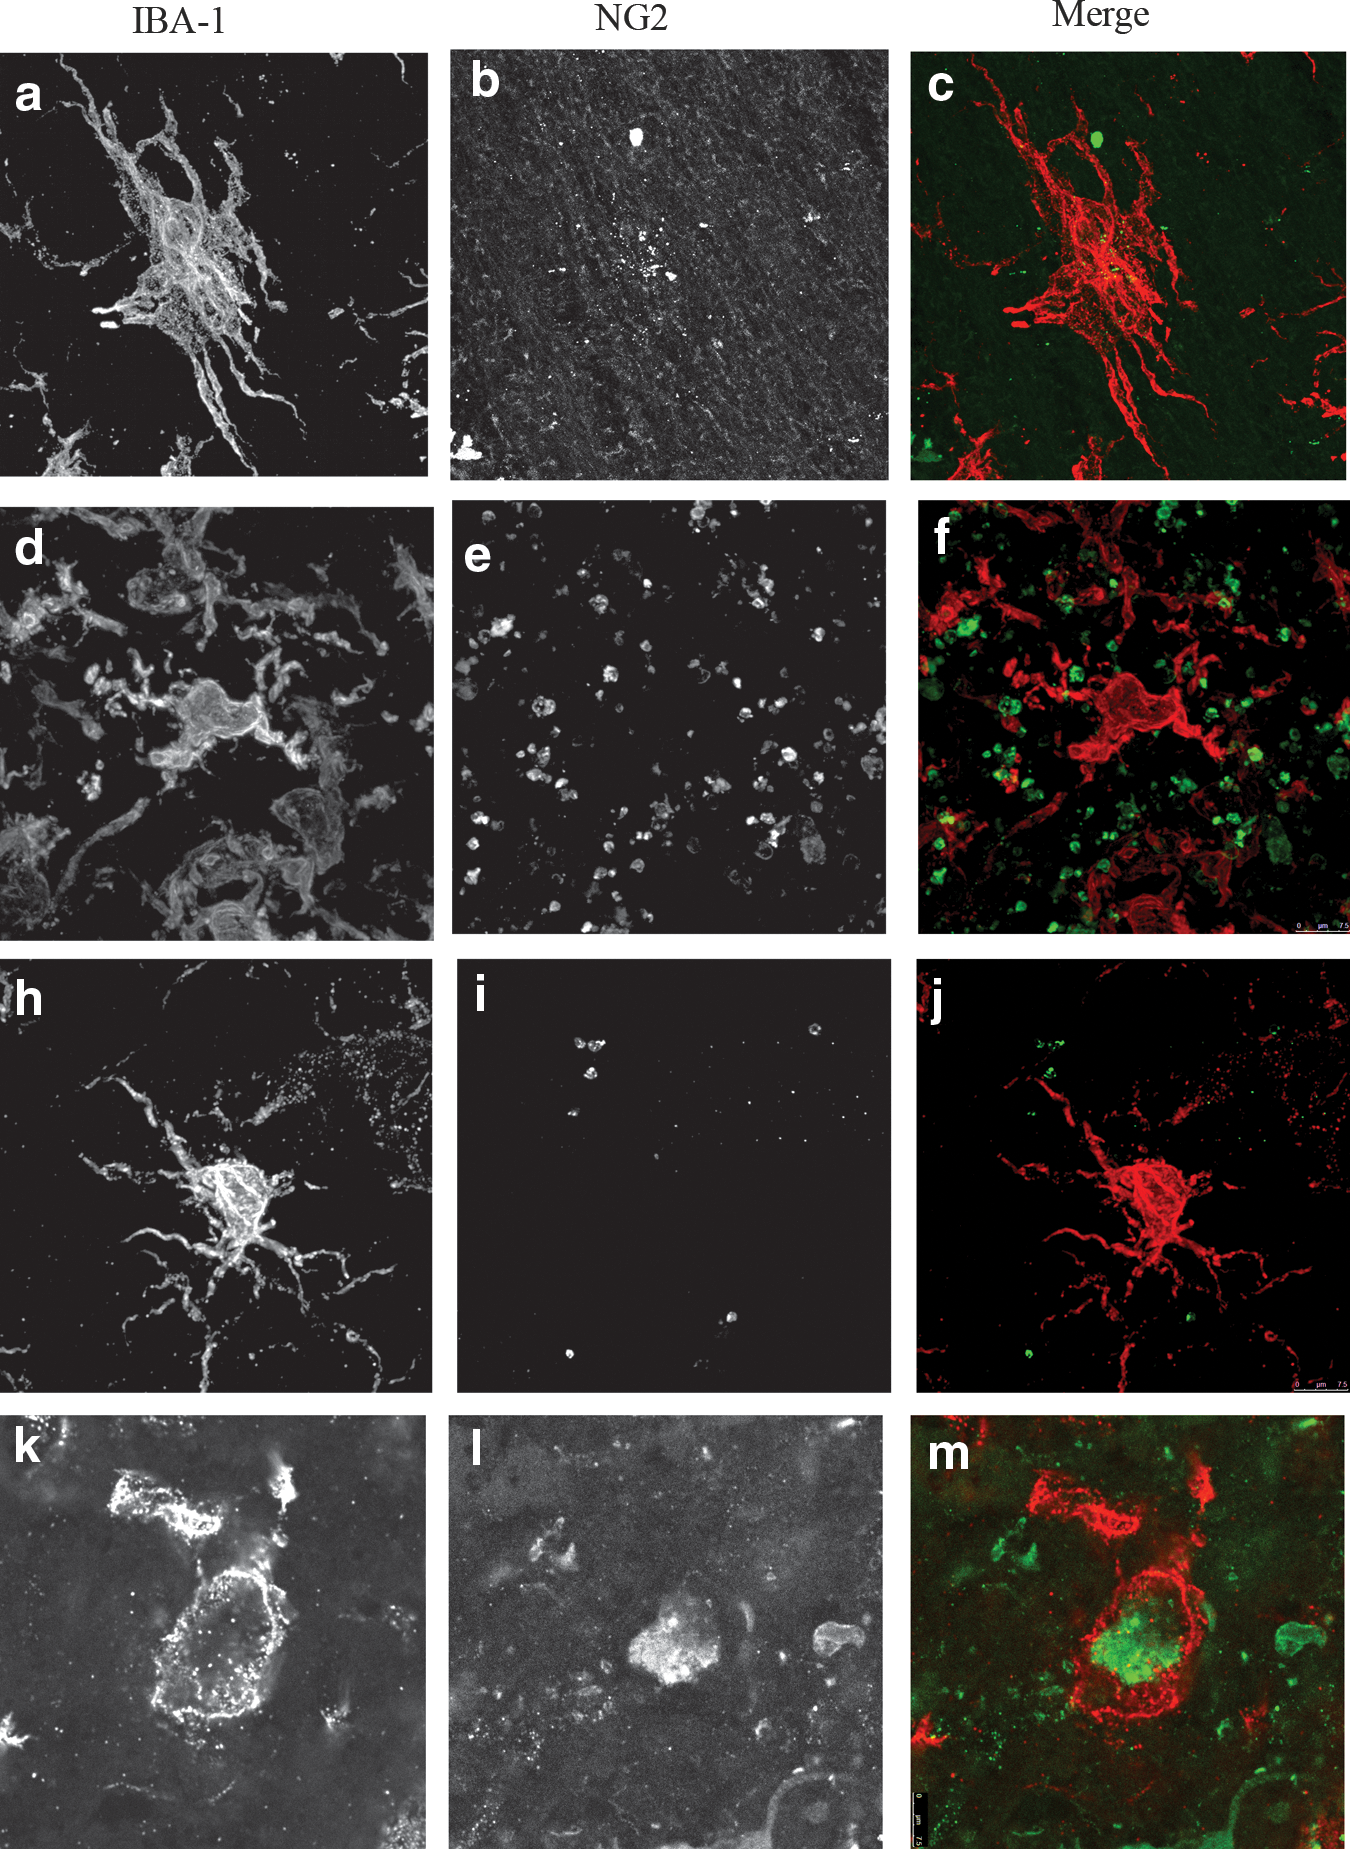
Confocal images of representative ionized calcium binding adaptor molecule 1 (IBA-1)-positive cells seen at 260×in the lesion control group (
Discussion
We show here that after acute traumatic SCI, VEGF and PDGF delivered in combination reduced the lesion size and reduced gliosis around the injury at 1 month, and prevented further increases at 3 months, compared to control animals. In stark contrast, the growth factors administered singly were similar or worse than controls. VEGF/PDGF treatment did not promote angiogenesis, but it significantly modulated the inflammatory cell response, inducing a population of microglia/macrophages that were immunopositive for NG2, and altering the distributions of microglia/macrophages classified as “resting,” “activated/primed,” and “phagocytic.” Growth factor treatment significantly decreased the numbers of activated/primed cells and increased the numbers of phagocytic cells at 1 and 3 months in the injured tissue. These same effects were seen after acute treatment delivered by hydrogel patch, and by sustained treatment delivered by osmotic minipump, with the latter experiments demonstrating a dose-dependency of the effects of growth factor treatment. VEGF/PDGF treatment also promoted robust axon growth into the lesion cavity.
There has been mixed success in prior experiments using VEGF to treat SCI. It is reported to promote angiogenesis, gliogenesis, neuronal survival, and tissue sparing; to decrease secondary degeneration; to improve functional outcomes (Kim et al., 2009; Liu et al., 2010; Storkebaum et al., 2004; Sundberg et al., 2011; Widenfalk et al., 2003); and to induce regeneration of corticospinal tract axons (Facchiano et al., 2002). Others have observed no effect of VEGF treatment (van Neerven et al., 2010), or worse outcomes (Benton and Whittemore, 2003). This complexity is likely due to the methodological differences in the types of spinal cord injuries and the timing of VEGF delivery interacting with the pleiotropic nature of the growth factor, and the varying microenvironments that occur at the different time points after injury. In our experiments, VEGF treatment alone was detrimental, leading to an increase in lesion size, as was reported previously (Benton and Whittemore, 2003), rather than the decrease observed when VEGF was delivered in combination with PDGF.
PDGF has not been previously used after SCI. It had no neuroprotective effect in an ischemic model of brain trauma (Iihara et al., 1997), and its absence did not influence the astroglial and angiogenic response in adult brain after neuron-specific genetic ablation of PDGF (Enge et al., 2003). Endogenous expression of PDGF-B and its receptor PDGFRβ increased in rhesus monkey spinal cords after hemisection injury, and administration of an antibody to PDGF-B reduced recovery of hindlimb function in this model (Xiyang et al., 2009). In our experiments, PDGF-B treatment alone was detrimental, leading to an increase in lesion size, that was even larger than that seen after VEGF delivery.
The occurrence of secondary degeneration can be inferred when the size of the lesion increases with time after the physical damage of the initial traumatic injury. VEGF/PDGF combined treatment reduced or eliminated secondary degeneration, as evidenced by the dose-dependent reduction in lesion size seen at 1 and 3 months after injury. This was accompanied by a reduction in gliosis around the lesion site, and the growth of axons into the lesion cavity in the treated animals. The cellular mechanisms responsible for these treatment effects are unclear. Unexpectedly, there was no measureable angiogenic stimulation by the combined treatment, ruling out this hypothesized mechanism. On the other hand, we did observe a robust effect of treatment on the inflammatory response, as evidenced by the changes in distributions of microglia/macrophage subtypes within the injured tissues. Treatment induced a significant rise in the population of macrophages/microglia in our phagocytic classification, a concomitant reduction in the population of activated/primed macrophages/microglia, and an increase in the numbers of NG2-positive macrophages/microglia. Without a time series it is hard to interpret whether these differences reflect a progression of states from pro- to anti-inflammatory macrophage/microglia states, or recruitment of different subpopulations to the lesion.
Without further investigation we cannot be certain of the roles of macrophage/microglia populations in reducing secondary degeneration changes, but the observations suggest that the treated spinal cords are in a less inflammatory state than controls, with a significant reduction seen in the numbers of macrophages/microglia, as well as the change in distributions of morphologies. Most striking was the appearance of IBA+/NG2+ macrophages, which were present only in the VEGF/PDGF combination group. Such cells have been observed previously in the 7 days following traumatic SCI, decreasing to very low levels by 28 days (Jones et al., 2002). Similar IBA+/NG2+ macrophages may be neuroprotective, as they express several mRNAs encoding for growth factors (IGF, FGF2, BMP-2, -4, and -7, and HGF), and they ameliorate the effects of ischemia when transplanted into the adult brain (Smirkin et al., 2010). We show here for the first time a treatment that induces a population of IBA+/NG2+positive macrophages/microglia at extended time points after the injury.
Combined growth factor treatment failed to improve the functional outcome as measured by the BBB open-field locomotor scale. This method has been used previously after spinal cord hemisection injury. As we observed, there is normally a spontaneous recovery of hindlimb function in rats after hemisection due to recovery from spinal shock, plasticity of spinal circuits, and short-distance axonal sprouting that can reconnect motor neurons in a path that circumvents the defect (Bareyre et al., 2004; Hiersemenzel et al., 2000; Weidner et al., 2001), and some experimental treatments promote behavioral improvements by augmenting these effects (Kwon et al., 2010). In our experiments there was no behavioral improvement above the spontaneous recovery, despite the reduced secondary degeneration and the obvious stimulation of axon growth into the lesion cavity. Further investigation is required. We did not test behavior in the animals receiving the higher dose of VEGF/PDGF (i.e., those with the greatest reduction in lesion cavity size and gliosis), and there may be a threshold in these that is permissive for anatomical changes leading to functional recovery. Neither do we know at this stage the fate of ascending sensory and descending motor axons that would mediate behavioral recovery. We are currently undertaking detailed behavioral studies after VEGF/PDGF treatment of contused spinal cord injuries, which is a more appropriate model for assessing behavioral outcomes relevant to human injuries.
Conclusions
In summary, this study has demonstrated for the first time a treatment that can reduce or eliminate secondary degeneration after traumatic injury to the spinal cord, namely, acute or sustained treatment with a combination of VEGF/PDGF. Surprisingly, treatment with either of the two growth factors alone induced secondary degeneration, indicating a previously unknown interaction and potentiation between these growth factors after injury. Although known for their angiogenic effects, the elimination of secondary degeneration by VEGF/PDGF combined treatment was not due to their promotion of angiogenesis in the injured spinal cord. The mechanism for this effect cannot be determined, but there is ample evidence for alterations in the populations of macrophages/microglia within the injured tissues that suggest a pathway for future investigation of the actions of VEGF/PDGF.
Footnotes
Acknowledgments
The authors are grateful to The Institute of Health and Biomedical Innovation, Queensland University of Technology, for seed funding, the National Centre for Adult Stem Cell Research, Griffith University, and the Australian Department of Health and Ageing for a Ph.D. stipend for Y.-W.Y. We appreciate the assistance of the animal house staff at the Medical Engineering Research Facility (Queensland University of Technology). B.G. gratefully acknowledges the Queensland Government for a Smart State Fellowship, and the Queensland Orthopaedic Research Trust for ongoing support.
Author Disclosure Statement
No competing financial interests exist.