
Abstract
Research on spinal cord injury (SCI) repair focuses on developing mechanisms to allow neurites to grow past an injury site. In this article, we observe that numerous divergent paths (i.e., spinal roots) are present along the spinal column, and hence guidance strategies must be devised to ensure that regrowing neurites reach viable targets. Therefore, we have engineered an in vitro micropatterned model in which cultured E7 dorsal root ganglia (DRG) explants may enter alternate pathways (“roots”) along a branching micropattern. Alongside this in vitro model, we have developed an in silico simulation that we validate by comparison with independent experiments. We find in both in silico and in vitro models that the probability of a neurite entering a given root decreases exponentially with respect to the number of roots away from the DRG; consequently, the likelihood of neurites reaching a distant root can be vanishingly small. This result represents a starting point for future strategies to optimize the likelihood that neurites will reach appropriate targets in the regenerating nervous system, and provides a new computational tool to evaluate the feasibility and expected success of neurite guidance in complex geometries.
Introduction
P
During development, a neuron's growth cone, a dynamic motile element located at the tip of the axon, searches for its synaptic targets (Mueller, 1999; O'Connor et al., 1990; Sperry, 1963). The growth cone is directed to viable targets by its ability to sense chemical and contact guidance cues (Chilton, 2006; Tessier-Lavigne and Goodman, 1996). Although some guidance cues exist after development, their distributions differ, especially following an injury (Harel and Strittmatter, 2006; Koeberle and Bahr, 2004). These changes in cue distribution modify the environmental signals and affect the guidance of any regenerating neurites. In addition, following SCI, multiple factors prevent neurite regeneration, including: the release of inhibitory factors (Nogo), axon demyelination, apoptosis, and physical barriers (cysts, glial scaring, or cavities) that may be developed post-injury. Consequent restricted neurite outgrowth, growth cone collapse, and axonal degeneration further hinders regeneration of neurites resulting in sustained partial or total loss of sensory or motor function (Jones et al., 2005; Silver and Miller, 2004; Snow et al., 1990).
Animal studies have shown that axons are able to grow past an injury site along uninjured or protected myelinated motor and sensory routes through the use of cellular transplantation and/or neurite exposure to growth-promoting neuroprotective factors (Davies et al., 1999; Silver and Miller, 2004; Thuret et al., 2006; Xu et al., 1997). Increased outgrowth past the injury site is also achieved by neutralizing factors that cause inhibitory effects such as myelin-associated glycoproteins (e.g., Nogo-A) or components of the glial scar [e.g., chondrotin sulfate proteoglycan (CSPG)] near the injury site (Bradbury and McMahon, 2006). Many SCI researchers agree that a therapy combining these strategies previously described will be necessary to successfully promote growth past the injury site and synaptic rewiring; however, if neurites fail to reach suitable targets, full functional recovery will be restricted (Harel and Strittmatter, 2006; McClellan, 1999; Thuret et al., 2006). To establish functional recovery, we propose that in addition to these therapies, neurites will need to be guided to suitable targets; otherwise, neurites tend to form aberrant paths and may not produce usable connections (Harel and Strittmatter, 2006; McClellan, 1999; Thuret et al., 2006). In support of this proposal, researchers have recently shown that a combination of developmental chemotropic guidance and strategies to promote regeneration past the injury can successfully help guide regenerating neurites to synapse with their appropriate targets in the brainstem (Alto et al., 2009).
We highlight the importance of neurite guidance by examining the probability that a regenerating axon will reach its desired target. Consider the case of a regenerated motor neurite originating in the brain and destined for the first lumbar spinal segment. To reach the desired root, the regenerating neurite must avoid the first 20 cervical and thoracic spinal segments encountered. If the probability of taking the correct path is p at each decision point, then the probability of reaching the lumbar roots is p 20, or less than one in a million for the illustrative case when p=½. To direct new neurites to viable targets, future regenerative therapies will therefore require the incorporation of guidance strategies.
These therapies will benefit from mathematical and computational assessment of how successful neurites are in reaching a desired target. In particular, simulations allow for a noninvasive, efficient, and cost-effective way to test therapeutic strategies for treating central nervous system (CNS) injuries. Some previous computational models of neurite migration, developed from in vitro experiments, have helped us to understand mechanisms of motility, neurite polarity, and how environmental cues (e.g., haptotactic or chemotactic gradients) affect guidance (Buettner and Pittman, 1991; Buettner et al., 1994; Forciniti et al., 2009; Katz et al., 1984; McLean et al., 2004; Mortimer et al., 2009; Wang et al., 2003). In addition, neurite targeting has been examined from computational models based on growth cone cytoskeletal and filopodial dynamics (Buettner, 1996). Work in our laboratory has demonstrated that growth cone migration can be effectively simulated using an integrated random walk (Maskery et al., 2004; Maskery and Shinbrot, 2005).
In the present work, we calibrate this latter model, setting parameters to agree with neurite outgrowth statistics in experiments of chick dorsal root ganglion (DRG) neurons grown on a uniform laminin substrate. This simulation, calibrated on a featureless substrate, is then applied to a patterned substrate containing numerous side channels intended to crudely mimic roots in the spinal column. We compare the simulation side-by-side with in vitro experiments using chick DRG explants in identical laminin micropattern geometry. We emphasize that the simulations are calibrated on a uniform substrate, whereas the comparisons between simulations and experiments are performed on patterned substrates. We therefore use the final simulation to quantitatively evaluate the hypothesis that the probability of neurites reaching subsequent side channels, or roots, decreases exponentially (i.e., as p n, where p is a fixed probability and n is the number of roots from the originating explant). This theoretical expectation is not a forgone experimental conclusion, because real neurites fasciculate, cling to boundaries, wander in a pulsatile fashion, and otherwise exhibit behaviors that might be inconsistent with expectations.
In this article, we: (1) confirm that neurites grown in vitro obey the probabilistic rules outlined previously; (2) evaluate the actual probability, p, exhibited in a branching pattern with multiple sequential roots; and (3) produce an experimentally validated in silico simulation to facilitate evaluations of future guidance strategies. This work will further the field of neurite guidance by showing that neurites' preference for distant targets decreases exponentially in complex geometries. We hope that by applying this rule when developing therapies, future guidance strategies will increase the number of neurites that reach their targets, thus improving functional recovery.
Methods
Master creation
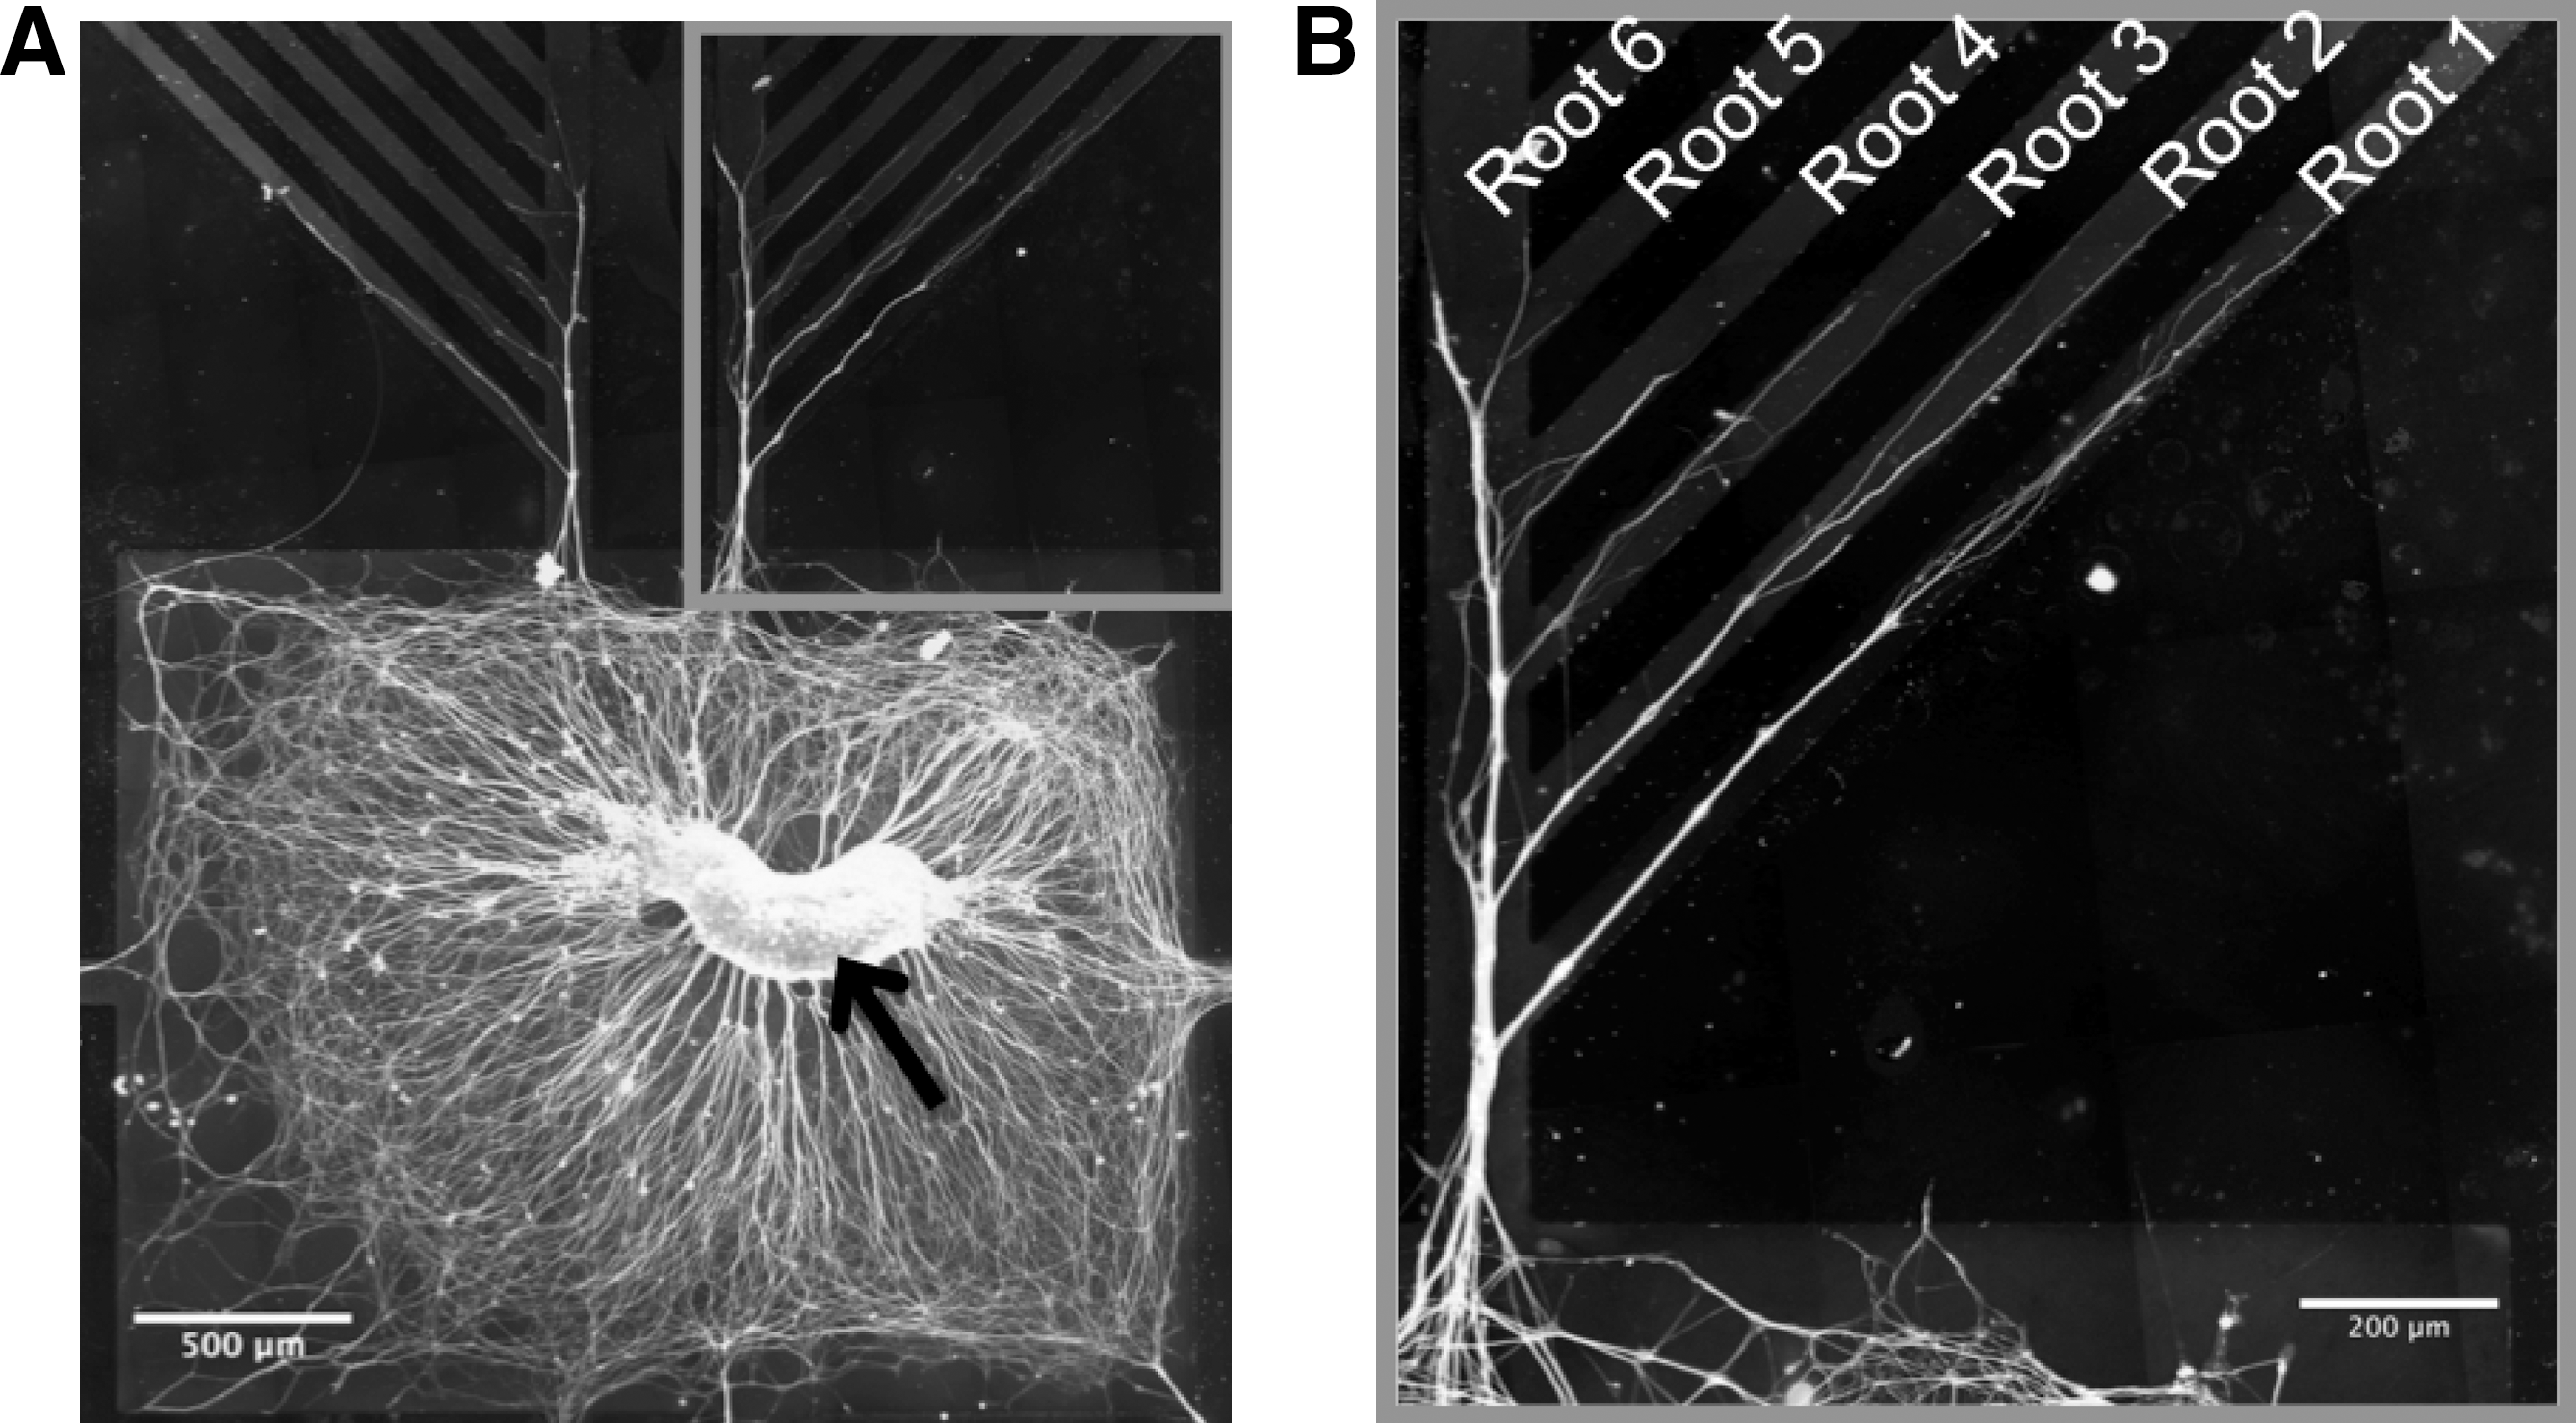
The multiple root micropatterned geometry that we use for the in vitro work is shown in Figure 1. The pattern was designed in AutoCAD (LT 2002, San Rafael, CA) and made into a dark chrome mask (Microfabrication Laboratory, University of California at Berkeley, Berkeley, CA). The mask was used to make photoresist trenches on a silicon wafer master using photolithography. To create the master, a silicon wafer was first cleaned and pre-baked at ∼150°C for 2 h. Negative photoresist (2025 SU-8) was spin coated and soft baked with a temperature ramp from 65°C to 95°C for 2 min. The mask was aligned to the master using an EV Group 620 Mask Aligner (EV Group Inc., Albany, NY) and exposed to UV light for 18 sec. Following exposure, the silicon wafer was baked at 65°C for 3 min and ramped up to 95°C for 7 min. The wafer was immersed in developer for 10 min to remove unexposed photoresist, and cleaned with isopropanol. Following creation of the master, an elastomer base and curing agent [SYLGARD elastomer kit (Dow Corning, Midland, MI)] were mixed in a 10:1 ratio (w/w), poured over the master, and cured at 65°C overnight. The resulting cured Poly(dimethylsiloxane) (PDMS) was peeled off the master manually and cut into segments to make PDMS stamps. Before placing the stamps onto glass coverslips for protein coating, the PDMS was cleaned by sterile autoclaving, sonicating in 70% ethanol for 30 min, and UV treating.
Protein patterning
PDMS stamps were first placed on a 22-mm cover glass (Fisher Scientific, Pittsburg, PA). The underside of the cover glass was marked at the center of the pattern with a marker to guide where to place the DRG (Fig. 1A) when plating. Samples were 60% oxygen plasma treated with the stamps in place on the coverslip using a PX-250 plasma generator (Nordson MARCH, Concord, CA) for 60 sec at 670 mTorr and 100 W. The micromolding in capillaries (MIMIC) process (Kim et al., 1996) was used to coat the coverslip with laminin (25 μg/ml). Following 4 h of incubation at 37°C in 5% CO2 the stamp was removed and the cover glass was washed three times with a F12/DMEM 1:1 mixture. Bovine serum albumin (BSA, 0.5%) was then added for 30 min at room temperature (Thompson and Buettner, 2001). BSA helped to restrict neurites from growing off of the pattern. In addition, BSA does not bind to the laminin protein and when BSA adsorbs onto a surface in the presence of laminin it does not interfere with the permissive laminin pattern (Dertinger et al., 2002; Esch et al., 1999). The laminin pattern was confirmed by indirect immunostaining (Fig. 1B, gray overlay) and replicated the design of 100- μm wide primary channel with 50-μm wide roots at 45° from the primary channel.
Explant culture
DRGs were dissected from the lumbar region of embryonic day seven (E7) specific pathogen-free chickens (Charles Rivers Laboratories International, Wilmington, MA) in cold calcium and magnesium free (CMF) Hank's balanced salt solution (HBSS) under a dissection microscope. A single whole DRG was then plated on the laminin-patterned glass in 600 μl of serum free media (SFM) for 8 h followed by the addition of 1.4 ml of SFM. SFM is composed of 1:1 v/v DMEM/Ham's F-12, 2 mM
Neurite outgrowth parameters in the simulation were experimentally quantified by independent time-lapse experiments of E7 DRG explants grown on uniform laminin-coated MatTek 14-mm glass-bottomed petri dishes. In this case, a single whole DRG was plated as previously described and incubated in SFM overnight before time-lapse images were taken. Images were captured every 30 sec for 1 h with a 40x objective lens (5.8 pixels/micron) using an onstage DECON incubator (Rutgers Center for Collaborative Neuroscience, New Brunswick, NJ) that maintained the temperature at 37°C with 5% CO2.
Immunostaining
DRGs grown on the micropatterned laminin substrate for 3–4 days were fixed with 4% paraformaldehyde for 15 min and then washed with CMF PBS. Samples were blocked with 10% normal goat serum (Sigma, G9023) in immunobuffer (1% BSA, 0.5% Triton-X100, and CMF PBS) for 1 h. Laminin and neurofilament were labeled using indirect immunostaining. Samples were incubated in primary rabbit anti-laminin (1:100, Sigma, L9393) and primary mouse anti-neurofilament (1:1000, 68 kDa, and 1:5000, 200 kDa, Sigma) for 1 h and then washed before adding secondary FITC goat anti-rabbit (1:100, Sigma, F0382) and Alexa 546 goat anti-mouse (1:250, Invitrogen, A11018) for 45 min. In some cases, Alexa 647 conjugated phalloidin (1:100, Invitrogen, A22287) was added for 20 min to examine growth cone density. Nuclear stain DAPI (100 ng/ml, Sigma, D9542) was added for 20 min before mounting coverslips onto slides using inkfusing Fluoro-Gel (Electron Microscopy Science, Hatfield, PA; 17985-10).
Microscopy and image processing
Fluorescence and difference interference contrast (DIC) images were acquired using a monochrome Zeiss AxioCam, CCD camera mounted onto an inverted Zeiss 200M deconvolution inverted microscope (Rutgers Center for Collaborative Neuroscience) with a 20x objective (Plan-apochromat®). Fluorescence images were captured at a constant exposure time of 300–500 ms with a scale of 0.3263 μm/pixel. Neurofilament gray scale images were used to calculate neurite preference for each root from neurofilament pixel area.
All original gray scale neurofilament and DIC images were converted into binary images (values of 0 and 1) using a segmentation algorithm programmed in MATLAB (MathWorks Inc., Natick, MA) before calculating areas. MATLAB's Image Processing Toolbox was used for all image processing. Original neurofilament fluorescent images contained background fluorescence that concealed neurite information and caused incongruous segmentation. Background fluorescence was partially removed by subtracting the background of the image, found by morphologically dilating and then eroding the original gray scale image (MATLAB's imopen function). Dilation assigns the maximum pixel value to all pixels within the local structure element (neighborhood), while erosion assigns the minimum pixel value to all pixels within the neighborhood (Costantino et al., 2008; Gonzalez and Woods, 2002). To avoid including background in neurofilament calculations, a disk-shaped structure element with a 100-pixel radius (>30 μm) was selected for dilation and erosion. The background-reduced image was then filtered using a local Laplacian and nonlinear range filter to create two new images that respectively isolated fine neurofilaments and neurofilament edges.
Neurofilament segmentation was accomplished by partitioning the gray scale pixel values of all three processed images into two separable clusters (background and neurofilament) using MATLAB's kmeans function. K-means clustering calculates two cluster centroids, chosen initially to be 0 or 1, by minimizing the sum of squared Euclidian distances between pixel values and cluster centroids. Algorithmically, first each pixel is assigned to the cluster centroid with the smallest distance between the pixel value and cluster centroid. Then after all pixels are assigned to a cluster centroid, the pixel values within each cluster are averaged to recalculate each centroid. These two steps, pixels reassignment to cluster centroids and centroid position recalculation, are repeated until the centroids' positions remain unchanged. The resulting binary image of neurofilament is shown in Figure 2.

Binary image of neurofilament stain overlaid on top of laminin pattern boundaries (gray line border). Total area within each root, TAb , is measured by manually selecting regions of neurofilament within a root number, b, (dotted white box in b=3, TA3 ). Neurofilament areas within a fixed region of the root and primary channel were also measured respectively to the right and left of the root bifurcation point (dashed white boxes in b=1, enlarged view of boxes labeled AR1 and AL1 ). Comparison of areas is used to examine neurite trajectory and root preference at each bifurcation point.
To validate whether neurofilament stain is an accurate metric for neurite area, we compared the areas from image-processed DIC images to neurofilament images. Background from the DIC images was first subtracted from the original image using the same morphological operation, imopen, described for neurofilament images. The new image was then filtered separately by a local entropy (9 x 9 neighborhood) and a standard deviation (5 x 5 neighborhood) filter after observing pixel value randomness and variance along the axons (Hamahashi et al., 2005). These two images along with the background reduced DIC image were segmented into two pixels clusters, ”cells” and “background”, using the same k-means clustering method described earlier. Laminin stain was also segmented to isolate fluorescence using k-means clustering to visualize the pattern's edges while selecting regions of interest.
Calculating neurite root preference and fasciculation
The binary neurofilament images produced were used to calculate the probability of root entry by any neurite, PEb , for each root, where b defines the order of roots (i.e., root numbers) from the entrance into the primary channel. PEb was calculated by dividing the frequency, Mb, of any continuous neurofilament observed to enter 20 μm past a root entry by the total number of samples measured (n=20 replicates).
Neurite preference for a particular root, PTb , was calculated by dividing the total neurofilament area, TAb , in a root, b, by the total neurofilament area within all roots, ∑TAb , for both neurofilament and DIC binary images. TAb was measured by counting the number of white pixels within an outlined region from the b-th root entry to the farthest-reaching neurite tip within the side borders of the root (dotted white box in b=3 of Fig. 2). Side borders were determined by overlaying the laminin binary image onto the neurofilament and DIC images. Roots with neurites >50 μm away from the root entry and with no neurites observed in them were not measured.
Because the PTb measurement increased the bias of neurite root preference for neurites that traveled farther up the root (shown in Fig. 2), we developed a new bulk area measurement to reduce the biasing. The new neurite root preference measurement, PFb , is based on neurofilament area, a fixed distance into the b-th root, ARb , and is calculated by dividing ARb by the total fixed neurofilament area within all roots, ∑ARb . The fixed area within ARb is 400 pixels up the root, starting from the root entry, and 400 pixels wide (1.6e5 pixels=1.7 cm2), as shown in Figure 2's dashed white box labeled AR1 to the right of the primary channel.
The probability of a neurite's entering a root, PRb
, (i.e., divergent trajectory) instead of continuing to grow along the primary channel, PLb
, (i.e., straight trajectory) was also examined. PRb
was calculated by comparing ARb
to the neurofilament area within a fixed area in the primary channel, ALb
. ALb
is the number of neurofilament pixels within a 400 x 400 pixel square region of the primary channel bordering the ARb
region. All regions selected are equal in area (dashed white boxes labeled AR1
and AL1
for b=1 in Fig. 2). ARb
and ALb
were used to calculate PRb
for each b in the equation below:
where PRb+PLb =1. PRb is analogous to p mentioned in the introduction for b=1 only.
The number of neurite bundles formed from neurites that have fasciculated was also determined using a 400-pixel-long profile plot parallel to the primary channel at the root entry. Because neurite bundles are larger than a single axon, each continuous white pixel was classified as a bundle of axons if larger than a single axon. The frequency of bundles, Bb , at b for all samples was then counted and divided by the total number of samples (n=20 replicates) to estimate the average number of neurite bundles, Fb .
Comparing neurite preferences calculated from different neurite area measurements
Using fluorescent microscopy, we observed that neurites could overlap. These neurites may have been neglected when measuring bulk neurite area, 2D area, to calculate neurite root preference, PFb , as described in the previous section. PFb was recalculated with a new area measurement that includes the overlapping neurites. This new area, z-stack area, was measured from the cross-section of neurites (orthogonal to the xy-plane) along the root entry of a z-stack image. Z-stacks were acquired using a 63x oil emersion objective (0.3 μm/pixel) on an Olympus, Center Valley, PA; IX2-DSU spinning-disk confocal microscope. Images were imported into ImageJ using the LOCI plugin. A straight line was drawn perpendicular to the neurites within the fluorescently labeled root using the straight-line tool. The cross-section image of the z-stack was reconstructed using the reslice tool and then processed into a binary image using k-means clustering. A contrast-enhanced and background-removed image, original image with the morphologically dilated and eroded image subtracted, was used to create the binary image. Objects in the image that were considered to be non-neurite were removed using the morphological operation imopen, with a disk-shaped structure element (diameter ≤1 μm) (Bergers et al. 2002). The probability of a neurite choosing a divergent trajectory, PRb , was also recalculated as described in the previous section using z-stack area measurements of neurofilament at root entries, ARb , and after the roots in the primary channel, ALb . Then PFb and PRb were calculated and compared for both area measurements: 2D bulk and z-stack.
Results
Analysis of growth cone motility from time-lapse images
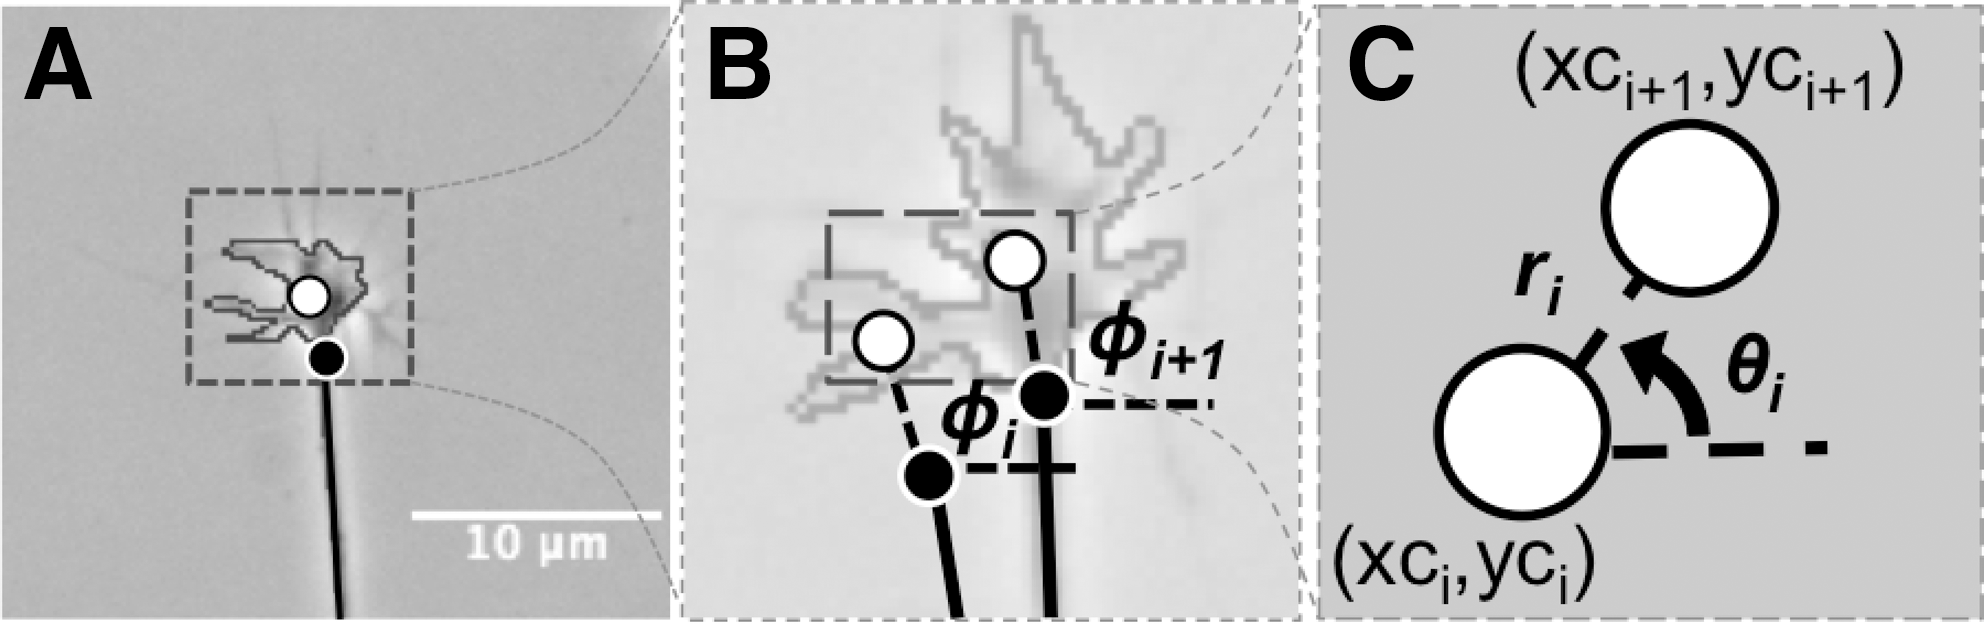
Three different time-lapse image sequences from DRG neurons were analyzed to evaluate the rate of neurite outgrowth and the growth cone search angle. These data were used to build a realistic computational model. Growth cone centroid and base were manually tracked using ImageJ 1.41 (NIH, Bethesda, MD). As illustrated in Figure 3A, the growth cone centroid (xc,yc) was calculated by outlining the lamellipodium and excluding filopodia (Buettner, 1994). The base of the growth cone (xb,yb) was selected as the point where the axon broadens to larger than the average width of an axon (∼1 μm, from average measurements of dissociated neurites). The angle from the growth cone centroid to growth cone base with respect to the x-axis of each successive movement was calculated to find the growth cone orientation, Φi, defined in Figure 3B. The change in orientation was then used to calculate the search angle, δi. The rate of centroid movement was converted from Cartesian to polar coordinates (ri, θi) to calculate the respective outgrowth and current direction shown in Figure 3C. Uncertainty of outgrowth was also calculated as the change in outgrowth.
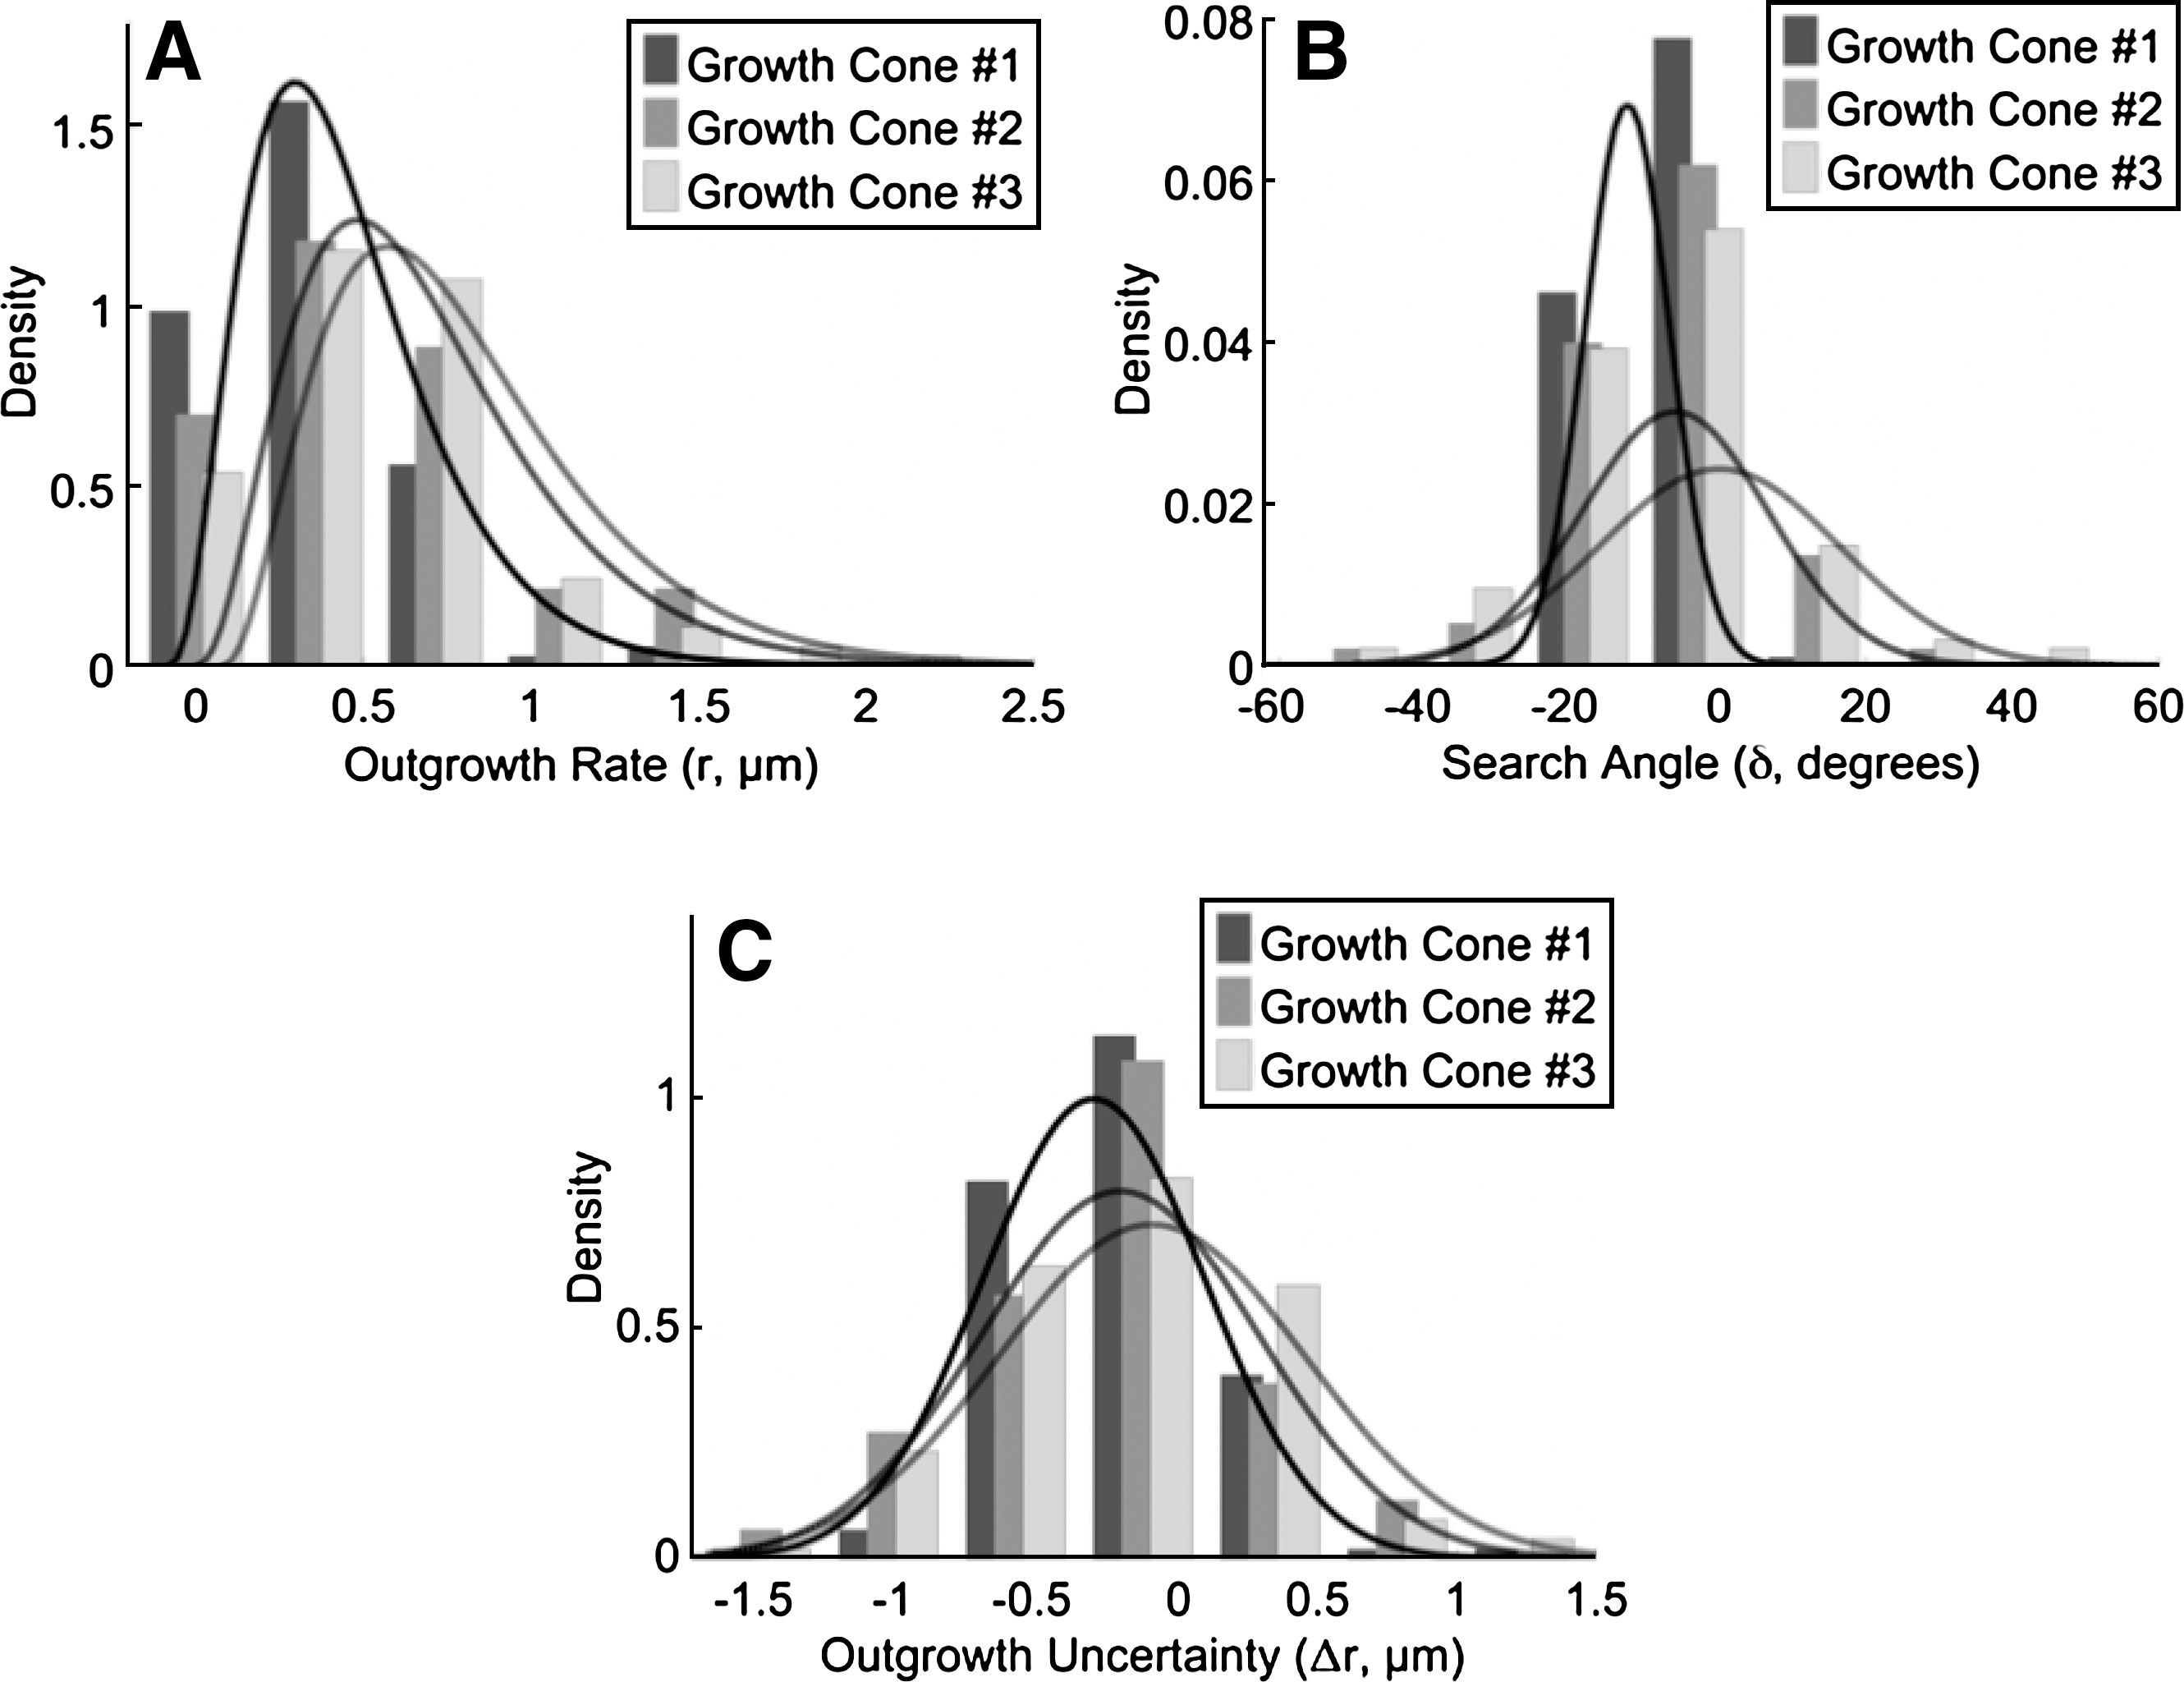
Neurite outgrowth, uncertainty of outgrowth, and search angle measurements were fit to probability distributions using MATLAB's Statistical Toolbox. All data were found to fit significantly to their respective distributions after performing a two-sample Kolmogorov–Smirnov test (p>0.05). Data from average growth cone centroid outgrowth distance (rd) fit significantly to a Γ distribution (Figure 4A), Γ(κ,θ), where κ=6.8 μm and θ=0.38 μm, and the uncertainty of outgrowth (rs) fit significantly to a normal distribution (Fig. 4B), with mean 0 and σ=0.32 μm. As events of neurite extension, average persistent outgrowth distance, are a combination of random events [actin polymerization (Betz et al., 2009) and microtubule assembly (Odde et al., 1996)] and Γ distributions generally arise in connection with compound random events, therefore there is an appropriate theoretical basis for the use of the distribution (Buettner and Pittman, 1991). The addition of a stochastic variable, uncertainty of outgrowth distance, to average outgrowth distance, accounts for other fluctuations in the outgrowth process such as dynamic instability of microtubule assembly (Mitchison and Kirschner, 1984). In addition, search angle (δ) data fit significantly to a normal distribution (Fig. 4C), with mean 0° and σ=12°. The distribution matched expected behavior as neurite outgrowth migrates predominately in forward trajectory, presumably because of the stiffness in the microtubules (Buettner et al., 1994; Katz, 1985; Katz et al., 1984).
Plot of the growth cone centroid
Simulation model of neurite outgrowth
The computational model of neurite outgrowth is based on a 2D random walk, where each progressive iteration, i, is dependent upon the previous one. Neurite outgrowth is adjusted based on the three parameters: average outgrowth, rd; outgrowth uncertainty, rs; and current direction, θi; of a neurite's tip described in the previous section and shown in Figure 5A. The distance parameter, ri, is the sum of the average outgrowth, rd, and the outgrowth uncertainty, rs, which are respectively Γ and gaussian distributed. The maximum uncertainty of outgrowth is rs. The current direction is modified by the growth cone's search angle, δi, to the left and right of its current angle, θi, as illustrated in Figure 5A. The experimentally fit distributions from time-lapse data were incorporated into the simulation, and values were randomly generated during the simulation using MATLAB's Statistical Toolbox. In this way, the simulated growth cones were engineered to produce identical statistics to those seen in vitro on a featureless substrate. Polar coordinates (ri, θi) are converted to Cartesian coordinates before adding the next growth to the current position in following equations:
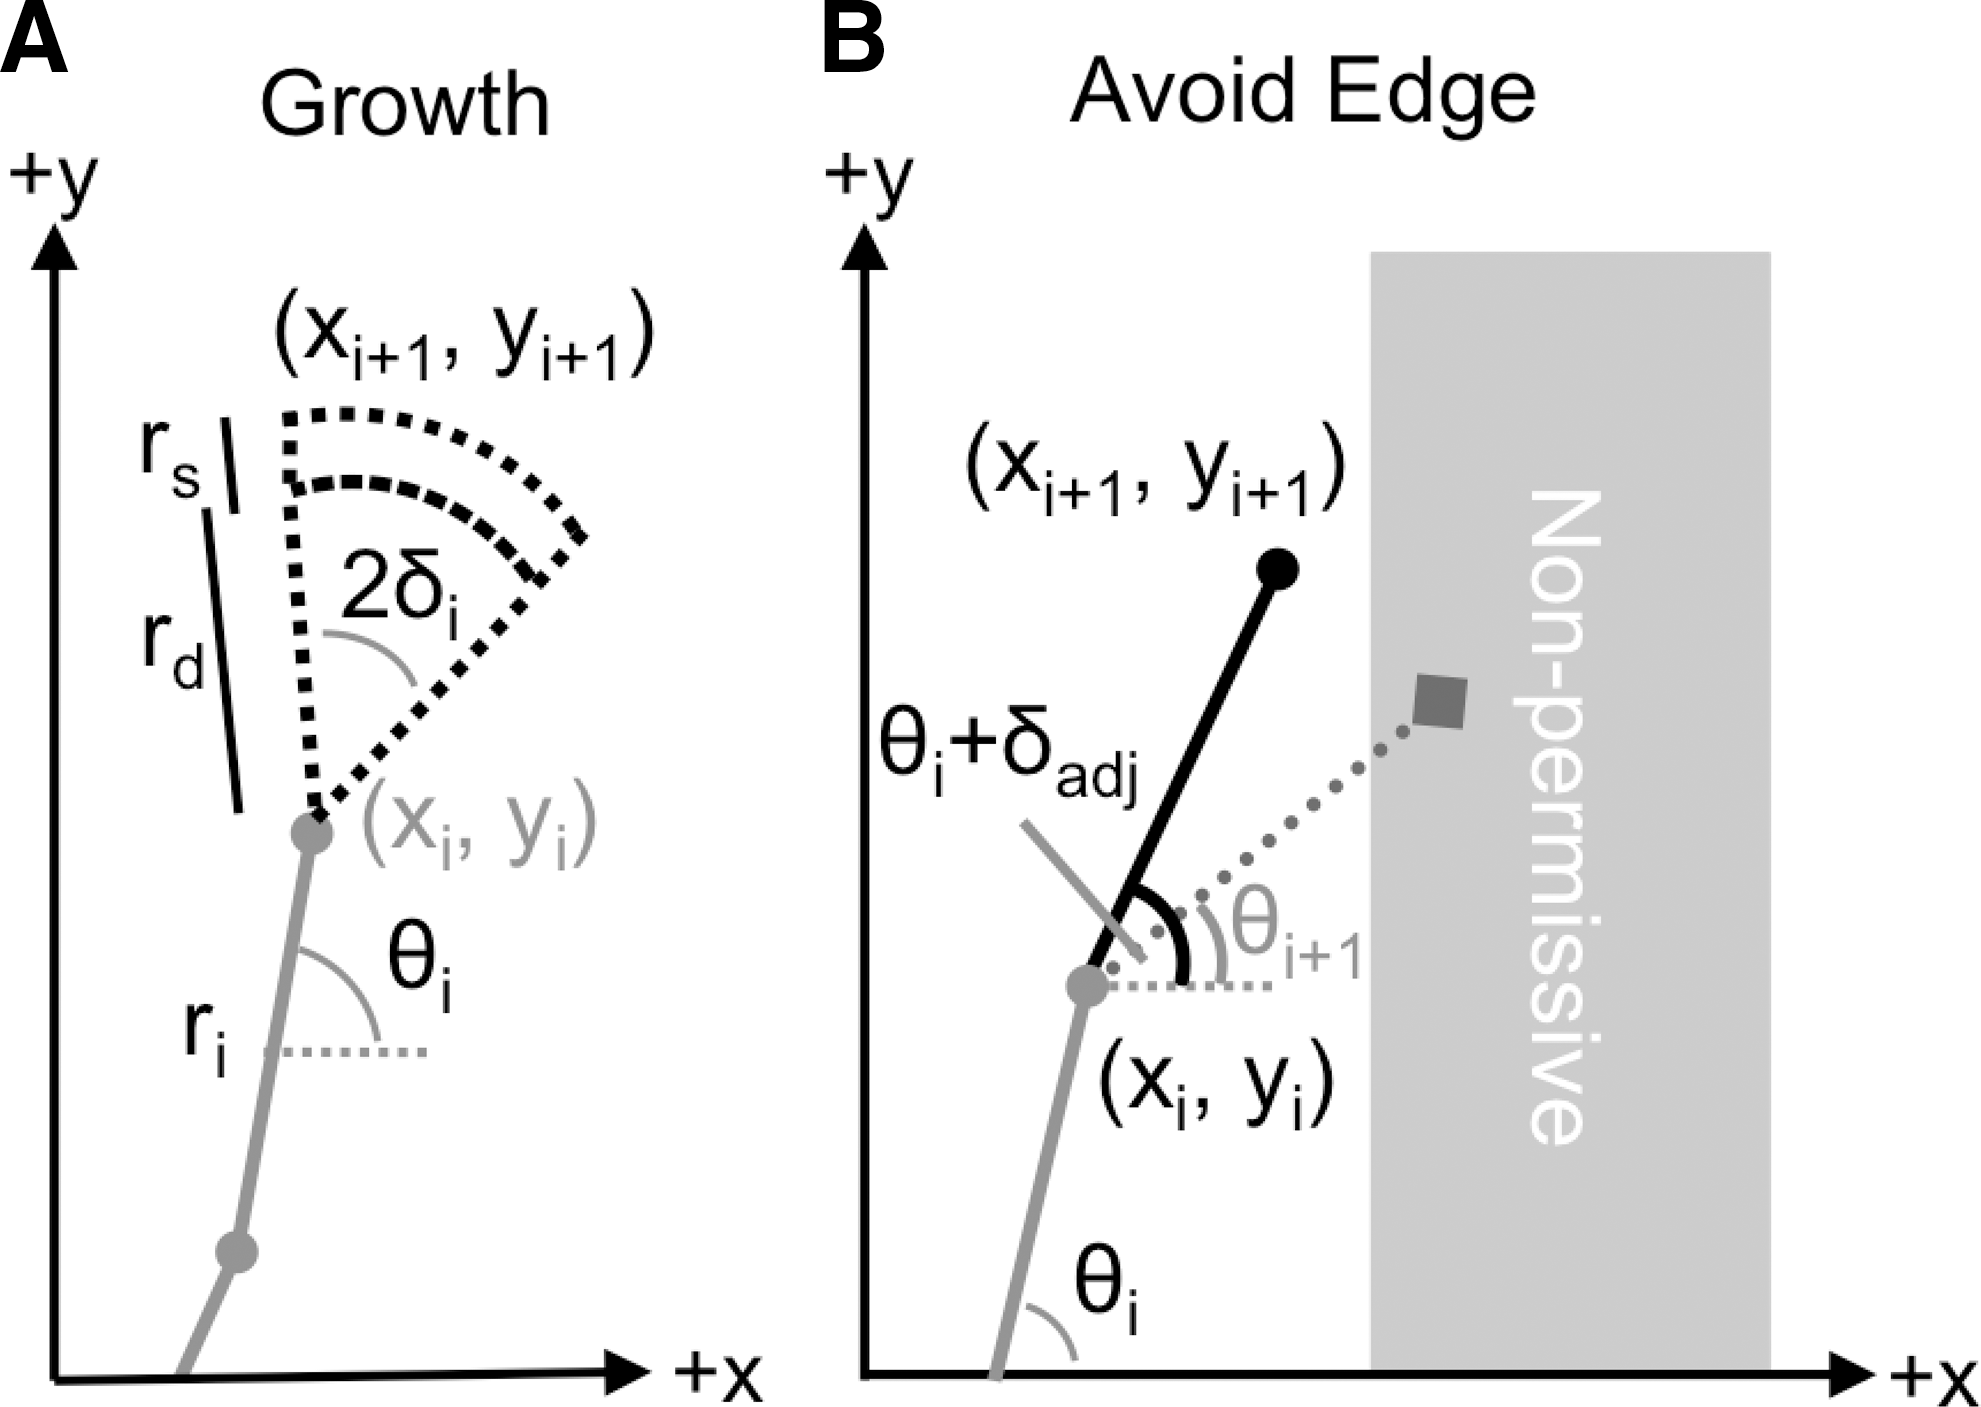
When a neurite encounters a non-permissive boundary (shown in Fig. 5B), the neurite reverts back to its previous position (xi,yi) and direction (θi). A new direction is then recalculated from summing the new search angle (δadj), which is randomly selected from a gaussian distribution, and previous direction (θi). If the new neurite tip position evaluated encounters the edge again, then these two steps are repeated until the boundary is avoided. Once an angle is selected that allows the neurite tip to avoid the edge, the neurite tip continues migrating based on the previously described persistent random walk. The simulated change in direction of the neurite tip at the non-permissive edge is based on previous experimental observations examining growth cone turning behavior, which has been described as the growth cone reorienting along the substrate edge and then growing along or away from the edge (Tanaka and Kirschner, 1995).
To confirm the correspondence between experiments and simulations, mean-squared displacements of the two data sets were compared. Mean-squared displacement (MSD) of the growth cone centroid was calculated for both experiments and simulations on a uniform substrate to examine persistence time, Pv, and random motility, μ, which describes growth cone motility and tortuosity (Buettner et al., 1994; Wang et al., 2003). These two parameters were estimated by fitting a theoretical persistent random walk model to MSD measured from experiments (Fig. 6A) and simulations (Fig. 6B) using nonlinear regression (r 2>0.98). Average random motility and persistence time were compared between the in vitro experiments (n=3 replicates) and in silico simulations (n=100 replicates) of neurite outgrowth for 1 h on a uniform substrate. Both parameters for experiments and simulations matched within a 95% confidence interval.
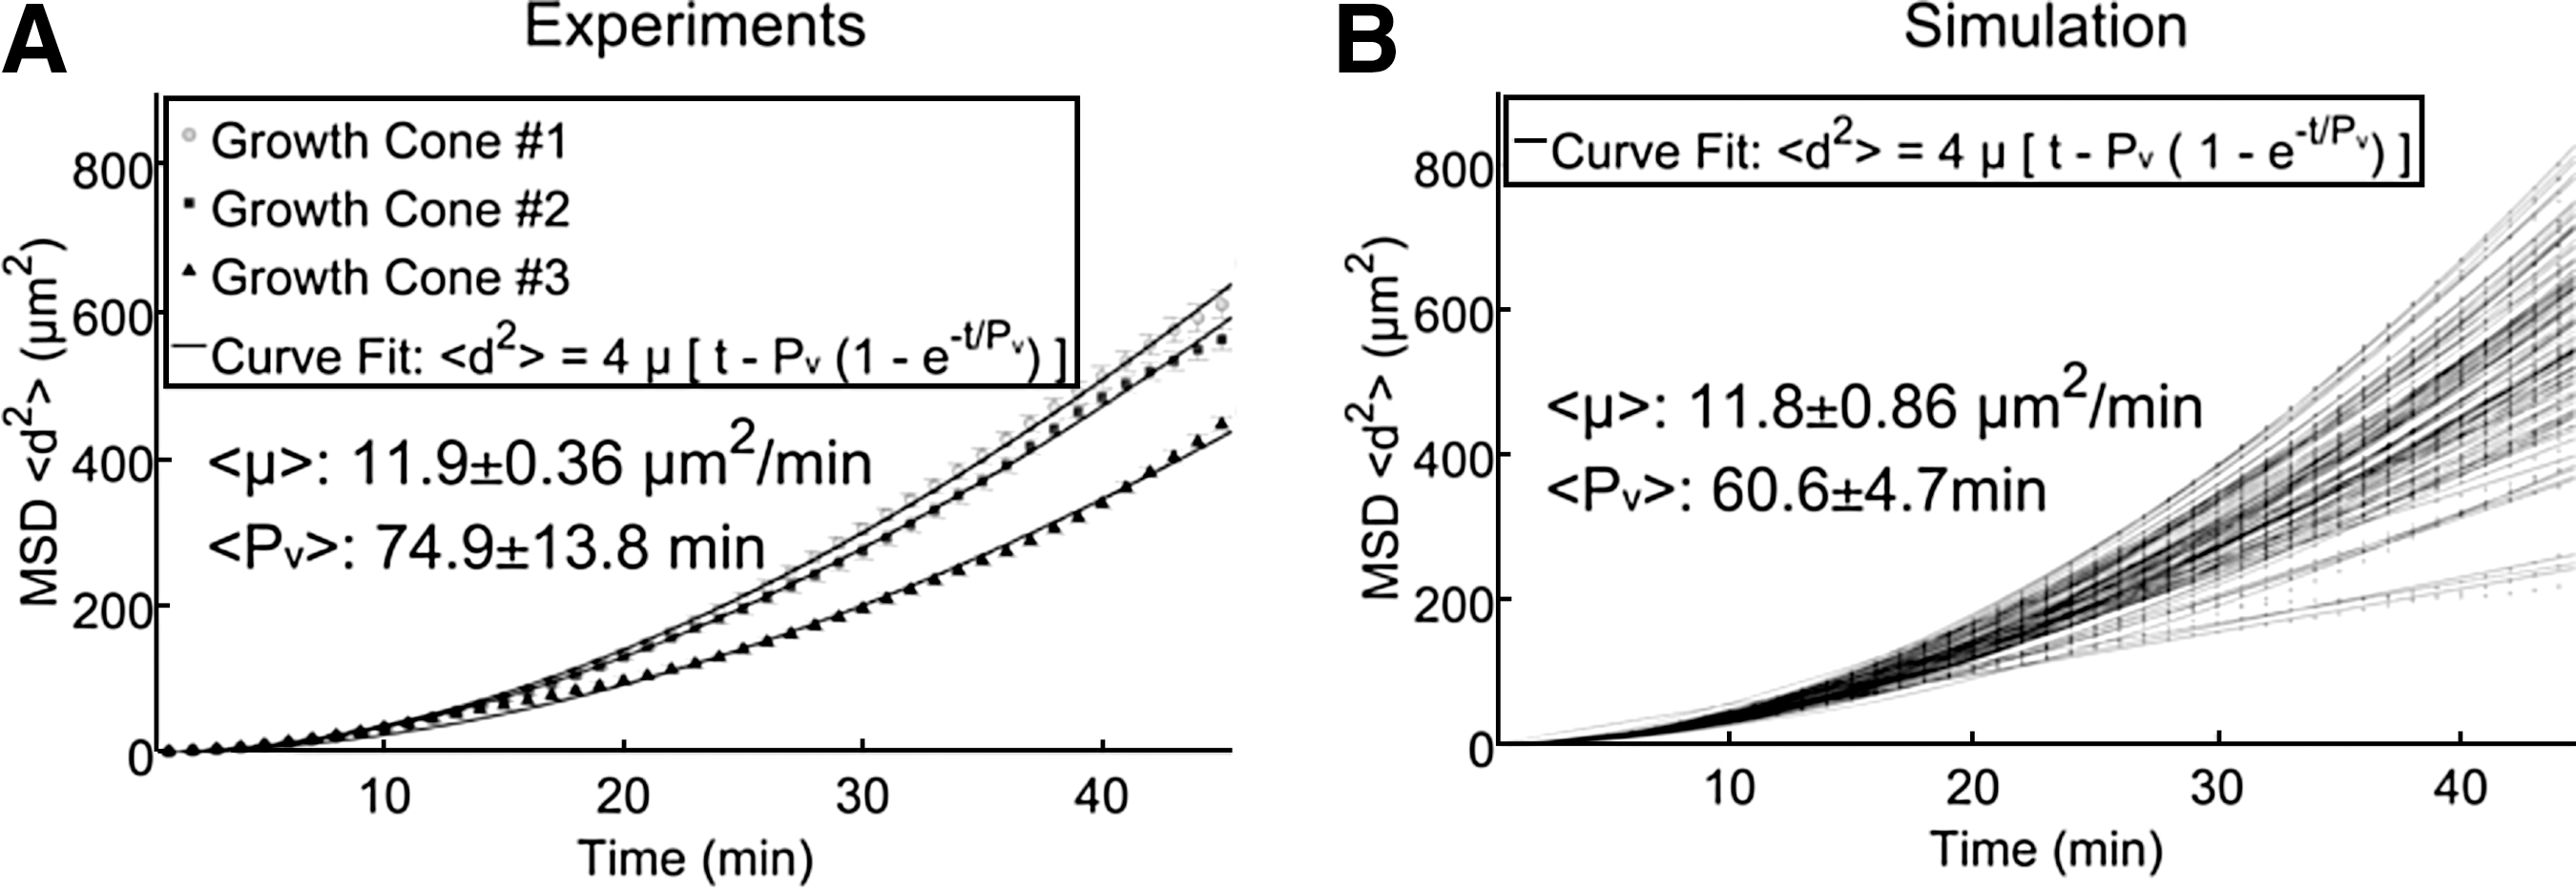
Theoretical persistent random walk model fit to MSD measurements from
Computational model of neurites grown on a multiple root pattern
The identical multiple root geometry used for the experimental laminin micropattern was incorporated into the simulation to evaluate how robust and predictive the computation model was. The simulation was initiated by placing a number, n, (n=100 in the simulations for each case studied) of neurites at random positions along the base of the pattern with neurite current angles parallel to the primary channel's edge. Each neurite grows for a different number of iterations, simulating the time-dependent neurite entrance into the micropattern environment. When a simulated neurite enters a root, it is not permitted to turn backwards, and may only continue moving forward. This concurs with observations from time-lapse videos using micropattern stripes 100 μm wide or smaller. Simulations of growth cone outgrowth were run with 100 neurites (1 iteration=30 sec and 1 unit=174 μm), producing results such as those shown in Figure 7. White circles and black triangles represent the respective neurite end points and origins. Each simulation of 100 neurites is replicated 20 times to produce the data shown in subsequent figures. The simulation ran for an equivalent number of iterations that matched 2.5 days, the average time from when neurites entered the primary channel until neurites reached b=8 in vitro.
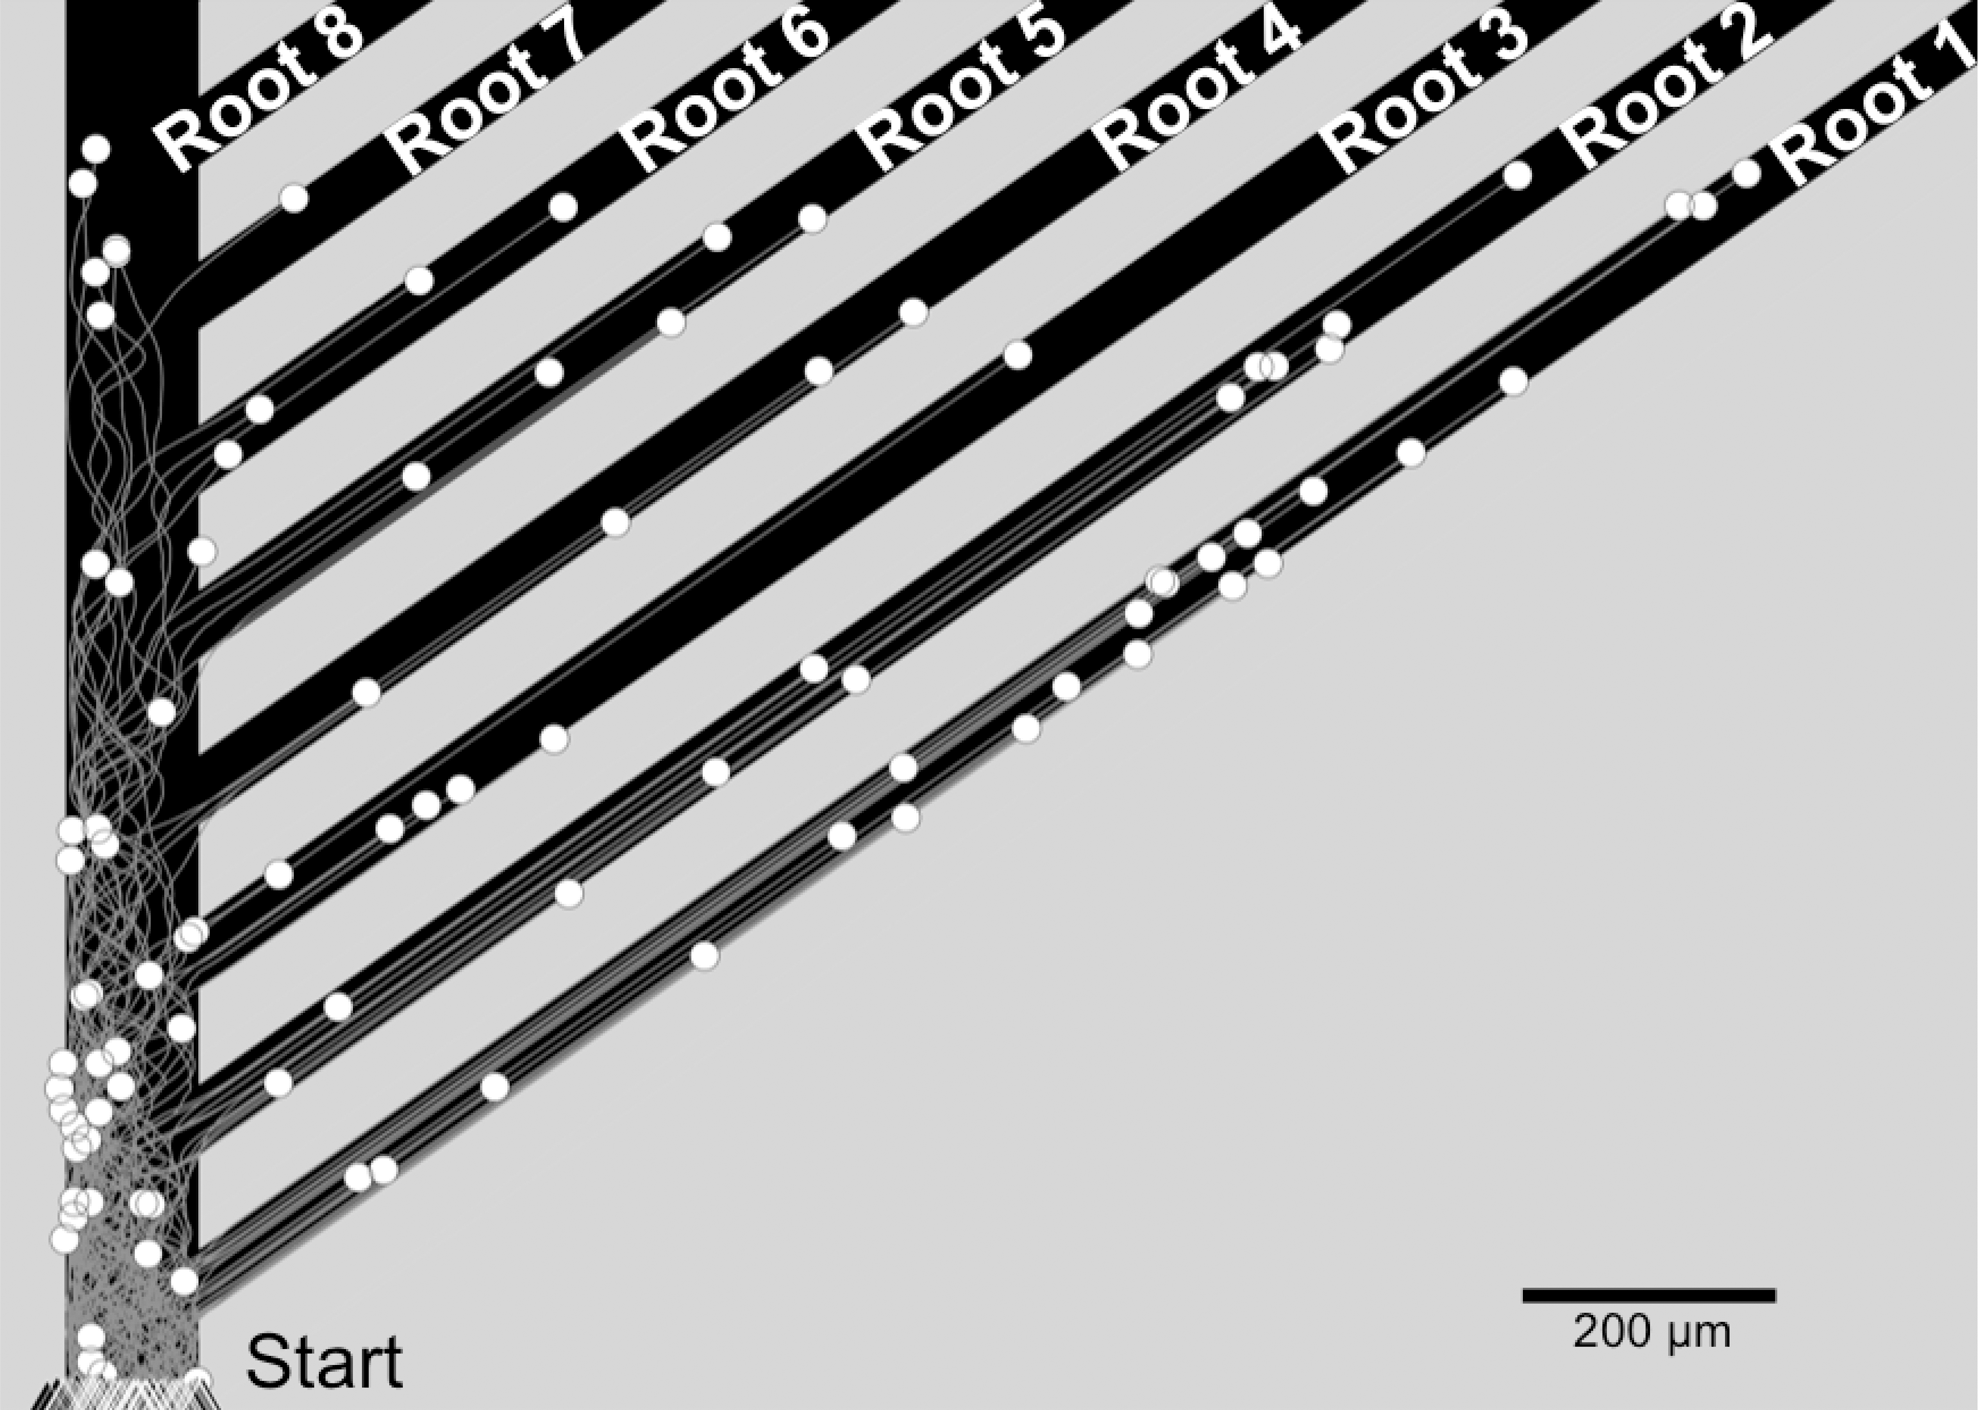
Result from the simulation of neurite trajectories (gray lines) and growth cone centroids (white circles) on a multiple root pattern designed to mimic the complex in vitro micropattern geometry. The start, defining where neurites enter the primary channel for companion in vitro studies, is labeled as triangles. Neurites continued to grow straight at 45° after entering a root, as observed from experimental samples.
Neurite preference measurements from experimental and simulated data were compared to assess the accuracy of the simulation. Evaluation of neurite preferences for the simulation was calculated and modified to match the four different experimental neurite preference assessments: PEb , PTb , PFb , and PRb . Both PEb and PTb measurements were calculated in identical ways for experimental and simulated data. Similar to experimental samples, PEb for the simulation could be observed from the output. PEb was calculated by dividing the frequency, Mb , of root entry by any neurite (xi+1 >0.588 units and b>yi+1 >b – 0.422) in all samples (n=20 replicates) by the total number of samples. In addition, PTb for the simulation was evaluated similarly as experimentally measured PTb, because the total neurite area in each root, TAb , could be estimated from the total distance a neurite traveled in a root. TAb for the simulation's PTb measurement was calculated by summing the distance traveled by all neurites within b from the root entry (xi+1 >0.588 units) until the end of the simulation. Because individual neurites could be identified in the simulation we did not need to use indirect estimates of neurites, as is done in experiments. Therefore, PFb was calculated in the simulation as the fraction of neurites that entered a root, Nrb , relative to the total number of neurites that entered all roots, ∑Nrb . PRb was calculated in the simulation as Nrb (xi+1 >0.588 units and b>yi+1 >b-0.422) divided by the number of neurites that entered, Nrb , and avoided the root, Nlb , i.e., took a straight trajectory (Nlb =Nlb+1 +Nrb+1 or Nlb =100 - ∑Nrb ).
Comparison of experimental and simulated data
Experimental and simulated PTb and PFb were fit to exponential curves, y=αeβb , using MATLAB's Curve Fitting Toolbox, where y is either PTb or PFb , b is the root number, and coefficients α and β are constants fit to data points using the least squares method. Both exponential curve fits were also compared between the experiment and simulation to check if the exponential coefficients matched within a 95% confidence interval. Experimental and simulated probabilities of neurites entering a root at a decision point, PRb , were fit to a line, PRb =ξb+λ, where coefficients ξ and λ were constants fit to data points using least squares. PRb was fit to a line to examine if the same linear trend observed from experimental data was captured in simulations.
Probability that a root is entered by one or more neurites (PE b)
PEb was evaluated to examine if neurites entered a particular root more often than others. Root entry by neurites was observed more frequently for nearby than for distant roots in both in vitro and in silico models (Figure 8). The average probability of experimental root entry of neurites into b, PEb , decreased linearly (PEb =− 0.12b+1.1, for b=1 through 6 inclusive, r2 =0.97, n=20). For simulations, PEb decreased less rapidly with increasing b (PEb =− 0.020b+1.0, b=1 through 6 inclusive, r2 =0.84, n=20), as shown in Figure 8. On average, at least one neurite was observed to enter each of the first three roots in the simulation for every sample (Mb =20 for all 20 replicates, when b=1 through 3 inclusive).
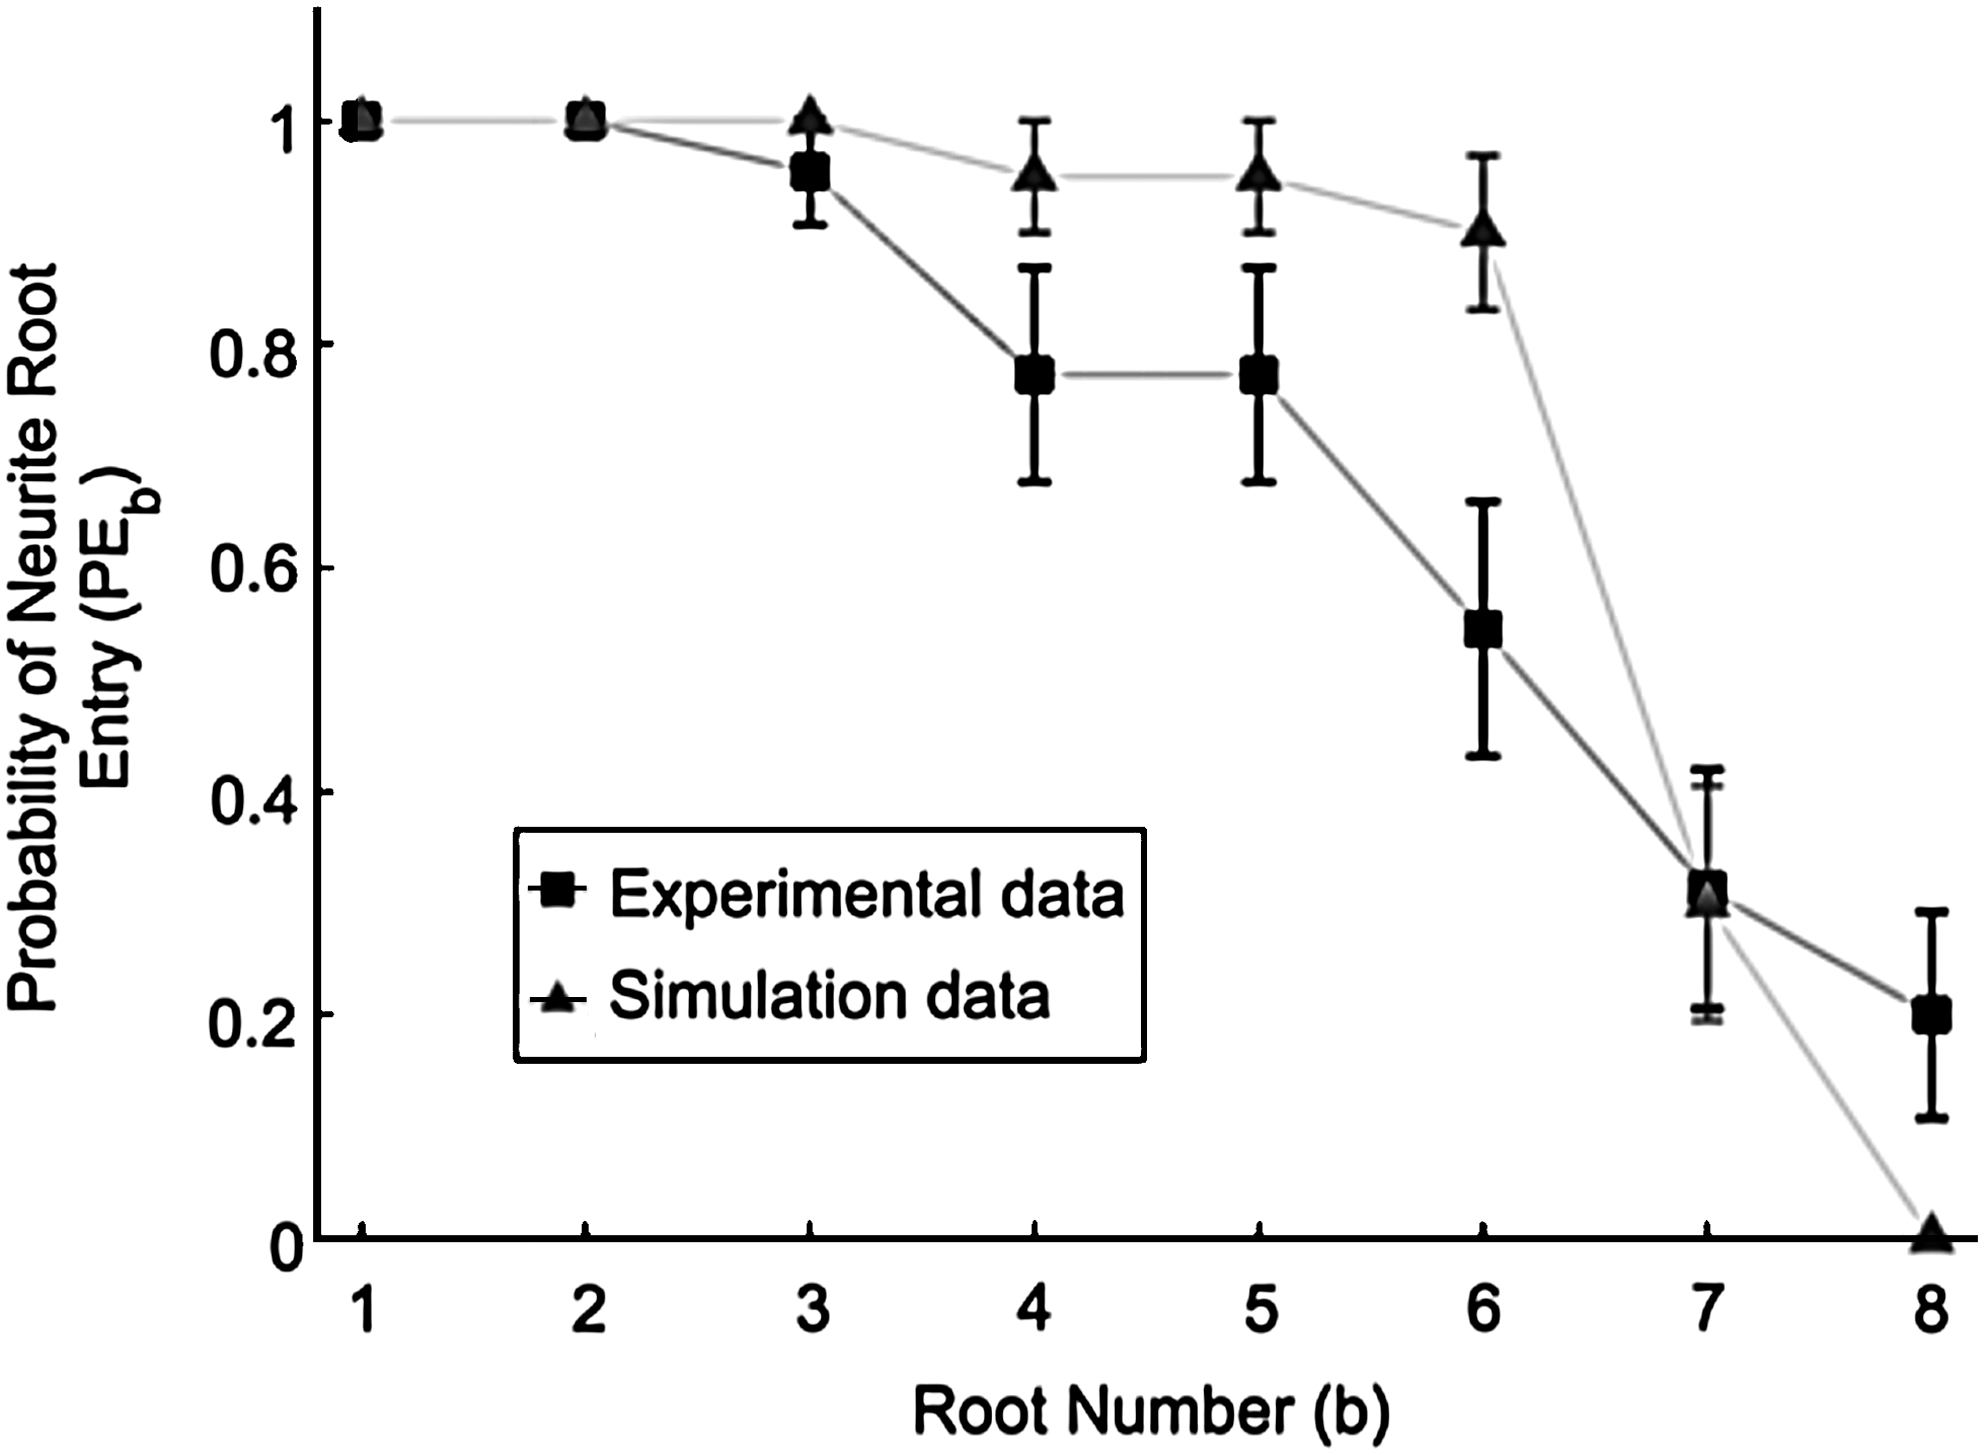
Neurite entry into a root was determined if any neurofilament was detected in the root. Experimental and simulated data were both averaged for 20 replicates. Error bars are SEM.
Neurite root preference (PTb & PFb )
Neurite root preference was measured to examine if it exponentially decreased for increasing b and if the simulation matched the experimental data. Neurite root preference was observed to decrease exponentially with increasing root number according to y=αeβb , in the first eight roots for both experiments and simulations. As shown in the inset plot to Figure 9, neurite root preference, PTb , which is based on neurofilament area, decreases exponentially as a function of increasing root number. Neurofilament stain was found to be a valid indicator for neurite location by comparing PTb calculated from DIC and neurofilament images for all b (n=13).
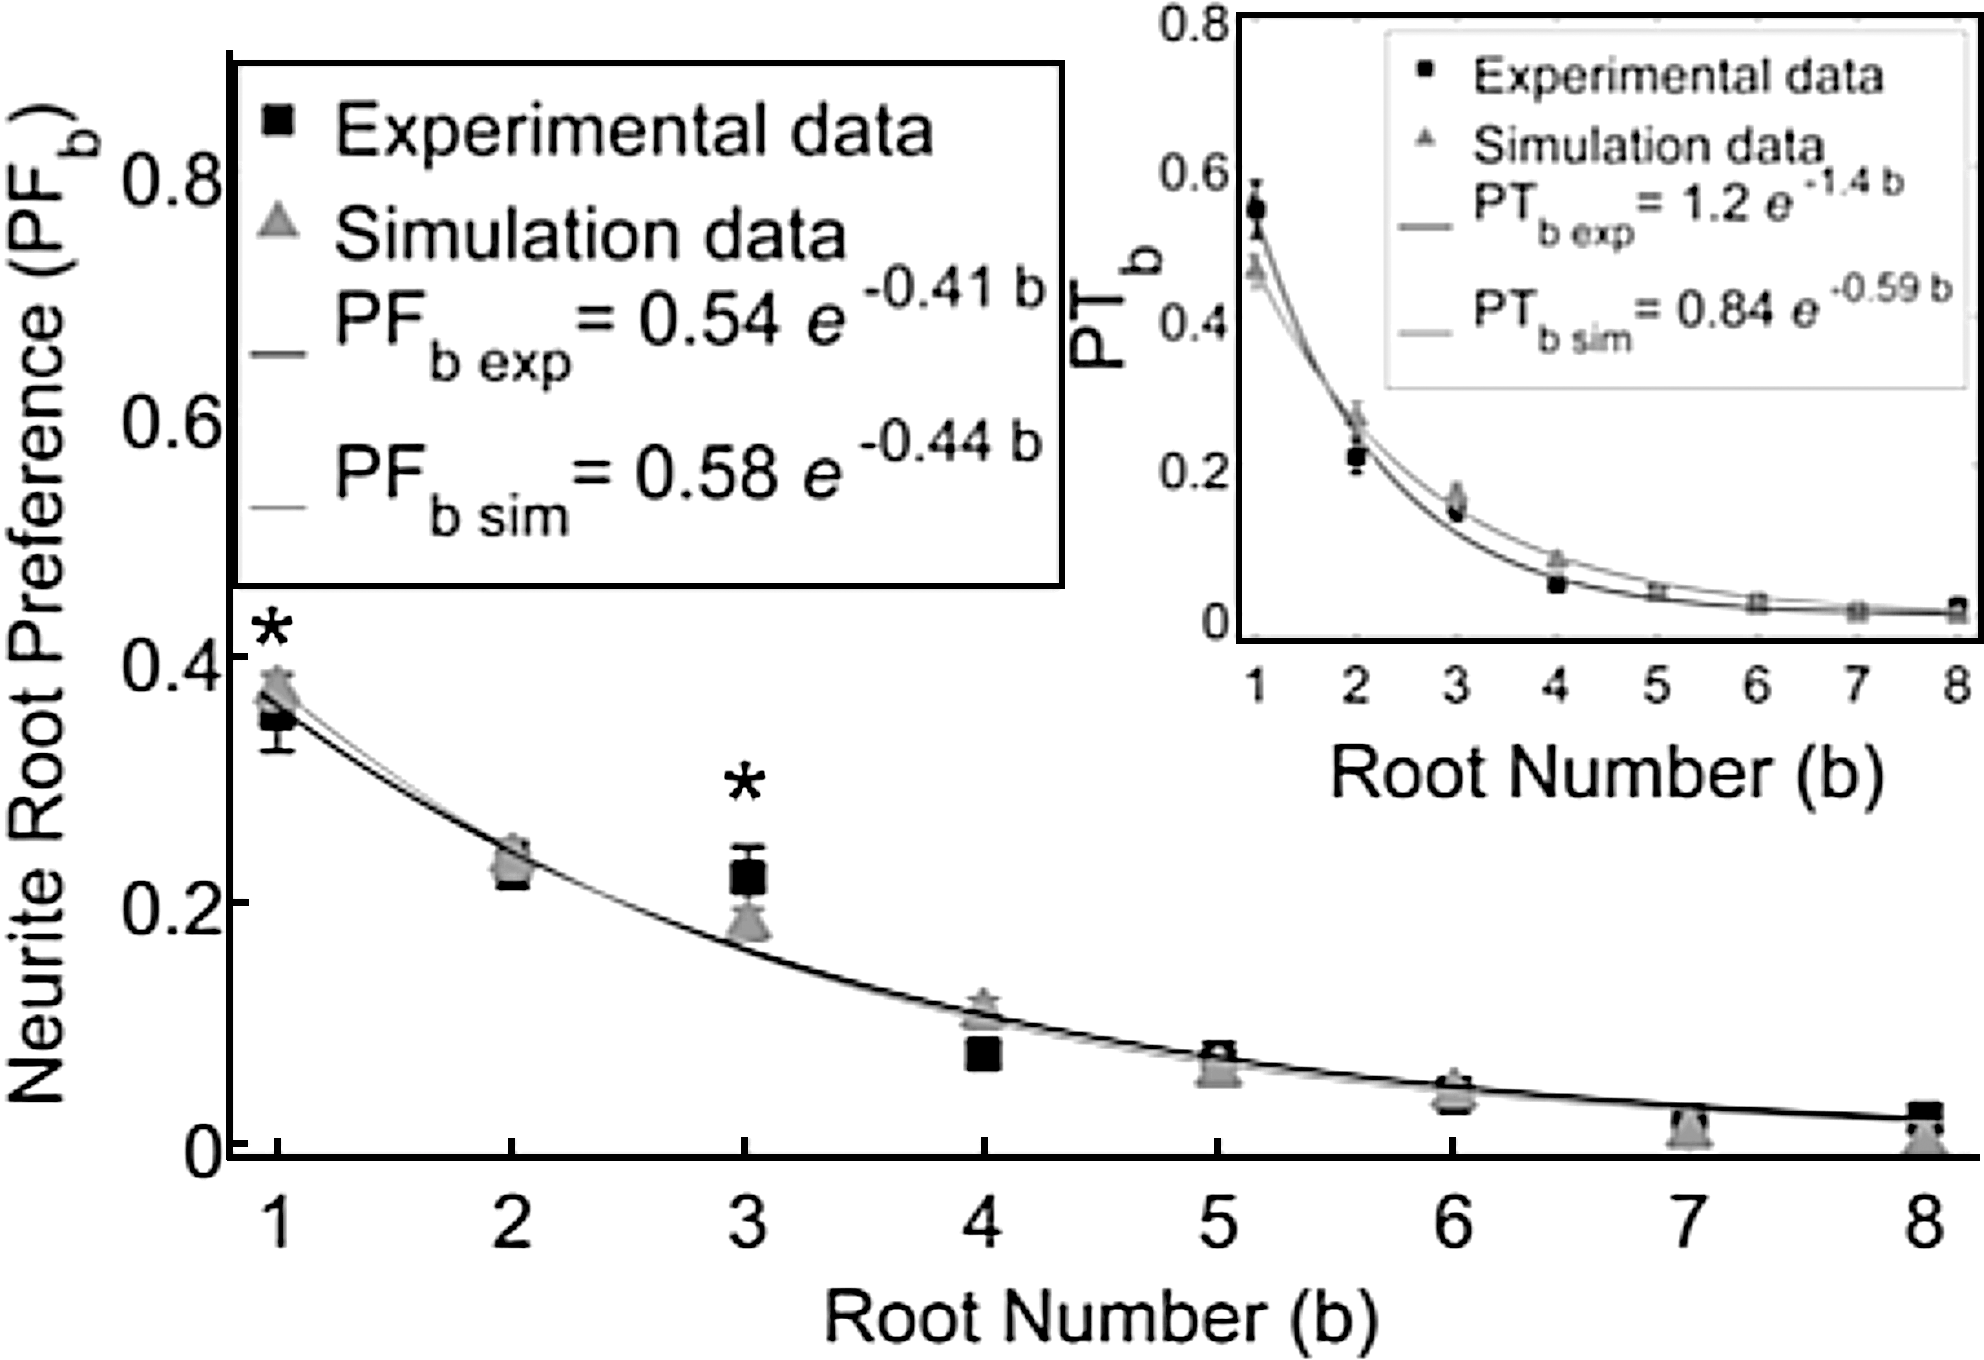
Percent of neurofilament area occupied within a fixed distance into the first eight roots is shown for both experimental (black squares) and simulation (gray triangles) data. Data are fit to exponentials indicated: r2 values for experimental and simulation data are 0.955 and 0.996 respectively. Experimental PFb was significantly larger for the labeled b when compared to the next root number (unpaired two-tailed t-test, *p<0.05, n=20). Similar results were found using a multiple comparison test with Tukey's least significant difference procedure along a 95% confidence interval. Percent of total neurofilament area, PTb , in the first eight roots is shown in the inset. Error bars are SEM.
Calculation of PFb also confirmed that the exponentially decreasing trend is based on root number and is not an artifact of neurites extending farther along nearby than along distant roots. Both experimental (r2 =0.955) and simulated (r2 =0.996) data fit to exponential curves, as shown in Figure 9. In addition, the coefficients, α and β, for both exponential curves overlapped within 95% confidence intervals of each other and both PFb data were significantly not different for all b (n=20). Significantly larger experimental PFb was found for b=1 and 3 when compared to the next root number (unpaired two-tailed t-test, p<0.05, n=20), as shown in Figure 9.
Probability that neurites will choose a divergent trajectory (PRb )
PRb was evaluated to examine if it was constant for all roots and if the simulation matched the experimental PRb . The fraction of neurites that will choose a divergent trajectory, PRb , remained relatively constant in simulations (average PRb for all roots 0.18±0.01) but decreased for increasing b in the experiments. As shown in Figure 10, experimental PR4 differed significantly to the previous three roots (unpaired two-tailed t-test, p<0.05, n=20), as shown in Figure 10. In addition, experimental PR5 significantly differed than PRb for b=1 and 3 (unpaired two-tailed t-test, p<0.05, n=20), as shown in Figure 10. Both experiments and simulations were characterized by the same increased uncertainty caused by small sample sizes (i.e., that few neurites reach distant roots) far from the explant. Experiment and simulation average PRb data did not differ significantly for b=5 and 6 (unpaired two-tailed t test, p=0.90, n=20). To limit this variability, roots 7 and 8 were excluded from the analysis.
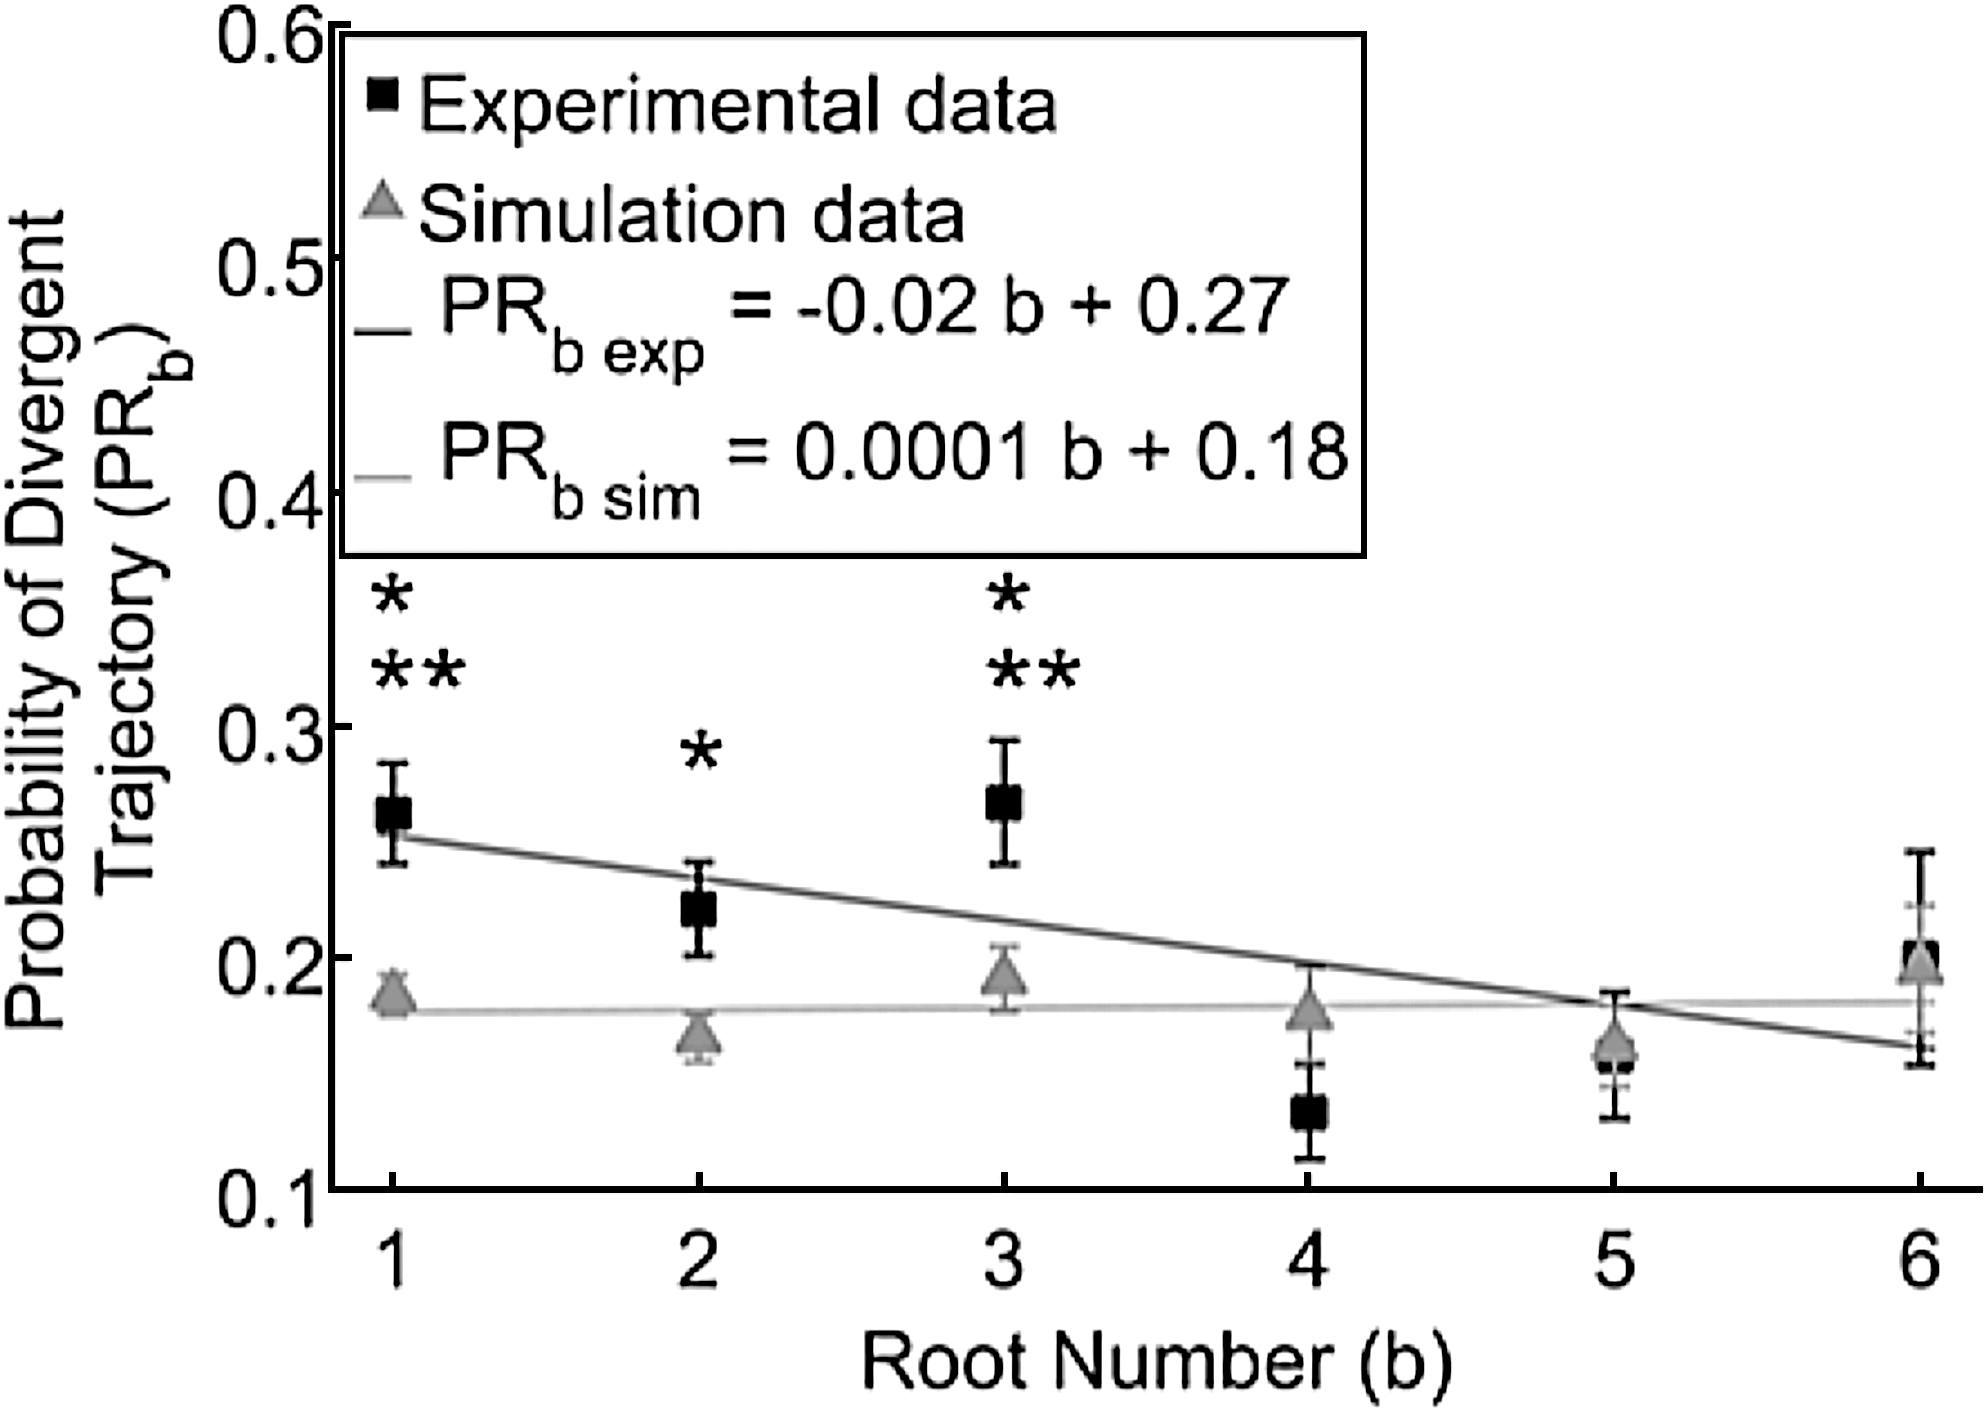
Probability of neurites choosing a divergent instead of a straight trajectory for the first six roots showed a linear tended for experimental and simulated data. Experimental (black squares) and simulation (gray triangles) data fit within the predicted 95% confidence intervals of their respective linear curves. Experimental PRb was significantly larger for the labeled b when compared to b=4 (unpaired two-tailed t-test, *p<0.05, n=20). In addition, experimental PRb was significantly larger for the labeled b when compared to b=5 (unpaired two-tailed t-test, **p<0.05, n=20). Similar results were found using a multiple comparison test with Tukey's least significant difference procedure along a 95% confidence interval. Error bars are SEM.
Comparison of experimental neurite preference measured from 2D bulk and z-stack areas
Two different neurofilament area measurements, 2D bulk and z-stack, were compared for PFb and PRb to validate whether the 2D bulk area accurately captured the experimental neurite preference along the multiple root pattern. Neurite root preference was observed to decrease exponentially with increasing b for both 2D bulk, PFb 2D , and z-stack, PFb Zstack , area measurements (n=5), as shown in Figure 11A. Both area measurements fit significantly to exponential curves (PFb 2D , r2 =0.95, and PFb Zstack , r2 =0.94) and the coefficients, α and β, for both exponential curves, overlapped within 95% confidence intervals of each other. PFb for b=4 and 6, however, differed significantly when comparing different area measurements (paired two-tailed t-test, p<0.05, n=5), as shown in Figure 11A. On the other hand, PRb did not significantly differ when comparing different area measurements for all b (n=5), as shown in Figure 11B.
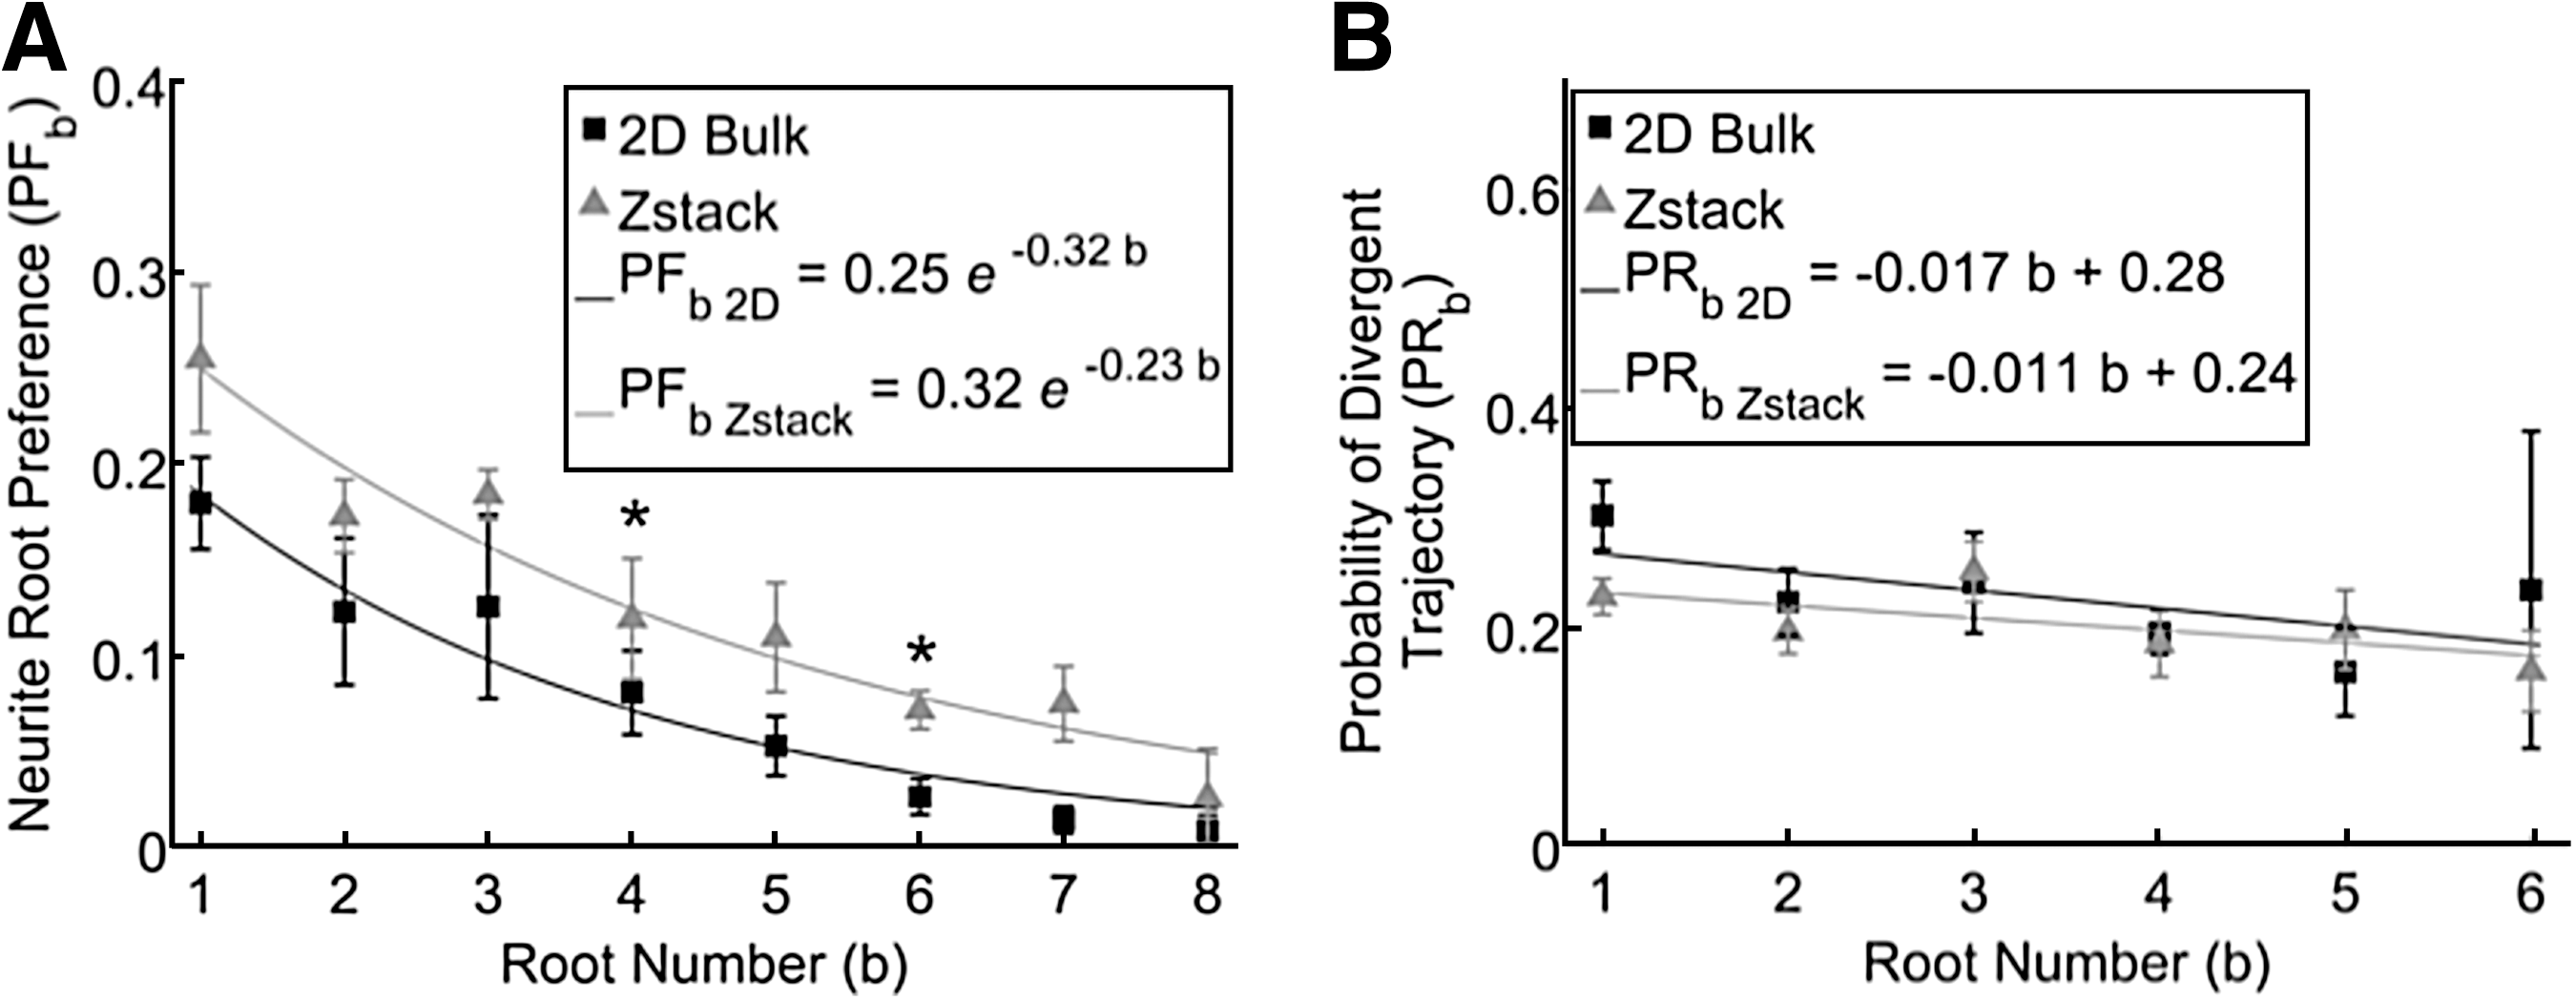
PFb
and PRb
were compared along all root numbers for two different area measurements: 2D bulk and z-stack.
Neurite fasciculation
Neurite bundle caliber at the root entry was measured to quantify if there was a trend of decreasing fasciculation (i.e., smaller axon widths) for increasing b in vitro. Fasciculation was observed within the first roots encountered along the primary channel from time-lapse data (data not shown), indicating that neurites grew over each other. In addition, neurofilament binary images showed that neurites had 2–3 times larger calibers for roots closer to, than for roots farther from, the entry of the primary channel. The maximum width of these bundles was observed to decrease in roots farther up the pattern, as shown in Figure 12 inset. For example, maximum bundle width significantly decreased for b=1 and 3 when compared to the next root number (unpaired one-tailed t-test, p<0.05, n=20), as shown in Figure 12 inset. In addition, as shown in the main plot of Figure 12, the average number of neurite bundles, Fb , at the root entry remained at one or more until the fifth root (b<5), where no bundles (average number of neurite bundles ≤1) were observed (n=20 replicates).

Fasciculation was established by measuring the width of neurofilament-stained axons at the entry of all roots. The maximum bundle width (inset) and average number of bundles (main plot) both decreased with distance from the explant. Maximum bundle widths (inset) are significantly larger for the labeled b when compared to the next root number (unpaired one-tailed t-test, *p<0.05, n=20). Similar results were found for a multiple comparison test using Tukey's least significant difference procedure along a 95% confidence interval. Error bars are SEM.
Discussion
Bulk neurite area measurement to examine neurite root preference
We examined neurite root preference on a micropattern with multiple roots by estimating the number of neurites in each root from a bulk measurement of neurofilament area. This measurement allowed us to avoid the intrinsic difficulties of counting overlapping neurites. Neurofilament area was selected as an appropriate marker for mature neurites and used to estimate neurite root preference at a fixed time point (3–4 days). In addition, the neurofilament stain allowed us to estimate the number of fasciculated neurites (Honig et al., 1998; Snow et al., 2003), and distinguish between single or bundled neurites at the root entry.
Two alternative approaches, time-lapse microscopy and staining of the growth cones, were also attempted to quantify neurite root preference. Both approaches, however, yielded unreliable results. For example, time-lapse microscopy of explants allowed us to see neurites as they entered a root. But because of overlapping neurite trajectories, we found that some growth cones traveled up a pioneer axon or bundle of axons undetected. This was indicated by temporary expansions in the bundle width coinciding with filopodial projections. Additional investigations were attempted using dissociated cultures in place of intact explants, to reduce the density of neurites and permit accurate counting. But time-lapse images revealed constantly moving cell bodies that interfered with our ability to detect where a given growth cone originated, and hence how many roots a given neuron passed. Another approach was to count the number of growth cones within a root stained with phalloidin, which identifies F-actin. These stains, however, prevented us from discerning single neurite tips, because growth cones fasciculate and also grow on top of each other.
Comparison of in vitro and in silico neurite root preference
We compared simulated and experimental neurite root preference, by normalizing the total neurofilament area within each root relative to that of all roots. Both simulated and experimental data fit to an exponential curve. This was expected for the simulation because each root entry is independent and neurite motion is stochastic. In experiments, however, the same conclusion was unpredictable since neurite trajectories are often modified by other previous neurites' outgrowth through neurite–neurite interactions (Wiencken-Barger et al., 2004). Nevertheless, our data indicate that these neurite–neurite interactions (Hentschel and van Ooyen, 1999) have a negligible effect on the exponentially decreasing neurite root preference measurement, as shown in Figures 9 and 11A.
Whereas the fraction of total neurofilament area helped to validate similarities between the simulation and experimental data, the measurement also assessed the distance neurites traveled into each root. Therefore, a new experimental measurement of neurite root preference was calculated that removed the distance biasing by measuring neurofilament area within a fixed distance into each root (Fig. 2 inset). As this experimental measurement approximates neurite root preference, it was compared to the fraction of neurites that enter each root relative to the total number of neurites that enter all roots in the simulation. The simulation's neurite root preference was recalculated in exactly the same way as the experimentally measured neurite root preference, to examine if the proportion of neurite number is correlated to proportion of neurite area. We found that both measurements of neurite root preference, based on neurite area and neurite number, were not different and fit to exponential curves (r2 >0.98) shown in Figure 13. In addition, parameters from exponential fit curves overlapped within 95% confidence intervals of each other, demonstrating that the normalized area is significantly correlated to proportions of neurite number.
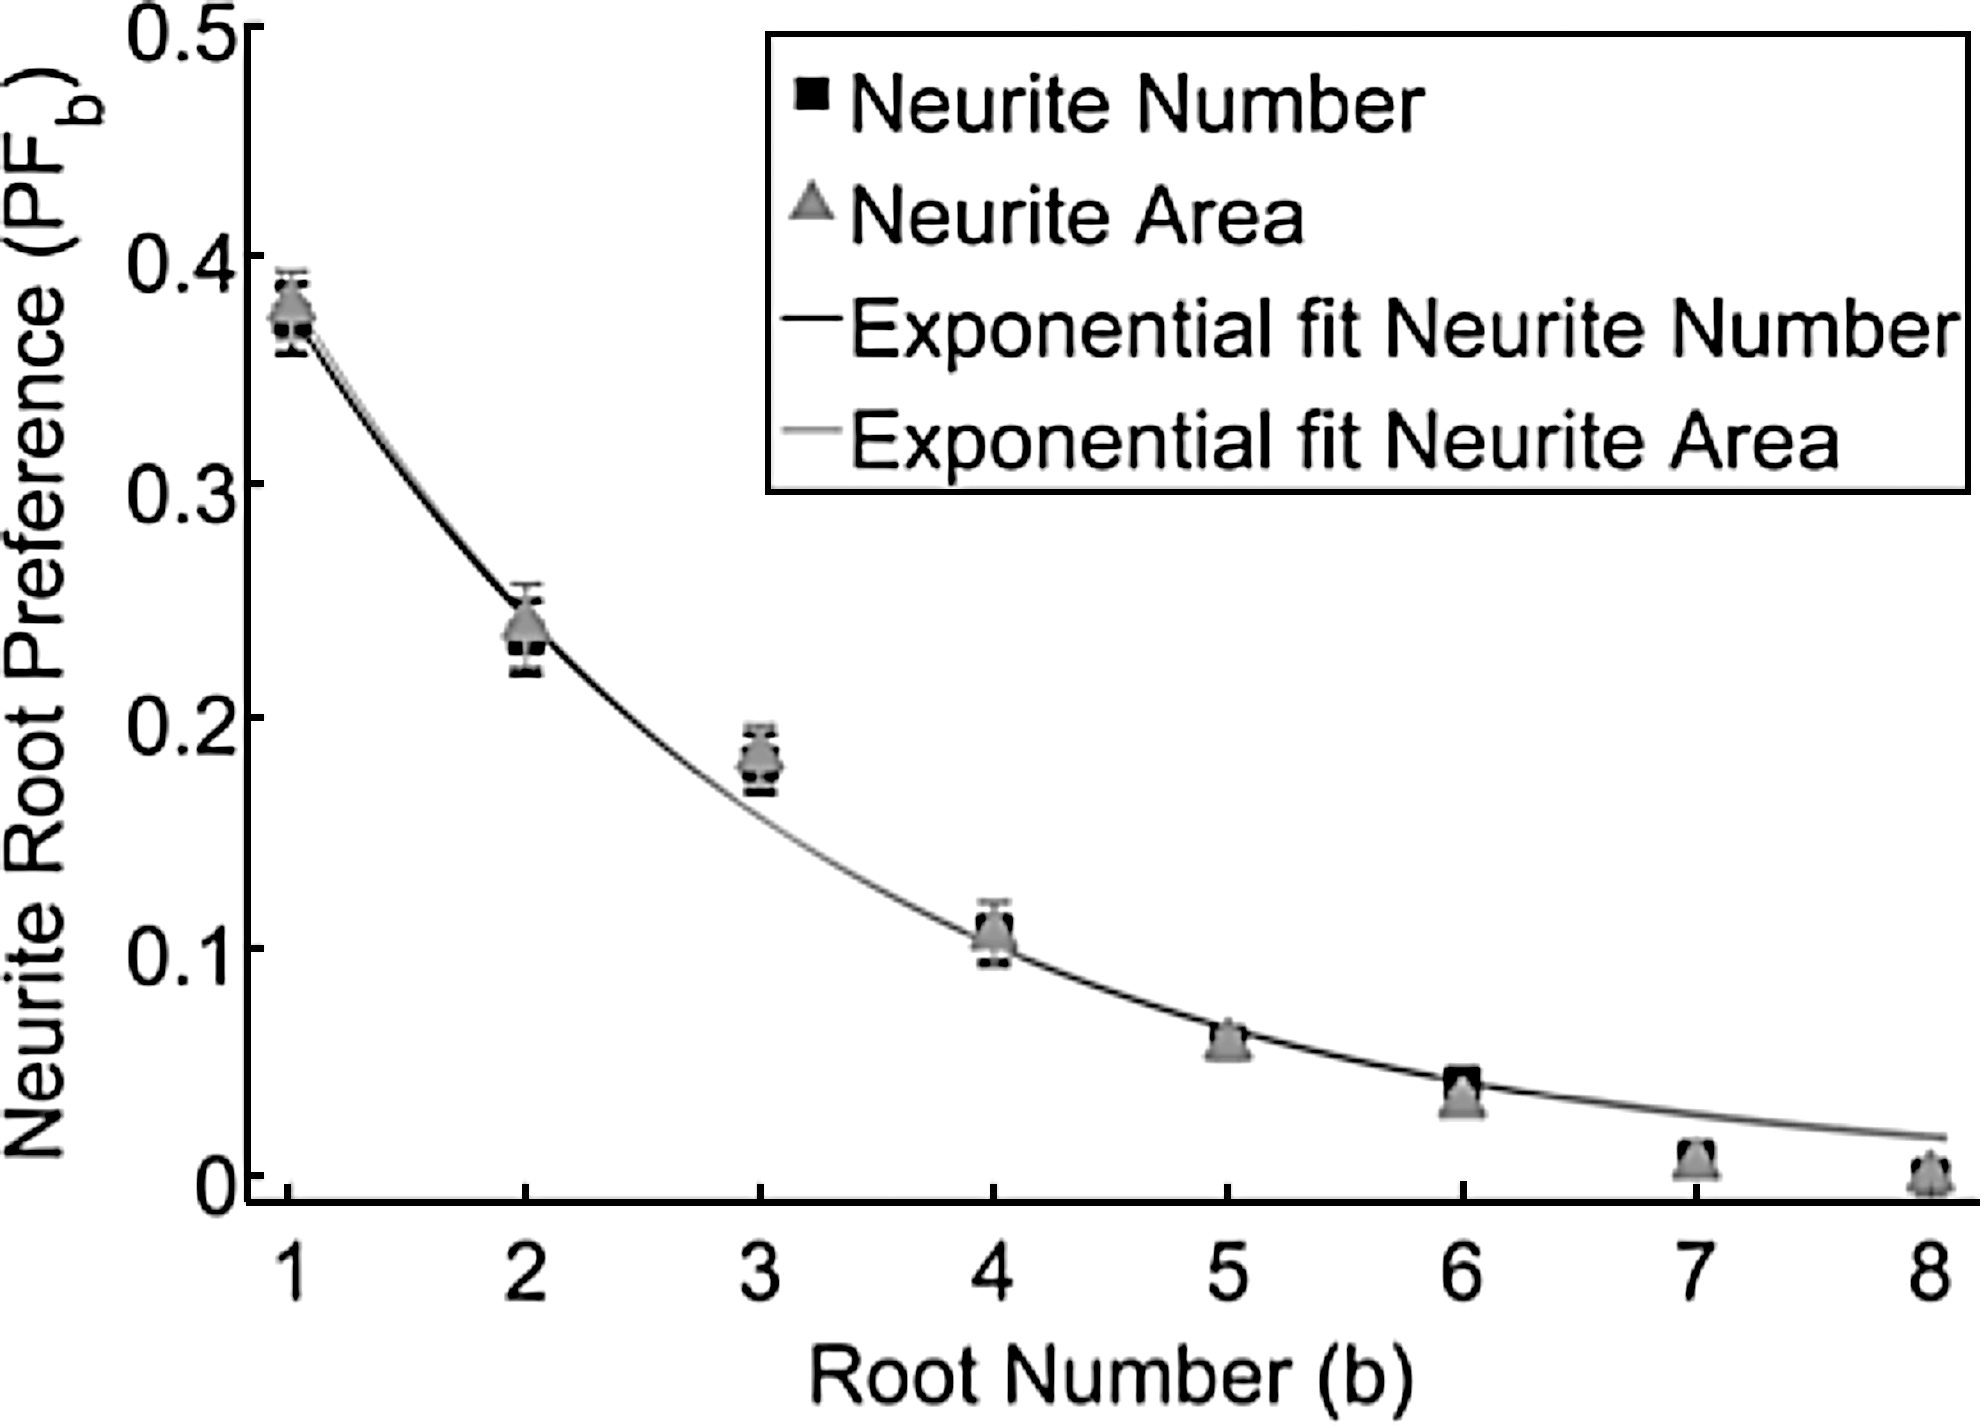
Two different neurite root preference measurements were compared in the simulation. Measurements were based on neurite area 130.5 μm up each root (gray triangle) whereas the other is based on neurite number (black squares). Data from both measurements fit to similar exponential curves (r2 >0.98) within a 95% confidence interval and were not significantly different for all root numbers (unpaired two-tailed t-test, p<0.05). Error bars are SEM.
Comparison of in vitro and in silico neurite trajectory preference
Given the strong correlation between the experimental neurofilament area and the simulated number of neurites entering a root, the simulation's neurite trajectory preference was calculated using the fraction of neurites that choose a divergent over a straight trajectory. These data allow us to determine the likelihood that neurites reach and enter different roots by combining the calculated probabilities for a neurite to avoid (PLb ) or enter (PRb ) a root (b). For example, to ensure that a neurite enters b=2 (a nearby root) the neurite must avoid the first root (PL1 ) and then enter the second root (PR2 ). This possibility carries the probability p=(0.74)(0.22)=0.16 based on in vitro data. On the other hand, for a neurite to enter b=6 (a more distant root) the neurite must avoid the first five roots (PLb for b=1 through 5 inclusively) and then enter the sixth root (PRb ), which has combined probability p=0.06 based on in vitro data. These examples show how the likelihood of a neurite entering a distant root can be significantly less than the likelihood of its entering a nearby root.
In addition, this new measurement allows us to examine the similarities between simulations and experiments by examining the hypothesis that PRb is similar for all roots and independent of root distance from the explant. We showed in Figure 10 that simulated probabilities of neurites entering roots were, as expected, independent of distance from the explant, b, whereas experimental probabilities decreased for increasing b. This finding indicates a discrepancy between simulations and experiments, which may be associated with experimental sources of variability.
To limit experimental variability, multiple experiments were repeated and only those experimental replicates whose furthest neurite reached roots 6 through 9 were used in our analysis (26/36). In addition, some experiments exhibited neurites that were raised out of the focal plane of the microscope, presumably because of neurites lifting off of the substrate. These replicates were discarded to avoid inaccurate calculations of neurofilament area (5/36). Anomalous samples in which neurofilament left the primary channel or the roots were likewise omitted, to further reduced variability in the samples (7/36).
Simple statistical fluctuations may account for the minor differences that persist between simulations and experiments. In addition, systematic variations caused by experimental effects such as fasciculation, that were not included in the simulation, may explain this discrepancy. In vitro neurites were observed to fasciculate in the primary channel, which might inhibit neurites from diverging to explore roots (Bentley and Keshishian, 1982). Fasciculation can also increase the rigidity of the axon bundle (Rutishauser and Edelman, 1980), which may be a result of the stiffness of microtubules (Dent and Gertler, 2003), and indirectly decrease the likelihood for a neurite to bend or wander into a root. Whether this would produce a bias favoring exploration along the primary channel instead of a root is uncertain. Future simulations that incorporate fasciculation will help in examining how neurite fasciculation affects guidance in these complex geometries.
Fasciculation decreases probability for neurites to reach distal roots
To determine where fasciculation is prevalent in vitro, the width of axon bundles at each entry point was measured. As bundle width diminishes with distance from the explant, it follows that more neurites fasciculate—presumably because more neurites are present—nearer to the explant than farther from it. To determine whether a root contained single neurites, we measured the number of connected pixels ≤1 μm in width. We found that single neurites occupy roots 5 through 8 on average after 3–4 days of incubation, as shown in Figure 12. In addition, significant changes in PFb and maximum bundle width at b=1 and 3 indicate that other unknown phenomena may be occurring between these and subsequent neighboring roots (Voyiadjis et al., 2011).
Since our in vitro cultures have a heterogeneous cell population (neurons, Schwann's cells, and satellite cells) (Bernardini et al., 1998), bundling in culture may also be a result of Schwann's cells' wrapping around multiple neurites (Corfas et al., 2004). Specifically, non-neuronal cells tend to migrate and proliferate along existing axonal tracts in the peripheral nervous system (PNS) and modify the pattern of fasciculation based on the rate of non-neuronal cell migration along the axons. Following staining with both phalloidin (a marker for growth cones and non-neuronal cytoskeleton, F-actin) and nuclear stain DAPI, we observed non-neuronal cells along the axons mainly at the entrance of the primary channel and proximal roots. This further demonstrates that other factors may be influencing guidance and/or reorganization of neurites in the early roots.
Future studies
In future studies, we plan to modify the pattern or add factors that affect neurite fasciculation and guidance to develop neurite guidance strategies in complex micropattern geometries. Because fasciculation, as well as defasciculation, is important in developmental pathfinding (Fambrough and Goodman, 1996; Wiencken-Barger et al., 2004; Zipser et al., 1989) understanding it will help with future neuronal repair strategies. In addition, the influence of non-neuronal mitotic cell proliferation in our culture may have affected the levels of bundling. This can be reduced by using an anti-mitotic agent such as mitomycin C for Schwann's cells, to examine if these cells can affect guidance at the roots in vitro (Enver and Hall, 1994; Kleitman et al., 1998). In future work, fasciculation's influence will also be minimized by adding factors known to influence fasciculation. Therefore, we plan to repeat these experiment with soluble defasciculating agents such as anti-G4/L1, polysialic acid (PSA) mimotope cyclic peptide (p1 or p2), or colominic acid (PSA, analogue) (Honig and Rutishauser, 1996; Honig et al., 1998; Torregrossa et al., 2004) and hope this will shed light on how fasciculation influences guidance in multiple root micropatterns.
Recent success using chemotropic guidance to guide regenerating supraspinal neurites, following SCI, to find their appropriate nearby target in the spinal cord, has provided support for the use of guidance cues in SCI therapies (Alto et al., 2009). These therapies will benefit greatly from the development of in vitro models that examine the influence that guidance cue concentration has on neurite guidance at nearby decision points (Ryan et al., 2006; Wittig et al., 2005). The different roles that both chemical and contact cues play in the relative guidance of neurites to distant or nearby targets, however, are still unknown. Because of the multiple different systems and complex organization that are present in the spinal cord, a single guidance strategy cannot serve the functional needs of a regenerating spinal cord. For example, if regenerating neurites follow roots readily they cannot reach distant targets; on the other hand, if they bypass the first roots encountered then they cannot enter nearby roots. Therefore, we must develop and test therapeutically applicable guidance strategies using multiple guidance cues. Currently, we are working on placing non-permissive cues to improve neurite guidance to target roots at different distances along the pattern. Therapies aimed at guiding regenerating peripheral neurons to a specific target following an injury, i.e., preferential motor re-innervation (Brushart, 1988; Madison et al., 1996), can also benefit from using similar computational simulations to optimize guidance strategies through assessment of targeting success rates in complex geometries.
Conclusions
We have examined neurite outgrowth patterns on micropatterns that present growing neurites with multiple diverging roots. Both in silico and in vitro models indicate that the probability of neurites entering a root decreases exponentially with the distance from a neurite's initiation along a pattern with multiple roots. This implies that future regenerative therapies are exceedingly unlikely to produce viable connections, especially to distant targets, even once CNS growth inhibitors have been overcome. We argue, therefore, that systematic study of the effects of new guidance strategies, for example using judicious application of inhibitory cues at unwanted nearby spinal roots, or attractive cues at desired distant roots, will be needed to establish functional recovery following SCI. In principle, this can be done through multiple trial-and- error animal studies, but in practice such studies would be significantly accelerated through direction provided by experimentally validated computational models. The simulation discussed here is a first prototype of such a model. Through embellishment to include important effects such as fasciculation and responses to guidance cues, each validated step by step by comparison with experiment, we hope that a reliable simulation may inform future therapeutic approaches.
Footnotes
Acknowledgments
This work was supported by the New Jersey Commission on Spinal Cord Research (NJCSCR) Grant 06-3055-SCR-E-0, Fellowship 07-2929-SCR-E-0, and National Science Foundation ARRA-CBET0846328. We thank Drs. J. Zahn, K. Uhrich, M. Yarmush, R. Schloss, and the Rutgers W.M. Keck Center for Collaborative Neuroscience Center for use of their equipment and for helpful suggestions. In addition, we would like to thank Jonathan Chappelow for his helpful discussions on image processing.
Author Disclosure Statement
No competing financial interests exist for any of the authors.