




Abstract
Cervical myelopathy is caused by chronic segmental compression of the spinal cord because of degenerative changes of the spine. However, the exact mechanisms of chronic cervical cord compression are not fully understood. The purpose of this study was to validate a new animal model of chronic cervical cord compression capable of reproducing the clinical course without laminectomy in rats. A polyethylene line attached to a plastic plate was fastened with three turns around the vertebral body of C4 in 1-month-old rats. After surgery, the polyethylene line grows deeper into the dorsal wall of the spinal canal along with the growth of the spinal canal and vertebral body, producing a gradual compression of the spinal cord. The results show that this cervical canal stenosis (CCS) model in rats caused motor deficits and sensory disturbances 9 months after initiating CCS; however, no clinical manifestations took place until 6 months. The intramedullary high-intensity area on T2-weighted images was observed in 70% of the CCS model rats at 12 months after initiating CCS. In histological sections, the spinal cord was compressed along the entire circumference at 12 months after initiating CCS. The number of ventral neurons was decreased, and the white matter showed wallerian degeneration. This model might reproduce characteristic features of clinical chronic cervical cord compression, including progressive motor and sensory disturbances after a latency period and insidious neuronal loss, and represents chronic compression of the cervical spinal cord in humans.
Introduction
Methods
Animals
The experiment was carried out under the guidance of the local animal ethics committee in accordance with the guidelines on animal experiments in our university, Japanese government animal protection and management law, and Japanese government notifications on feeding and safe keeping of animals. Experiments were conducted on 27 male Sprague-Dawley rats (Clea, Tokyo, Japan), aged 3 weeks with a mean body weight of 51.0±1.1 g (mean±standard deviation [SD]). The animals were housed in conditions with controlled temperature (23±1°C), humidity (55.0±5 %), and lighting (on from 07:00 h to 20:00 h); while being allowed free access to water and food.
Production of the cervical canal stenosis model
Before surgery, the animals were kept in their cages for 1 week for adaptation to the environment. The animals were anesthetized with an intraperitoneal injection of 35 mg/kg sodium pentobarbital (Nembutal, 50 mg/mL; Abbott Laboratories, North Chicago, IL). Each animal was placed in the prone position on a heated plate (HM-300; Yamato Co., Ltd., Tokyo, Japan), and surgery was performed in a strictly aseptic manner. Body temperature was maintained at 37°C, and blood pressure in a tail artery was monitored by a non-invasive monitor (MK-1030; Muromachi Kikai Co., Ltd., Tokyo, Japan), to maintain constant physiologic levels during surgery. A longitudinal skin incision was made over the spinous process of C4, and bilateral paravertebral muscles were dissected bluntly from the lamina. Both laminae were exposed, and bilateral C4 and C5 roots were identified and dissected under a microscope. Then the spinous process of C4 was resected, and decortication of the laminae was performed. The left C4 root was retracted laterally and a polyethylene line (Tole Co., Tokyo, Japan) was passed ventral to the vertebral body of C4 and fixed to a plastic plate (1×2×0.5 mm) against the ventral aspect of the vertebral body of C4, and was then fastened with three turns (Fig. 1A and B). In this model, the polyethylene line grows deeper into the dorsal wall of the spinal canal due to the growth of the spinal canal and vertebral body, thus gradually compressing the spinal cord (Fig. 1C and D). The control animals were only subjected to dissection and exposure of the laminae of C4 and C5, but were not fastened. The control (n=10) and model rats (n=10) were kept for 12 months in the laboratory conditions described above.
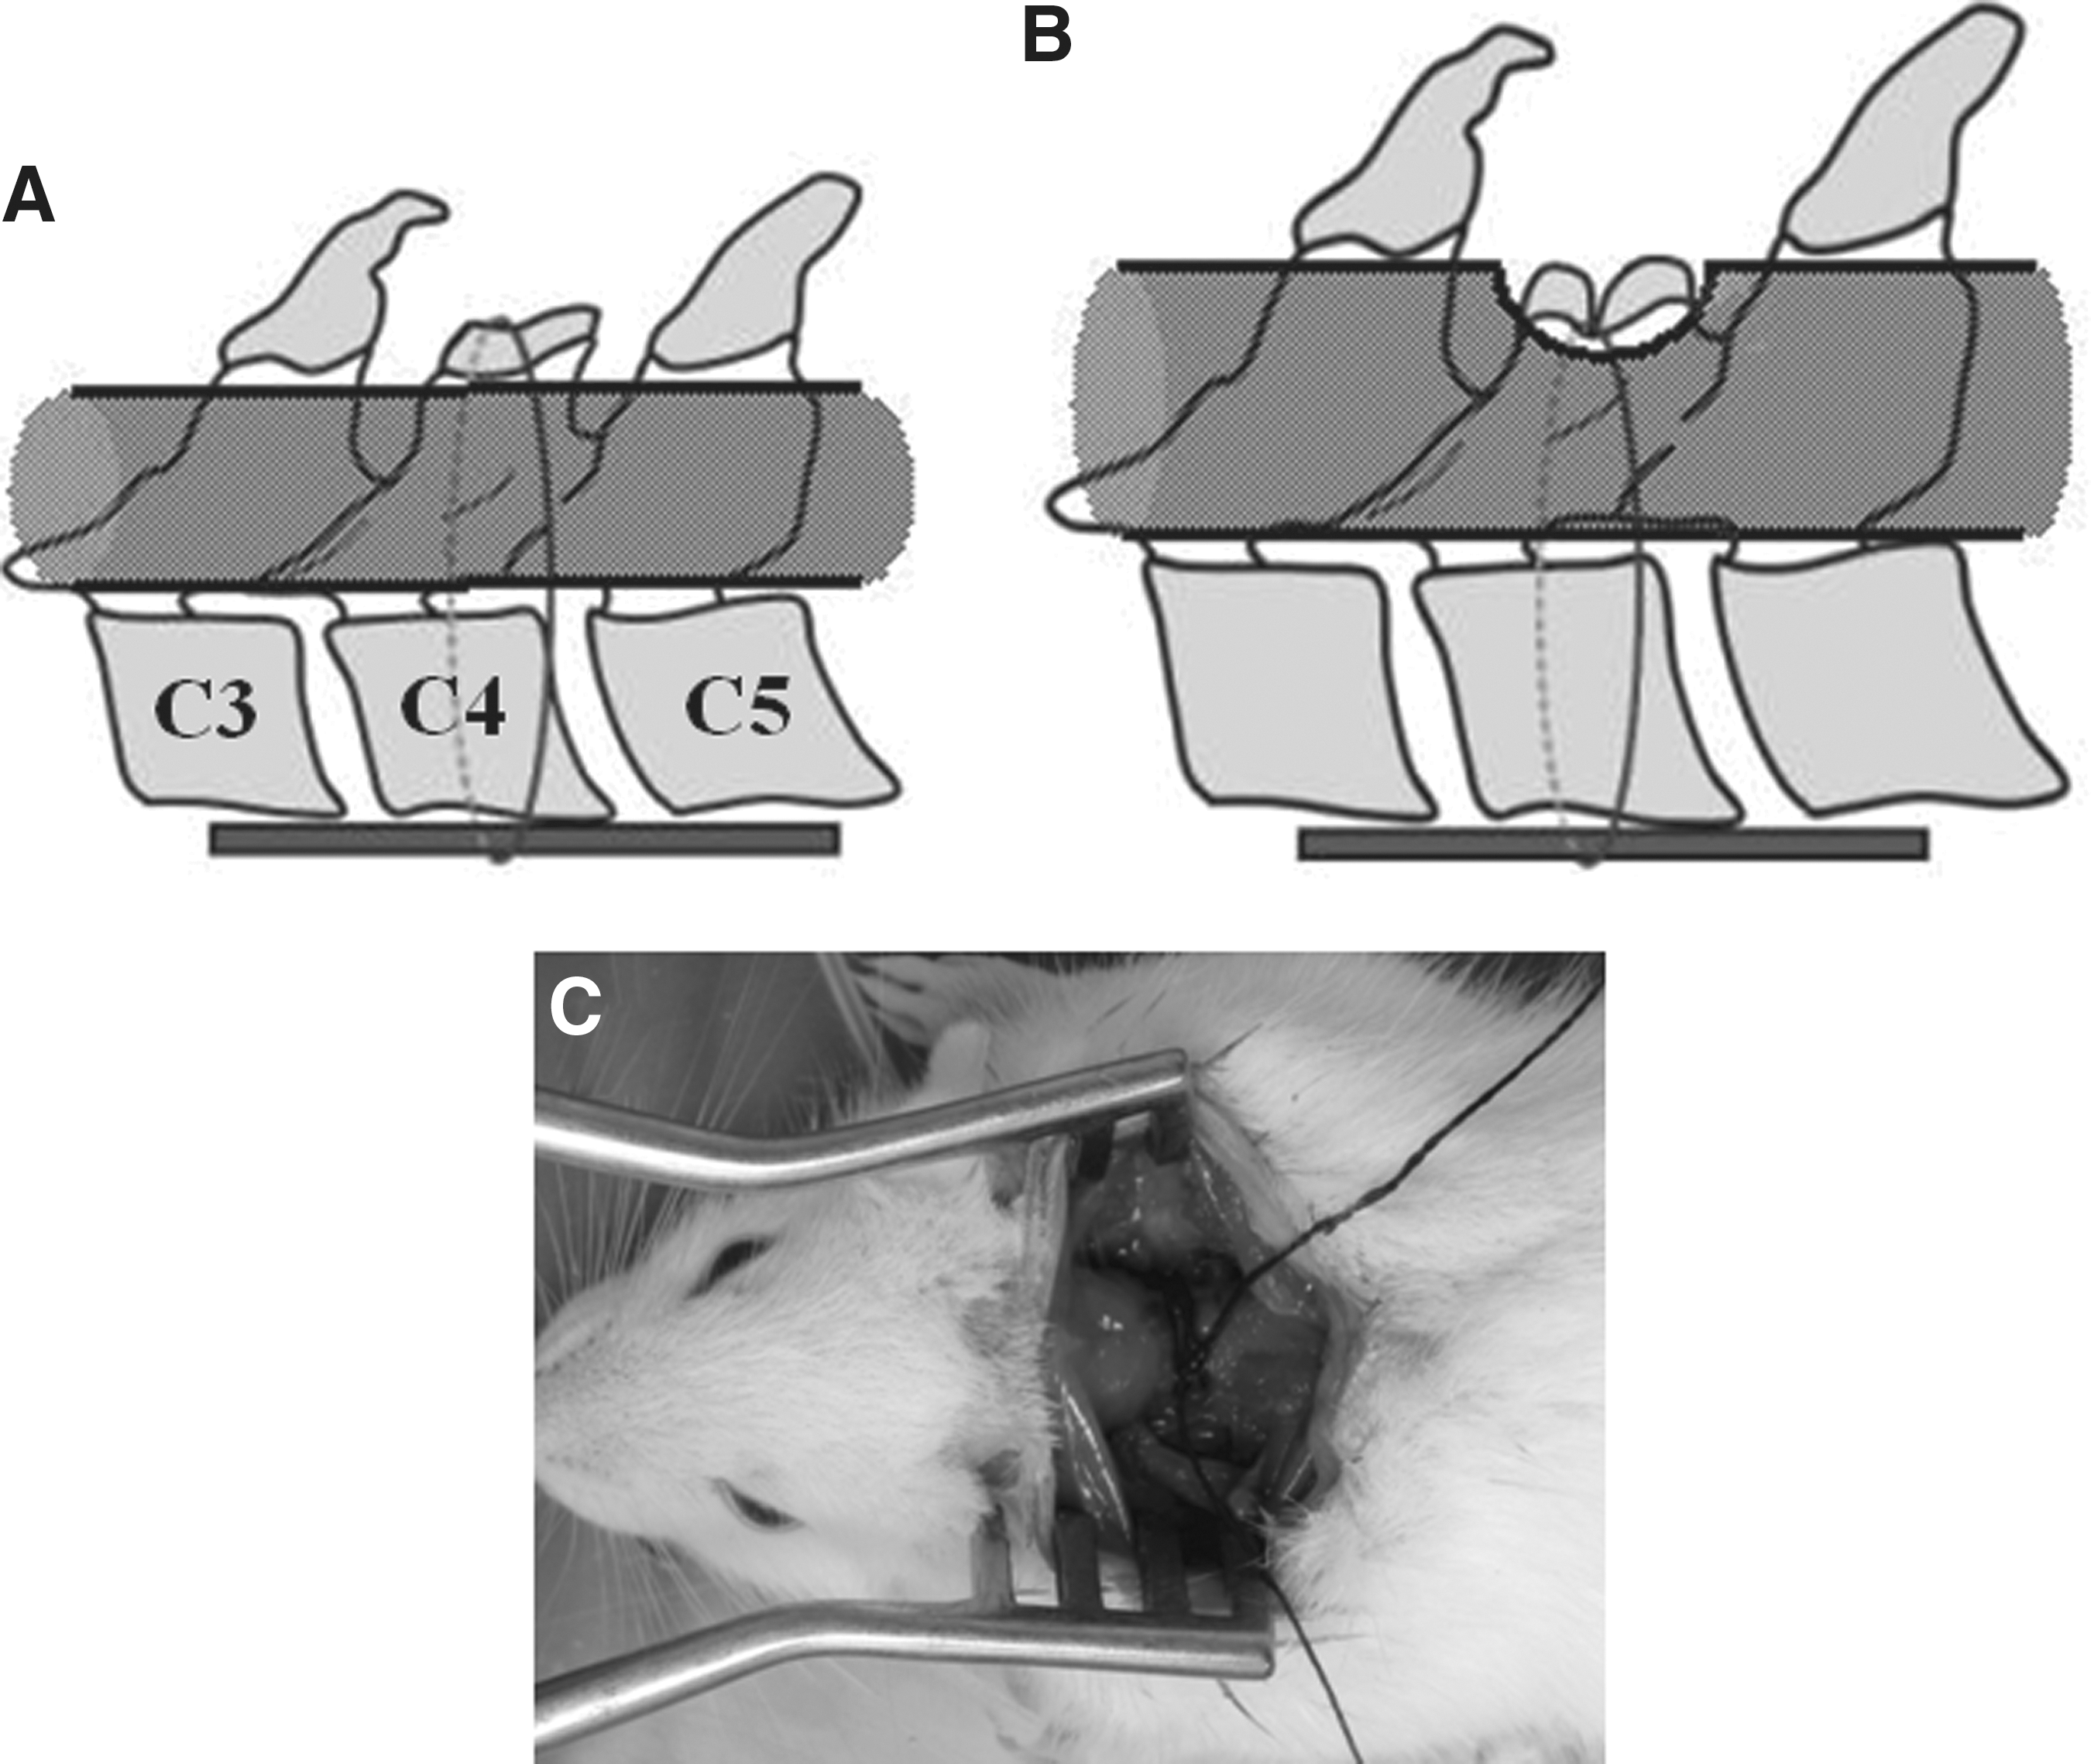
(
Neurological assessment
Basso, Beattie, and Bresnahan rating scale
Neurological motor function in each group were assessed at 1, 3, 6, and 9 days, and 12 months after surgery using the Basso, Beattie, and Bresnahan (BBB) locomotor rating scale (Basso et al., 1995). The BBB is based on locomotor ability following experimental spinal cord injury. Briefly, the BBB is a 21-point ordinal scale ranging from 0 (no discernible hindlimb movement) to 21 (consistent and coordinated gait with parallel paw placement of the hindlimbs and consistent trunk stability). Scores from 0–7 rank the early phase of recovery, with return of isolated movements of three joints (hip, knee, and ankle), scores from 8–13 describe the intermediate recovery phase, with return of paw placement, stepping, and forelimb-hindlimb coordination, and scores 14–21 rank the late phase of recovery, with return of toe clearance during the step phase, predominant paw position, trunk stability, and tail position. Two examiners observed and evaluated the locomotion of each rat in 4-min periods. The neurological examinations took place following a double-blind technique.
Measurement of maximum treadmill speed
Maximum treadmill speed was measured using a treadmill device (MK-680S; Muromachi, Tokyo, Japan). Treadmill speed was started at 5 m/min for 1 min, and after that it was increased by 1 m/min every 5 sec. Measurement was terminated and treadmill speed was recorded when the rat dropped out of the treadmill. A single investigator who was blinded to study group performed the maximum treadmill speed tests.
Sensory assessment
For mechanical sensory assessment, the rats were placed on a flat surface with the trunk lightly restrained by an examiner, and a von Frey filament (100 g) was applied to the dorsal surface of the forepaw and hindpaw. The filament was applied for 10 trials of 3 sec per trial at approximately 3-min intervals. The occurrence of paw withdrawal was expressed as the response frequency (i.e., the number of trials accompanied by paw withdrawal/10×100).
Magnetic resonance imaging study
The MR imaging studies were performed at 3, 6, and 12 months after surgery on a 0.4-T permanent magnet (APERTO Inspire; Hitachi, Tokyo, Japan), with a knee surface coil (9D-knee coil; Hitachi). Sequences included T1-weighted [350/25 (TR/TE)] and T2-weighted spin-echo images [5000/119 (TR/TE)], using a 150-mm field of view (FOV), 5-mm slice thickness, 256×256 matrix, and four excitations. The scan time was 5–6 min. All animals were scanned in the prone position, and the cervical portion was placed in the center of the coil, which was set in the isocenter of the static magnetic field.
The cross-sectional areas and compression ratio of the spinal cord were obtained in T1-weighted axial views passing through the area that received the maximum compression level, using a digitizer with MR apparatus. The compression ratio was obtained as the ratio of the anteroposterior diameter to the transverse diameter of spinal cord (Tarlov et al., 1953). The compression ratio and cross-sectional area of the spinal cord were compared in the control and CCS model rats.
The presence or absence of intramedullary high signal intensity area was examined using T2-weighted sagittal images. The quantitative assessment was performed by determining the signal intensities in the cervical cord using a region of interest (ROI) technique. Signal-difference-to-noise ratios (SDNRs) of all sequences were evaluated for the cervical spinal cord to assess the contrast between the spinal cord and the surrounding tissue of the spinal canal. SDNRs were assessed by separately measuring average signal intensities (mean in the ROI) of the spinal cord and outside the neck in the phase-encoding direction, including ghosting artifacts. The difference between the two values obtained was then divided by the standard deviation of background noise in the same image (Crooks and Ortendahl, 1989; Wolff and Balaban, 1997).
Preparation of histopathological examination
After MR imaging studies, all animals were sacrificed for histopathological examinations. The animals were fixed by intra-aortal perfusion with 4% buffered paraformaldehyde (Nakalai Tecque, Kyoto, Japan). The cervical vertebral column was removed and fixed in the same solution for 1 week. The specimens were then decalcified in 0.5 M ethylenediaminetetraacetic acid (EDTA-2Na; Wako Pure Chemical, Osaka, Japan), and embedded in paraffin using standard procedures. The light microscopy specimens were 600 serial 5-μm-thick transverse sections sliced from the rostral to the caudal end of the C2–C7 segment. Every 10th section was stained with Nissl stain, and photomicrographs were taken covering the whole ventral horn in each of the stained sections.
The motoneurons were identified with large nuclei and well-developed, densely-stained Nissl bodies in the cytoplasm. The nucleus, normally centrally placed, contains a well-demarcated round nucleolus. To obtain a precise count of the neurons without redundancy or discharge, we selected every second 5-μm-thick slice, leaving a 5-μm gap between each slice, based on the following stereological considerations: the characteristic large nucleoli have diameters of approximately 5 μm, and the size is quite uniform (Kitamura et al., 1986); and choosing the slice thickness and interval identical to the diameter (5 μm) of the spherical nucleolus means each section will contain tangential contours of the nucleoli with their centers located within 2.5 μm outside the slice. Thus counting the nucleoli of the motor neurons that appear on a 5-μm slice yields the number of those with the center located within 5 μm on each side from the middle of the slice, thus leaving 5-μm intervals between the sections, meaning that the stereological count avoids omission or redundancy in the number of motoneurons.
Statistical analysis
The data are expressed as average±standard error of the mean (SEM). Statistical analysis of BBB scale scores, maximum treadmill speed, sensory assessment, MR imaging studies, and numbers of motoneurons were performed using a nonparametric test (Wilcoxon's rank sum test) with SPSS statistical software, version 11.0J (SPSS Inc., Chicago, IL). Statistically significant differences were defined as p<0.05.
Results
Postoperatively, the animals were in good, healthy condition and did not develop any infections. The survival rate of control and CCS rats was 76.9% (10/13 animals), and 71.4% (10/14 animals), at 12 months after surgery, respectively. Their body weight increased rapidly, from 51.0±1.1 g (mean±SEM) at surgery, to 481.7±14.7 g (control rats), or to 465.0±19.8 g (CCS model rat), at 3 months after surgery. Afterward, body weight gradually increased in both groups, and the body weight of control and CCS model animals reached 706.7±43.2 g and 679.1±43.9 g at 12 months after surgery, respectively. There were no differences in the course of growth between the two groups.
Neurological outcome
Neurological functions were examined at 3, 6, 9, and 12 months after surgery. At 3 and 6 months after initiating CCS, no rats had signs of myelopathy, and BBB scale scores as well as maximum treadmill speeds were similar for the two groups. Two of 10 CCS model rats had decreased BBB scale scores and maximum treadmill speed at 9 months after initiating CCS, and all animals in the CCS model group developed signs of myelopathy at 12 months after initiating CCS. BBB scores of CCS model rats (17.3±1.6) was lower than those of control rats (20.8±0.4; Fig. 2A and Table 1), and the maximum treadmill speed of CCS model rats (21.7±4.5 m/min), was lower than that of control rats (33.3±3.5 m/min) 12 months after initiating CCS (Fig. 2B and Table 1). In the von Frey filament test, the response frequency of CCS model rats had a similar course to that of control rats until 6 months after initiating CCS, when 3 of 10 CCS model rats developed mild hypesthesia of the forepaws and hindpaws after 9 months. Afterward, all CCS model rats had decreased response frequency of the forepaws (26.0±12.6%), and the hindpaws (21.0±23.8%), at 12 months (Fig. 2C and Table 1).
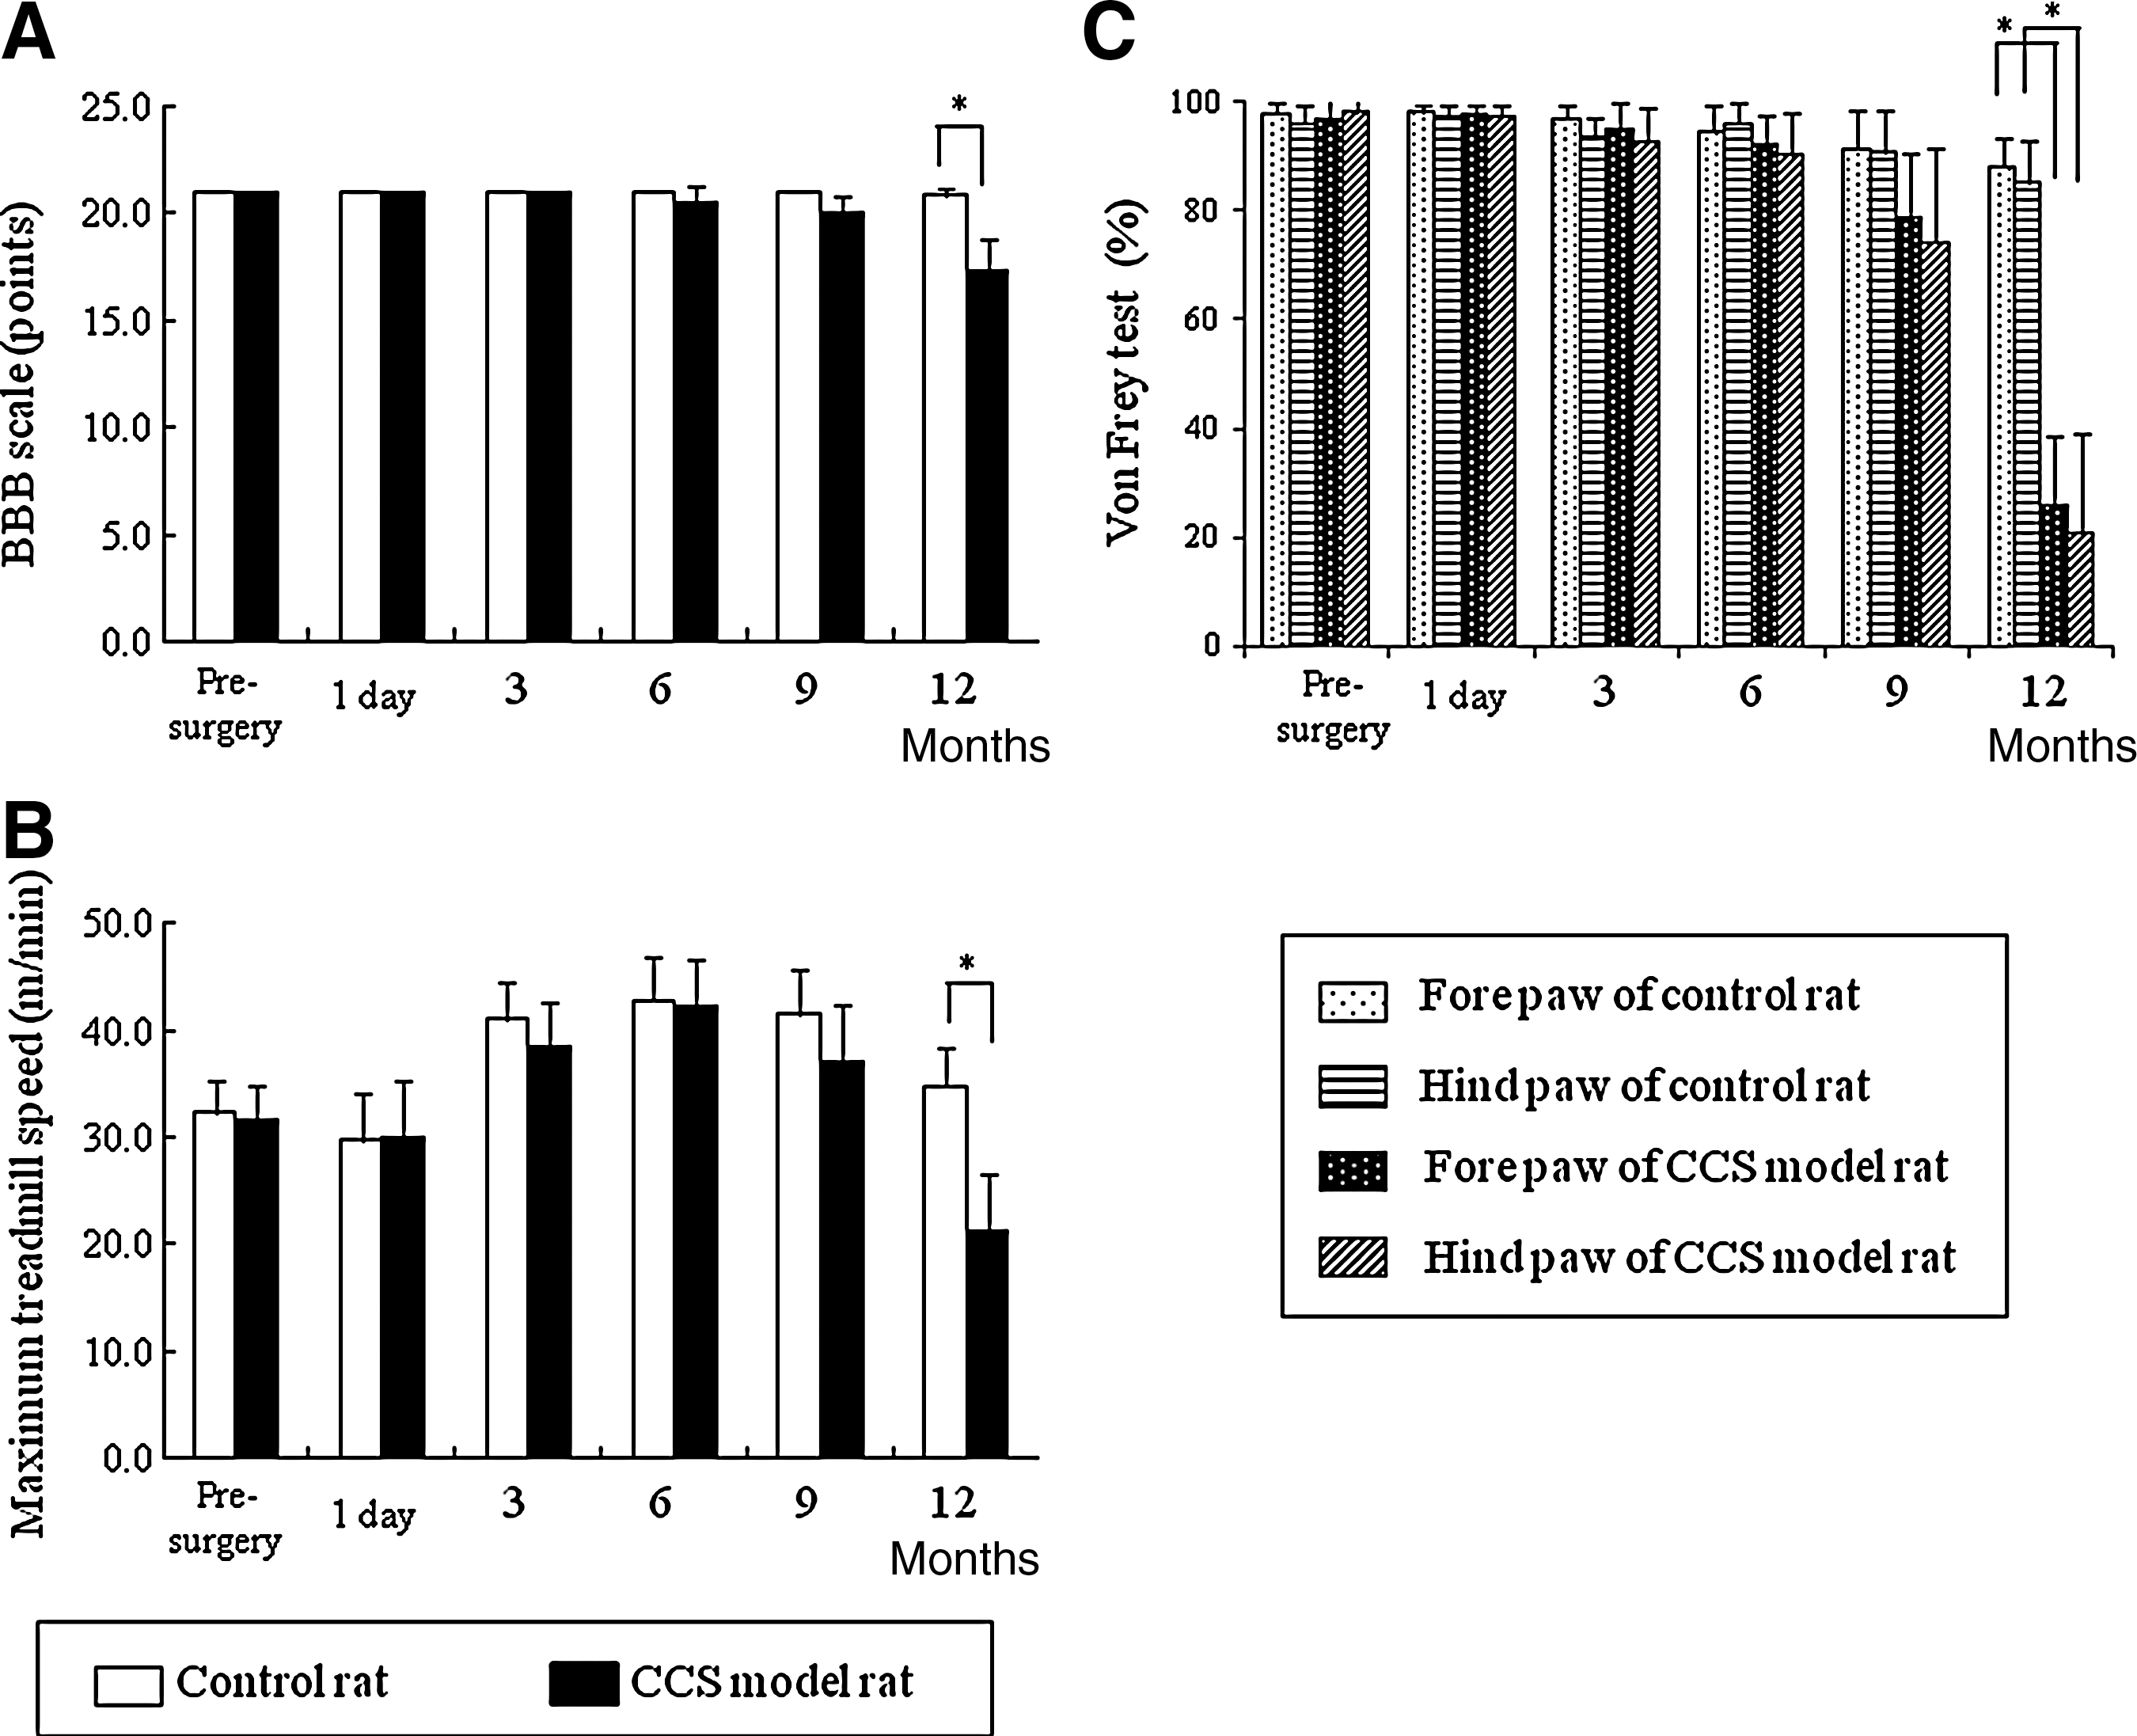
The time course of behavioral assessment from production of the cervical canal stenosis (CCS) model to 12 months later. (
BBB, Basso, Beattie, and Bresnahan locomotor rating scale; SDNR, signal-difference-to-noise ratio; SEM, standard error of the mean.
Magnetic resonance imaging
The MR imaging studies were performed at 3, 6, and 12 months after initiating CCS. On MR imaging, the spinal cords of CCS model animals gradually become flattened from 6 months, worsening up to 12 months after initiating CCS (Fig. 3). The cross-sectional area of the spinal cord obtained from T1-weighted axial imaging also decreased from 6 months after initiating CCS, and it was 9.3±1.6 mm2 after 12 months, which was 74% of the size in control animals (Fig. 4A). The anteroposterior diameter of the spinal cord of CCS model animals was 1.5±0.4 mm, which was about 47% narrower than that of control rats. The compression ratio of CCS model rats was also decreased, to 47.7±6.5% at 6 months after initiating CCS, decreasing to 31.2±7.1% at 12 months, which was significantly different from control rats. The intramedullary high-intensity area on T2-weighted imaging was not observed at 6 months after initiating CCS; however, after 12 months, 7 of 10 CCS model rats presented with it, and the SDNRs of CCS model rats were significantly higher than those of normal control rats after 12 months (Table 1).
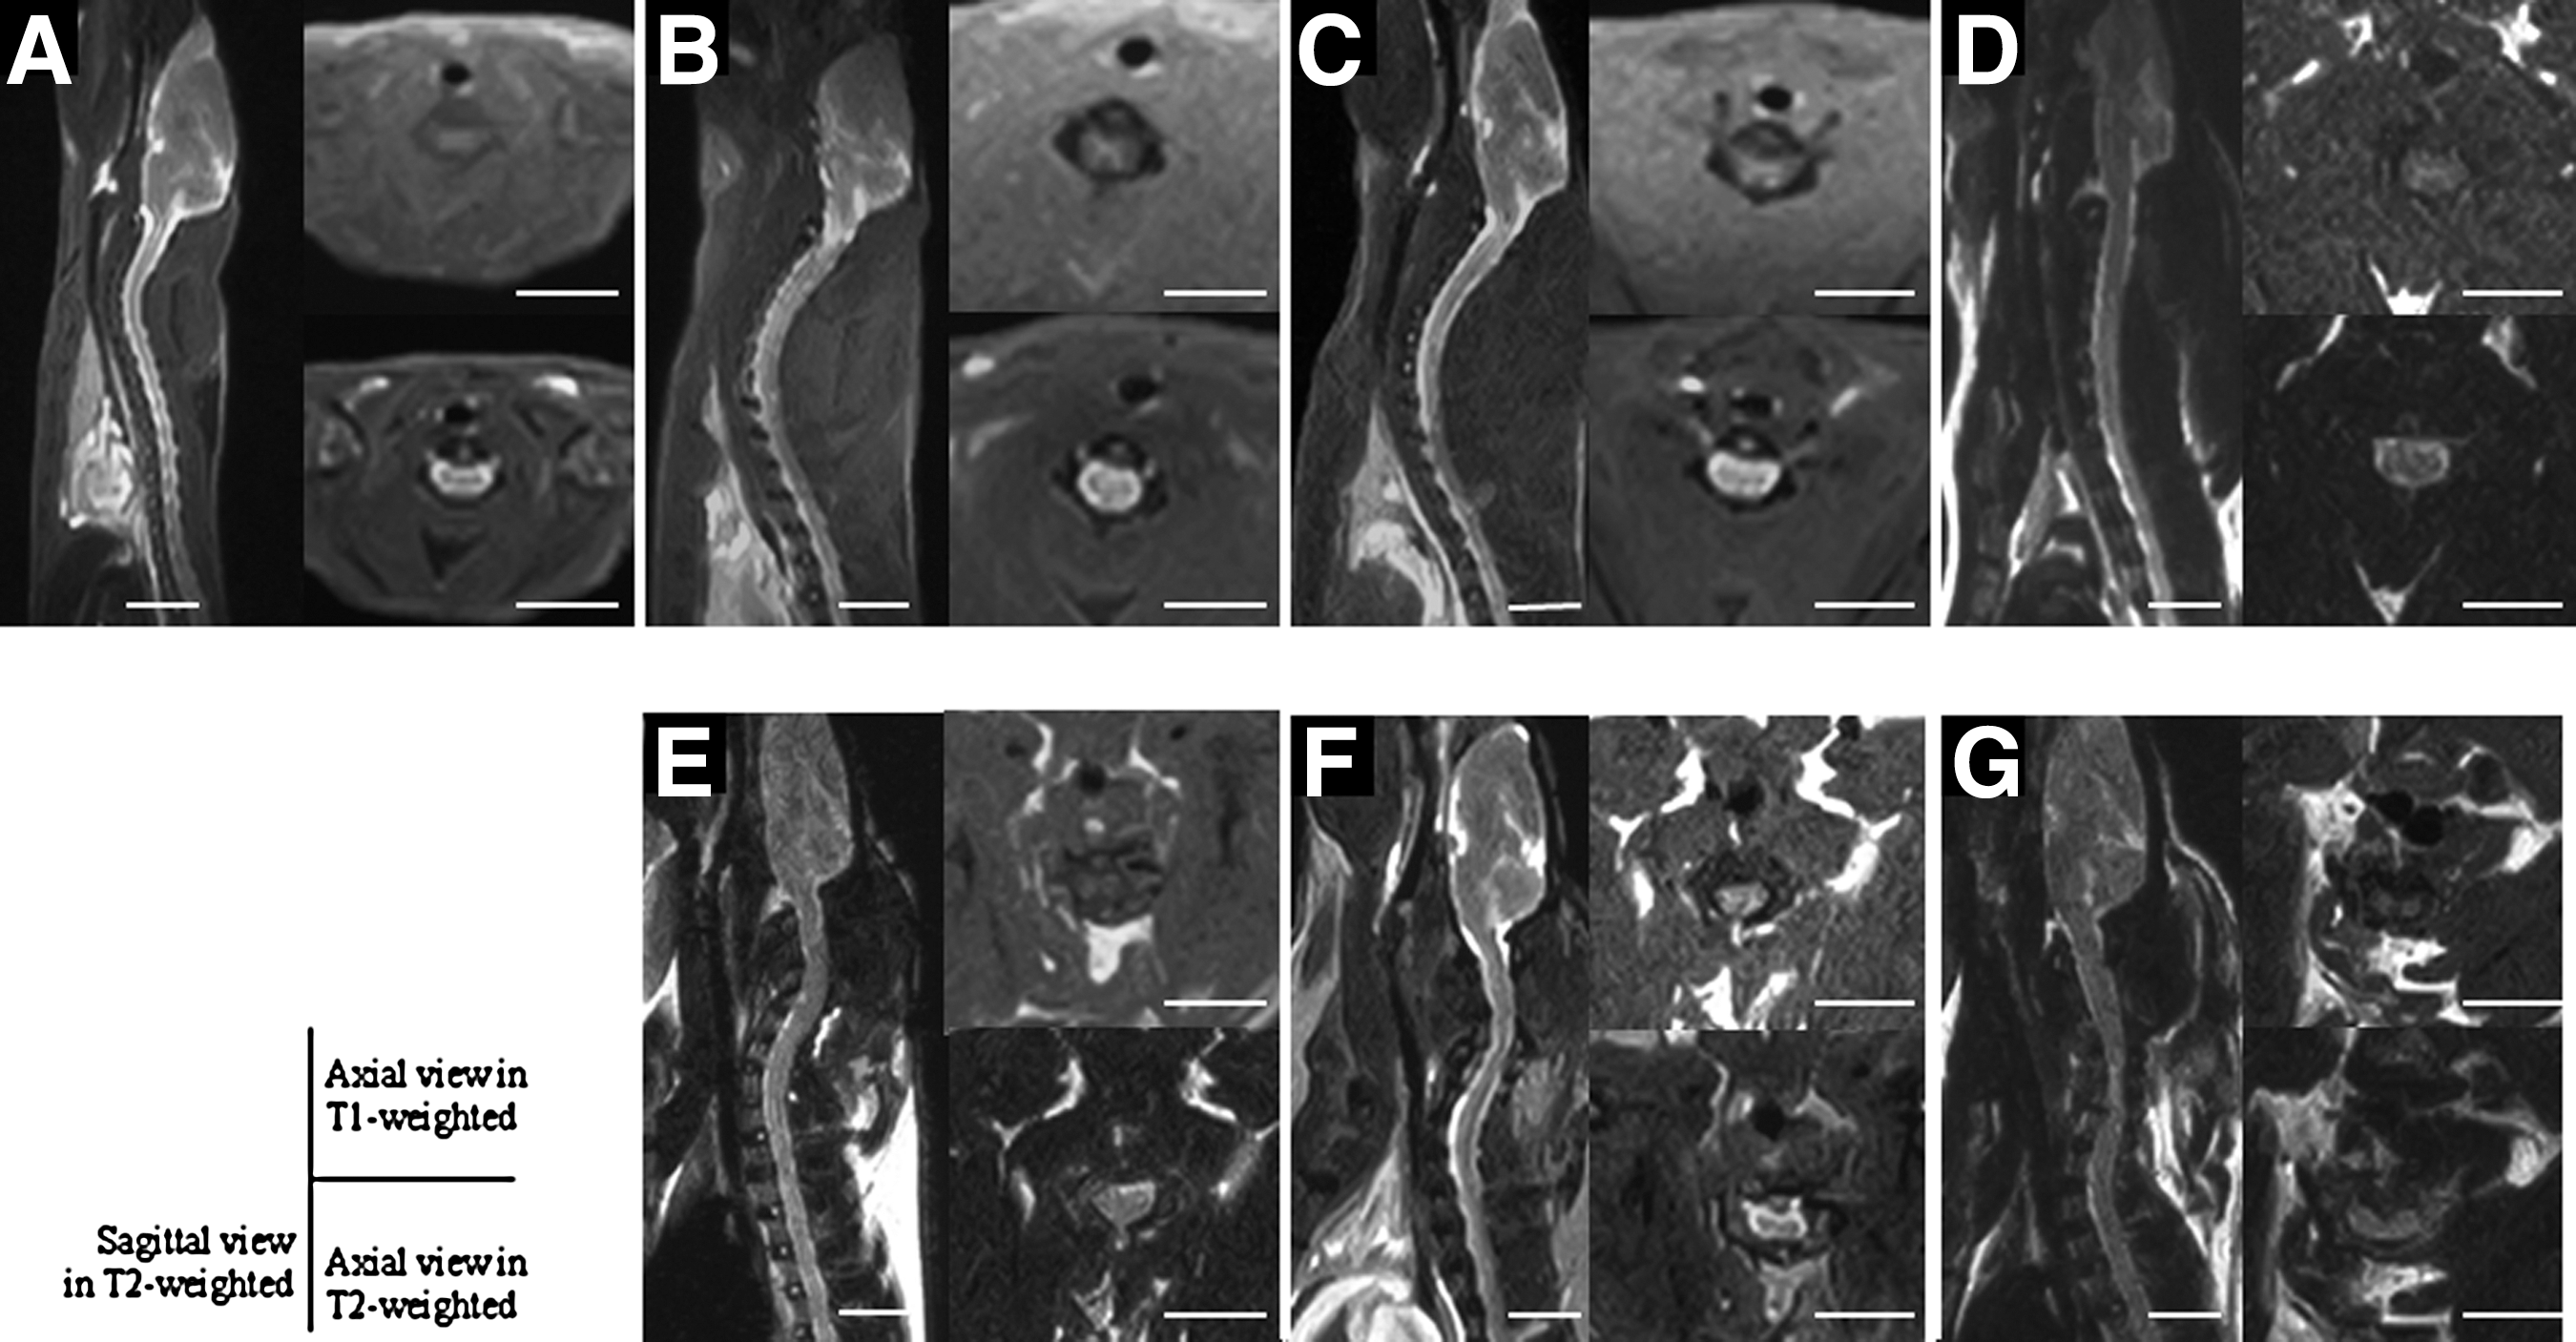
Magnetic resonance imaging of before (

Changes in cross-sectional area (
Histopathological observations
All animals were sacrificed at 12 months after initiating CCS for histopathology. There was no epidural scar tissue such as that seen post-laminectomy in any animal. In the control rats, the spinal cord shape was well preserved, and motoneurons in the anterior columns were identified by their large nuclei and well-developed, densely-stained Nissl bodies in the cytoplasm (Fig. 5A, C, and E). However, in the CCS model rat, the spinal cord was compressed along the entire circumference, where in the gray matter it was associated with flattening of the ventral horn. The ventral neurons were flattened, small, and decreased in numbers of motoneurons (Table 1 and Fig. 5B, D, and F). The white matter showed myelin destruction and spongy axonal degeneration in all CCS model rats. These pathological changes occurred predominantly under the area of compression.

Transverse sections of the spinal cord at the C4–C5 level of control rats (
Discussion
Cervical myelopathy is the most serious consequence of compressive spinal cord disease such as spondylosis, ligamentum ossification, spinal canal stenosis and disc herniation, but its pathophysiology is not understood in detail. One reason is that a satisfactory model of chronic cervical cord compression has not been produced in experimental animals yet. So far, various methods have been undertaken to induce spinal cord compression; however, most of the models available are only suitable for acute or subacute compression and involve laminectomy to bring about the compression, so epidural tissues such as blood vessels are injured and scar tissue forms. There has been no appropriate model for analysis of the effects of chronic cervical cord compression. The other models include transplantation of tumor cells (Delattre et al., 1989; Ikeda et al., 1980; Manabe et al., 1989; Ushio et al., 1977), placement of screws with gradual tightening (Al-Mefty et al., 1993; Gooding et al., 1975; Hukuda and Wilson, 1972; Schramm et al., 1978; Shinomiya et al., 1992), implantation of an expanding sheet (Kasahara et al., 2006; Kim et al., 2004), and the genetic mouse making ossification of spinal ligaments (Hosoda et al., 1981). These models have several inconveniences, such as the time course of the tumor models being too rapid, epidural tissues being injured during the direct implantation of the sheet or screw placement, and a lack of options of where the compression site in genetically modified mice will take place other than the C1–C2 vertebral level. By comparison in our model, the polyethylene line suppressed the enlargement of the spinal canal, taking advantage of spinal growth itself, which gradually compresses the spinal cord. The cervical cord compression was produced without performing surgery on the spinal canal, therefore epidural tissues were not injured, and scar formation after laminectomy did not occur.
The bone maturity of rats and humans was around 3–4 months of age and 13–16 years old, respectively (Adler et al., 1983; Moskowitz et al., 1990). The spinal cord growth of rats and humans is completed around 3 months and 18 years after birth, respectively (Moskowitz et al., 1999). Therefore, rats aged 3 weeks and 12 months correspond to adolescence and advanced age in humans, respectively. Some studies have been made of the association between morphological changes of the compressed spinal cord on CT myelography or MR imaging, and clinical symptoms in humans. The spinal cord was reported to lose its functional tolerance if the transverse area measured by CT myelography and MR imaging was less than 55–75% of the normal value (Fujiwara et al., 1988, 1989; Fukushima et al., 1991; Hukuda and Wilson, 1972; Mizuno et al., 1992; Okada et al., 1994; Saito et al., 1992). In addition, a characteristic feature of human cervical cord compression is the delayed and insidious appearance of clinical symptoms after induction of spinal cord compression. In this study, compression of the cervical cord did not result in acute persistent neurological deficits. All animals returned to a normal neurological status after surgery. On MR imaging, the spinal cord of CCS model animals gradually became flattened from 6 months on after surgery. Neurological deficits developed in a delayed fashion; however, the earliest abnormalities emerged 9 months after the initial compressive procedure. The neurological deficits were progressive in nature, gradually becoming worse, much like the human condition. Thus this model is unique because of the slow course of the disease, and the lack of surgical damage to the spinal epidural tissues as well as to the spinal cord. Additionally, behavioral assessments were helpful and meaningful to accurately evaluate specific functions of the spinal cord. In our model, the conditions seen in chronic cervical cord compression in humans were simulated much more accurately than by other models.
At present, MR imaging is the preferred radiological diagnostic tool, because it can anatomically depict how the spinal cord is compressed, and it can also reflect the pathological changes in the spinal cord. Many authors have reported intramedullary high signal intensity on T2-weighted MR imaging in patients with compression lesions of the cervical spinal cord (Matsuda et al., 1991; Matsumoto et al., 2000; Takahashi et al., 1989). This imaging modality has been reported to have low sensitivity for the detection of cervical myelopathy, with published estimates ranging from 15–65%. Furthermore, the high signal intensity related to cervical myelopathy appears only on T2-weighted images of patients in late clinical stages. However, the pathological process underlying the high signal intensity seen on T2-weighted images remains imprecise. The increased intensity may be due to a water increase in myelomalacia, chronic ischemia, inflammatory edema, or cavitation (Al-Mafty et al.,1988; Faiss et al., 1990; Ito et al., 1996; Matsuda et al., 1991; Matsumoto et al., 2000; Takahashi et al., 1989). In animal experiments, there have been only a few MR imaging studies of chronic spinal cord compression, because of the difficulty in establishing an accurate model. Al-Mefty and associates (1993) demonstrated a chronic cervical cord compression model in dogs, obtained T2-weighted MR imaging, and reported intramedullary high-intensity areas in a snake-eye pattern at the compression site, which were indicative of cystic necrosis of gray matter found at the time of histological study. Kanchiku and associates (2001) also demonstrated a chronic cervical cord compression model in the rabbit, and reported high-intensity areas at the compression site that correlated to necrotic changes and gliosis in the gray matter, with demyelination and axonal degeneration in the white matter. In our study, the intensity quantified as the SDNR was significantly high at the compression area. Histological sections showed disappearance of ventral neurons in the gray matter and wallerian degeneration in the white matter that correlated with the T2 high-intensity areas seen at the compression site. Kobayashi and colleagues (2008) demonstrated that the evidence of active wallerian degeneration in the gray and white matter seen in the area of intramedullary edema was due to breakdown of the blood–spinal cord barrier. Therefore, intramedullary increased signal intensity changes seen on T2-weighted MR imaging are probably signs of edema and an inflammatory reaction in the cervical cord. Further studies will be needed to confirm this hypothesis using this model.
In studies of cadaveric cervical spinal cords, Hatayama and co-workers (1992), and Kameyama and associates (1995), observed a decreased number of anterior horn cells in patients who had suffered from motor paresis due to cervical ossification of the posterior longitudinal ligament, which preceded findings of gliosis, demyelination, and atrophy of anterior gray matter. They also reported a close relationship between the severity of external compression and atrophy of the anterior horn in human cadavers. Neuronal loss at the site of cervical cord compression has been reported in other animal models (Xu et al., 2008). If the disturbance of neurons caused by compression and the resulting central chromatolysis are mild, the neurons can recover fully after compression is relieved (Kobayashi et al., 2007). However, it seems likely that sustained mechanical compression of the cervical cord could result in irreversible damage to the neurons of the ventral horn, such as apoptosis. Chromatolysis does not necessarily foreshadow neuronal cell death, although specific signals seen during chromatolysis may be required to initiate apoptosis (Kerr and Harmon, 1991; Price and Porter, 1972; Sen, 1992). In our study we saw evidence that the motoneurons in the CCS rat model were decreased by 65% compared to controls at 1 year post-surgery. This finding indicated that the decrease seen in the number of motoneurons preceded the onset of the disturbances of motor and sensory function.
This animal model might reproduce characteristic features of clinical chronic cervical cord compression, including progressive motor and sensory disturbances after a latent period, and insidious neuronal loss. The MR imaging and histological findings found in this animal model were similar to findings in human subjects, so rats prepared in this way should be useful for the study of chronic compression of the human cervical cord.
Conclusion
The present study validates a new animal model of chronic cervical cord compression without direct injury to the spinal cord of the rat. In this model, rats whose C4 vertebral bodies were constricted using a polyethylene line presented with motor deficits and sensory disturbances 9 months after initiating CCS; however, no clinical manifestations took place until 6 months post-surgery. This insidious and delayed onset of symptoms is one of the most typical characteristics of chronic compression of the spinal cord. Therefore, this model may reproduce the behavior of chronic cervical spinal cord compression in humans.
Footnotes
Author Disclosure Statement
We thank Dr. Katsuhiko Hayakawa and Mr. Takashi Nakane of the Radiology Department of Aikou Orthopaedic Hospital for help with the MR imaging procedures. This work was supported by a grant-in aid from the Ministry of Education, Science and Culture of Japan (grant no. 21791388).