
Abstract
The objective was to study the correlations and the differences in glucose metabolism between the thalamus and cortical structures in a sample of severe traumatic brain injury (TBI) patients with different neurological outcomes. We studied 49 patients who had suffered a severe TBI and 10 healthy control subjects using 18F-fluorodeoxyglucose positron emission tomography (18F-FDG-PET). The patients were divided into three groups: a vegetative or minimally-conscious state (MCS&VS) group (n=17), which included patients who were in a vegetative or a minimally conscious state; an In-post-traumatic amnesia (In-PTA) group (n=12), which included patients in PTA; and an Out-PTA group (n=20), which included patients who had recovered from PTA. SPM5 software was used to determine the metabolic differences between the groups. FDG-PET images were normalized and four regions of interest were generated around the thalamus, precuneus, and the frontal and temporal lobes. The groups were parameterized using Student's t-test. Principal component analysis was used to obtain an intensity-estimated-value per subject to correlate the function between the structures. Differences in glucose metabolism in all structures were related to the neurological outcome, and the most severe patients showed the most severe hypometabolism. We also found a significant correlation between the cortico-thalamo-cortical metabolism in all groups. Voxel-based analysis suggests a functional correlation between these four areas, and decreased metabolism was associated with less favorable outcomes. Higher levels of activation of the cortico-cortical connections appear to be related to better neurological condition. Differences in the thalamo-cortical correlations between patients and controls may be related to traumatic dysfunction due to focal or diffuse lesions.
Introduction
Typically, moderate to severe TBI causes an abrupt transfer of mechanical energy into the brain parenchyma, which results in injuries that disrupt normal neurological function. This mechanical energy can result in contusive focal lesions that usually appear in the cortical structures, and diffuse axonal injury (DAI) that usually follows a depth gradient that is dependent on the intensity of the forces exerted at the cephalic level (Grados et al., 2001). The importance of DAI has recently been highlighted when it was demonstrated that these diffuse lesions play an important role in the cognitive impairment and decreased awareness seen after TBI. However, subtle diffuse lesions may not appear on structural imaging, or if present, their extent or location are often not correlated with many of the clinical symptoms that are commonly observed in these patients. Therefore, there is increasing interest in developing and applying new functional neuroimaging techniques that are specifically designed for the detection of DAI (Meythaler et al., 2001; Scheid et al., 2006).
The integrity of cerebral cortico-subcortical connectivity is essential for maintaining normal brain function (Bassett and Bullmore, 2009; Sporns and Honey, 2006). This connectivity is particularly vulnerable to the effects of traumatic injuries that can alter not only the individual components of the network (focal lesions), but also the connections between brain nodes (DAI). Because of its connections to the ascending reticular system and its role in cognitive information processing via its connections to the cerebral cortex, the thalamus seems to play a central role in the network that is responsible for maintaining awareness (Laureys et al., 1999b; Mitelman et al., 2006; Zhang et al., 2008). Recently, Laureys and associates described a brain network that is involved in maintaining awareness after TBI, and includes the thalamus, precuneus, and the frontal cortex (Laureys et al., 1999a). The functionality of brain network systems in TBI patients throughout the entire recovery process is currently being elucidated.
Our group has previously demonstrated that the thalamic hypometabolism that is detected by fluorodeoxyglucose positron emission tomography (FDG-PET) in patients who have suffered a severe TBI is directly related to patient neurological outcome (Lull et al., 2010). Given the well-known thalamic connectivity to cortical regions, such as the precuneus or fronto-temporal cortex, which are especially vulnerable to the effects of a TBI, the study of the integrity of these systems is highly interesting. Characteristically, damage to these regions has been linked to deficits in complex neurocognitive functioning and behavioral changes that lead to reduced functional recovery after a TBI (Kennedy et al., 2008; Levin and Kraus, 1994). In this article, we extend our analysis to other structures of the cerebral cortex, including the frontal cortex, temporal cortex, and precuneus. Our aim was to study the integrity of the connections between these cortical structures and the connections that are established between these cortical structures and deep brain structures such as the thalamus.
We used a variation of voxel-based morphometry (VBM; Ashburner and Friston, 2000; Good et al., 2001) to analyze the data from metabolic FDG-PET images from a sample of patients with different neurological outcomes after TBI. This method, which was originally used for anatomical magnetic resonance (MR), has been previously used in the study of thalamic metabolism in TBI patients (Lull et al., 2010). This method allows us to analyze, process, and quantify the differences in FDG-PET signals with an independent treatment for each voxel of the image. Specifically, we have applied this method for the analysis of the regions of interest (ROI) involved in our study. Our hypothesis was that the metabolism of these structures and the functional networks that are established between them are related to the neurological and functional outcome after TBI.
Methods
Subjects
The sample included in this study has been previously described (Lull et al., 2010). It consists of 10 healthy controls (mean age 40.8 [SD 15.4] years; six men and four women), and 49 severe TBI patients, aged 16–65 years, who were divided into three clinical groups according to either their level of consciousness or their cognitive outcome. The classification of the groups was as follows: patients who were in a vegetative or minimally-conscious state (MCS&VS, n=17), patients who experienced post-traumatic amnesia (In-PTA, n=12), and patients who had recovered from PTA (Out-PTA, n=20). Demographic data from the TBI patients are shown in Table 1. The classification criteria of this sample may also be reviewed in detail in our previous publication (Lull et al., 2010).
Data are mean (standard deviation).
MCS&VS, vegetative or minimally-conscious state; In-PTA, In-post-traumatic amnesia; Out-PTA, Out-post-traumatic amnesia; NS, not significant.
Patients in PTA were included regardless the intensity of their cognitive or psychiatric symptoms. Any medication with a potential effect on brain metabolism was removed 48 h before the PET scan. Antiepileptic drugs (AEDs) were the only medications that were not removed, because of the risk of a seizure. Considering the total sample, 22% of our patients suffered from epilepsy (20% of Out-PTA patients, 8% of In-PTA patients, and 35% of MCS&VS patients). Levetiracetam was used in 80% of our patients. This AED was chosen in an effort to avoid other drugs having a depressant effect on the central nervous system and a negative effect on cognition.
The percentage of the patients who showed focal structural lesions on computed tomography (CT, n=17), or magnetic resonance imaging (MRI, n=32), in the cerebral areas studied (thalamus, frontal cortex, temporal cortex, and precuneus) was determined for each group (Table 1). As expected, anatomical neuroimaging studies showed a low frequency of structural thalamic lesions and a higher frequency of structural cortical lesions, which were mainly located in the frontal cortex and temporal cortex. There was a trend towards significance (p=0.08) when the percentage of In-PTA patients with focal temporal lesions (75%) was compared to that of the other groups. Due to the retrospective design of this study, data on lesions that specifically affected the precuneus were not available. As an indirect measure of the effects on the precuneus, the percentage of patients that showed parietal lesions was selected.
All patients provided written informed consent. For patients with a low level of consciousness, consent was obtained from a close relative. We also obtained approval for the study from the hospital ethics committee, and the study complied with the principles of the Declaration of Helsinki.
Acquisition of PET images
All patients underwent a PET/CT brain scan after an intravenous injection of 1–10 MBq/kg−1 of fluorodeoxyglucose (FDG), up to a maximum dose of 370 MBq. The acquisition of the PET images was performed according to the methodology that was previously published by our group (Lull et al., 2010).
Figure 1 shows FDG-PET images of representative cases for each group, showing the metabolic differences between groups.
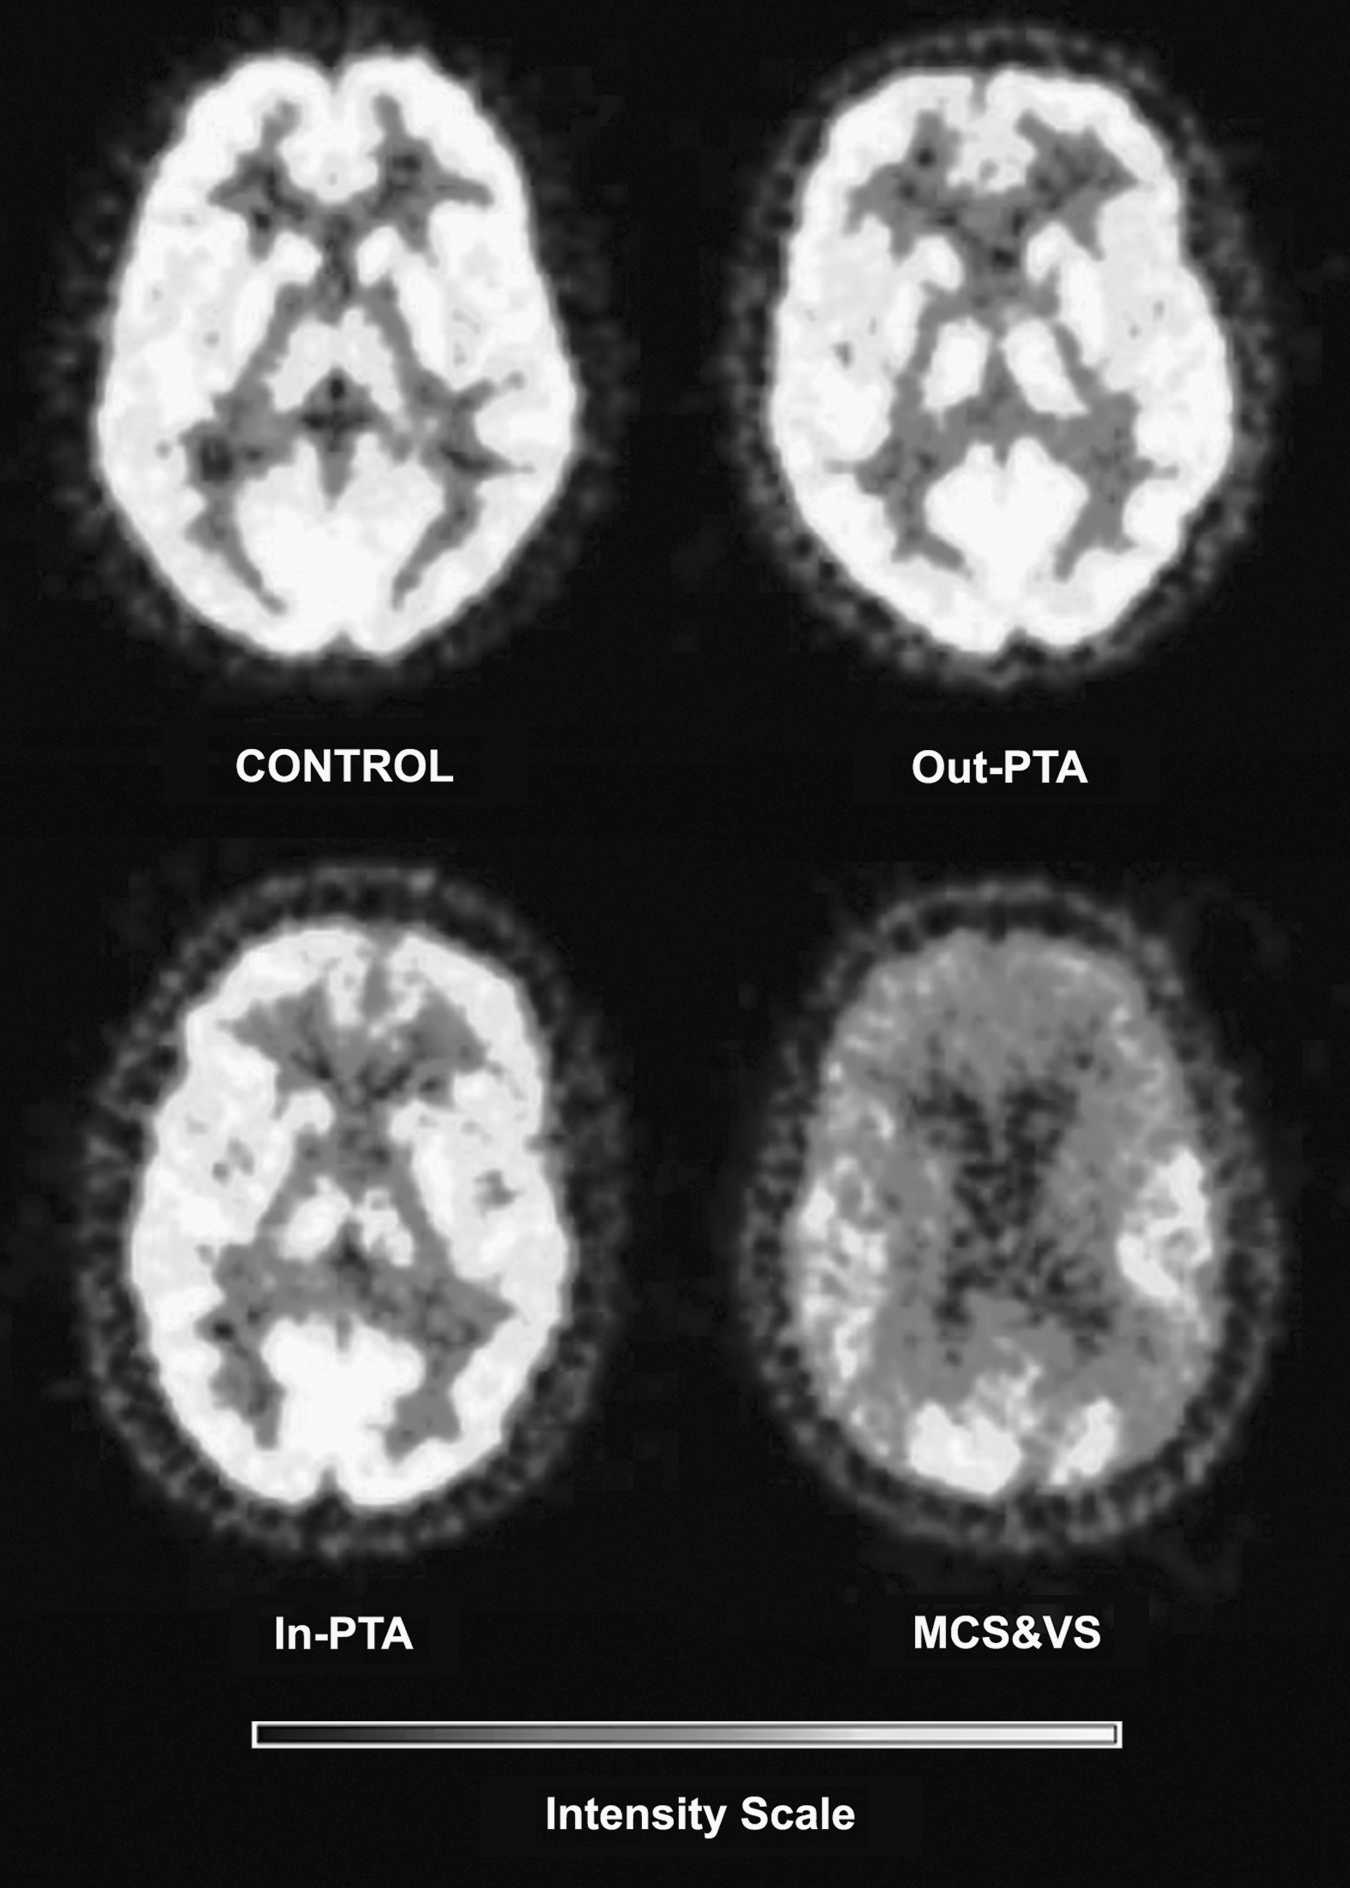
Fluorodeoxyglucose positron emission tomography (FDG-PET) images of representative cases for each group, showing the metabolic differences among the groups (MCS&VS, vegetative or minimally-conscious state; In-PTA, In-post-traumatic amnesia; Out-PTA, Out-post-traumatic amnesia).
Voxel-based PET analysis
We adapted the previously-validated methodology (Lull et al., 2010), which is based on voxel-based analysis (VBA) of the images, using MATLAB 7.4 software (The MathWorks, Natick, MA) and SPM software (Statistical Parametric Mapping 5; Wellcome Department of Cognitive Neurology, Institute of Neurology, London, U.K.). SPM was a suitable tool for this type of analysis because of the ease of imaging processing and the possibility of extracting data from the images for further analysis. Briefly, the PET images were subjected to the process of VBM (Ashburner and Friston, 2000). Image pre-processing consisted of the following steps: (1) image conversion to the Niftii format; (2) intensity normalization; (3) creation of the PET custom template; (4) spatial normalization; (5) smoothing; and (6) selection of the ROIs.
A specific FDG-PET custom template was necessary for this study for several reasons. First, the PET template provided with SPM was built using H2 15O cerebral blood flow images from healthy subjects (i.e., not FDG cerebral metabolism). Second, since all the subjects had different ages and injuries, all the images included in this study should be in a standard stereotactic space, specifically the Montreal Neurological Institute (MNI) space (Evans et al., 1993). Also, our study included patients with lesions of different types and locations, so we used a warping technique such as that used by Phillips and associates (2011) to prevent irregularities in the analysis caused by this heterogeneity.
Region of interest selection
The selection of each ROI was performed with the help of an expert neurologist. The ROIs selected for each mask were as follows: (1) thalamus; (2) precuneus; (3) frontal cortex (composed of the orbitofrontal, dorsolateral, and frontomedial areas); and (4) temporal cortex (composed of the upper, middle, and inferior temporal areas, the superior and middle temporal poles, the hippocampus, the parahippocampal gyrus, and the fusiform gyrus).
Metabolic differences between the groups of subjects
After obtaining the image with the selected ROI, a statistical analysis based on the general linear model (GLM software for SPM5) was conducted. A design matrix and a statistical test model for comparison were defined for each pair of groups in each structure: (controls compared to the MCS&VS group, controls compared to the In-PTA group, controls compared to the Out-PTA group, the Out-PTA group compared to the MCS&VS group, the Out-PTA group compared to the In-PTA group, and the In-PTA group compared to the MCS&VS group), as well as their opposites: (the MCS&VS group compared to the controls, and so on). The model fitting consisted of an estimation of the parameters used to obtain the best approximation of the data to the model. An estimation of the model was carried out using the Student's two-sample t-test that was independently applied to each voxel based on contrast, with the aim of measuring the interactions and the possible differences between the groups. A different model was generated for each two-group comparison, and a technique that solved the multiple comparison problem (as thousands of voxels were univariately tested), and controlled the ratio of false-positives (false discovery rate, FDR; Genovese et al., 2002) was used to establish the levels of statistical significance, which was set at p<0.05.
Metabolism correlation between structures
A one-sample t-test was applied to each of the selected ROIs that allowed the principal components of each subject to be determined by the application of an eigenvariate function. The value of the first principal component of each structure in each subject was then extracted, and 2D correlation of the structures across subjects was performed. For each group of patients, the three cortico-cortical systems (fronto-temporal, fronto-precuneus, and temporo-precuneus), and the three cortico-subcortical systems (fronto-thalamic, temporo-thalamic, and precuneo-thalamic) were correlated. Specifically, this study sought to correlate the metabolic intensity between the various brain structures in each subject.
Results
Metabolic differences between the controls and the study patients
We have previously reported on the global thalamic hypometabolism in TBI patients compared to controls (Lull et al., 2010). Similar results were obtained when comparing the thalamic and frontal metabolism between the groups, and the most significant difference was found when comparing the controls to the MCS&VS group. Significant differences were also found when comparing the controls to the In-PTA group, although they were lower than in the previous comparison. Finally, a less significant difference between the healthy controls and the patients was found in the comparison between the controls and the Out-PTA group.
The precuneus and temporal cortex metabolic differences reached significance both in the comparison between the controls and the MCS&VS group, and between the controls and the In-PTA group, with greater differences seen in the first comparison. However, in these structures, no significant metabolic differences were obtained when comparing the controls to the Out-PTA group.
No voxel survived the reverse tests (the MCS&VS group compared to controls, the In-PTA group compared to the controls, and the Out-PTA group compared to the controls) in the four brain structures. These results are shown in Figure 2.
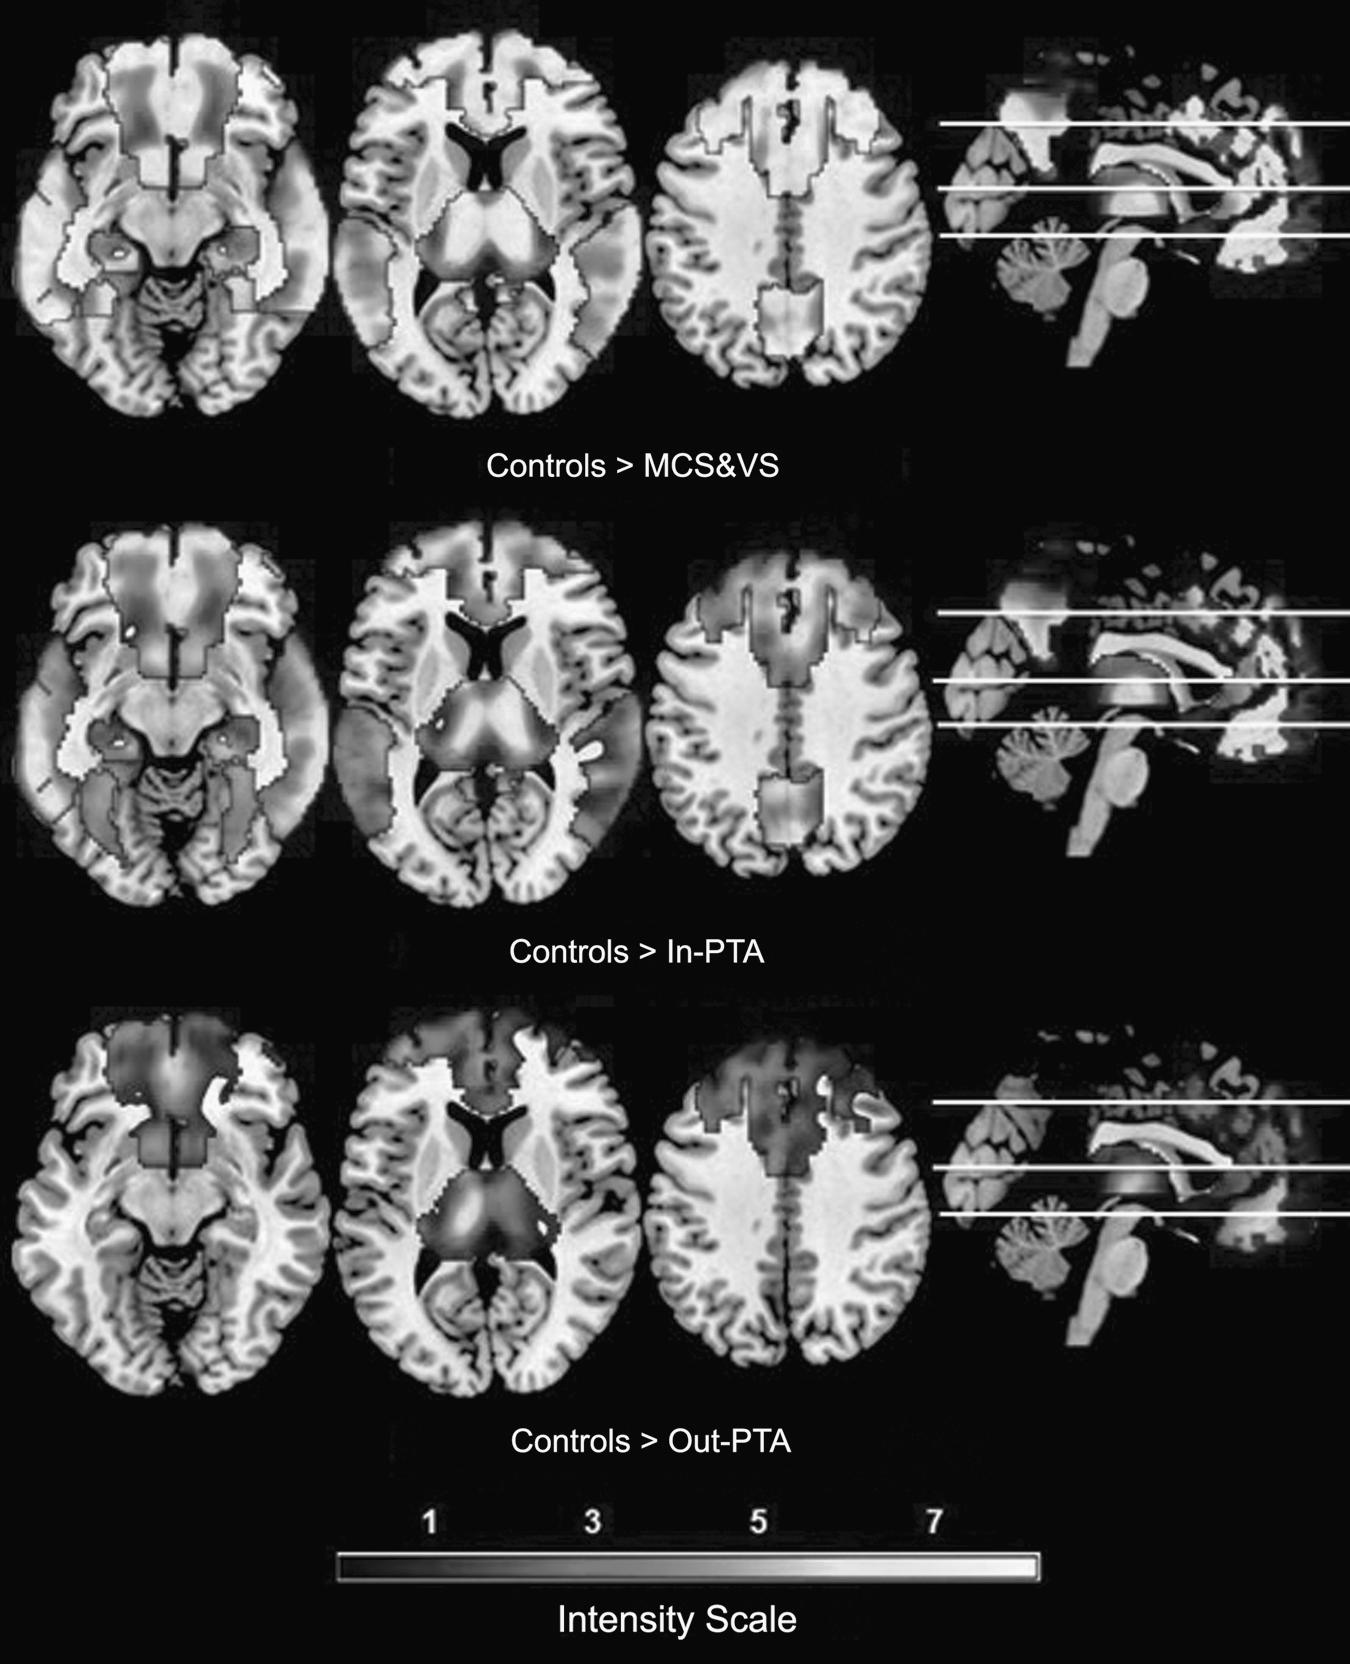
Axial and sagittal (right) metabolic differences (z values) between the controls and the patients. Top: Metabolic comparison between the controls and the MCS&VS group, showing differences in all four structures. Middle: Metabolic comparison between the controls and the In-PTA group, showing differences in all four structures. Bottom: Metabolic comparison between the controls and the Out-PTA group, showing differences in the thalamus and the frontal cortex. As the intensity scale shows, brighter areas indicate greater differences (MCS&VS, vegetative or minimally-conscious state; In-PTA, In-post-traumatic amnesia; Out-PTA, Out-post-traumatic amnesia).
Metabolic differences between patients
We found significant thalamic metabolic differences in the comparisons between the patients in the three groups. The comparison between the Out-PTA group and the MCS&VS group showed the largest metabolic differences of all the patient groups. In addition, significant thalamic metabolic differences appeared when comparing the Out-PTA group to the In-PTA group. The smallest metabolic differences were found in the thalamus in the comparison between the In-PTA group and the MCS&VS group, although these differences reached statistical significance.
The frontal and temporal cortices showed significant metabolic differences in the comparisons between the Out-PTA and the MCS&VS groups, and the Out-PTA and the In-PTA groups had a greater significance than the Out-PTA and MCS&VS comparison; however, no voxel survived the comparison between the In-PTA group and the MCS&VS group.
Significant metabolic differences were found in the precuneus only when comparing the Out-PTA group to the MCS&VS group. No significant differences were found in the other two comparisons (between the Out-PTA group and the In-PTA group, and between the In-PTA group and the MCS&VS group).
No voxel survived the reverse tests (the MCS&VS group compared to the Out-PTA group, the In-PTA group compared to the Out-PTA group, and the MCS&VS group compared to the In-PTA group) in the four brain structures. These results are shown in Figure 3.

Axial and sagittal (right) metabolic differences (z values) between the patients. Top: Metabolic comparison between the Out-PTA group and the MCS&VS group, showing differences in the thalamus and the frontal and temporal cortex. Middle: Metabolic comparison between the Out-PTA group and the In-PTA group, showing differences in all four structures. Bottom: Metabolic comparison between the In-PTA group and the MCS&VS group, showing differences in the thalamus. As the intensity scale shows, brighter areas indicate greater differences (MCS&VS, vegetative or minimally-conscious state; In-PTA, In-post-traumatic amnesia; Out-PTA, Out-post-traumatic amnesia).
Results are presented in the form of parametric probability maps, for which the intensity or brightness of each voxel was determined by its corresponding z statistic (Table 2).
MCS&VS, vegetative or minimally-conscious state; In-PTA, In-post-traumatic amnesia; Out-PTA, Out-post-traumatic amnesia; NS, not significant.
Analysis of the correlation between structures
There was a strong correlation between the cortical structures in both patients and controls. However, we obtained a weaker correlation in the control group when comparing the cortical structures to the thalamus, particularly when analyzing the correlation between the thalamus and the frontal cortex. The quantitative results obtained in this study are shown in Table 3.
MCS&VS, vegetative or minimally-conscious state; In-PTA, In-post-traumatic amnesia; Out-PTA, Out-post-traumatic amnesia; NS, not significant.
Figure 4 shows a trend of decreasing metabolic intensity in each cerebral structure from healthy controls to MCS&VS patients. Each point shows the value of each structure's mean intensity (thalamus, precuneus, frontal cortex, and temporal cortex) for each group of subjects (Controls, Out-PTA, In-PTA, and MCS&VS).

Correlation analysis. The x axis represents patients and the y axis shows contrast intensity values. The lines show a trend of decreasing metabolic intensity in each cerebral structure from healthy controls to MCS&VS patients (MCS&VS, vegetative or minimally-conscious state; In-PTA, In-post-traumatic amnesia; Out-PTA, Out-post-traumatic amnesia).
Finally, the correlations between cortico-cortical and cortico-subcortical structures in each group of patients are shown in Figure 5.

Correlation between cortico-cortical and cortico-subcortical structures in each group of patients (MCS&VS, vegetative or minimally-conscious state; In-PTA, In-post-traumatic amnesia; Out-PTA, Out-post-traumatic amnesia).
Discussion
Our results show that the hypometabolism that was detected not only in widespread cortical areas (fronto-temporal cortex and precuneus), but also in the thalamus after TBI typically resolves as long as the patient's neurological outcome improves. The strong correlations between the metabolism in each of our patient's brain structures reinforces the idea that functional neural networks connect near and distant structures, which is the basis for normal brain function (Boly et al., 2008). These results are consistent with those of other groups, that describe the existence of a significant correlation between the severity of the TBI and global cerebral hypometabolism (Hattori et al., 2003; Kato et al., 2007; Nakashima et al., 2007; Nakayama et al., 2006a; Wu et al., 2004). Using more sensitive image analysis techniques, our group previously demonstrated metabolic differences in specific brain structures when comparing severe TBI patients in different clinical situations (Lull et al., 2010). In particular, the previously described findings related to thalamic metabolism have been extended to other cortical regions in this study.
Some considerations of our study should be noted before a more detailed discussion of our results. First, this is not a quantitative study of glucose uptake. As previously reported, we have analyzed metabolism as a volumetric measure, which is a relative value of FDG uptake (Kato et al., 2007). Second, some studies have demonstrated that glucose is being shunted in this kind of injury, instead of being metabolized as in normal conditions, and this could alter the volumetric values obtained. However, the vast majority of our sample was in a chronic phase, which is associated, according to previous studies, with a stabilization of glucose uptake, even under pathological conditions (Bergsneider et al., 1997,2000,2001).
VBM studies conducted in patients in a vegetative state have described an impairment of a broad network, that includes the thalamic nuclei and the polymodal associative cortices (encompassing the bilateral prefrontal regions, Broca's area, the parieto-temporal and posterior parietal areas, and the precuneus cortex; Laureys et al., 1999a,2004; Schiff et al., 2002). These studies have also shown that clinical improvement of these states is associated with a functional restoration of the connections between the intralaminar thalamic nuclei and the prefrontal cortex (Laureys et al., 1999b,2000). Our analysis of the metabolic changes by ROIs demonstrated that the thalamus seems to be the most sensitive structure that shows differences when comparing any neurological state (Lull et al., 2010). As expected, due to the characteristics of our sample, the intergroup comparative study showed that the largest metabolic differences appeared when comparing healthy controls to the patients in a vegetative and minimally-conscious state. To date, three possible explanations for this thalamic hypometabolism have been proposed: direct focal lesions, damage to the white matter resulting from diffuse axonal injury, or a phenomenon of remote disconnection/deafferentation (Anderson et al., 1996; Laureys et al., 1999a,1999b,2000; Nakayama et al., 2006a). Recent studies have focused on thalamic metabolism in TBI patients, including our previous results (Lull et al., 2010), and they support the contribution of the latter two listed mechanisms due to the functional or anatomical disconnection between the cerebral cortex and the deeper brain regions (Fernandez-Espejo et al., 2010; Laureys et al., 1999a; Nakayama et al., 2006a,2006b). Metabolic data from other brain structures that were analyzed in this study supports deafferentation as a basic mechanism that may explain the thalamic hypometabolism detected in our patients.
According to our results, the recovery of the metabolism in the frontal cortex seems to represent the most sensitive cortical marker for the detection of clinically relevant changes in our sample of patients. To date, several studies have demonstrated the importance of preserving frontal metabolism in patients who have suffered a TBI (Kennedy et al., 2008; Levin and Kraus, 1994). Damage to the frontal lobe and its connections are particularly detrimental and compromise long-term outcome by interfering with the restoration of normal personality, occupational function, and community reintegration. Given the recognized importance of the fronto-thalamic connectivity, it was not surprising that the hypometabolism detected in this system appeared to be the most relevant dysfunction of our sample, with the expected resultant clinical implications (Laureys et al., 2000; Nakayama et al., 2006a).
Unlike thalamic metabolism, fronto-temporal metabolism showed no significant differences when comparing patients in PTA with those in VS and MCS. The major metabolic differences in these two cortical areas began to appear in the comparisons between patients who were in PTA with those who had already recovered from this state. These data suggest that the recovery from PTA could be associated with an overall improvement in cerebral cortical function. To our knowledge, functional neuroimaging studies that compare patients during and after the PTA period are still not available. Previous structural neuroimaging studies in PTA patients have shown a preferential involvement of the medial temporal cortex, subfrontal area, and the central brain structures, or the connections between them (Wilson et al., 1994,1995). According to our results, structural neuroimaging data showed a modest tendency for more temporal lesions in PTA patients compared to other groups, but the reason for the relationship between the duration of PTA and more widespread brain dysfunction remains unknown. Our data of the fronto-temporal metabolism recovery after PTA resolution should be cautiously interpreted, because our results are based on cross-sectional comparisons. Future longitudinal studies that include patients before and after PTA resolution would help to elucidate this question.
Our results comparing the regional cortical metabolism with the inclusion of healthy controls can help us understand the role of these areas in neurological recovery after TBI. In the case of the temporal cortex, there were no significant differences between the healthy controls and the patients who had recovered from PTA, which suggests that the activation of the temporal cortex seems to play an important role in the earlier stages, especially during PTA resolution, when memory processes related to recent events begin to operate (Tate et al., 2000). In the case of the frontal cortex, the differences found between the healthy controls and the patients who had recovered from PTA again highlight the importance of the normal functioning of the frontal cortex in the final outcome after TBI (Kennedy et al., 2008; Levin and Kraus, 1994). The different evolution of the metabolism of these two cortical structures could also be due to differences in the distribution of lesions detected by structural imaging, or to the classification criteria used in this study. It is possible that a classification based on more specific criteria, which are directly related to the functionality of these areas, would have yielded different results. It is also possible that the changes found in frontal metabolism compared to other cortical structures could be explained by the effect of diffuse lesions. There is still no clear explanation to demonstrate the particular vulnerability of frontal metabolism to the effects of DAI lesions. It has been suggested that the strong convergence of white matter fibers in the frontal lobes may explain why lesions in any region of the brain tend to show a proportionally robust effect in this broad associative cortical area (Tullberg et al., 2004).
The precuneus seems to be involved in modulating consciousness via cortico-subcortical connections that include the thalamus (Cavanna, 2007; Laureys et al., 2000). The proper activation of the precuneus has been considered to be critical in the recovery of low-level states of consciousness, and has been considered to be a key player in the default mode network (Cruse and Owen, 2010; Fransson and Marrelec, 2008). In addition, the precuneus appears to be involved in the management and processing of information from different remote cortical areas, mainly the frontal and parieto-temporal cortices (Cavanna and Trimble, 2006). As expected, our results showed that the functionality of the precuneus differs from that of the other cortical structures, which suggests that functional recovery in this structure tends to progress at a slower rate. The persistence of metabolic changes in the precuneus along the entire clinical spectrum of our sample suggests that this structure may play a central role in the recovery of consciousness (Laureys et al., 1999b), which reinforces its role as a cortico-cortical hub. In this sense, the loss of connectivity between the precuneus and the frontal or temporal areas has been associated with autism and cognitive impairment, and a high risk of developing Alzheimer's disease, respectively (Tullberg et al., 2004).
It is now assumed that brain functions, from the basic mechanism that regulates consciousness, to the most complex cognitive processes, are not located in specific brain areas of isolated functioning, but occur via the intricate neural connections underlying the dynamic interactions between brain regions (Fuster, 2006). Our results showed a strong correlation in glucose metabolism between all cortical structures, including patients and healthy controls. In cases of severe TBI, the process of the recovery of consciousness and the recovery of lost skills could be interpreted as a continuum, which only expresses the diffuse loss and the subsequent recovery of brain connectivity. The different metabolic correlations found between patients and healthy controls in terms of thalamo-cortical connections, especially those found in the fronto-thalamic system, suggest that cortico-cortical and cortico-subcortical networks do not have to follow a common pattern of activation, and that both systems are not as susceptible to traumatic injury. The weaker correlation detected in the fronto-thalamic system of our healthy controls may be related to the global integrity of the system and its ability to distribute information through a wide network of structurally intact cortico-subcortical connections (Mitelman et al., 2006).
Limitations in the sample size or in the percentage of patients with cortical focal lesions found in our study should be addressed in future studies. Due to these limitations, this study has simply described the presence/absence of focal lesions, and further study of the relationship between regional structures and system functionality has been proposed. Future studies, including those currently under approval in our facility, involving functional and structural connectivity would be extremely helpful in determining the clinical relevance of particular brain lesions with this pathology.
In conclusion, our results help us understand the clinical and neurological evolution of TBI in patients at all levels of dysfunction, from less severe neurological conditions to the most devastating. The gradual activation of the cortico-subcortical systems and the subsequent activation of intercortical connectivity can help determine the most effective treatment for these patients.
Footnotes
Author Disclosure Statement
No competing financial interests exist.
Acknowledgments
A preliminary version of the manuscript presented here has obtained the 2nd award of IV Convocatoria de los Premios de Investigación en Medicina del Colegio de Médicos de Valladolid (IV edition of the Medical Research Award of the Official College of Physicians of Valladolid).