
Abstract
The purpose of this study was to investigate the increased susceptibility of the brain, after a controlled mild cortical impact injury, to a secondary ischemic insult. The effects of the duration and the timing of the secondary insult after the initial cortical injury were studied. Rats anesthetized with isoflurane underwent a 3 m/sec, 2.5-mm deformation cortical impact injury followed by hypotension to 40 mm Hg induced by withdrawing blood from a femoral vein. The duration of hypotension was varied from 40 to 60 min. The timing of 60 min of hypotension was varied from immediately post-injury to 7 days after the injury. Outcome was assessed by behavioral tasks and histological examination at 2 weeks post-injury. A separate group of animals underwent measurement of the acute physiology including mean blood pressure (MAP), intracranial pressure (ICP), and cerebral blood flow (CBF) using a laser Doppler technique. Increasing durations of hypotension resulted in marked expansion of the contusion, from 6.5±1.8 mm3 with sham hypotension to 27.1±3.9 mm3 with 60 min of hypotension. This worsening of the contusion was found only when then hypotension occurred immediately after injury or at 1 h after injury. CA3 neuron loss followed a similar pattern, but the injury group differences were not significant. Motor tasks, including beam balance and beam walking, were significantly worse following 50 and 60 min of hypotension. Performance on the Morris water maze task was also significantly related to the injury group. Studies of the acute cerebral hemodynamics demonstrated that CBF was significantly more impaired during hypotension in the animals that underwent the mild TBI compared to those that underwent sham TBI. The perfusion deficit was worst at the impact site, but also significant in the pericontusional brain. With 50 and 60 min of hypotension, CBF did not recover following resuscitation at the impact site, and recovered only transiently in the pericontusional brain. These results demonstrate that mild TBI, like more severe levels of TBI, can impair the brain's ability to maintain CBF during a period of hypotension, and result in a worse outcome.
Introduction
D
TBI causes a reduction in cerebral blood flow (CBF), leading to an impaired supply of oxygen and other nutrients. This reduction in CBF occurs immediately after TBI and is proportional to the severity of injury. Following severe TBI, the reduction in CBF may be serious enough to contribute to the damage to the brain. The hypoperfusion after mild TBI is not sufficient to cause ischemic damage; however, it does make the injured brain more susceptible to subsequent secondary ischemic insults. The important role of secondary insults in increasing morbidity and mortality after TBI is widely recognized, and the combination of TBI and hemorrhagic shock (HS) has particular importance in polytrauma patients who also have a mild TBI (Butcher et al., 2007; Chesnut et al., 1993; Marmarou et al., 1991).
Multiple animal models have been developed to enable a better understanding of the pathophysiology of traumatic brain injury associated with a secondary ischemic insult. Each model is intended to mimic certain components of clinical TBI, recognizing that it is difficult to establish consistent models that include most or all of the factors that contribute to post-trauma tissue damage. However, few of these models have examined the effect of secondary insults on mild TBI.
The purpose of this study was to investigate the increased susceptibility of the brain, after a controlled mild cortical impact injury, to a secondary ischemic insult. The effects of the duration and the timing of the secondary insult after the initial cortical injury were studied in this realistic model of cortical impact injury complicated by hypovolemic shock.
Methods
One hundred and fifty-one Long–Evans rats were used in this study to characterize a model of mild TBI complicated by HS. All rats underwent either a mild TBI, consisting of a 3 m/sec, 2.5 mm deformation cortical impact injury or a sham injury. In previous studies, this level of cortical impact injury caused minimal, if any, contusion at the impact site and minimal hippocampal neuronal loss (Cherian et al., 1996). HS of durations ranging from 40 to 60 min immediately post-injury or HS for 60 min at 1 h, 24 h, or 7 days post-injury was induced as a secondary insult. The animals underwent either acute detailed physiological monitoring for 2 h following full resuscitation (n=40), or were allowed to wake up after the full resuscitation and followed for 2 weeks to determine neurological outcome (n=111). Neurological outcome was assessed by measuring histopathological effects on contusion volumes and hippocampal cell counts, and from performance of the rats on motor and cognitive behavioral tests. The protocol was approved by the institutional animal protocol review committee, using guidelines for human care and use of animals that were developed for the National Institutes of Health.
Experimental groups
To examine the effect of varying the duration of HS and the onset of HS following TBI on neurological outcome, male Long–Evans rats weighting 300–350 g were randomly assigned to one of the following injury groups: • Sham TBI+60 min HS (n=15) • TBI+60 min sham HS (n=15) • TBI+40 min HS immediately post-injury (n=15) • TBI+50 min HS immediately post-injury (n=15) • TBI+60 min HS immediately post-injury (n=15) • TBI+60 min HS at 1 h post-injury (n=12) • TBI+60 min HS at 24 h post-injury (n=12) • TBI+60 min HS at 7 days post-injury (n=12)
To study the role of local CBF in determining the effect of HS on the neurological outcome, additional rats assigned to one of the first five injury groups had detailed physiological monitoring, including CBF, during the TBI, the HS and resuscitation, and for 2 h after full resuscitation. The numbers of rats in each of these groups is given in Table 1.
Anesthesia
General anesthesia was induced using 5% isoflurane in 100% oxygen, by placing the rats in a vented anesthesia chamber for ∼3–5 min. After the anesthesia induction, the animals were intubated with a 14 gauge Angiocath™ and mechanically ventilated using a volume-controlled ventilator. A surgical plane of anesthesia was maintained with 2% isoflurane in 100% oxygen. The ventilator was adjusted to maintain pC
Surgical preparation
Using aseptic technique, intravascular catheters were placed in the tail artery and femoral vein. The tail artery was dissected through a 2–4 mm in length incision in the proximal segment of the tail and cannulated using a 22 gauge Angiocath Teflon catheter to monitor blood pressure. Through a 5–8 mm in length incision in the left groin, the femoral vein was dissected free and cannulated using a 22 gauge Angiocath Teflon catheter to allow for the controlled HS and resuscitation using lactated Ringer's solution or the shed blood. The catheters were secured to the skin with nylon sutures. After catheterization, the animals were mounted in a stereotactic frame in the prone position with the head secured by ear bars and an incisor bar. Body temperature was monitored and kept between 36 and 37°C with a heating pad controlled by a rectal probe. Surgical instruments were autoclaved before each procedure.
Craniectomy and the controlled cortical impact injury
The scalp was shaved and then cleaned using an iodine-based solution. The surgical field was draped with sterile linens to minimize the risk of infection. A medial sagittal skin incision was performed and the scalp (including the periosteum) and the temporalis muscle were reflected. To expose the brain for the impact injury, a 10 mm diameter craniectomy was performed over the right parietal cortex between the bregma and lambda using a dental drill. Care was taken to not injure the dural surface. A small amount of saline solution was directed at the site of drilling to prevent thermal injury to the brain tissue. With the impactor rod locked in the extended position, the impactor tip was centered in the craniectomy site perpendicular to the exposed surface of the brain at an angle of ∼ 45 degrees to the vertical, and then the tip was lowered until it just touched the dural surface. The impactor rod was then retracted, and the tip advanced an additional distance in order to produce a brain deformation of 2.5 mm at the time of the impact. To induce a mild level of traumatic injury, the controlled cortical impact device was adjusted to 30 ψ giving an impact velocity of ∼3 m/sec. With the help of a heating lamp aiming at the head of the animal, the brain temperature was kept between 36 and 37°C using a temperature probe placed into the temporalis muscle. After the cortical injury, the skull defect was closed by using an artificial bone flap made of dental acrylic to avoid extrusion of brain tissue. Sham rats underwent surgical manipulations identical to those of the injured rats, with the exception of either the HS or the impact injury.
HS
Using a mechanical standard infusion/withdrawal pump (Harvard Pump Dual RS-232), blood was withdrawn to reduce the mean arterial pressure (MAP) to ∼40 mm Hg for the assigned period of 40–60 min. The blood volume required to decrease MAP to such level was ∼2 mL/100 g of weight. Half of this volume was withdrawn in the first 5 min, another 25% over the next 5 min, and the final 25% over the next 5 min. This decelerating rate of blood loss mimicked the clinical situation of traumatic blood loss. Animals were kept hypotensive for the remaining hypotensive period if necessary by continued intermittent hemorrhage. The shed blood was collected into citrate phosphate dextrose and kept at 4°C for the duration of the hypotensive and fluid resuscitation period. The shed blood was rewarmed to body temperature (36–37°C) immediately before the reinfusion. Following the assigned hypotensive period, animals were first resuscitated with lactated Ringer's solution using the infusion pump to maintain a constant infusion rate of 1 mL/min until a MAP of at least 50 mm Hg was obtained. The final resuscitation was accomplished by reinfusion of the shed blood and providing 100% oxygen ventilation.
Physiological measurements
MAP and brain and rectal temperature were continuously monitored in all animals and recorded at 30 sec intervals using a computerized system. In the animals that underwent the acute detailed physiological monitoring, intracranial pressure (ICP) was also continuously monitored via a 3F Codman microsensor pressure transducer placed in the brain parenchyma. And CBF in both cerebral hemispheres was intermittently measured every 10 min throughout the experiment using a noninvasive laser Doppler scanner (Periscan PIM3 system, Perimed AB Stockholm, Sweden), which permits evaluation of microvascular perfusion in real time. Periscan PIM3 measures the total local microcirculatory blood perfusion including the perfusion in capillaries, arterioles, venules, and shunting vessels. Measurements are expressed as perfusion units (PU). To compare results between animals, the perfusion changes were expressed as percentage from baseline. CBF recovery was evaluated among groups in three regions of interest, including the impact site, pericontusional tissue around the impact site, and relatively uninjured brain on the contralateral side.
Postoperative management and assessment
After the final resuscitation, anesthesia was discontinued to allow animals to recover. Escape; righting; head support; and corneal, pinna, paw, and tail reflexes were assessed every minute for half an hour once the rats were extubated and breathing spontaneously following termination of anesthetic. When fully awake, the animals were returned to their cages and allowed free access to food and water. For the first 3 days post-injury, the animals were given buprenorphine 0.05 mg i.m. q.12 h for analgesia, and Baytril 0.05 mL/kg i.m. q.d. to prevent postoperative infections.
Each rat was weighed on the day of beam walking pre-training, the day of surgery, days 1–5 post-surgery, and days 11–15 post-surgery using a digital scale. On days 1–5 post-injury, the animals were tested on the beam-walking and beam-balancing tasks. On days 11–15 post-injury, the animals were tested on the Morris water maze task. Following the last behavioral assessment, the animals were killed and the brains removed for histological examination.
Behavioral testing
Beam walking task
Each rat was pre-trained 2 days before surgery to walk down a beam 1 m long, 2.5 cm wide, and 1 m above the ground into a darkened goal box, to escape white noise of 90 dB. At the beginning of each training and test trial, the rat sat in the goal box for 30 sec. During training trials, it was placed at successively longer distances from the goal box (fifths of the distance) until it learned to walk down the entire beam. Any distance from which the rat did not walk down the beam into the goal box was repeated until it did. The rat was given a 30 sec rest period in the goal box between trials. After it had traversed the beam in ≤5 sec on three successive trials, four plastic pegs (7.5 cm high) were placed in holes in the beam at ∼20 cm intervals alternating from side to side, 5 mm in from the edge of the beam. The rat was then trained to another criterion of three consecutive trials completed in ≤10 sec. If both of these criteria were not met by 30 trials, the rat was disqualified. The final criterion for inclusion in the study was beam walking times on the day of surgery with the pegs present that were ≤5 sec on three consecutive trials within 15 trials. Beam walking with the pegs present was assessed on days 1–5 post-injury.
Beam balancing task
Each animal was placed lengthwise along the center of a beam 1.5 cm wide, 1 m long and 1 m above the ground. The rat attempted to balance on the beam for up to 60 sec on each of three trials on the day of surgery and on days 1–5 post surgery. The rat was taken off the beam and placed in the goal box for 30 sec between trials.
Morris water maze
The Morris water maze consisted of a 5 foot diameter galvanized steel pool which contained a 10×10 cm plexiglass platform 26 cm high and hidden 2 cm below the water. The platform was always in the same position for each rat, being halfway (35.5 cm) from the center and outer edge of the pool facing the north side. The maze was filled with water 2 cm above the plexiglass platform. The east, north, and west walls had a large cross, triangle, and circle, respectively, taped to white walls. On each trial, the rat was placed in the water facing the wall in a north, south, east, or west position, the order of these starting positions being randomized across the four trials on each day and over days. The same random order was used for all rats. If the rat did not find the platform within 120 sec on any trial, it was placed on the platform for 30 sec. If it found the platform within 120 sec, it was allowed to remain on the platform for 30 sec. Four trials were performed with 4 min for rest between trials; the rat was kept warm with a heating lamp between trials. The rat was tracked in the water maze with the Chromotrack Video Tracking System (San Diego Instruments, San Diego, CA). Pre-injury water maze performance was not tested. Instead, maze performance was assessed on each of days 11–15 post-injury.
Histopathological assessment
On Day 15 after TBI and HS, animals were deeply anesthetized with a combination of isoflurane in 100 % oxygen, and perfused transcardially with normal saline solution followed by phosphate buffered 4% paraformaldehyde. The entire brain was removed and fixed in 4% paraformaldehyde for 24 h and then transferred to a 30% sucrose-based solution. The brain tissues were taken out from sucrose and then frozen, embedded, and cryostat sectioned to 30 μm with the help of cryostat machine (model # H/I Bright OTF5000). Free-floating sections were directly mounted onto subbed glass slides, and Nissl substance was observed by staining the tissue with hematoxylin–eosin staining and then cover-slipped.
Statistical analysis
Summary data in text, tables, and figures are expressed as mean±standard error. Histology parameters were compared using one-way analysis of variance. Cerebral hemodynamic data were analyzed using repeated measures analysis of variance. When there was a significant time by injury group interaction, Holm–Sidak test was used to determine which groups were different. The behavioral data were analyzed using a generalized linear mixed model with Poisson or negative binomial distribution for dependent variables to test within- subject effects for time and between-subjects effects for treatment and interaction of treatment and time.
Results
Baseline physiology and impact injury severity
There were no significant differences in blood pressure or rectal and brain temperature for the different injury groups at pre-injury baseline. The impact velocity averaged 3.3–3.4 m/sec for all groups that underwent controlled cortical impact injury. None of the impact variables (velocity, duration, and deformation) were significantly different in the groups that underwent controlled cortical impact. Table 1 shows the arterial blood gases at baseline, which were not significantly different among the various experimental groups.
Physiology during TBI, HS, and resuscitation
MAP was monitored during the TBI, HS, and resuscitation in the groups of animals that were followed chronically for neurological outcome. In the group that underwent the TBI followed by sham HS, MAP decreased from 84.4±1.1 mm Hg at baseline to 77.8±0.8 mm Hg at the end of the sham HS period. In contrast, all of the animals who underwent HS had MAP values between 36 and 38 mm Hg during the hypotension period. Blood pressure recovered back to at least baseline levels following reinfusion of the shed blood in all groups. Temperature was maintained constant throughout the experiment in all groups.
Arterial blood gas values were monitored periodically during the experiment. Values at baseline, end of HS period, and end of the monitoring period are summarized in Table 1. During the HS period, arterial pC
More detailed monitoring of MAP, as well as of ICP, cerebral perfusion pressure (CPP), and CBF was performed in the animals undergoing the acute physiological monitoring. Figure 1 illustrates that MAP had a typical triphasic pattern after TBI, consisting of immediate increase followed quickly by a transient decrease and then recovery back to baseline. In the animals that underwent the TBI followed by HS, MAP subsequently fell to levels similar to the chronic groups described previously, and then recovered back to baseline following resuscitation. In addition, ICP followed a similar pattern to MAP, with an increase immediately after the TBI followed by return to near baseline with injury alone, but decreased during the HS period with TBI complicated by HS. As MAP and ICP increased together immediately following the impact injury, CPP remained preserved between 60 and 70 mm Hg post-injury until HS was induced. CPP was reduced to between 30 and 40 mm Hg during the HS period in all of the groups with TBI complicated by HS, and remained ∼60 mm Hg in the group with TBI alone.
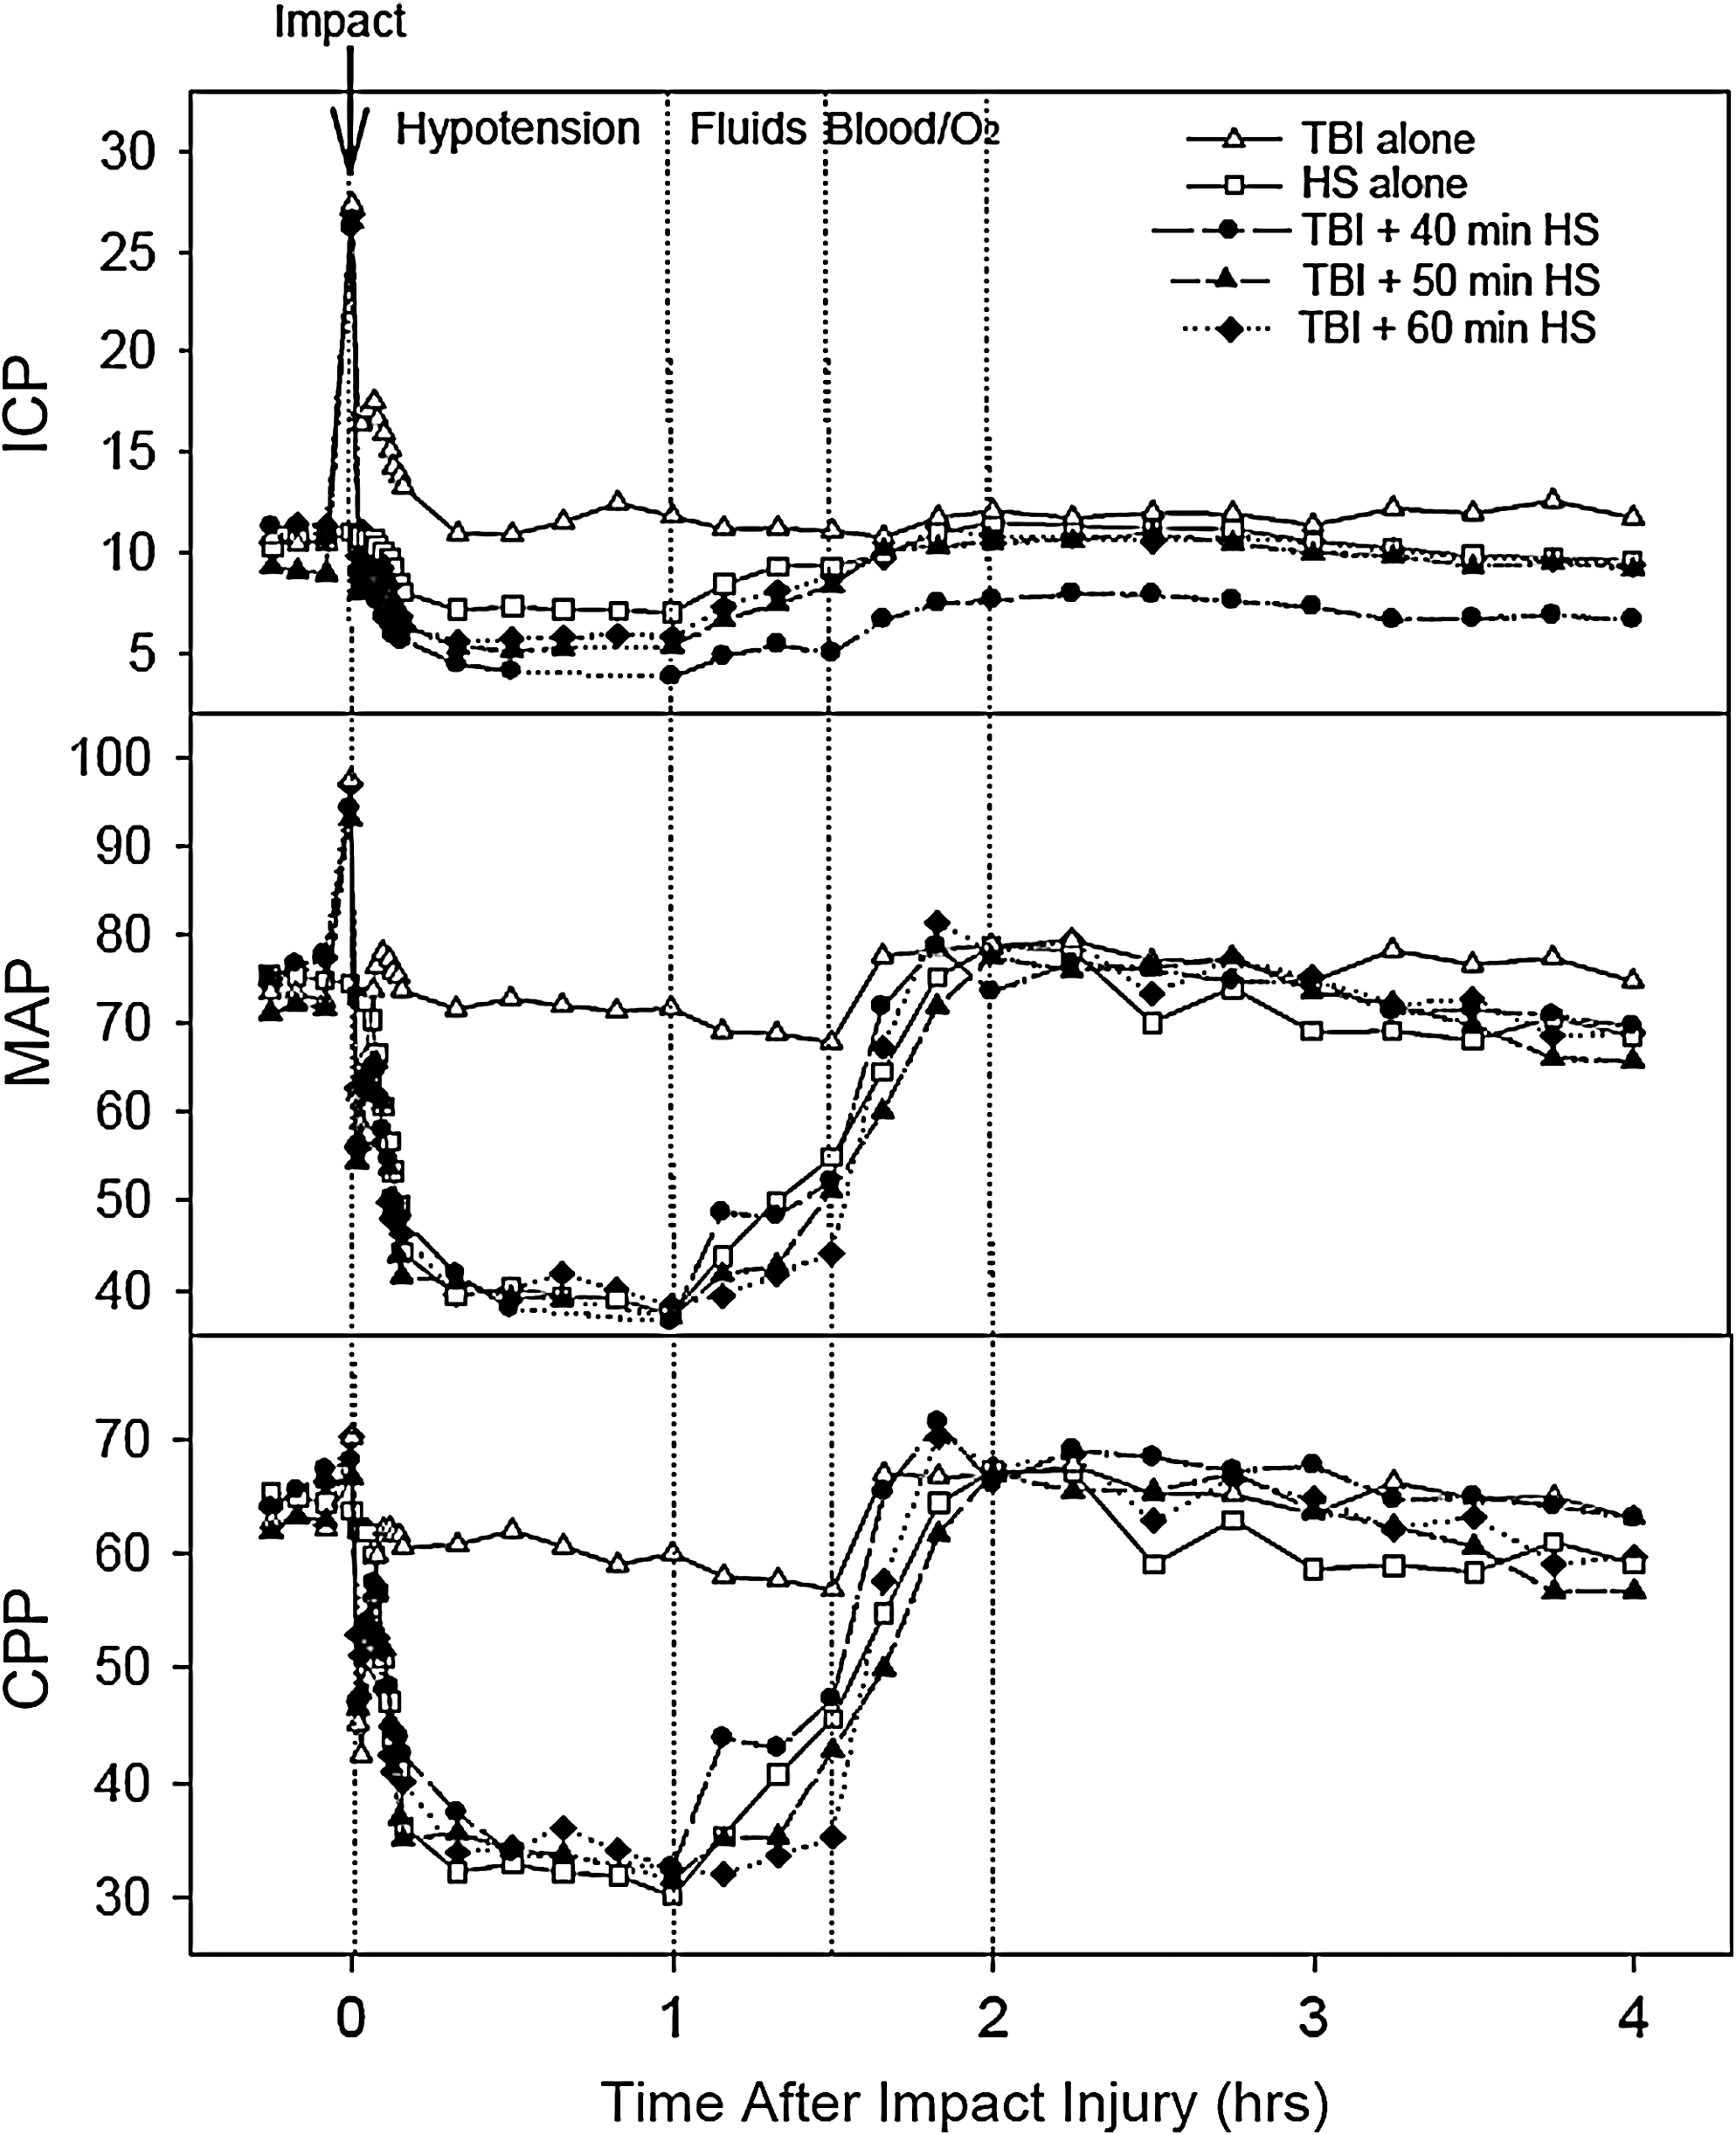
Graphs show the mean intracranial pressure (ICP), mean arterial pressure (MAP), and cerebral perfusion pressure (CPP) in the animals that underwent detailed physiological monitoring. The data from all of the injury groups are all aligned so that resuscitation starts at the same time frame of 1 h post-injury. For the groups with only 40 or 50 min of hypotension, the missing time is indicated by a dotted line.
The regions of the brain that were examined for changes in CBF are illustrated in Figure 2A. HS alone caused a 10–15% reduction in CBF during the hypotension, followed by hyperemia during resuscitation in all brain regions examined. In contrast, the CBF response to the TBI alone and the TBI followed by HS paradigms varied with the brain region examined. Figure 2B shows the mean values for CBF over time in the three brain regions examined: at the impact site (top graphs), in pericontusional tissue (middle graphs), and in contralateral brain (bottom graphs). In each brain region, the values in the different experimental groups were analyzed using two-way repeated measures analysis of variance with experimental group and time as factors. The main effects for experimental group and time were significant (p<0.001) for all brain regions, and there was also a significant group x time interaction indicating that CBF varied over time differently in the experimental groups. Asterisks in the figures indicate which of the CBF values were significantly different from the group undergoing TBI alone (p<0.05 by Holm–Sidak test).
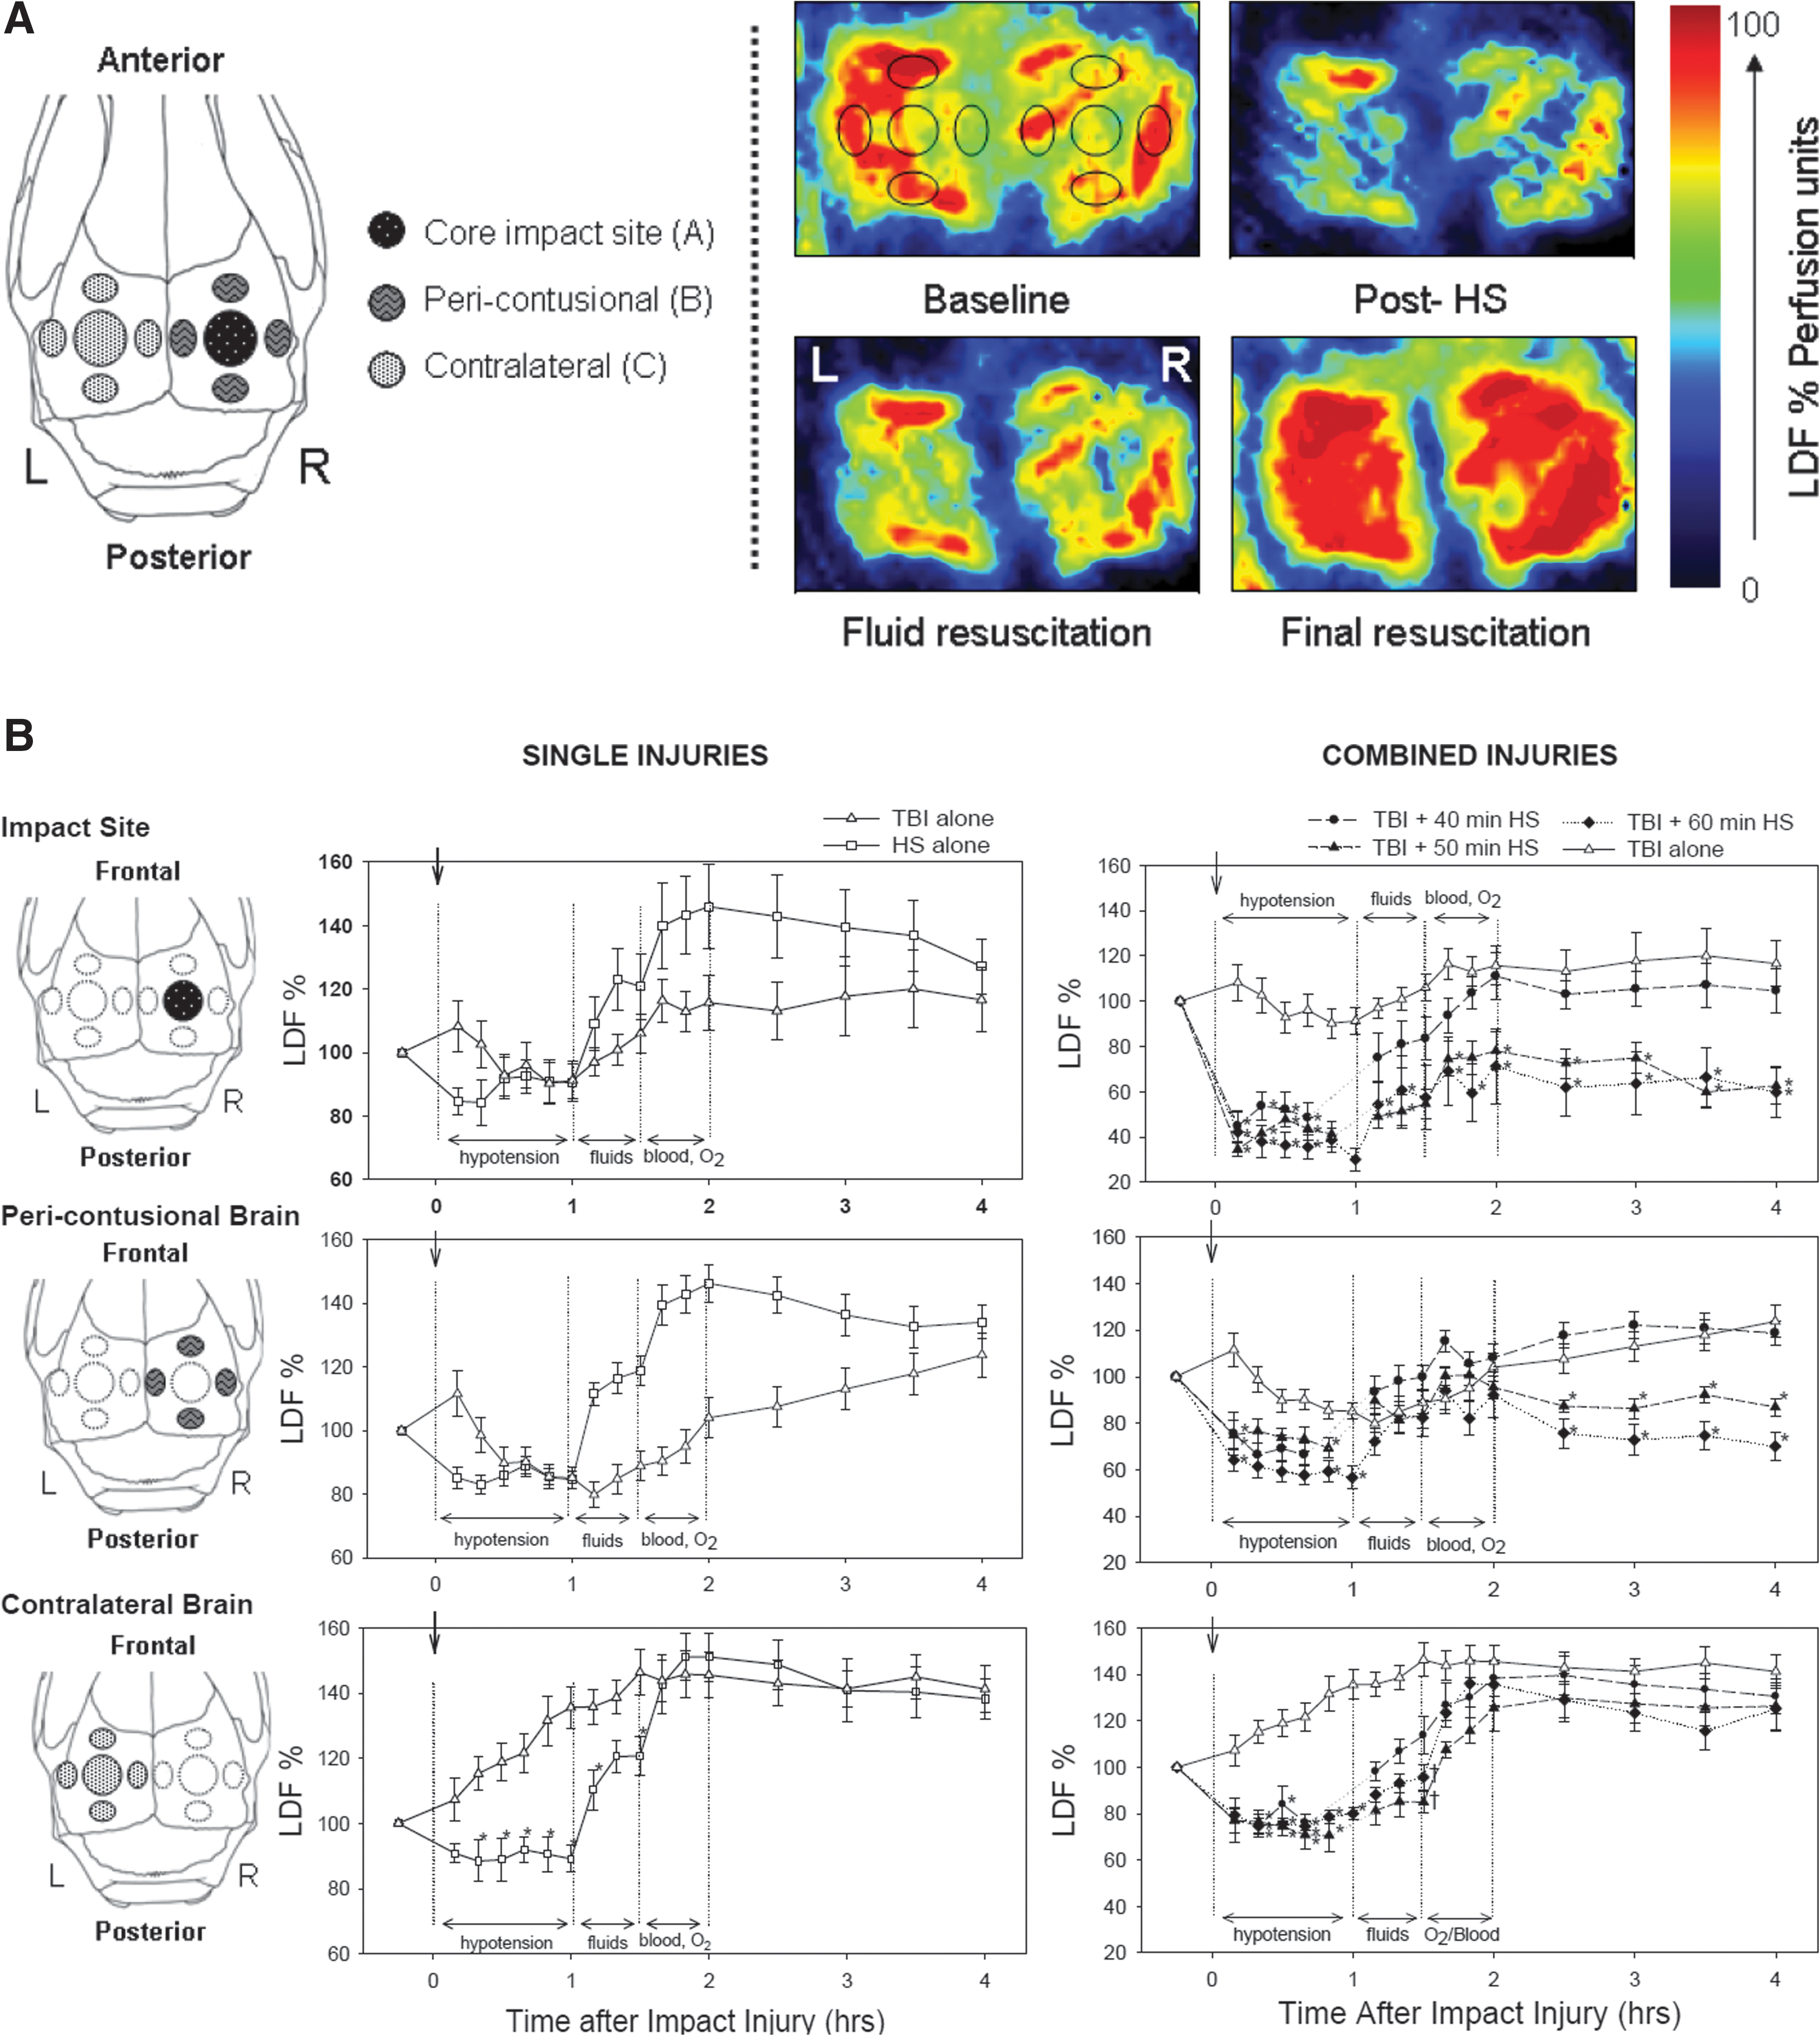
Following TBI and sham HS at the impact site and in pericontusional tissue, CBF transiently increased after the impact injury, decreased below baseline values during the sham hypotension period, and then recovered back to values that were equal to (in pericontusional brain) or slightly higher than baseline values (at impact site) with resuscitation. On the contralateral side, CBF increased following the TBI and sham HS and remained elevated for the duration of the monitoring period.
In the TBI complicated by HS injuries, CBF during the HS period was lowest at the impact site, compared to CBF in the pericontusional and contralateral brain. With resuscitation, CBF at the impact site recovered to baseline following 40 min of HS, but only partially recovered following 50 and 60 min of HS. In pericontusional brain, CBF recovered back to near baseline values in all of the HS groups following resuscitation, but the CBF recovery persisted only in the 40 min HS group. In the groups that underwent TBI followed by 50 and 60 min of HS, CBF fell again during the post-resuscitation monitoring period. In brain contralateral to the injury, CBF recovered to elevated levels with resuscitation in all combined injury groups.
Post-Injury recovery of reflexes
Following complete resuscitation, the animals that were followed for neurological recovery were allowed to awaken from anesthesia, and the duration of time required for the animals to recover reflexes were recorded (Table 2). Righting reflex, head support, and escape reflexes took significantly longer to recover in the animals that underwent 50 or 60 min of HS following the mild TBI. The other reflexes followed the same pattern but the differences were not significant.
HS, hemorrhagic shock.
=different from TBI + 60 min HS immediately after TBI.
=different from TBI + 50 min HS immediately after TBI.
Brain histology
Representative examples of the gross appearance of the brain at 2 weeks post-injury following each of the different injury groups are illustrated in Figure 3. The animals undergoing the single injury, either the TBI (3 m/sec, 2.5 mm deformation cortical impact injury) or the HS (60 min with MAP of 40 mm Hg), had minimal, if any, gross abnormalities. With the combined TBI and HS injuries, increasing the duration of HS from 40 to 60 min starting immediately post-injury resulted in proportionally larger contusion cavities at the impact site. Increasing the time delay between the TBI and the start of the 60 min of HS reduced the effects of the combined injury. The largest contusion cavities occurred when 60 min of HS occurred immediately after TBI.
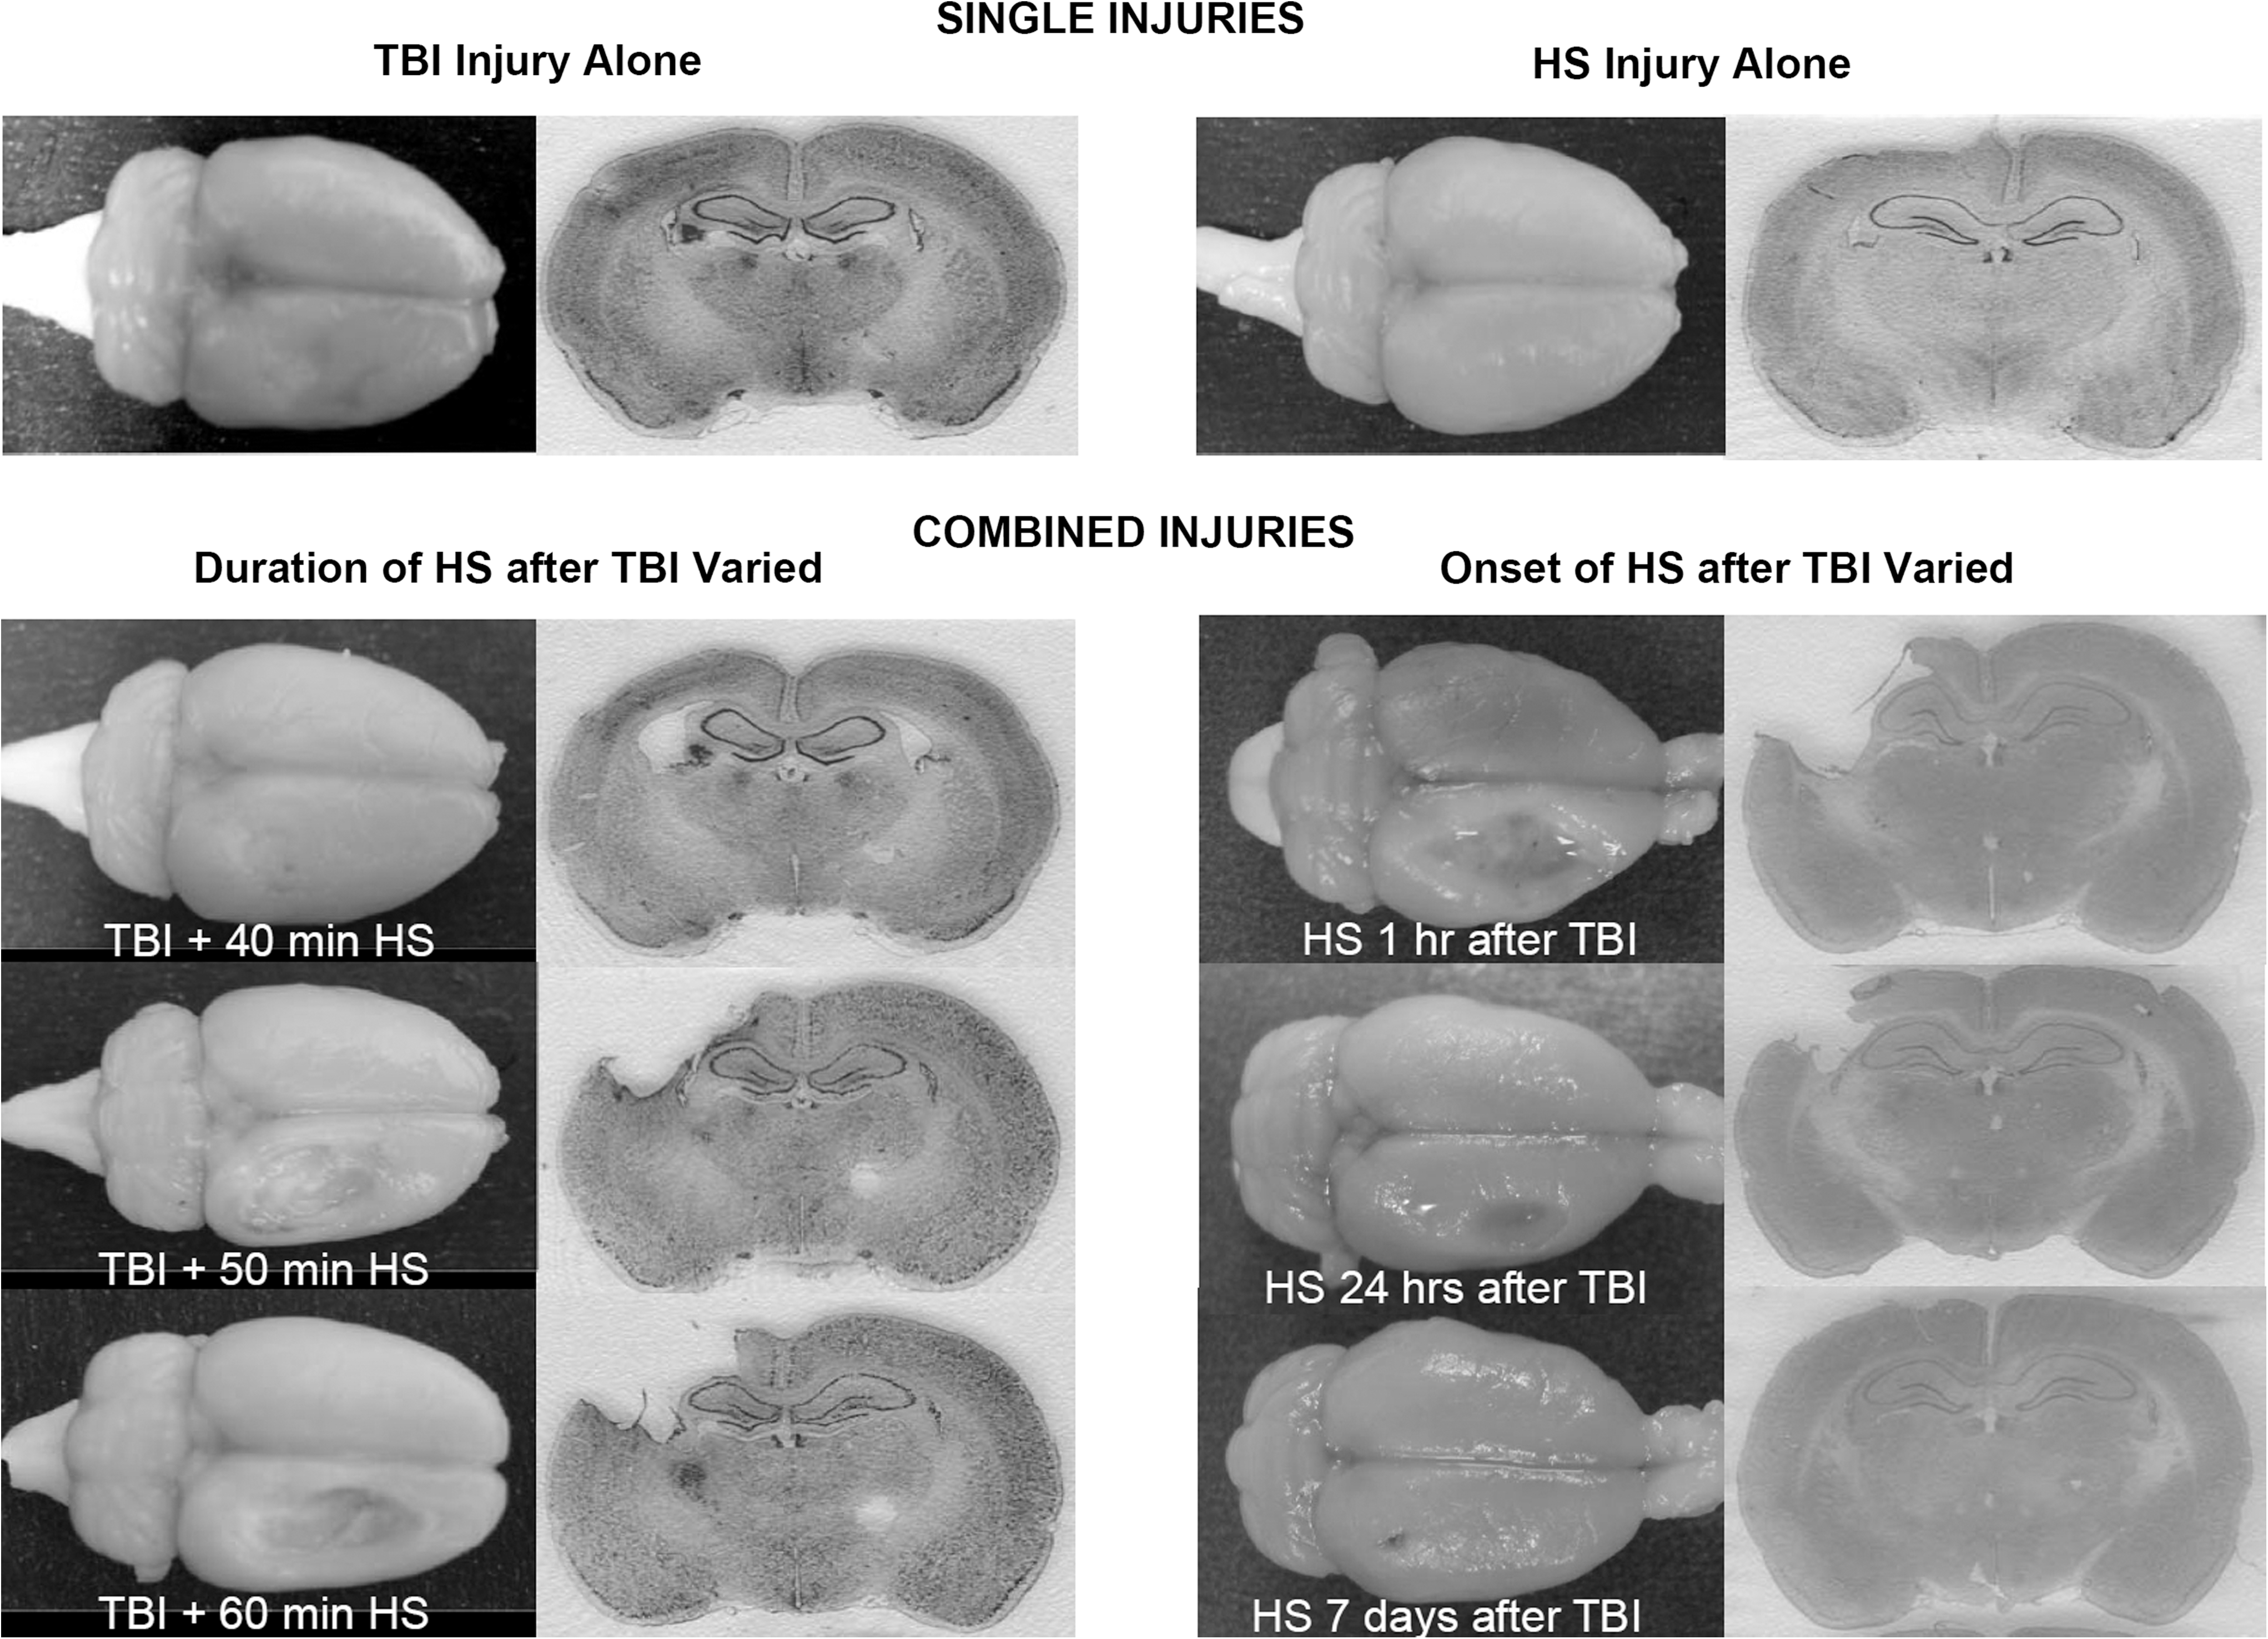
Representative images from 2 weeks post-injury showing the gross appearance of the brains undergoing the single injury of either TBI or hemorrhagic shock (HS), and the effects of varying the duration of HS as well as the time of the onset of the HS. The worst injury occurred when the HS followed the TBI immediately and at 1 h post-injury.
Contusion volume varied significantly by treatment group (p<0.001, Figure 4-top graph) in a pattern consistent with the gross appearance of injury shown in Figure 3. The TBI alone caused only a small contusion at the impact site, averaging 6.5±1.8 mm3. With the 60 min of HS, 14 (93%) of the 15 animals had no measurable contusion, and the remaining animal had only a small area of cortical damage at the craniectomy site for the sham injury.
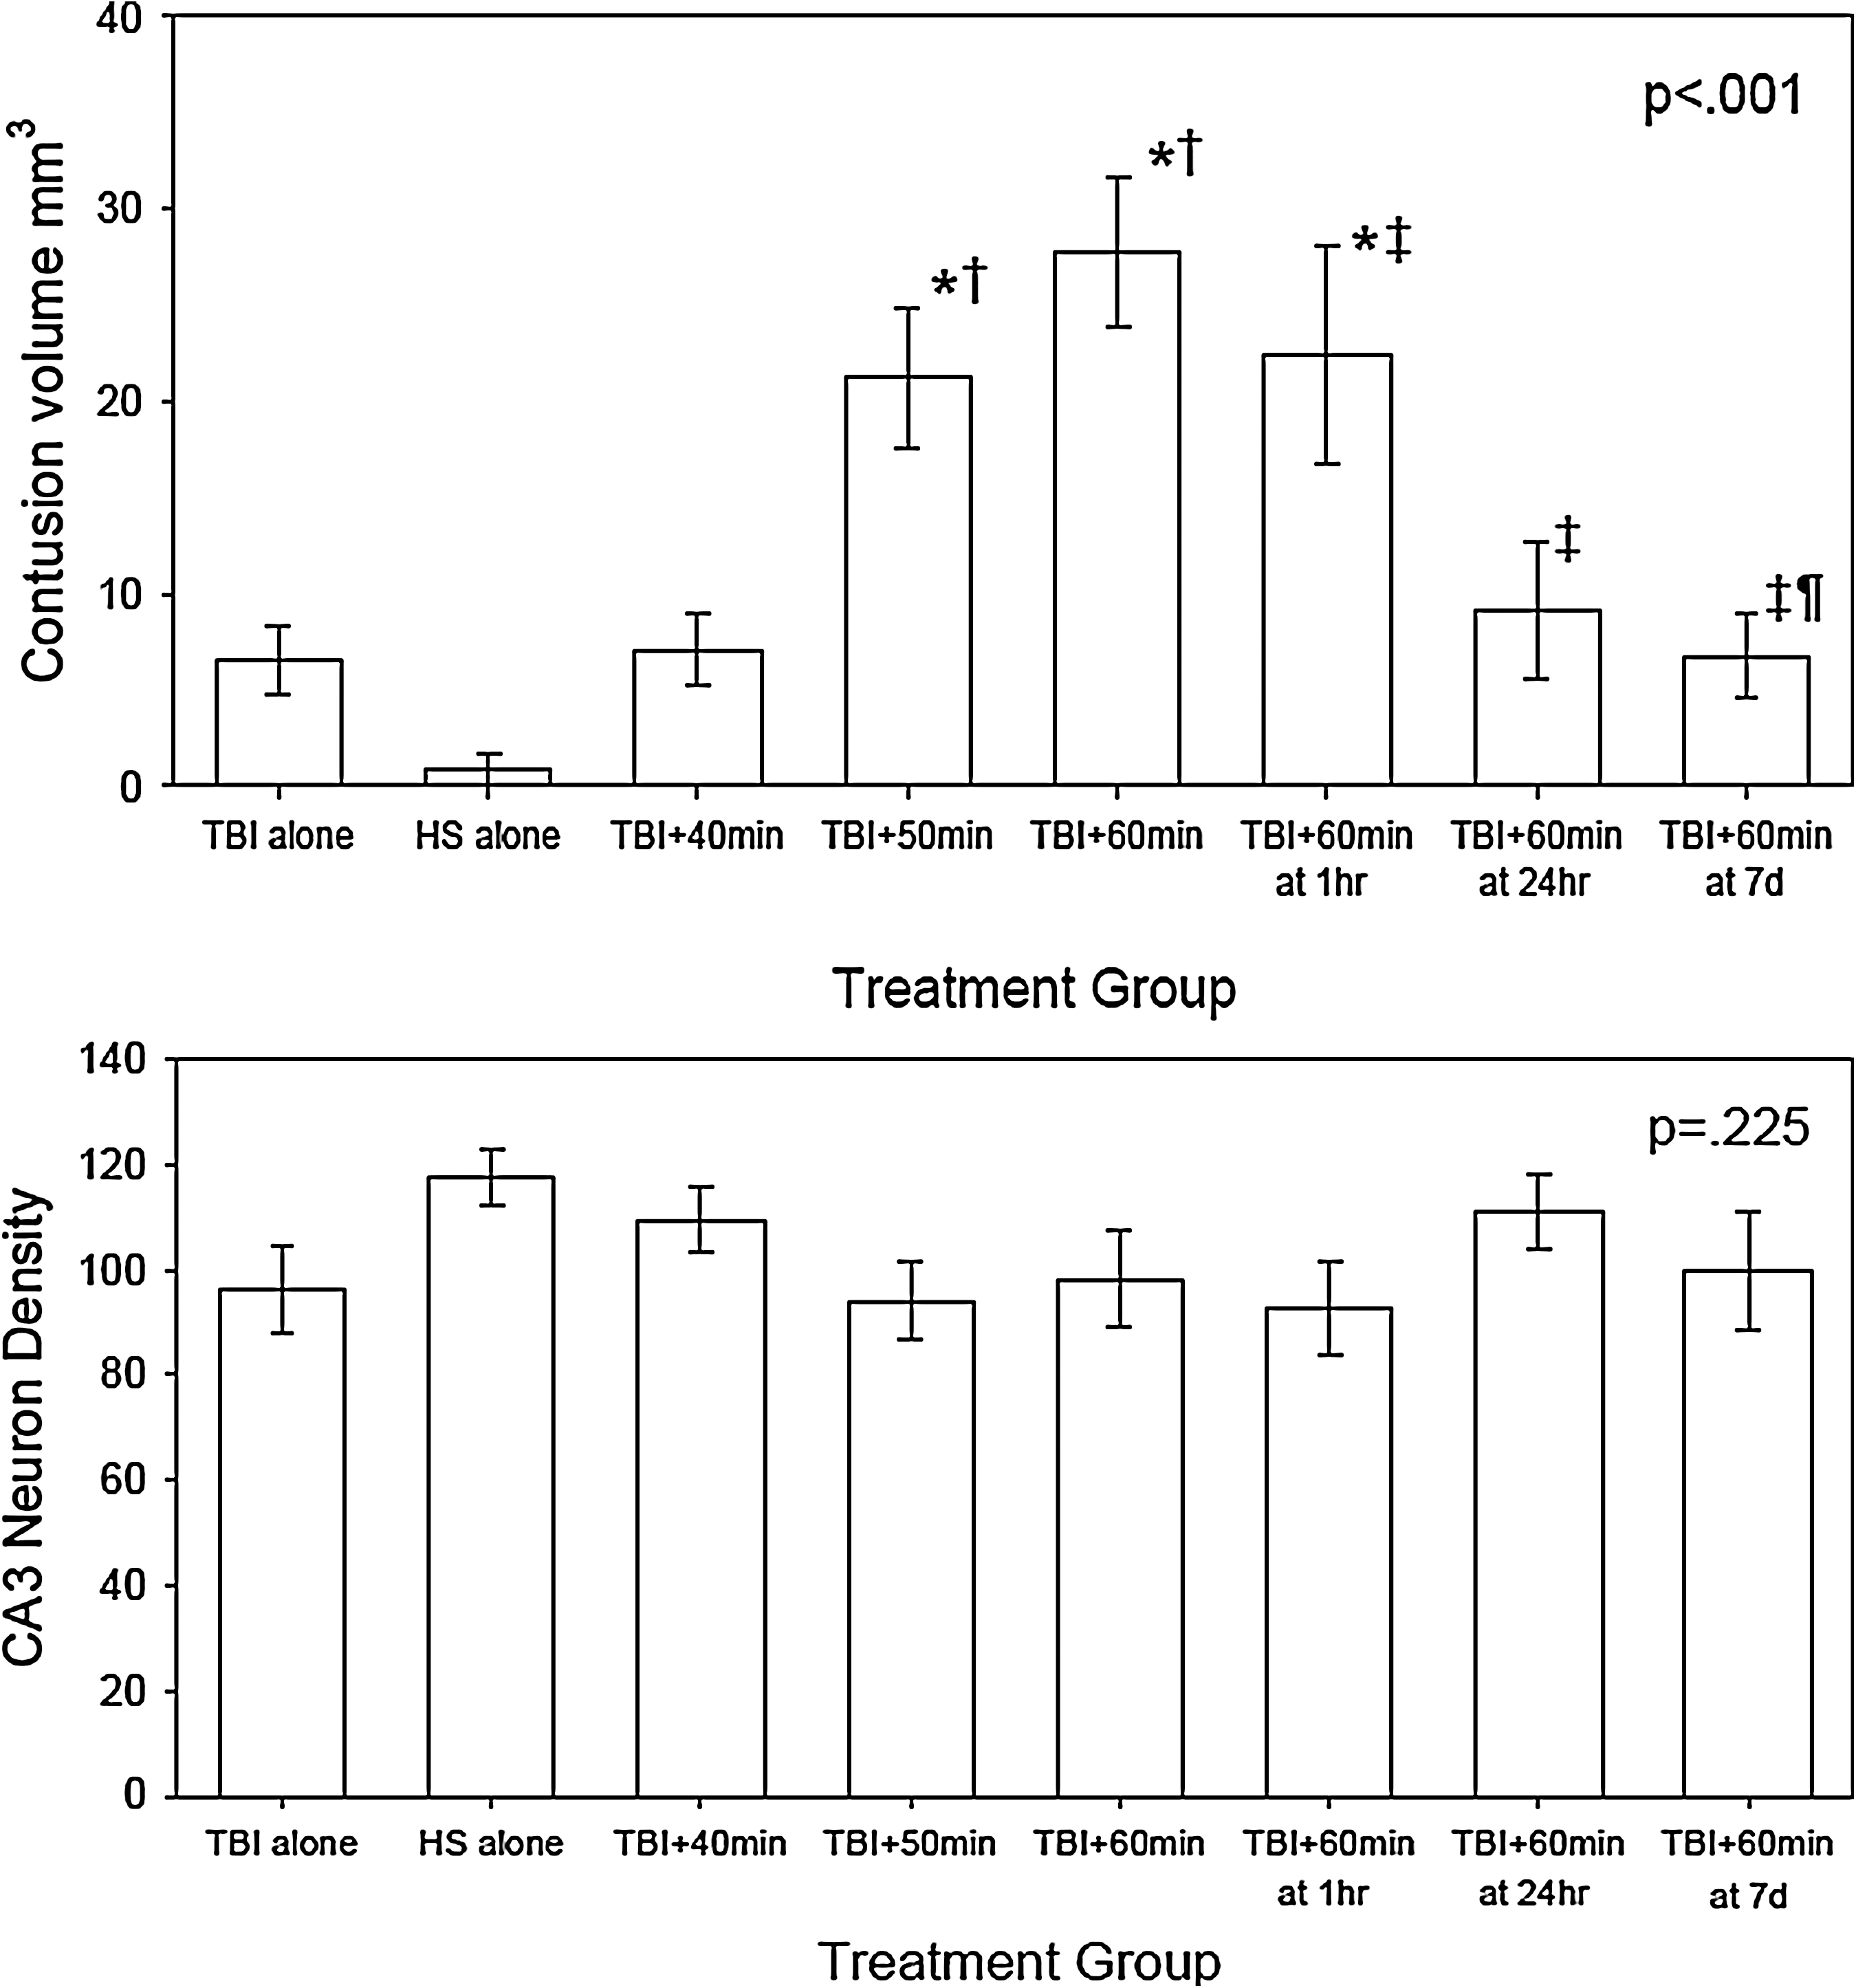
Contusion volume (top) and CA3 neuron density (bottom) at 2 weeks post-TBI complicated by hemorrhagic shock (HS). The contusion volume varied significantly by treatment group (p<0.001). Symbols indicate which values are significantly different by Holm–Sidak post-hoc test (*=different from both TBI alone and HS alone, †=different from TBI + 40 min HS, ‡=different from TBI + 60 min HS at 6 min, ¶=different from TBI + 60 min HS at 1h). The CA1 neuron density tended to be less in the TBI groups than in the HS-alone group, but the differences were not statistically significant (p=0.223).
Increasing durations of HS starting immediately post-injury caused increasingly larger contusion volumes. When 40 min of HS followed the TBI, a slightly larger contusion with a mean value of 7.1 mm3±1.8 occurred. Significantly larger contusion volumes were found in rats that underwent TBI followed by 50 and 60 min of HS. With the TBI followed by 50 min HS injury, the contusion volume was a mean value of 21.2±3.6 mm3. When 60 min of HS started immediately after the TBI, the mean contusion volume was even larger, averaging 27.1±3.9 mm3.
Increasing the duration of time between the TBI and the onset of the HS decreased the contusion volume. When 60 min of HS followed the TBI by 1 h, 24 h, and 1 week, the mean contusion volume was 22.4±5.6, 9.1±3.6, and 6.7±2.2 mm3 respectively.
The neuronal density in the CA3 region of the hippocampus (shown in Figure 4-bottom graph) tended to be less in the TBI groups than in the HS-alone group, but the differences were not significant (p=0.225).
Motor behavioral tasks
Beam balance and beam walking tasks were used as tests of motor function and coordination. All animals were pre-trained so that they were able to balance on the beam for 60 sec and were able to cross the beam in <5 sec. The results of the post-injury testing are shown in Figures 5 and 6.
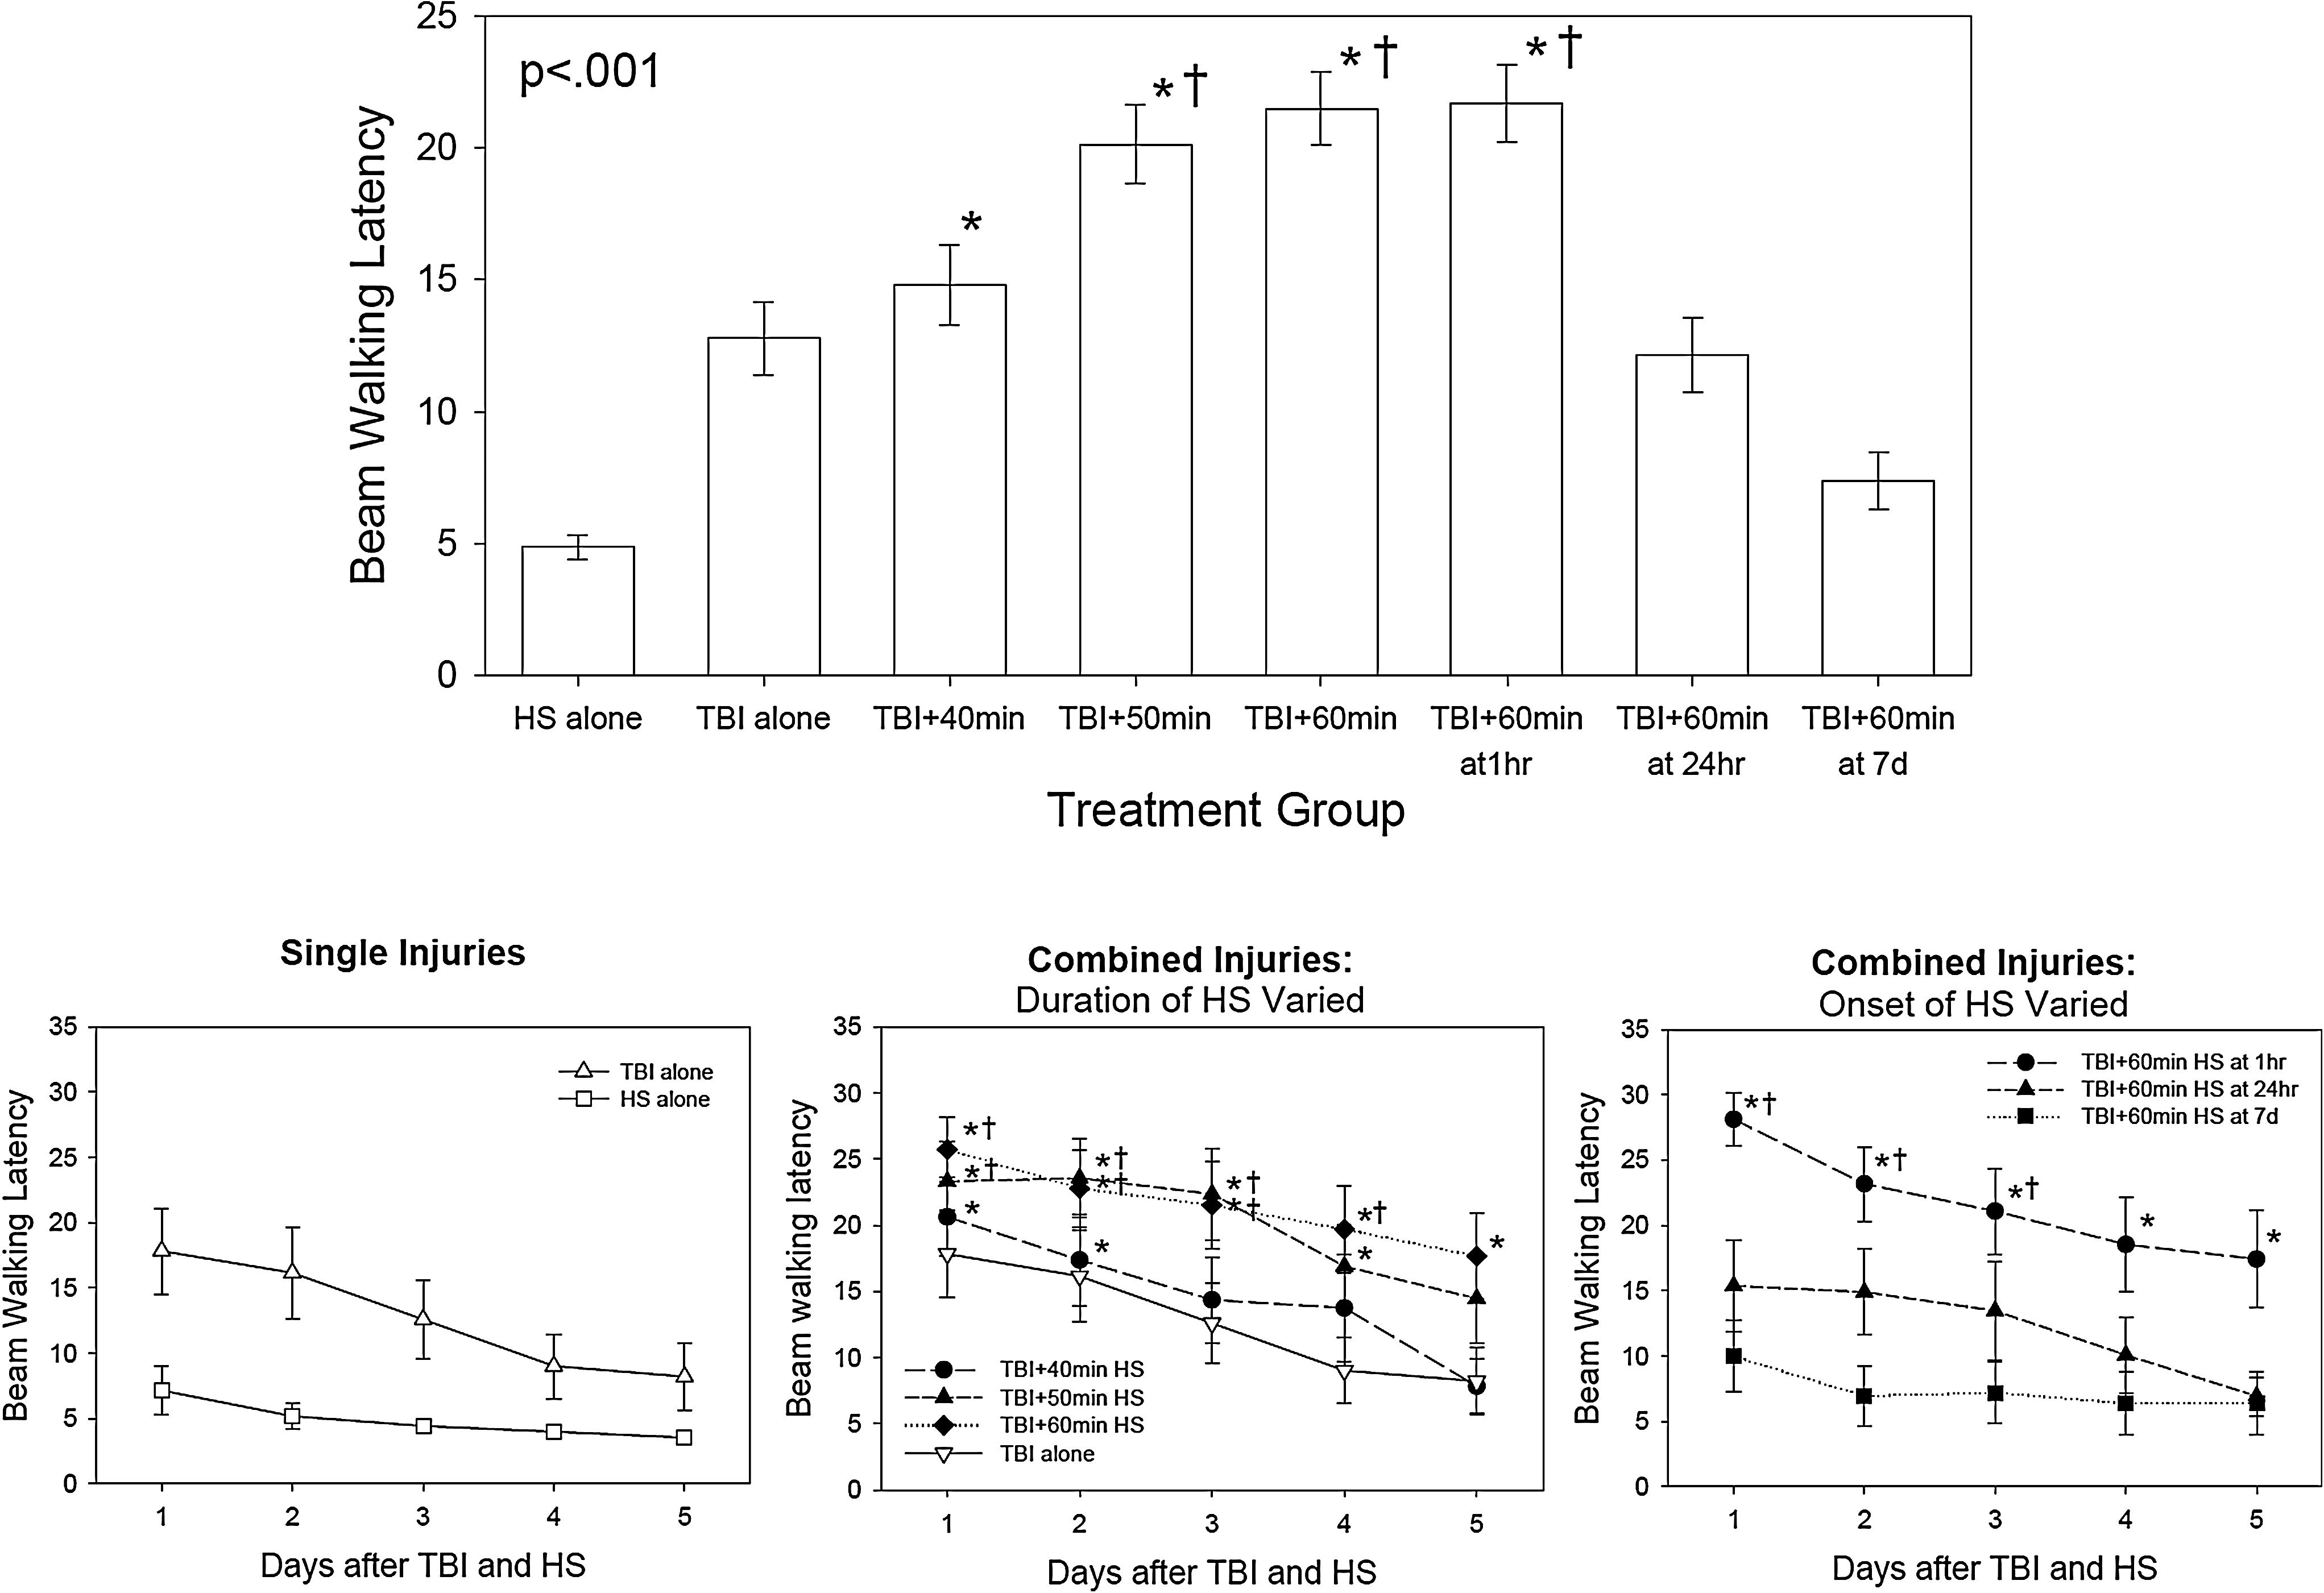
The beam walking test varied significantly by injury group and over time (injury group effect, p<0.001; time effect, p<0.001; group x time interaction, p=0.031). The top group shows the average latency on the beam over all 5 days of testing. The bottom graphs show the beam walking latency by day for each group, showing improvement in all groups over time. The symbols indicate which differences were significant by Holm–Sidak test (*=different from HS alone, †=different from both TBI + 60 min at 7days).
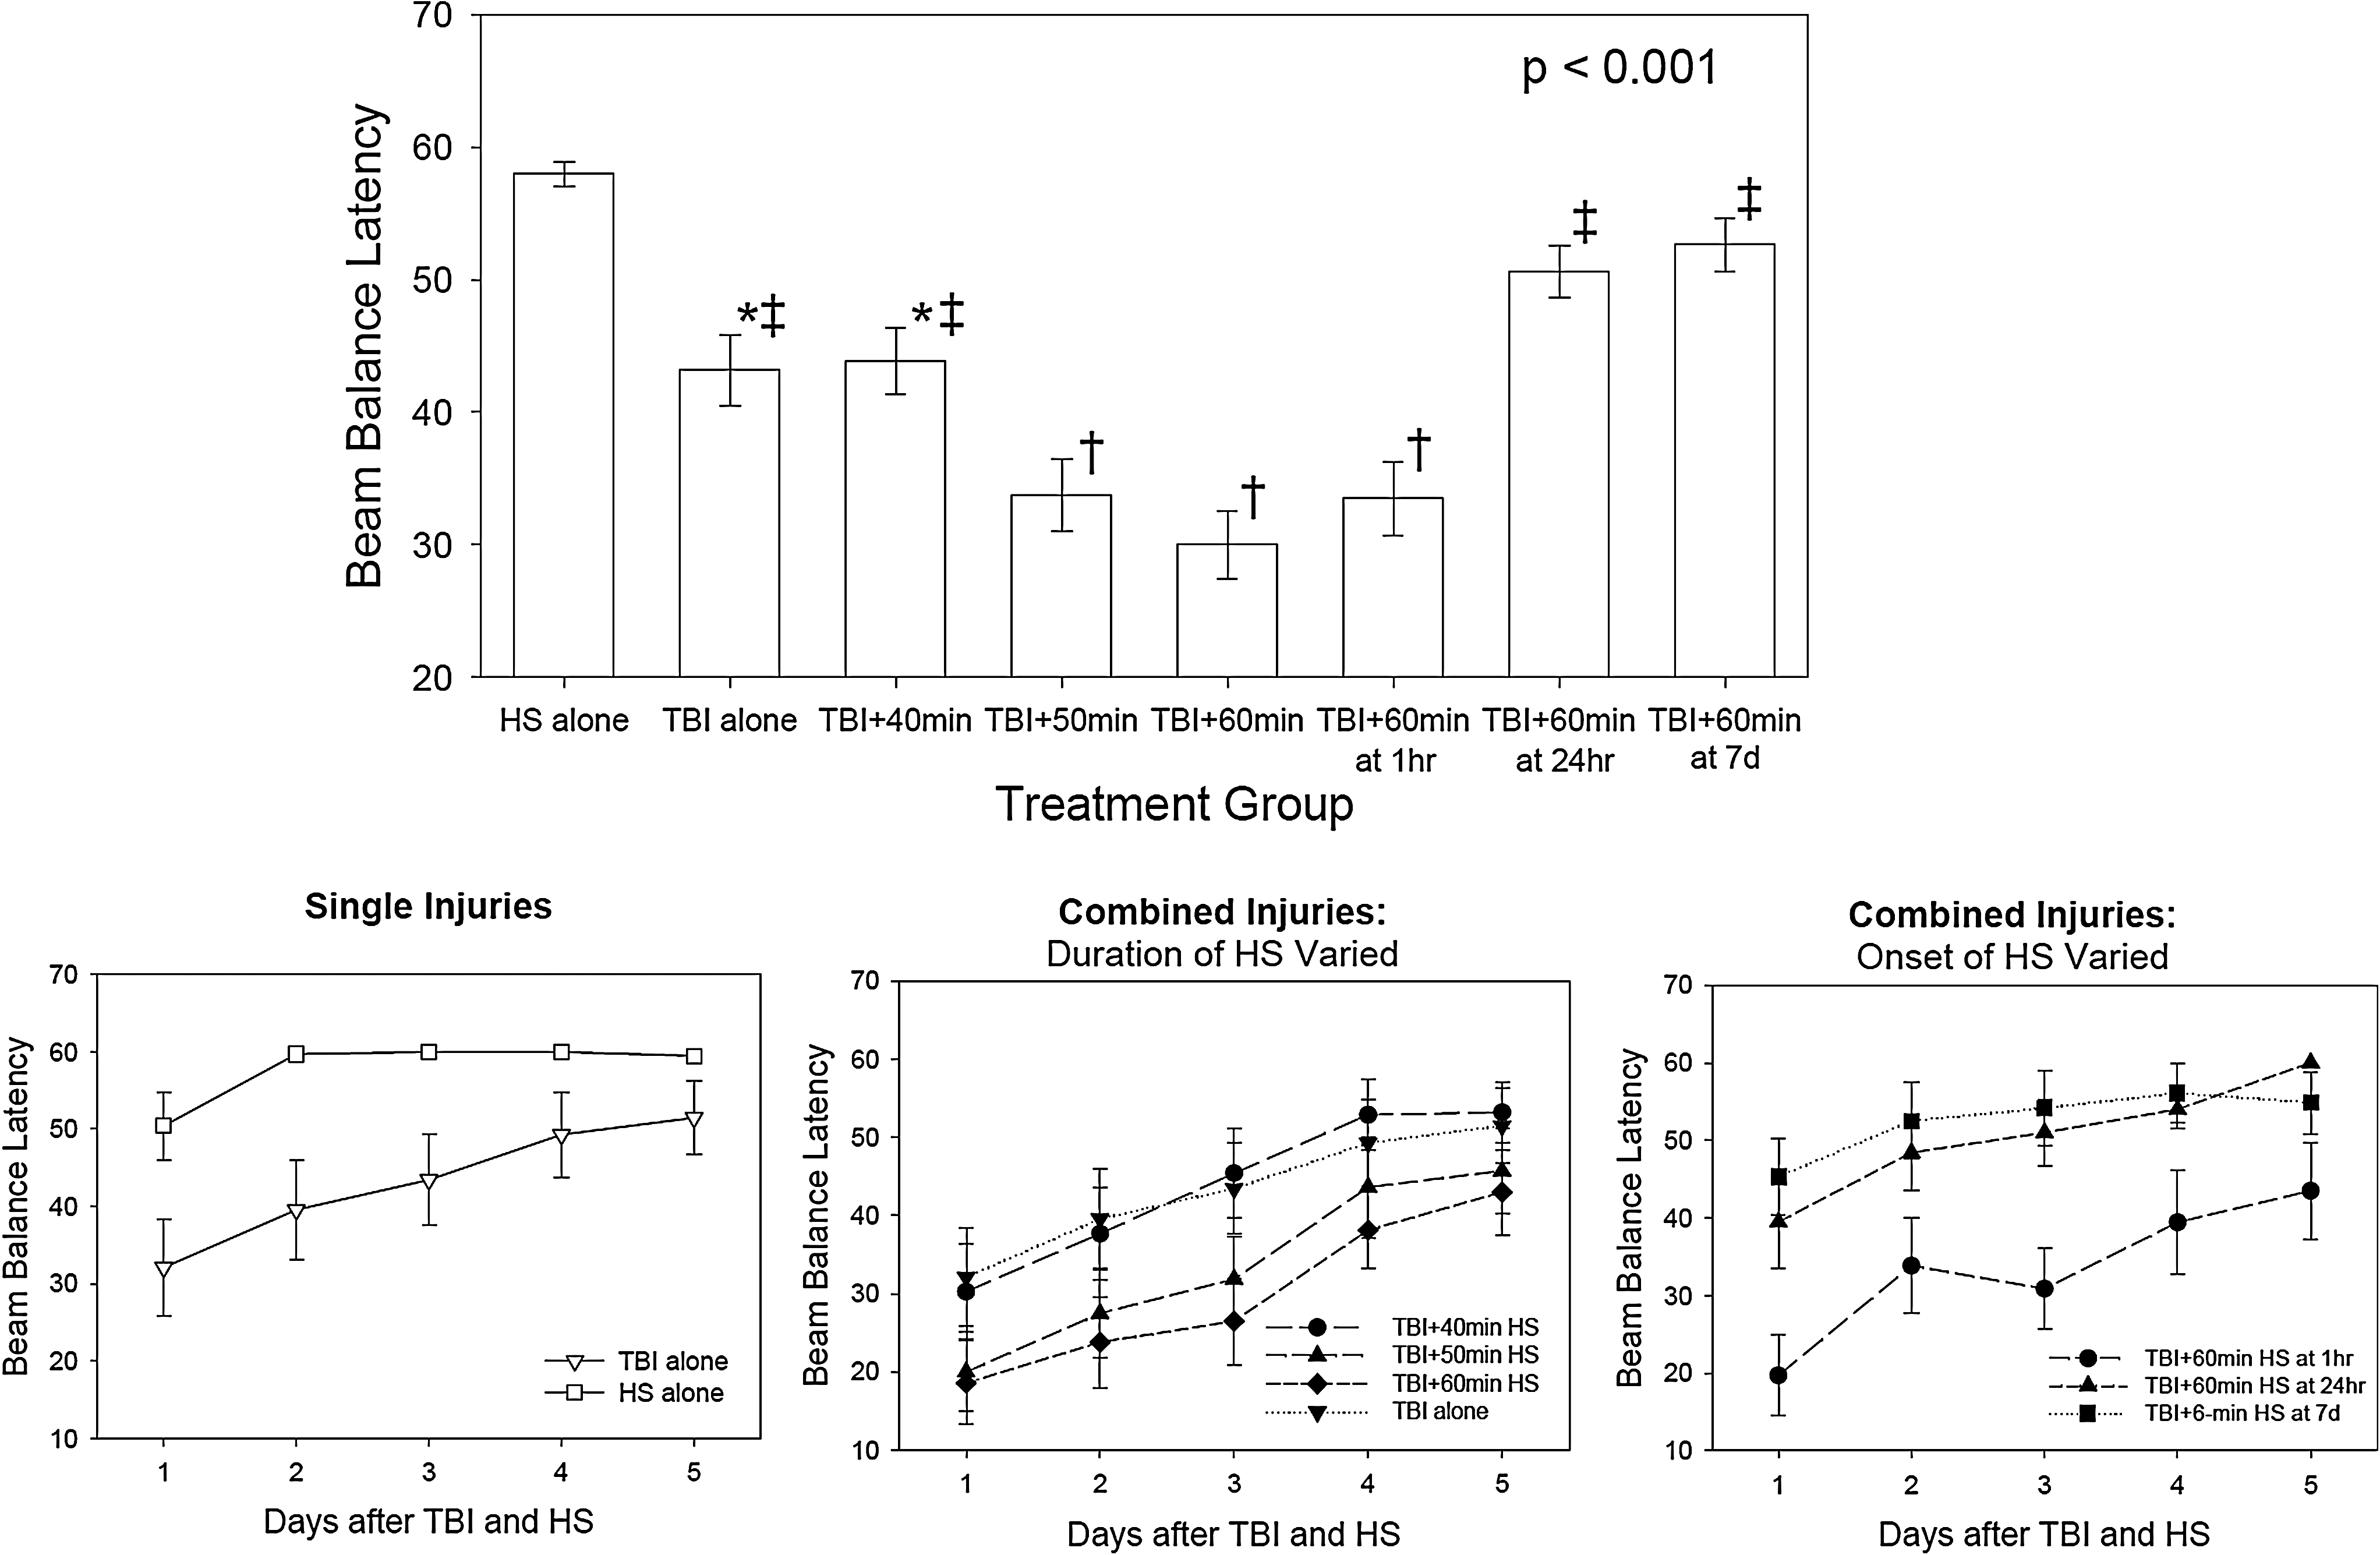
The beam balance test varied significantly by injury group and over time (injury group effect, p<0.001; time effect, p<0.001; group x time interaction, p=0.184). The top group shows the average latency on the beam over all 5 days of testing. The symbols indicate which differences were significant by Holm–Sidak test (*=different from HS alone, †=different from both TBI and HS alone, ‡=different from TBI + 50 min, TBI + 60 min at 5 min, and TBI + 60 min at 1 h). The bottom graphs show the beam balance latency by day for each group, showing improvement in all groups over time. None of the injury group differences on individual days were significantly different after adjustment for multiple comparisons.
Performance on the beam walking test (Figure 5) varied significantly by experimental group and over time (group effect, p<0.001; time effect, p<0.001; group x time interaction, p=0.031). The animals that underwent the HS alone performed close to their pre-injury level on all post-injury days. The animals that underwent the TBI alone and those that had the TBI complicated by HS had impaired performance on day 1, which improved over time. In the animals that had increasing durations of HS imposed immediately post-injury, the impairment was related to the duration of the HS, with the worst performance occurring in the animals undergoing 60 min of HS after the TBI. In the animals that had delay of the HS for 1 h to 7 days post-injury, the performance on the beam walking test was inversely related to the length of the delay, with the best performance occurring when the HS occurred 7 days after the TBI. These animals tended to have even better performance than those with the TBI alone, perhaps because they had an additional 7 days for the motor function to recover after the TBI.
Performance on the beam balancing test (Figure 6) varied significantly by experimental group and over time (group effect, p<0.001; time effect, p<0.001; group x time interaction, p=0.184). Some animals that underwent the HS alone had mild impairments on the balance beam on day 1, but they were all able to balance on the beam for 60 sec on days 2–5. The animals that had the TBI alone and the TBI followed by 40 min of HS had moderate impairments on the beam balancing test that improved over time, whereas the animals that had the TBI followed by 50 and 60 min of HS had more severe impairments that improved over time but were not back to baseline by the end of the 5 days of testing. The average beam balancing times for the 50 min and 60 min HS following TBI were 33.7±2.7 and 30.0±2.6 sec, respectively. For the animals in which 60 min of HS was delayed for various time intervals, the performance was improved with the delays that were >1 h post-injury. Unlike on the beam walking task, the animals with the 7-day delay for the HS had mildly impaired performance on the beam balance test even though they had an additional 7 days for motor recovery to occur following the TBI.
Morris water maze
The length of time required for the animals to find the platform was greatest on day 11 and improved significantly over time in all injury groups. Increasing the duration of HS resulted in a longer latency to find the platform (injury group effect, p=0.0174; time effect, p<0.001; time x group interaction, p=0.0991). By day 15, the latency was 10.9±1.1 and 9.9±1.2 sec for the TBI-alone and the HS-alone groups, respectively. With the combined injuries, the latency was 8.7±1.0, 19.6±3.9, and 20.3±4.0 sec for the animals with mild TBI followed by 40, 50, and 60 min of HS, respectively. There was no significant difference in the latency to find the platform when the length of time between the TBI and the onset of the HS was varied from 1 h to 7 days post-injury (injury group effect, p<0.3305; time effect, p<0.001; time x group interaction, p=0.5122).
For the probe trial on day 15, the percent time spent swimming in the quadrant that previously contained the platform was significantly related to the injury group (p=0.0020) in the animals for which the duration of the HS was varied, with the highest percentage occurring in the HS-alone group and the lowest percentage occurring in the TBI followed by 60 min HS group. In the animals for which the length of time between the TBI and the onset of the HS was varied, the animals having the HS at 7 days post-injury spent significantly more time swimming in the platform quadrant than did the animals having the HS 1 h and 24 h post-injury (p=0.013). There was no difference in the time to find the platform during the visible platform test, nor was there a difference in swim speed among the groups.
Discussion
Cerebrovascular pathology following human mild TBI
Mild TBI is defined as a blow or jolt to the head that disrupts the function of the brain. This disturbance of brain function is typically associated with normal structural neuroimaging, although a related clinical syndrome called complicated mild TBI allows there to be structural abnormalities on the CT scan as long as the clinical features are consistent with mild TBI. Clinical features of mild TBI include a Glasgow Coma Scale score of 13–15, loss of consciousness for <30 min, and post-traumatic amnesia for <24 h. Signs and symptoms of mild TBI include physical, cognitive, emotional, and/or sleep-related abnormalities. Most patients with mild TBI recover within weeks to months without any specific treatment. However a subgroup of patients with mild TBI experience persistent disabling symptoms. These human manifestations of mild TBI are difficult to reproduce accurately in an animal experimental model because of the nature of the symptoms and because the findings are transient in the majority of patients.
One clinical feature of mild TBI that is underappreciated is the ability of a mild impact to reduce CBF and to impair pressure autoregulation, thereby causing the injured brain to be susceptible to further damage from hypotension. Serial measurements of dynamic pressure autoregulation have shown persistently impaired autoregulatory responses to hypotension in the majority of patients with severe TBI for up to 10 days after injury (Hlatky et al., 2002). These vascular changes are well known after more severe TBI, and hypotension, as well as other forms of secondary insult, have been recognized to contribute to a worse neurological outcome in patients with severe TBI (Butcher et al., 2007; Chesnut et al., 1993; Marmarou et al., 1991; Miller et al., 1978, 1982).
Only a few studies have examined CBF acutely in mild TBI patients; however, regional perfusion abnormalities have been observed commonly using a variety of imaging techniques. In 76 mild TBI patients with a normal CT scan who were studied within a few hours of injury (average time 3.9 h post-injury), mean transit time measured by CT perfusion imaging was significantly lower in frontal regions of the brain, and cerebral blood volume (CBV) was decreased in occipital regions compared to normal controls (Metting et al., 2009). The patients in this study who had persistent problems evidenced by an Extended Glasgow Outcome Scale score of <8 at 6 months post-injury, had significantly lower CBF and CBV in frontal brain regions on the early CT perfusion study, compared to the patients who recovered completely. Using single-photon emission CT (SPECT) perfusion imaging in patients with mild TBI and a normal CT scan, regional perfusion abnormalities are common, usually in frontal regions of the brain, and have been correlated with findings of amnesia, loss of consciousness, and post-concussion symptoms (Abdel-Dayem et al., 1998; Audenaert et al., 2003; Gowda et al., 2006; Lorberboym et al., 2002). In contrast, other studies using stable xenon CT imaging, have reported focal hyperemia acutely in mild TBI patients with amnesia (Nariai et al., 2001). Focal hyperemia might result from impaired autoregulation. Junger and associates (1997) studied dynamic pressure autoregulation in a group of 29 patients with mild TBI, defined as a Glasgow Coma Score of 13–15, and found that 28% had impaired or absent pressure autoregulation. However, these were not serial measurements, and the time course of alterations in pressure autoregulation after mild TBI are not well characterized.
Choice of experimental model and injury parameters
The goal of this study was to model this clinical feature of mild TBI. The results demonstrated that immediately after the impact injury, the brain at and surrounding the impact site is less able to maintain CBF during a period of hypotension and CBF recovered less completely with full resuscitation. Associated with this impaired perfusion, the contusion resulting from the combined TBI and hypotensive injury was increased proportional to the duration of the hypotension. This susceptibility to hypotension was limited in location to the impacted brain, and was limited in time to the early post-injury period.
The cortical impact injury model in rats was chosen for the study because it has several features of human TBI and the severity of injury can be easily controlled (O'Connor et al., 2011). A number of different TBI experimental models, including cortical impact injury, fluid percussion injury, and impact-acceleration injury, have been reported to result in vascular changes that cause vulnerability to hypotension and other secondary ischemic insults (Dennis et al., 2009; DeWitt et al., 1992a,b; Feldman et al., 1997; Fritz et al., 2005; Kroppenstedt et al., 1999; Matsushita et al., 2001). Most of these previous studies, however, have been conducted using moderate-to-severe injury models. Relatively few studies, however, have examined vascular changes in mild TBI experimental models.
The status of pressure autoregulation following experimental TBI varies with the model. Even after severe (5 m/sec, 3 mm deformation) cortical impact injury, myogenic response in middle cerebral arteries has been observed to be altered but still present (Golding et al., 1998). In contrast, after moderate (2 atm) fluid percussion injury, myogenic response in middle cerebral arteries was found to be reduced for at least 30 min post-injury (Mathew et al., 1999). The myogenic response, however, is only one aspect of the complex regulatory response to changes in blood pressure. The CBF changes in the current study suggest that impaired pressured autoregulation plays some role in the worsening injury at least at the impact site and in pericontusional brain.
Following moderate (1.94–2.18 atm) parasagittal fluid percussion injury, Matsushita and associates (2001) showed that hypotension (60 mm Hg) for 30 min induced 5 min after injury significantly reduced regional CBF (rCBF) in posterior parietal cortex and increased contusion volume. Another group found that 30 min of hypotension (50–60 mm Hg) induced 5 min following a moderate (2.6–2.8 atm) fluid percussion injury did not alter lesion volume but delayed recovery of performance on the Morris water maze task (Schutz et al., 2006). Using an impact acceleration model (450g weight drop from 1.8 m), Geeraerts and associates (2008) emphasized the importance of the timing of the hypotensive event after trauma. When hypotension (40 mm Hg) and hypoxia (Fi
With cortical impact injury, the severity of the injury can be adjusted by altering the velocity and duration of the impact, as well as the deformation of the brain during the impact. With an impact velocity of 5 m/sec, increasingly larger contusion volume, hippocampal neuronal loss, and disturbances of CBF are seen with brain deformation of 2, 2.5, and 3 mm (Cherian et al., 1994; Goodman et al., 1994). With a constant 2.5 mm brain deformation, impact velocities of 1, 3, and 5 m/sec result in smaller incremental increases in contusion volume (Goodman et al., 1994). The 5 m/sec, 3 mm deformation impact causes severe injury, the 5 m/sec, 2.5 mm deformation impact causes moderate injury, and the remaining combinations of velocity and deformation cause a milder degree of injury.
The level of the impact injury used for the current study was known from previous investigations to produce a minor contusion at the impact site (Cherian et al., 1996), but a significant transient reduction in rCBF in the area of the impact. In parietal motor cortex at 100 min after a 2.5 mm deformation, 3 m/sec impact injury, rCBF was 53±24 mL/100g/min on the impacted side, compared to 292±40 mL/100g/min on the uninjured side (Giri et al., 2000). CBF in the underlying hippocampus was also significantly reduced on the impacted side, but not to the same degree as in the cortex. Bilateral carotid occlusion, which reduces the perfusion pressure to the brain, resulted in significant expansion of this mild impact injury (Cherian et al., 1996).
For human mild TBI, loss of consciousness is>30 min. In animal models of TBI, loss of the righting reflex has been used as a sign analogous to loss of consciousness in humans (Henninger et al., 2005). The length of time to recover this reflex correlates with later performance on behavioral tasks and with histological outcome (Morehead et al., 1994; Schmidt et al., 2000). The average duration of loss of the righting reflex that has been considered consistent with a mild experimental injury has varied the injury model, but ranges from 3.3 to 11.4 min (Henninger et al., 2005; Hosseini et al., 2009). The anesthetic technique also probably plays some role in this variability, as anesthesia can confound this determination. The righting reflex in the current study fits within this range reported in the literature for mild TBI, but is not completely analogous to these other studies, because it was not measured as the time from the impact injury but rather as the time from the combined impact followed by HS. However, the righting time measured from the time of uncomplicated cortical impact injury (3 m/sec, 2.5 mm deformation) is similar to that observed with the mild TBI with the sham HS group in the current study (Robertson, unpublished data).
Although this level of impact injury is not completely free of structural injury at 2 weeks post-injury, it did not cause hippocampal neuronal loss and it has the behavioral characteristics of a mild injury. Because of the small cortical contusion that develops over time, this injury may be more analogous to the human syndrome of complicated mild TBI.
The level of hypotension chosen for the current study was based on previous findings by others suggesting that a MAP of 40 mm Hg was tolerated by normal animals (Carrillo et al., 1998), but seemed to be a threshold for survival of neurons after TBI (Dennis et al., 2009; Kroppenstedt et al., 1999). Increasing duration of hypotension resulted in increasingly more severe expansion of the cortical contusion and more severe motor deficits, but hippocampal neurons were not significantly impacted. In a recent study using mice undergoing cortical impact injury, hemorrhagic hypotension for 90 min was required to induce a reduction in neuron density in the CA1 region of the hippocampus (Dennis et al., 2009). It is possible that extending the duration of hypotension beyond 60 min might have resulted in more severe hippocampal injury and more severe deficits on the Morris water maze task.
The detrimental effects of hypotension on outcome were greatest when the onset was very soon after injury (immediately or at 1 h post-injury). When the hypotension occurred at 24 h or 7 days post-injury, the histological and behavioral outcomes were similar to those for the animals undergoing only the TBI. This finding was similar to results in other TBI models, such as impact-acceleration and fluid percussion (Geeraerts et al., 2008).
Limitations of the study
Some limitations to the methods that might have affected the outcome of the study include the decision to use supplemental oxygen during the final resuscitation period, the choice of lactated Ringer's as the resuscitation fluid, and the choice of isoflurane as the anesthetic.
An Fio2 of 1.0 was used to ventilate the animals during the final resuscitation period when the shed blood was re-infused. This choice was made to make the final resuscitation period more comparable to what might happen to a patient who is resuscitated in a hospital emergency center. There could be both beneficial effects in terms of improved oxygen delivery as well as detrimental effects of increased oxygen radical formation with ventilation using supplemental oxygen. With uncomplicated TBI, some studies have shown increased oxidative damage with hyperoxia (Ahn et al., 2008). In animals that were incompletely resuscitated from HS, however, hyperoxia increased survival (Meier et al., 2004). The risk/benefit of supplemental oxygen may depend upon the actual circumstances of the injury and the resuscitation. And the results of the present study might have been different if supplemental oxygen had not been part of the resuscitation protocol.
Lactated Ringer's solution was used as the initial resuscitation fluid prior to re-infusion of the shed blood. Alternate choices might have been albumin, synthetic colloid solutions, or hypertonic saline (Baker et al., 2008; Exo et al., 2009; Sell et al., 2008). Each of these solutions have some potential advantages for a TBI patient, but none have been shown to be clearly superior to crystalloid solutions in clinical practice (Bulger et al., 2010, 2011;Cooper et al., 2004; Myburgh et al., 2007).
Isoflurane was used for anesthesia throughout the injury-hypotension paradigm, and baseline and resuscitation blood pressures were somewhat lower than normal as a result. Isoflurane reduces cerebral metabolic demands, provides some degree of CBF promotion (particularly in subcortical structures), and is neuroprotective after TBI (Statler et al., 2000). The findings might have been different if another anesthesia had been used.
Conclusion
In summary, these studies demonstrate that mild TBI can induce vascular changes that can make the injured brain more susceptible to hypotension. Meticulous attention to blood pressure in the care of patients with mild TBI may be just as important as with patients who have sustained a more severe TBI.
Footnotes
Acknowledgments
This work was funded by United States Army Award numbers W81XWH-08-2-0132 (C.S.R.) and W81XWH-08-2-0150 (R.J.G.).
Author Disclosure Statement
No competing financial interests exist.