
Abstract
Diffusion tensor imaging (DTI) is rarely applied in spinal cord injury (SCI). The aim of this study was to correlate diffusion properties after SCI with electrophysiological and neurological measures. Nineteen traumatic cervical SCI subjects and 28 age-matched healthy subjects participated in this study. DTI data of the spinal cord were acquired with a Philips Achieva 3 T MR scanner using an outer volume suppressed, reduced field of view (FOV) acquisition with oblique slice excitation and a single-shot EPI readout. Neurological and electrophysiological measures, American Spinal Injury Association (ASIA) impairment scale scores, and motor (MEP) and somatosensory evoked potentials (SSEP) were assessed in SCI subjects. Fractional anisotropy (FA) values were decreased in the SCI subjects compared to the healthy subjects. In upper cervical segments, the decrease in FA was significant for the evaluation of the entire cross-sectional area of the spinal cord, and for corticospinal and sensory tracts. A decreasing trend was also found at the thoracic level for the corticospinal tracts. The decrease of DTI values correlated with the clinical completeness of SCI, and with SSEP amplitudes. The reduced DTI values seen in the SCI subjects are likely due to demyelination and axonal degeneration of spinal tracts, which are related to clinical and electrophysiological measures. A reduction in DTI values in regions remote from the injury site suggests their involvement with wallerian axonal degeneration. DTI can be used for the quantitative evaluation of the extent of spinal cord damage, and eventually to monitor the effects of future regeneration-inducing treatments.
Introduction
C
Methods
Subjects
All procedures complied with the principles of the Declaration of Helsinki and were approved by the Institutional Review Boards of Zurich University. Nineteen traumatic SCI subjects (level of lesion C3–C8, mean age 59.7 years, time since injury 2 months to 8 years, mean 32 months) and 28 healthy subjects (mean age 58 years) participated in this study. Control subjects had no history of neurological illness. Fourteen SCI subjects had vertebral fixation which substantially deteriorated image quality. Therefore only DTI measurements above and below the level of lesion were used. Subjects with SCI and healthy subjects were age- and sex-matched. Table 1 shows the characteristics of the chronic SCI subjects.
M, male, F, female; AIS, American Spinal Injury Association impairment scale; m, months; AIS A, motor-sensory complete; AIS B, motor complete, sensory incomplete; AIS C, motor-sensory incomplete; AIS D, motor-sensory incomplete; MRI, magnetic resonance imaging; SSEP, somatosensory evoked potential; MEP, motor evoked potential.
MR imaging
MRI of the spinal cord was performed on a 3 T Philips Achieva (Philips Healthcare, Best, The Netherlands) system. No upgrade of the MR system or other changes in the software and hardware of the MR system were undertaken during the study. For image acquisition, a dedicated spinal coil array with 6 coil elements along the spinal cord was used. The standardized imaging protocol included: sagittal T2-weighted images (TR=3352 msec, TE=120 msec, flip angle=90°, field-of-view [FOV]=270×259 mm2, slice thickness=3 mm, number of slices=11) along the entire spinal cord; DTI data were obtained at the cervical (C2–C5) and thoracic (T5) levels, as well as at the lumbar enlargement (LE) of the spinal cord (Fig. 1). To account for the relatively large slice thickness, the imaging stack was carefully aligned perpendicular to the spinal cord to avoid sub-voxel effects. The scan time for each level was approximately 10 min. In each region six transverse slices were acquired using a DW single-shot spin-echo EPI sequence on a reduced FOV (Wilm et al., 2007,2009; NEX=6/12 for b=0/b=750 sec/mm2, acquisition matrix=176×44, FOV=120×30 mm2, TR=4000 msec, TE=49 msec, 60% partial Fourier acquisition, slice thickness=5 mm, in-plane resolution=0.7 mm2). After image co-registration, FA and mean apparent diffusion coefficients were calculated (Fig. 2). Thereafter sagittal T1-weighted gadolinium enhanced images (TR/TE=414/8 msec, flip angle=90°, FOV=260×260 mm2, slice thickness=3 mm, number of slices=11) were performed.
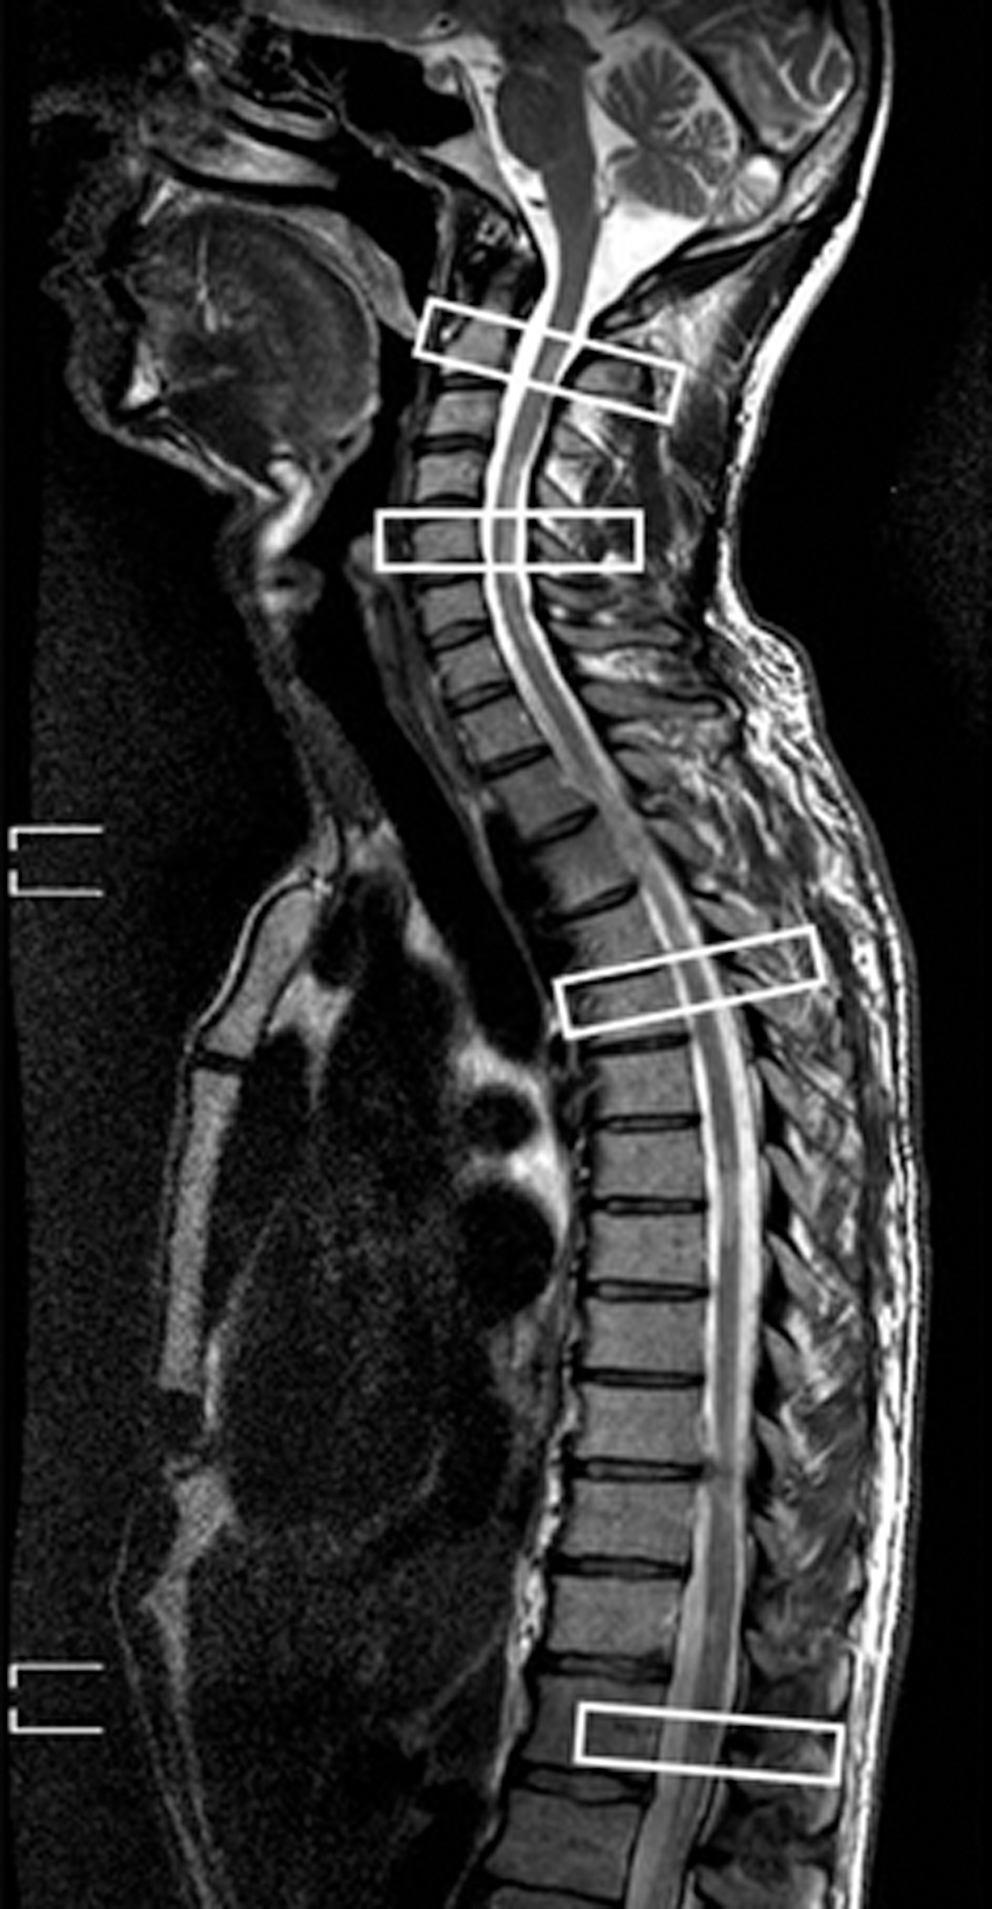
Sagittal T2-weighted image of the entire spinal cord. Fields of view of the upper cervical, lower cervical, thoracic, and lumbar segments are marked by boxes.
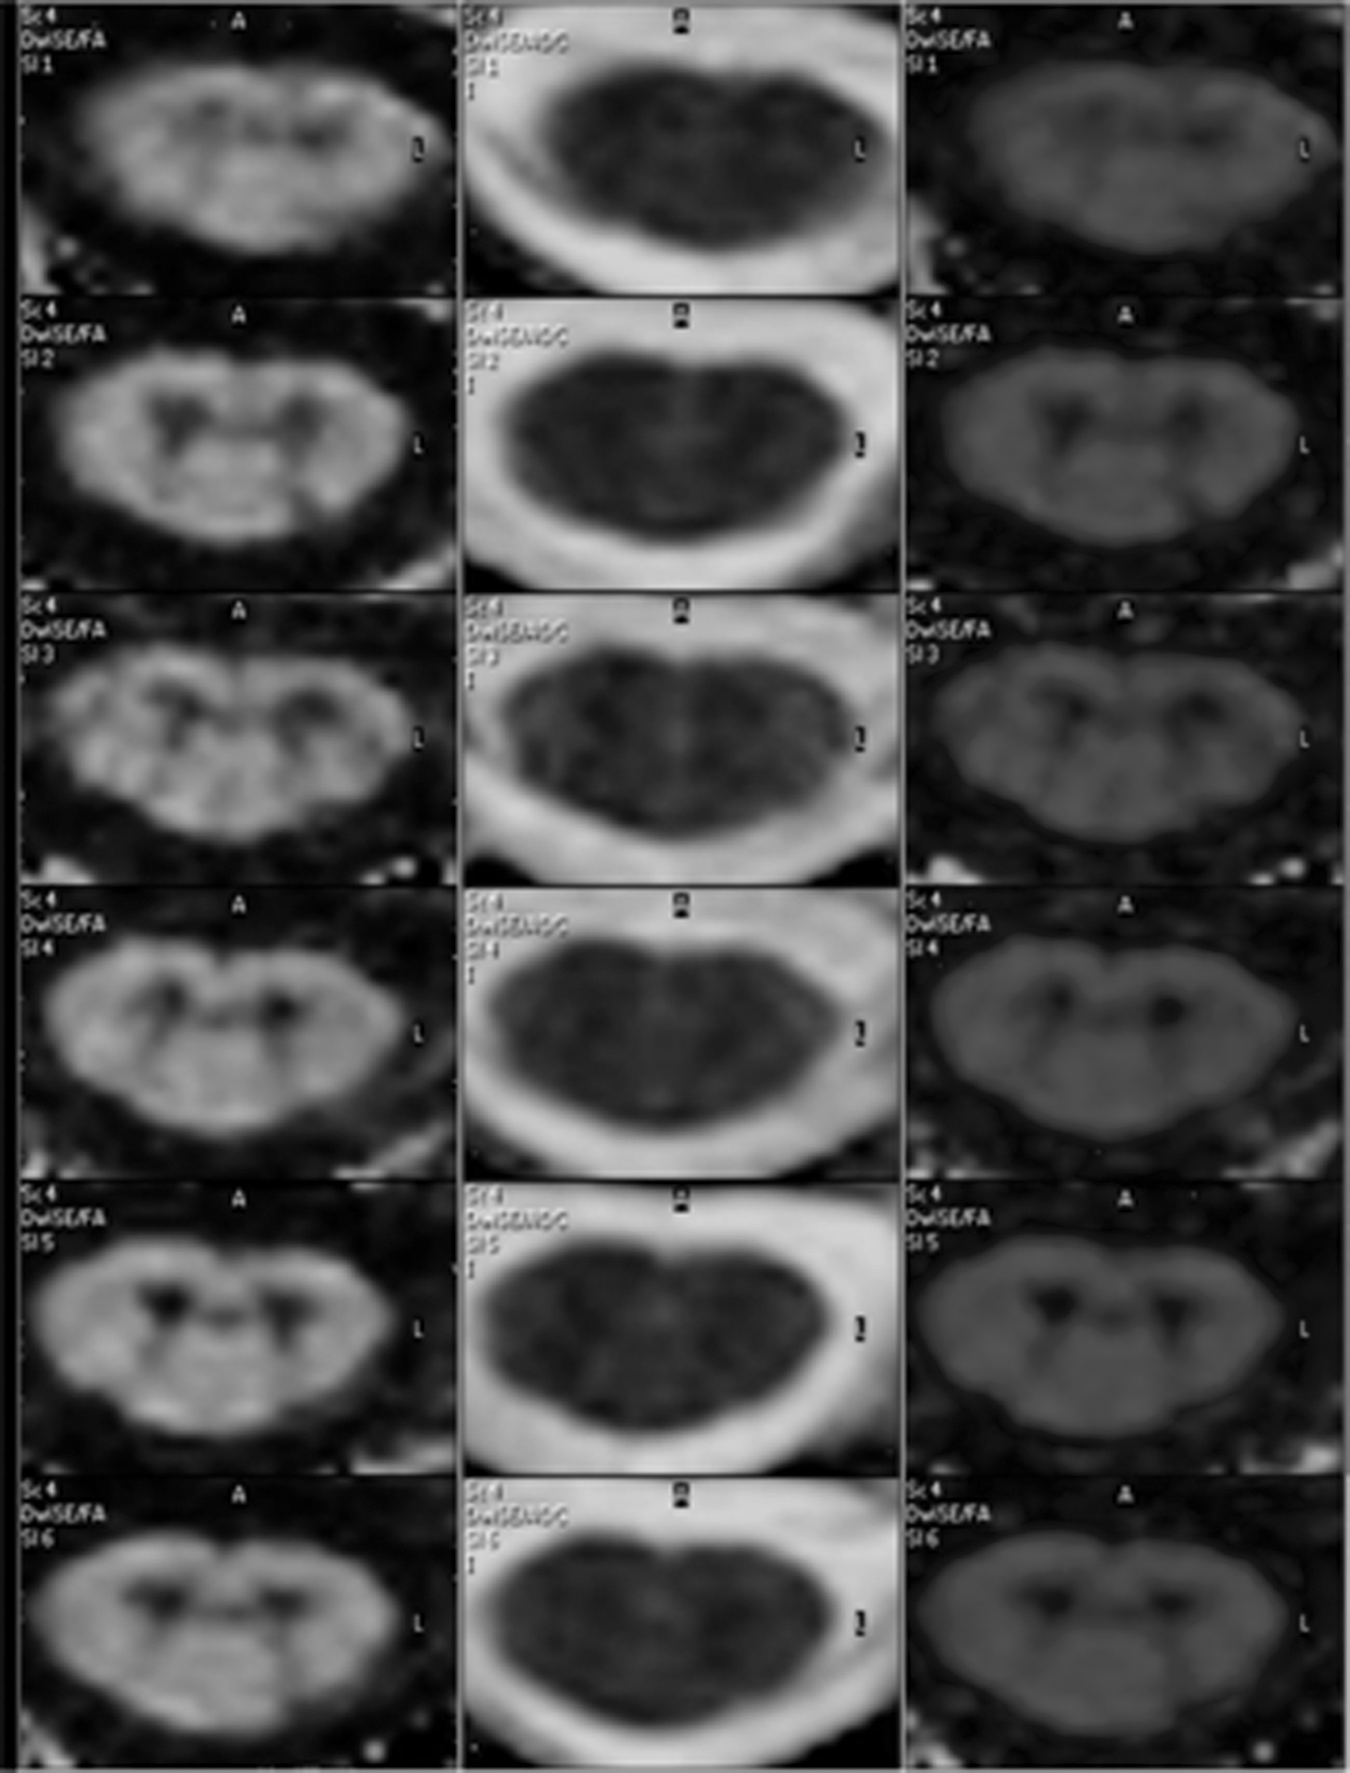
Cervical spinal cord of a healthy control centered at level C5 in the transverse plane, showing six consecutive slices (top to bottom), displayed in different contrasts (left, fractional anisotropy; middle, apparent diffusion coefficient; right, color-coded fractional anisotropy).
Image analysis
The investigator was blinded to the clinical and electrophysiological status of the SCI subjects before analysis. To correct for bulk motion and eddy-current distortions, the data were co-registered using the scanner system's standard co-registration method.
Signal-to-noise ratio (SNR) was calculated and used as a threshold. Images with SNR<20 were excluded, as were those in which grey and white matter of the spinal cord were indistinguishable owing to poor image quality. The aim of the study was to assess normal-appearing white matter representing alterations that cannot be demonstrated on conventional T2-weighted imaging. The sagittal T2-weighted images were screened for the presence of focal T2 hyperintense lesions, diffuse signal abnormalities, atrophy, and spinal cord or nerve root compression. From the DTI data sets the transverse T2 (b=0) maps were screened for lesions. Subsequently, diffusion tensor maps were calculated. Apparent diffusion coefficient (ADC) and FA maps were calculated using the standard DTI software of the scanner system. The cross-sectional area (mm2) was evaluated using the ADC images, where the contrast between the cerebrospinal fluid (CSF) and spinal cord is best. Measurements of FA and ADC values (transverse ADC) were performed in several regions of interest (ROIs) in the cross-sectional area of the spinal cord (corticospinal tracts [CSTs], including the crossed pyramidal tract and dorsal tracts, including the fasciculus cuneatus and gracilis) as shown in Figure 3. The size of the ROIs was identical at the cervical level and the LE. Smaller ROIs were chosen at the thoracic level to take the reduced cross-sectional area of the thoracic spinal cord into account.

Fractional anisotropy image in the axial plane at the cervical level. Regions of interest are shown as circles. Anatomical region (voxels on the cervical level and at the lumbar enlargement/voxels at the thoracic level/spinal tracts). (
Neurological scoring
The neurological level of injury was determined by standard neurological classification of spinal injury according to the American Spinal Injury Association (ASIA), which was then used to define the lesion site and completeness of injury according to the ASIA impairment scale (AIS A=motor and sensory complete; AIS B=motor complete and sensory incomplete; AIS C and D=motor and sensory incomplete; Marino et al., 2003). Five key leg and arm muscles were manually tested (0=total paralysis, 1=palpable or visible contraction, 2=active movement with gravity eliminated; 3=active movement, against gravity; 4=active movement against some resistance; 5=active movement against full resistance). Each of these muscles represents a spinal segment (elbow flexors, C5; wrist extensors, C6; elbow extensors, C7; finger flexors, C8; finger abductors, T1; hip flexors, L2; knee extensors, L3; ankle dorsiflexors, L4; long toe extensors, L5; ankle plantar flexors, S1). Light touch and pinprick examinations of dermatomes C2 and below were performed down to the sacral segments (S4/S5).
Electrophysiological measures
In the 18 SCI subjects (Table 1), sensory evoked potentials (SSEP) were recorded by electrical stimulation of the posterior tibial nerve at the medial malleolus, and of the ulnar nerve at the wrist (square wave of 0.2 msec duration applied at 3 Hz; cathode placed 2–3 cm proximal to the anode). The stimulus intensity was adjusted to produce a visible muscle response or up to a maximal intensity of 40 mA. Electrodes were attached to the skin over the popliteal fossa, the ERB point, and the nape (level C2), to test transmission of the stimulus along the peripheral nerve and spinal cord. Scalp electrodes were positioned at Cz-Fz according to the international 10/20 electrode system. The electrode impedance was maintained below 5 k ohms. The peaks of N8, N10, N20, P25, P40, and N50 were used to determine the latency and amplitude of the response. Two sets of 300 responses were averaged and superimposed to ensure consistency.
In 12 of the SCI subjects (Table 2), motor evoked potentials (MEP) were recorded after applying single pulse transcranial magnetic stimulation (TMS) with a double cone coil at the vertex using a MagStim 2002 magnetic stimulator. The hot spot (defined as the point from which stimuli triggered MEPs of maximal amplitude and minimal latency) for stimulation of the anterior tibial muscle (TA) was determined starting at the vertex, and by gradually moving the coil rostral and contralateral to optimize the coil position for the best size of the MEP amplitude. The same procedure was used for the abductor digiti minimi (ADM) muscle of the hand, but with a different starting point, 4 cm rostral and 3 cm contralateral to Cz. The duration of the biphasic transcranial single pulse stimuli was 50 μsec. The sample frequency was 2000 Hz, and a band-pass filter was set at 30 Hz to 1 kHz. The TMS threshold to evoke an MEP was determined during slight and steady voluntary muscle pre-activation at approximately 10% of maximal voluntary muscle contraction. MEP onset latencies and the baseline to peak amplitudes were determined with the same steady pre-activation of 10% of the maximum voluntary muscle contraction.
Mean values±standard deviation across all voxels in the selected regions across all participants. Significant differences between SCI patients and healthy controls are indicated in bold.
FA, fractional anisotropy; ADC, apparent diffusion coefficient.
Statistical analysis
ROIs from the patients were compared with corresponding ROIs from the healthy subjects to assess differences in DTI parameters. Groups were compared using the Mann-Whitney U test based on independent subject-based observations. p Values≤0.05 were considered to be statistically significant. Nonparametric Spearman rank correlations were calculated between ROI-based age-FA/ADC, and clinical and electrophysiological parameters-FA/ADC. To quantify the proportion of inter-group variability (SCI/healthy subjects) in diffusivity measures, variance components were estimated in a random three-way analysis of variance (ANOVA) with factors, subject, ROI, and group at each level.
Results
Table 2 summarizes the ADC and FA values of four spinal levels (C2, C5, T5, and LE) among the control and SCI subjects. Due to small subject numbers, left- and right-side diffusion measures, as well as electrophysiological and clinical data were pooled.
Image quality
Some images were excluded due to low SNR or because grey and white matter of the spinal cord were indistinguishable (Table 1). At level C5, this was the case for all SCI subjects with vertebral fixation. For level C2, the four youngest SCI subjects were excluded, so the SCI group was sex- and age-matched with the control group. In the control group, the number of subjects included per level was 12 (level C2/C5), 16 (T5), and 14 (LE). In the SCI group, the numbers of subjects included were 12 (C2), 4 (C5), 14 (T5), and 13 (LE; Table 2).
T2 findings
Focal T2 hyperintense lesions, diffuse signal abnormality, atrophy, and spinal cord or nerve root compression were not found in any of the SCI subjects on T2 MRI images at levels C2, T5, or L5 (Table 1). All SCI subjects without vertebral fixation showed signs of myelomalacia at level C5 (Table 1).
DTI metrics of the control group
Significant differences were observed in the FA values of the corticospinal and dorsal tracts and the whole cross-section of the spinal cord between C2 and C5 (corticospinal tracts: p=0.001; dorsal tracts: p=0.02; whole cross-section: p=0.028), between C2 and T5 (corticospinal tracts: p<0.001; dorsal tracts: p<0.001; whole cross-section: p<0.001), between C2 and LE (p<0.001), between C5 and T5 (corticospinal tracts: p=0.005; dorsal tracts: p=0.006; whole cross-section: p<0.001), C5 and LE (corticospinal tracts: p<0.001; dorsal tracts p<0.001; whole cross-section: p<0.001), and between T5 and LE (corticospinal tracts: p=0.005; dorsal tracts: p=0.01; whole cross-section: p<0.001). FA values were highest in the upper cervical segments and lowest in the conus medullaris (Table 2) for the whole cross-section (C2 0.66±0.03; LE 0.57±0.05), and for the CSTs (C2 0.75±0.04; LE 0.63±0.05). FA values were highest in the upper cervical segments and lowest at T5 for the dorsal tracts (C2 0.76±0.02; T5 0.69±0.06; LE 0.7±0.06). There was no difference between the left-side and right-side FA values of the corticospinal and dorsal tracts.
ADC values differed between levels C2 and C5 (dorsal tracts: p=0.045), between C2 and LE (whole cross-section: p=0.001), and between T5 and LE (p=0.012). ADC was highest in the upper cervical segments (0.87±0.04×10⁻³ mm2/sec), and lowest at C5 (0.82±0.07×10⁻³ mm2/sec) for the dorsal tracts (Table 2), highest at the LE (0.92±0.07×10⁻³ mm2/sec) and lowest at C5 (0.85±0.07×10⁻³ mm2/sec) for the whole cross-section, and highest at the LE (0.88±0.10×10⁻³ mm2/sec) and lowest at C5 (0.82±0.09×10⁻³ mm2/sec) for the CSTs.
In the non-accumulated data, ADC values of the left and right dorsal tracts differed at levels C2 (p=0.005). ADC values of left-side and right-side CSTs differed at level C5 (p<0.005).
Spearman rank correlation revealed a significant impact of age on FA (whole cross-section: r=0.309, p=0.003; CST right: r=0.323, p=0.002; CST left: r=0.272, p=0.011; dorsal tracts right: r=0.464, p<0.001; dorsal tracts left: r=0.489, p<0.001). There was no significant impact on ADC values.
DTI metrics of the SCI subject group
In SCI subjects, FA of all four spinal levels was lower than in the control group at the whole cross-section (p=0.008) and at the CSTs (p=0.019). Compared to age- and sex-matched control subjects, FA decreases or a decreasing FA tendency were also found when all four spinal levels were analyzed separately (Table 2 and Fig. 4). At level C2, the decrease was statistically significant for the cross-sectional area (p=0.001), as well as for corticospinal (p=0.002) and sensory tracts (p=0.004). At level C5, the decrease was statistically significant for the whole cross-section (p=0.05). At level T5, there was a decreasing trend at the CSTs (p=0.058). Similarly to control subjects, FA was highest in the upper cervical segments and lowest at the LE (Table 2).
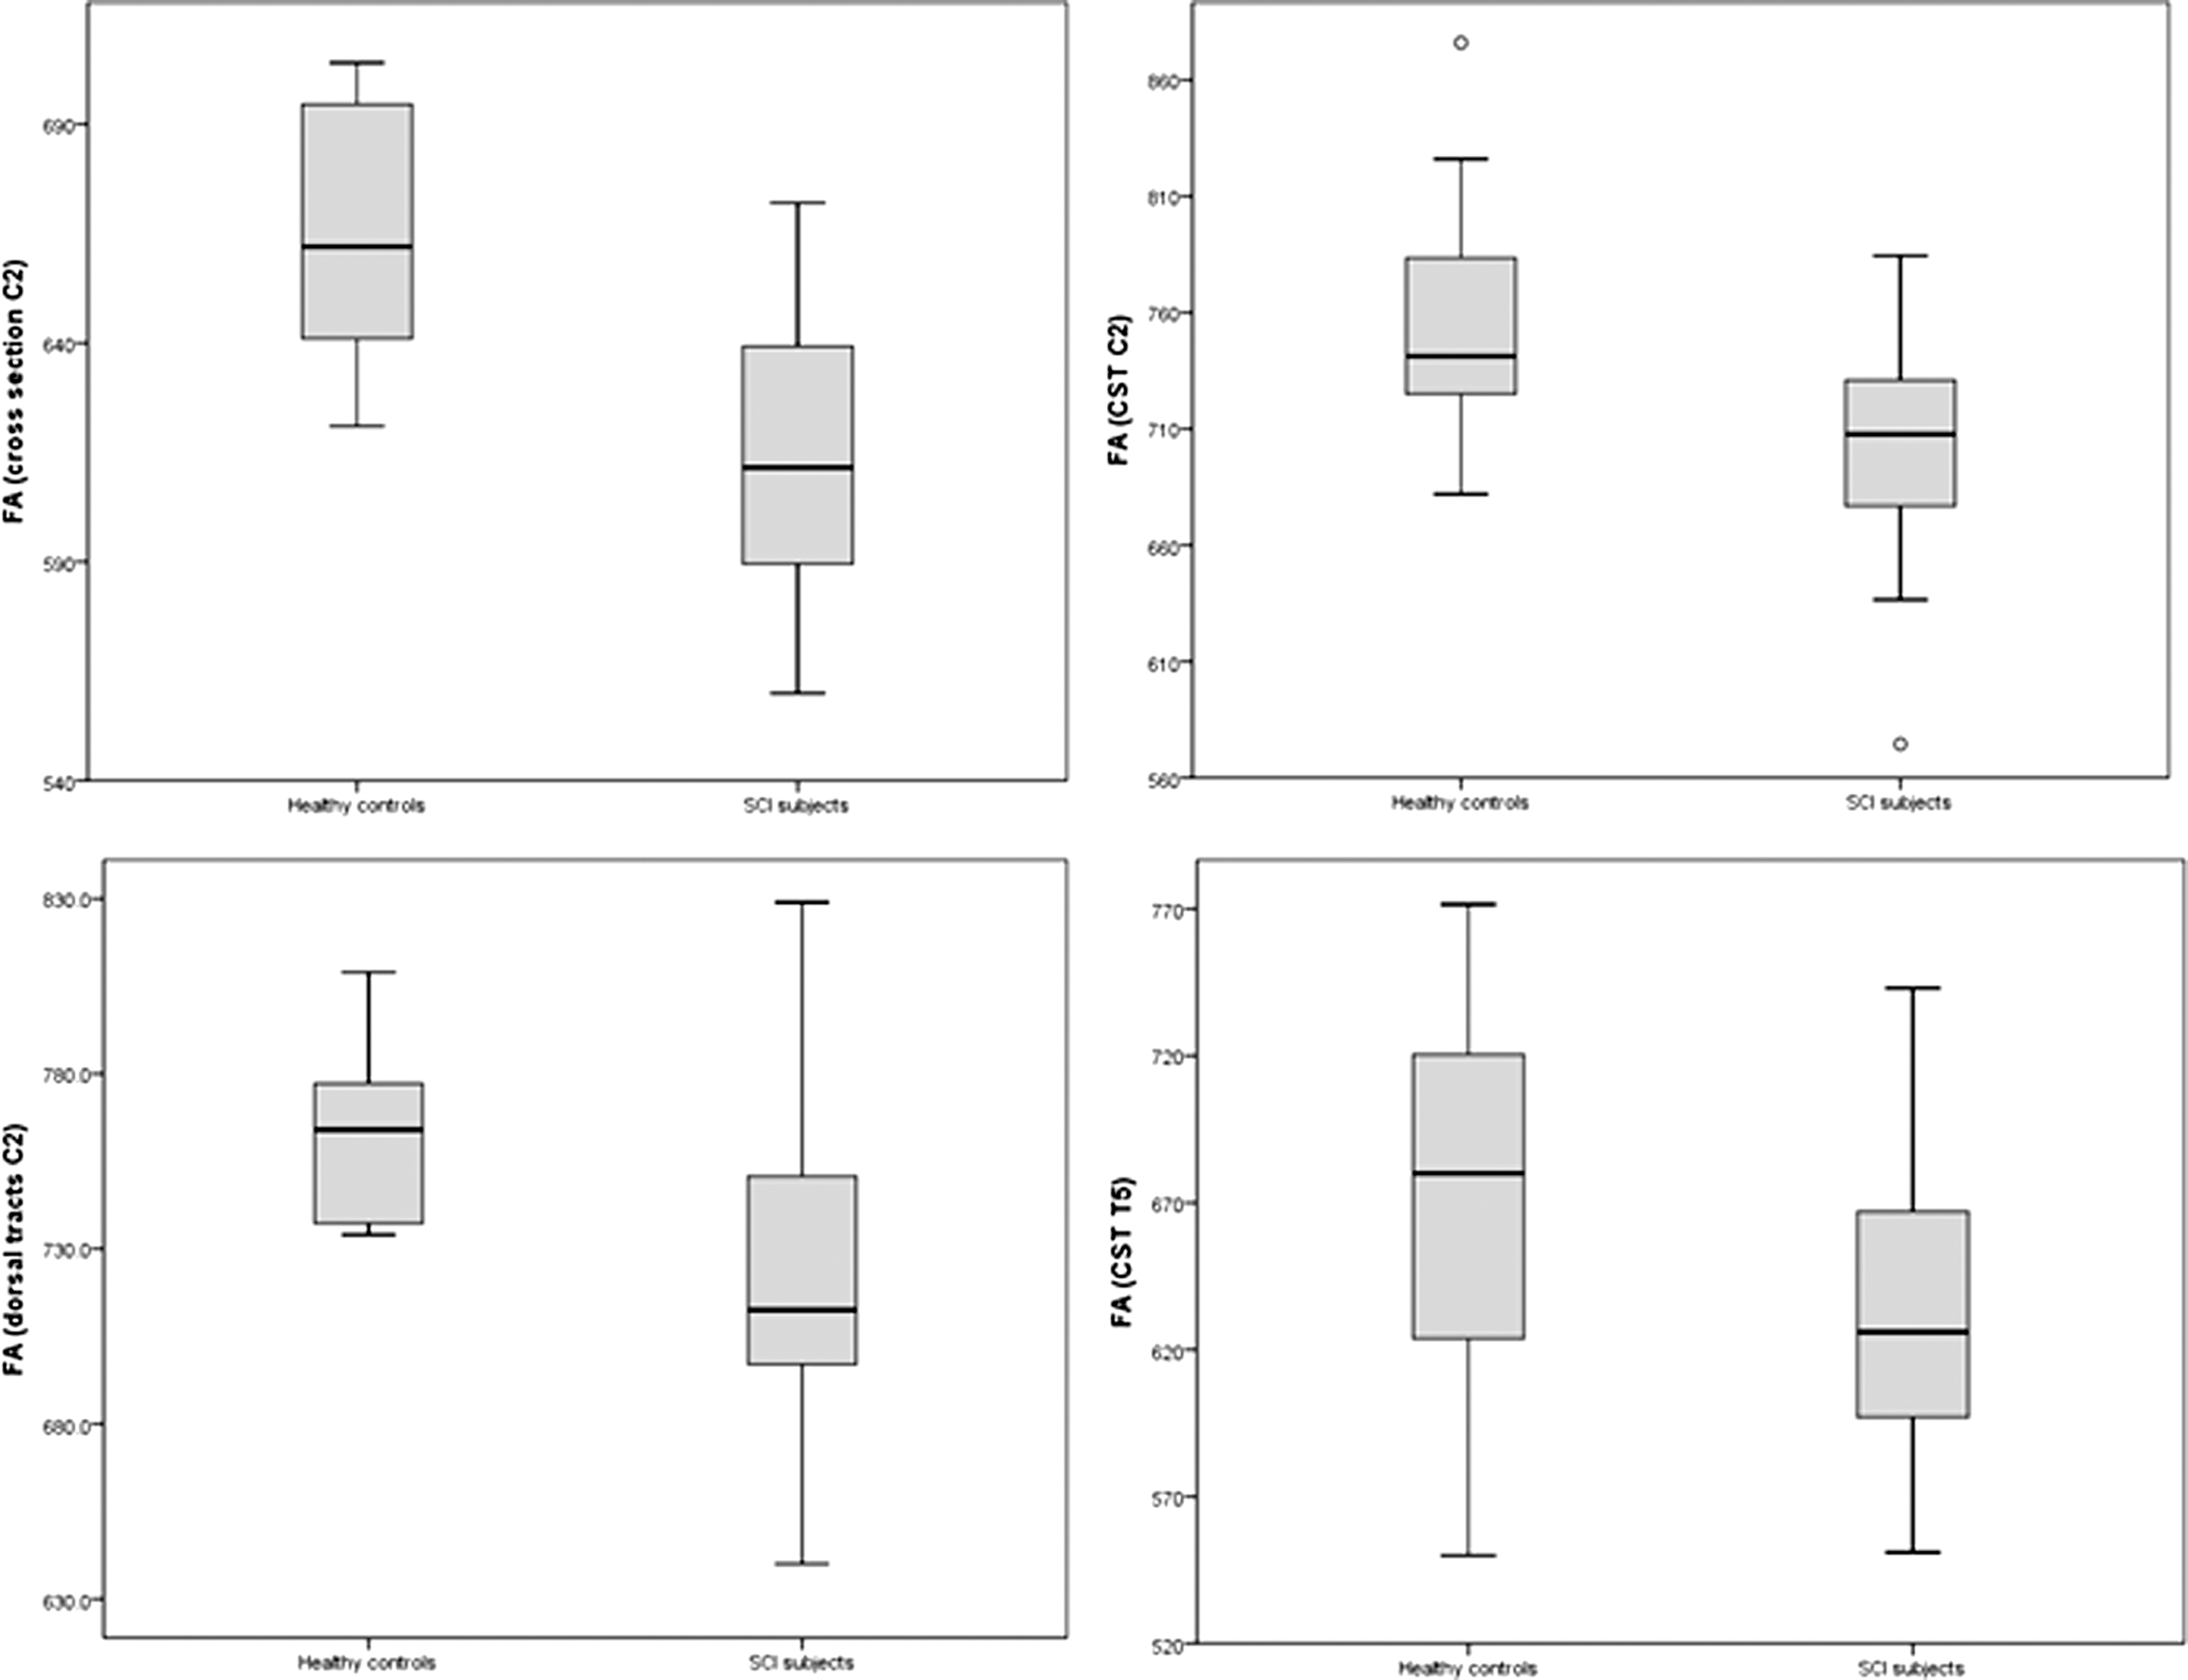
Fractional anisotropy in healthy controls and spinal cord injury subjects (CST, corticospinal tract).
In the CSTs of SCI subjects, the tendency was toward lower ADC values at level C2 (p=0.052), and higher ADC values at level T5 (p=0.088; Table 2).
At level C2, the inter-group differences (SCI subjects/control subjects) account for 44% of the variability of the FA measures compared to other factors. At level C5, it was is only 4%, while at level T5 and at the LE, other factors, such as inter-subject differences, account for most of the variability.
The surface area of the injured spinal cord was significantly decreased at all spinal levels (Table 3).
Significant differences between SCI patients and the healthy controls are indicated in bold.
LE, lumbar enlargement.
Diffusion measures and evoked potentials
In SCI subjects, mean ulnar SSEP N20 was 23.05±2.09 msec with a mean amplitude of 1.35±0.95 μV. Mean tibial SSEP P40 was 46.85±5.05 msec with a mean amplitude of 0.79±0.83 μV (Table 4). Mean abductor digiti minimi MEP latency was 24.23±6.97 msec with an amplitude of 1.31±1.29 mV. Mean tibialis anterior MEP latency was 34.21 msec with an amplitude of 0.63±0.81 mV.
Left (n=18) and right (n=18) sided data were pooled (mean±standard deviation). In AIS A+B subjects, no somatosensory evoked potentials could be derived from the legs.
AIS, American Spinal Injury Association impairment scale.
Amplitudes (P40) of the tibial SSEP (Table 4) correlated with FA measures of the dorsal tracts of all levels taken together (Spearman rank correlation r=0.46, p<0.001; Fig. 5), and inversely with ADC measures of the dorsal tracts of all levels taken together (r=−0.26, p<0.034), while ulnar SSEP (Table 4) did not correlate.
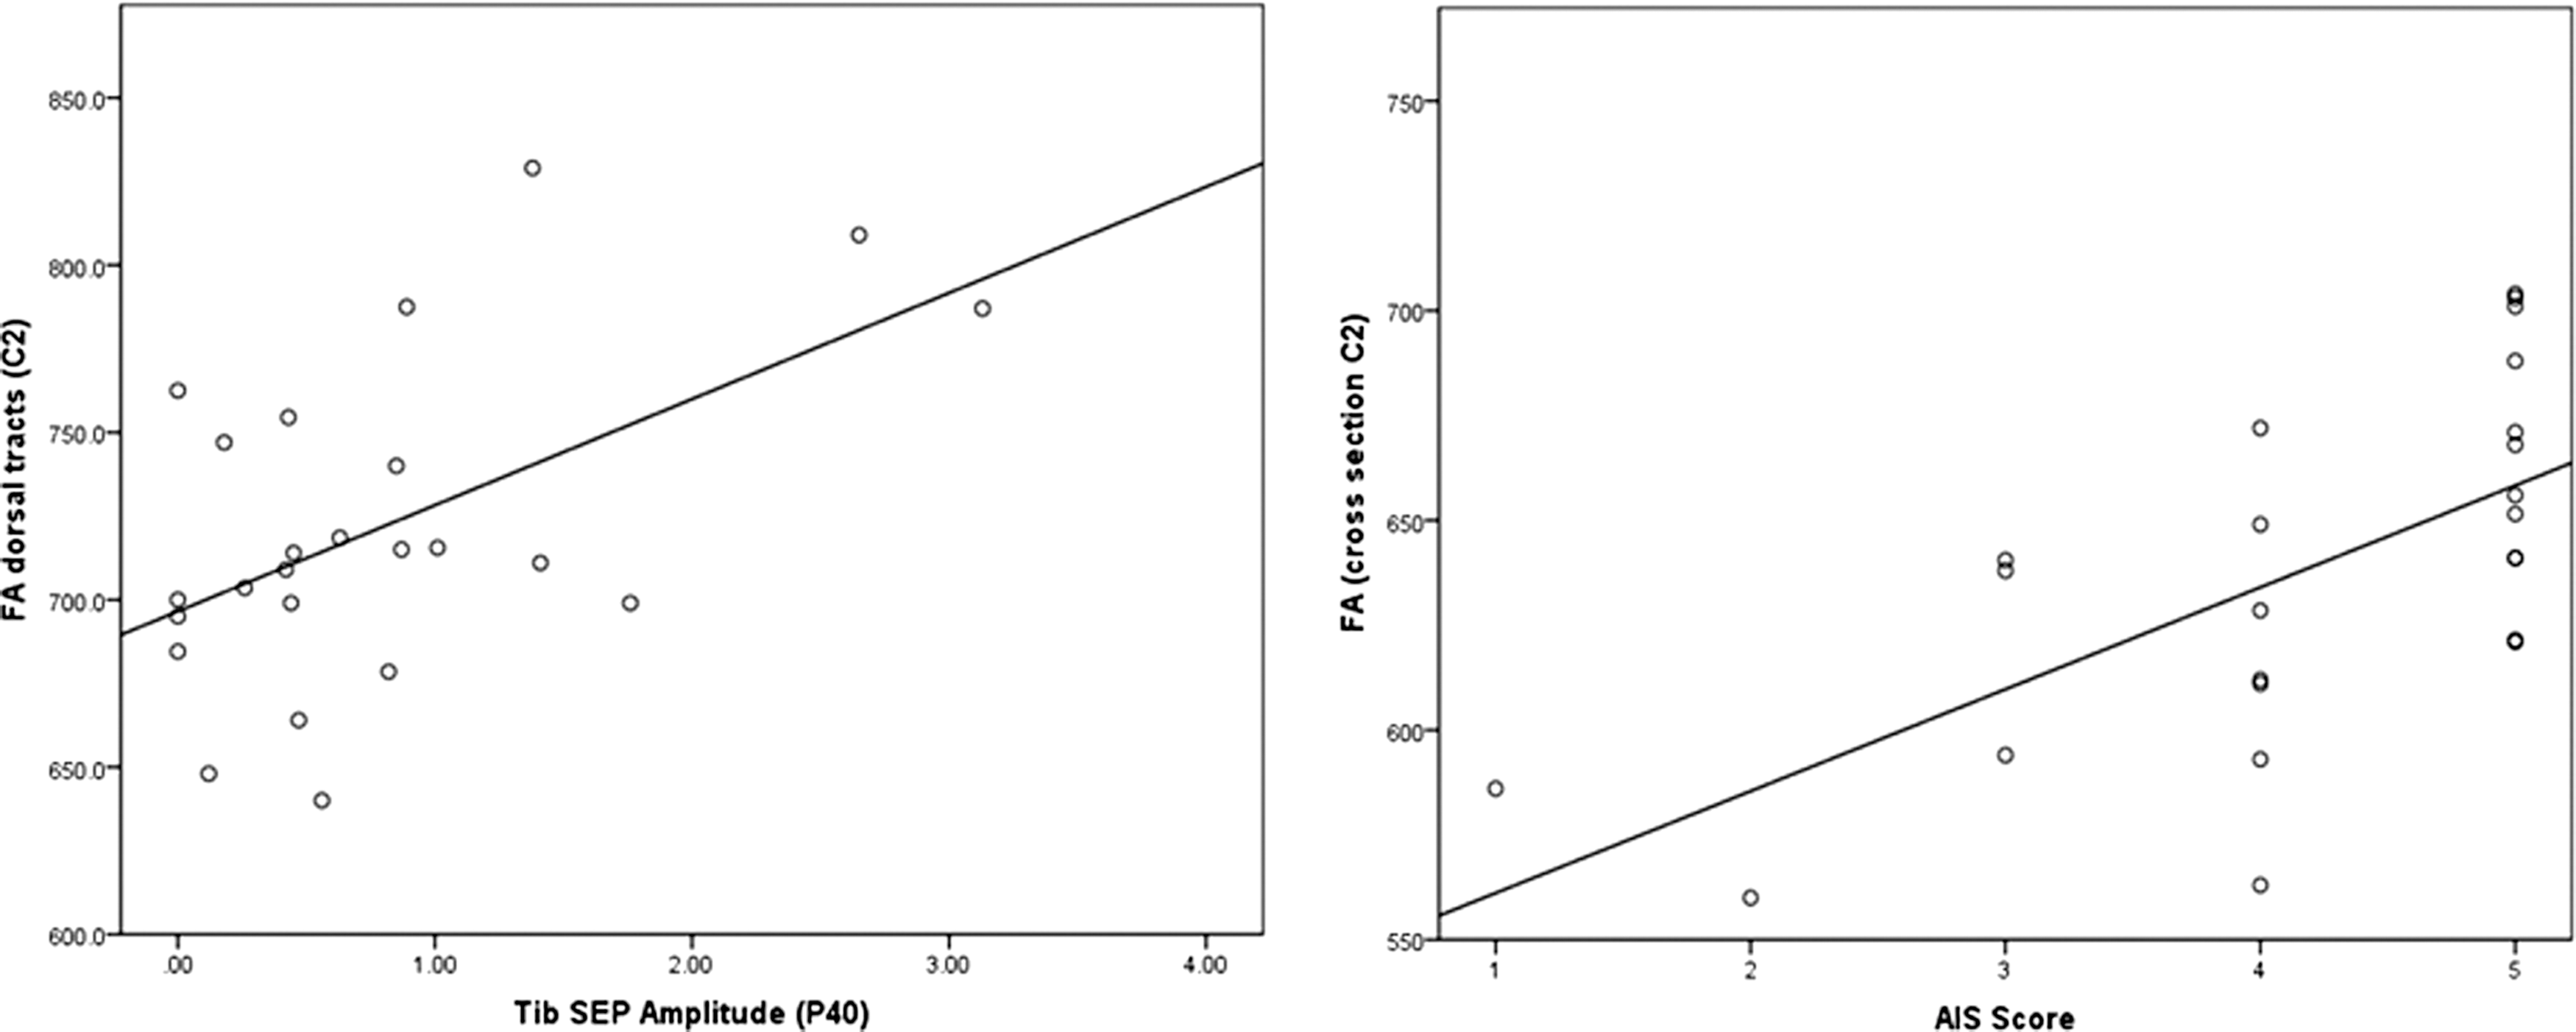
Correlations of diffusivity measures with tibial nerve sensory evoked potentials (Tib SEP) and clinical scores. Fractional anisotropy (FA) given in mean values across all voxels across all slices in the selected regions of interest across all participants. Linear regression lines added (1=AIS A, motor and sensory complete; 2=AIS B, motor complete and sensory incomplete; 3=AIS C and D, motor and sensory incomplete; AIS, American Spinal Injury Association impairment scale).
Level C2
Amplitudes (P40) of the tibial SSEP correlated with FA measures of the whole cross-section (r=0.7, p<0.001), and with the dorsal tracts (r=0.53, p<0.007; Fig. 5), while ulnar SSEP did not correlate. Tibial SSEP latencies did not correlate with FA measures. ADC measures did not correlate with ulnar or tibial SSEP measures. Neither MEP latencies nor amplitudes correlated with FA measures.
Level C5
No significant correlations were found for diffusion measures with evoked potential amplitudes or latencies.
Level T5
No significant correlations were found for diffusion measures with evoked potentials.
Lumbar enlargement (LE)
Amplitudes (P40) of the tibial SSEP correlated with FA (r=0.99, p<0.001) and ADC (r=−0.7, p=0.003) measures of the dorsal tracts. SSEP latencies and MEP did not correlate with diffusion measures.
Diffusion measures and clinical outcome
FA measures correlated with the ASIA impairment scale scores along the whole cross-section of the spinal cord (r=0.27, p=0.006), the CSTs (r=0.32, p<0.001; Fig. 5), and at all levels of the dorsal tracts (r=0.29, p=0.001). ADC values did not correlate with the AIS. At level C2, FA measures correlated with the AIS score for the whole cross-section (r=0.64, p=0.001; Fig. 5), and the corticospinal (r=0.5, p=0.002; Fig. 5) and dorsal tracts (r=0.41, p=0.013). ADC values did not correlate with the AIS. At level C5, FA measures correlated with the AIS score along the whole cross-section (r=0.57, p=0.012) and the CSTs (r=0.45, p=0.046). T5 FA measures significantly correlated with the AIS score for the CSTs (r=0.44, p=0.003; Fig. 5) and the dorsal tracts (r=0.448, p=0.002); ADC values did not correlate with the AIS. At the LE, FA and ADC measures did not correlate with the AIS.
Discussion
Tissue characteristics
Diffusion characteristics in SCI subjects and healthy controls differed in spinal cord regions remote from the injury site. This is in accord with earlier SCI observations (Deo et al., 2006; Ellingson et al., 2008; Ford et al., 1994; Fraidakis et al., 1998; Nevo et al., 2001; Shanmuganathan et al., 2008). Decreased FA values at the cervical level of the SCI subjects were within the range of previous publications (Chang et al., 2010; Kerkovsky et al., 2011). The FA loss in SCI subjects might be linked to a reduced number of fibers linked to increased diffusivity in the extracellular space (Facon et al., 2005), and is likely to reflect anterograde and retrograde wallerian degeneration. Retrograde wallerian degeneration has been described only rarely in the human CNS (Bronson et al., 1978; Yamamoto et al., 1989). It results in a loss of diffusion anisotropy (Batchelor et al., 2003), and is reported in the cranial CST after cervical SCI (Guleria et al., 2008).
The probability of direct tissue injury induced by SCI at level C2 cannot be excluded, but does not seem probable because there were no signs of pathological changes at the C2 level on T2 MRI images in our subjects, and no clinical indications of a C2 deficit (Table 1).
In SCI subjects, at level C5, a significant difference was only found in FA for the whole cross-section and a trend in the sensory tracts. The fact that no significant difference was found in the CSTs might be because this group consisted of only four SCI subjects, three of whom had minor trauma (AIS D), with signs of central and/or dorsal myelomalacia on T2 MRI images, that did not necessarily affect the CSTs (Table 1).
Previous studies have shown that FA values are of higher sensitivity and specificity than ADC values in patients with spinal cord compression (Facon et al., 2005) and spinal cord injury (Chang et al., 2010). Accordingly, in degenerated sciatic frog nerve and in human brain, a loss of anisotropy is noted, but average diffusivity may remain unchanged owing to an accumulation of cellular debris from a breakdown of the longitudinal axonal structure, while glial proliferation may hinder water movement in a parallel direction (Beaulieu et al., 1996; Werring et al., 2000). ADC maps may not, therefore, be able to distinguish between normal and degenerated cord in cases of severe neuropathology (Aota et al., 2008).
The reduction in cross-sectional area in SCI compared with healthy subjects suggests atrophy (Freund et al., 2011) in regions remote from the injury site owing to subsequent axonal degeneration and dieback (Potter and Saifuddin, 2003). Spinal cord atrophy is seen in patients with a long history (more than 2 years) of post-traumatic myelopathy (Curati et al., 1992), and is the most common spinal cord abnormality (prevalence of 62%) seen in patients imaged more than 20 years after injury (Wang et al., 1996).
Relationship to clinical and electrophysiological measures
SSEP and MEP are regarded as objective measures of the functional integrity of spinal pathways (Chabot et al., 1985; Curt et al., 1998; Steeves et al., 2007). The morphometry and permeability of the axonal membrane to water are intimately tied to both MR diffusion measurements (Ford et al., 1998; Schwartz et al., 2005) and neuronal excitability (Clamann and Henneman, 1976; Clay, 2005; Freeman, 1978; Mirolli and Talbott, 1972). It is therefore reasonable to assume that quantitative changes in DTI measurements following injury quantitatively reflect structural damage to the spinal tracts, which may be expected to affect SSEP and MEP parameters accordingly. A loss of amplitude would be expected for SEP and MEP measurements in cases of axonal damage, while demyelinating diseases would be more likely to entail a reduced conduction velocity and thus increased SEP or MEP latencies. Our results demonstrate a selective relationship between tibial SSEP amplitude and diffusion measures of the dorsal tracts. The parallel alterations in both SSEP amplitudes and DTI measures suggest significant axonal disruption in SCI. This is in accord with a study that revealed a high correlation of SSEP and DTI measures of the dorsal columns in rats (Ellingson et al., 2008). Ulnar SSEP amplitudes did not correlate with diffusion measures. This might be because the region-of-interest setting covers more the medial part of the dorsal tracts, while fibers from cervical levels are located more laterally and were therefore not perfectly matched by the respective ROI.
MEP did not correlate with diffusion measures. This is probably a consequence of the well-known variability of MEP amplitudes. Theoretically, the size of a MEP should reflect the number of conducting central motor neurons, but this relationship is obscure. MEPs are usually smaller than compound motor action potentials elicited by peripheral nerve stimulation, and their size varies from one stimulus to the next, as well as between subjects, owing to a varying degree of facilitation (Hess et al., 1987; Kiers et al., 1993). Furthermore, varying synchronization of the descending action potentials causes MEP amplitude variation. The resulting phase cancellation phenomenon (Magistris et al., 1998) impedes straightforward conclusions on the number of activated motor neurons, and is probably responsible for the lack of correlation seen in the present comparison of DTI with MEP amplitudes.
Regarding clinical scores, the decrease of the FA correlated with the completeness of injury reflected by the AIS scale (i.e., the lowest FA values were found in sensorimotor complete SCI patients). This has already been shown for cervical (Cohen-Adad et al., 2011), but not for thoracic and lumbar FA metrics in cervical SCI subjects. In previous studies, FA also correlated with clinical measures in spondylotic myelopathy (Budzik et al., 2011) and FA, but not ADC, metrics were correlated with motor function in SCI subjects (Chang et al., 2010). In patients with poor clinical scores, FA metrics are decreased in cases of spinal cord arteriovenous malformations, but the ADC values are variable (Ozanne et al., 2007). FA also correlates with disability scales in neuromyelitis optica (Qian et al., 2011). FA DTI measures may be useful to quantify the degree of neural damage as a prognostic factor, and to monitor the effects of future regeneration-inducing treatments.
Clinical relevance
The structural changes underlying motor recovery in SCI are not yet fully understood. A pure imaging approach would not be sufficient to prove functional significance of preserved tissues, or the re-establishment of the directional organization of tissues. By combining the application of clinical, electrophysiological, and imaging approaches, the functional and structural contributions to the recovery of function after an SCI can be determined. However, before a quantitative evaluation of the combined methods can be applied, there must be proof of feasibility and validity. The ultimate goal would be to relate changes over time in DTI and neurophysiology. This would be an approach that allows us to assess and localize both spontaneous and induced regeneration following SCI. This is important to evaluate the effects of new treatments that target different pathophysiological mechanisms after injury, such as inflammation, scarring, enhancing neuroplasticity, or the disinhibition of regeneration. With such an evaluation, the effect of an optimal combination of treatments could also be reliably assessed.
Study limitations
This study enrolled those with DTI examinations from 2 months to 8 years after SCI. As wallerian degeneration results in a progressive decline of FA values along white matter tracts, this variation in time points may affect the accuracy of the results. The study would have benefited from a larger SCI population size, and especially from patients without a metal implant at the lesion site. In other SCI studies (Ellingson et al., 2008; Shanmuganatham et al., 2008), subject groups were not age- and sex-matched, although diffusivity metrics are clearly age-dependent (Mamata et al., 2005). This aspect was taken into account in this study.
Further studies are needed to discover whether the lesion extent displayed by DTI correlates with histopathological findings. The fine in-plane resolution makes it possible to measure alterations of ultrastructural tissue such as the motor and sensory tracts. Despite careful planning of the scan geometry and ROI placement, sub-voxel effects may degrade the achievable accuracy of the quantification. A further increase in image resolution is expected to improve the correlation with functional data. Detailed regional histological analysis at different time points after SCI to determine the state of myelin and neurofilaments is required but is not feasible in humans.
Owing to the short single-shot readout duration, the employed DTI sequence is inherently robust against motion artifacts (motion ghosting). Thus imaging proved to be robust against distortions and SNR-dropout in most patients. However, we cannot exclude that movement artifacts may have contributed to within- and between-subject variations during MRI scanning.
In this study motion-related effects were addressed by using a short acquisition duration and bulk motion correction. Moreover, the high number of image averages may also help to avoid systematic motion errors. In future studies, the use of cardiac gating (Kharbanda et al., 2006) might help to further improve the accuracy of the obtained diffusivity values.
Footnotes
Author Disclosure Statement
No competing financial interests exist.