
Abstract
The Glasgow Outcome Scale (GOS) is firmly established as the primary outcome measure for use in Phase III trials of interventions in traumatic brain injury (TBI). However, the GOS has been criticized for its lack of sensitivity to detect small but clinically relevant changes in outcome. The Glasgow Outcome Scale-Extended (GOSE) potentially addresses this criticism, and in this study we estimate the efficiency gain associated with using the GOSE in place of the GOS in ordinal analysis of 6-month outcome. The study uses both simulation and the reanalysis of existing data from two completed TBI studies, one an observational cohort study and the other a randomized controlled trial. As expected, the results show that using an ordinal technique to analyze the GOS gives a substantial gain in efficiency relative to the conventional analysis, which collapses the GOS onto a binary scale (favorable versus unfavorable outcome). We also found that using the GOSE gave a modest but consistent increase in efficiency relative to the GOS in both studies, corresponding to a reduction in the required sample size of the order of 3–5%. We recommend that the GOSE be used in place of the GOS as the primary outcome measure in trials of TBI, with an appropriate ordinal approach being taken to the statistical analysis.
Introduction
T
In response to the perceived lack of sensitivity of the GOS, Jennett and associates (1981) developed the GOSE, an extended version of the GOS. While in principle the extended scale should offer greater sensitivity to detect changes in outcome, potential gains could be lost if the extended scale introduces more inter-observer variability. The aim of this article is to evaluate whether the GOSE adds value to the GOS as an outcome measure in head injury trials.
The Glasgow Outcome Scales
The original Glasgow Outcome Scale has five ordered categories: Death, Vegetative State, Severe Disability, Moderate Disability, and Good Recovery. Although the GOS has been widely adopted as the preferred instrument for assessing outcome after TBI, it has been subject to criticism over the years (Anderson et al., 1993; Gouvier et al., 1986; Hall et al., 1985; Maas et al., 1983). It can be argued that five outcome categories are too few to represent the wide range of mental and physical handicaps a patient can suffer following TBI.
The GOSE scale splits each of Severe Disability, Moderate Disability, and Good Recovery into lower and upper categories to allow for greater differentiation between the levels of recovery that can be achieved. Several other extended scales have been suggested in the past, but have not been widely adopted (Horne and Schemitsch, 1989; Livingston and Livingston, 1985; Maas et al., 1983; Smith et al., 1979).
Traditionally, TBI trials have been analyzed by grouping the GOS into two categories: Unfavorable (Death, Vegetative State, or Severe Disability) versus Favorable (Moderate Disability or Good Recovery). Such a dichotomization of an ordinal scale discards potentially relevant information (Altman and Royston, 2006), and in particular in our context would abolish any distinction between the GOS and the GOSE. Recent work reported by the IMPACT group (McHugh et al., 2010) has shown that appropriate statistical methods can be applied to analyze the full ordinal GOS scale, leading to an analysis which substantially increases the statistical efficiency. For a given sample size, an ordinal analysis can detect a smaller treatment effect than can be done using conventional dichotomous analysis. Thus in this paper we evaluate whether ordinal analysis of the GOSE leads to further efficiency gains over and above ordinal analysis of the GOS.
The IMPACT database
This work was undertaken by the IMPACT (International Mission for Prognosis and Analysis of Clinical Trials in TBI) group and was funded partly by the U.S National Institutes of Health. The IMPACT group is a collaboration of researchers from Belgium, The Netherlands, the U.K. and the U.S.A. See
The IMPACT study group has dedicated significant resources to collating data from various TBI studies into one large database. Not all of the studies used the same formats for recording information, so merging the data was not straightforward. Currently the database contains data on almost 12,000 patients. This is a combination of four observational studies and 11 randomized controlled trials (RCTs). The development of the IMPACT database has been described by Marmarou and colleagues (2007).
This particular analysis is based on two of the studies in the IMPACT database with GOSE data available (Table 1). The APOE study (Teasdale et al., 2005) was a cohort study with patients recruited from consecutive head injury admissions to the regional Neurosurgical Unit for the West of Scotland. The study was designed to investigate the hypothesis that possession of the APOE ɛ4 allele is associated with poorer outcome after acute head injury. The PHARMOS study (Maas et al., 2006) was an international multi-center randomized clinical trial that evaluated the efficacy and safety of dexanabinol in severe TBI.
RCT, randomized controlled trial.
Methods
Ordinal analysis
In this study we use two ordinal analysis approaches which have been described in detail in previous IMPACT publications (Maas et al., 2010; McHugh et al., 2010). The proportional odds model (Bolland et al., 1998; McCullagh, 1980) in effect estimates the odds ratio associated with each potential dichotomy of an ordinal outcome scale, and leads to a pooled estimate, assuming that each odds ratio is equal to an overall common odds ratio. This estimated common odds ratio can be thought of as a measure of the shift of outcome over the entire ordinal scale that is associated with an intervention or a prognostic marker.
The sliding dichotomy approach is based on grouping patients into subgroups reflecting baseline risk, on the basis of a prognostic model. Within each prognostic group the median observed outcome category represents the expected outcome, and the impact of an intervention or a prognostic marker is evaluated in terms of its impact on increasing the proportion of outcomes which are better than would be expected, given the baseline prognostic risk. The estimated sliding dichotomy odds ratio can be thought of as a measure of how much outcome is better than expected over the entire ordinal scale in association with an intervention or a prognostic marker.
Both of these ordinal methods have been assessed using an extensive set of simulations and were found to be highly efficient in comparison to a basic dichotomization of the GOS (McHugh et al., 2010). Reductions in sample size of the order of 40% were shown, with the proportional odds model generally outperforming the sliding dichotomy approach. The authors found it difficult to recommend a method, as they both had their strong points: the proportional odds model produced the larger efficiency gains, but the sliding dichotomy had arguably more clinical appeal.
When using the GOS or GOSE in ordinal analyses it is generally accepted that the categories Death and Vegetative State should be pooled for statistical and clinical reasons. These include the fact that there are usually a low number of patients in the Vegetative State category, and also that Vegetative State could never be regarded as a favorable outcome, even if the baseline prognosis is strongly adverse. Therefore the GOS was reduced to a four-category outcome and the GOSE to a seven-category outcome. The conventional dichotomized GOS was included to act as a reference technique.
Statistical analysis
In order to compare the GOS and GOSE we used the previously mentioned PHARMOS and APOE datasets. For the PHARMOS study we investigated the sensitivity of the different approaches in estimating the effect of the randomized treatment, and for the APOE study the impact of possession of an ɛ4 allele was taken as the treatment effect. Two types of investigations were carried out: a standard error analysis and a simulation study. Patients with a missing outcome measure were not included in the analyses. Any children in the APOE study were also excluded. These exclusions gave us the following patient totals: PHARMOS (n=856) with an age range of 16–66 years, and APOE (n=714) with an age range of 16–93 years.
Standard error analysis
This method involved fitting different models for each outcome scale and examining the standard error of the estimated treatment effect. We expected to observe a decrease in the standard error as the number of categories in the outcome scale increased. There are potential problems in comparing standard errors for treatment effects in non-linear models (Ford and Norrie, 2002; Robinson and Jewell, 1991), with the counter-intuitive finding that covariate adjustment typically increases the standard error of an estimated treatment effect. However, in our context and under the assumption of proportional odds the binary logistic regression model and proportional odds models are estimating what is fundamentally the same parameter.
We used PROC LOGISTIC in SAS® to fit three different models (SAS 9.2, SAS System for Windows; SAS Institute Inc., Cary, NC). For both sets of data the models were fitted three times with increasing numbers of covariates: (1) No covariates+treatment variable; (2) Three covariates (age, Glasgow Coma Scale motor score, and pupillary reaction)+treatment variable; and (3) Seven covariates (age, Glasgow Coma Scale motor score, pupillary reaction, CT scan classification, traumatic subarachnoid hemorrhage, hypoxia, and hypotension)+treatment variable (Murray et al., 2007; Steyerberg et al., 2008).
Simulation study
The second analysis method involved running a series of simulations to investigate possible reductions in sample size for the four-category GOS and the seven-category GOSE, using a basic chi-squared analysis of the dichotomized GOS as the reference level. A detailed description of a similar simulation study can be found in McHugh and associates (2010). A summary of the steps involved is as follows. • Simulate an outcome on the GOSE scale for 400 randomly-selected patients from the two datasets using their baseline data. This generates the placebo group. • Repeat the same process for another 400 patients, but this time incorporating a treatment effect. The treatment effect was calibrated to ensure a 5% absolute increase in the proportion of patients with a favorable outcome. This step generates the intervention group. • Each simulation scenario is repeated 1000 times and a reduction in sample size is calculated from the output. The scenarios are also analyzed for the four-category GOS, which is obtained by collapsing the GOSE. • The simulation scenarios are different combinations of analysis methods and numbers of covariates. Methods include a chi-squared analysis for the dichotomous GOS, and proportional odds and sliding dichotomy analyses for the four- and seven-category scales.
The findings are expressed in terms of the percent reduction in sample size that can be achieved without loss of statistical power, as explained in detail by Hernandez and colleagues (2006).
Results
Standard error analysis
As expected (McHugh et al., 2010), there is a substantial efficiency gain when going from the conventional binary analysis to an ordinal analysis of the GOS (Table 2). There is then a further efficiency gain when going from the GOS to the GOSE. To quantify the difference between the outcome scales into a more meaningful measure, reductions in sample size have been calculated using the dichotomized GOS as the reference level. The four-category GOS shows a 20–40% reduction in sample size relative to the dichotomous analysis, depending on which model and dataset is used. The GOSE shows a modest but consistent gain over the four-category GOS, with a 23–43% reduction. We also note, as discussed earlier, that covariate adjustment leads to an increase in the standard error of the treatment effect.
GOS, Glasgow Outcome Scale; GOSE, Glasgow Outcome Scale-Extended.
Simulation study
Looking at the simulation study results (Fig. 1), we find that there are larger reductions in sample size in every simulation scenario when using the seven-category GOSE compared to the four-category GOS. Tying in closely with the results from the standard error analysis, there is typically an additional 3–5% reduction in sample size when using the GOSE compared to the GOS. These gains are again over and above the substantial efficiency gain obtained when going from a binary analysis to an ordinal analysis of the GOS. Another clear finding is that the proportional odds approach tends to perform better than the sliding dichotomy approach, a pattern also seen by McHugh and colleagues (2010). It is also apparent in both Table 2 and Figure 1 that larger percentage reductions in sample size are achieved with the APOE study than with the PHARMOS trial in every scenario. This is again consistent with the findings of McHugh and colleagues (2010), that greater efficiency gains tended to be achieved in cohort studies with broad entry criteria than in randomized trials with tightly defined entry criteria.
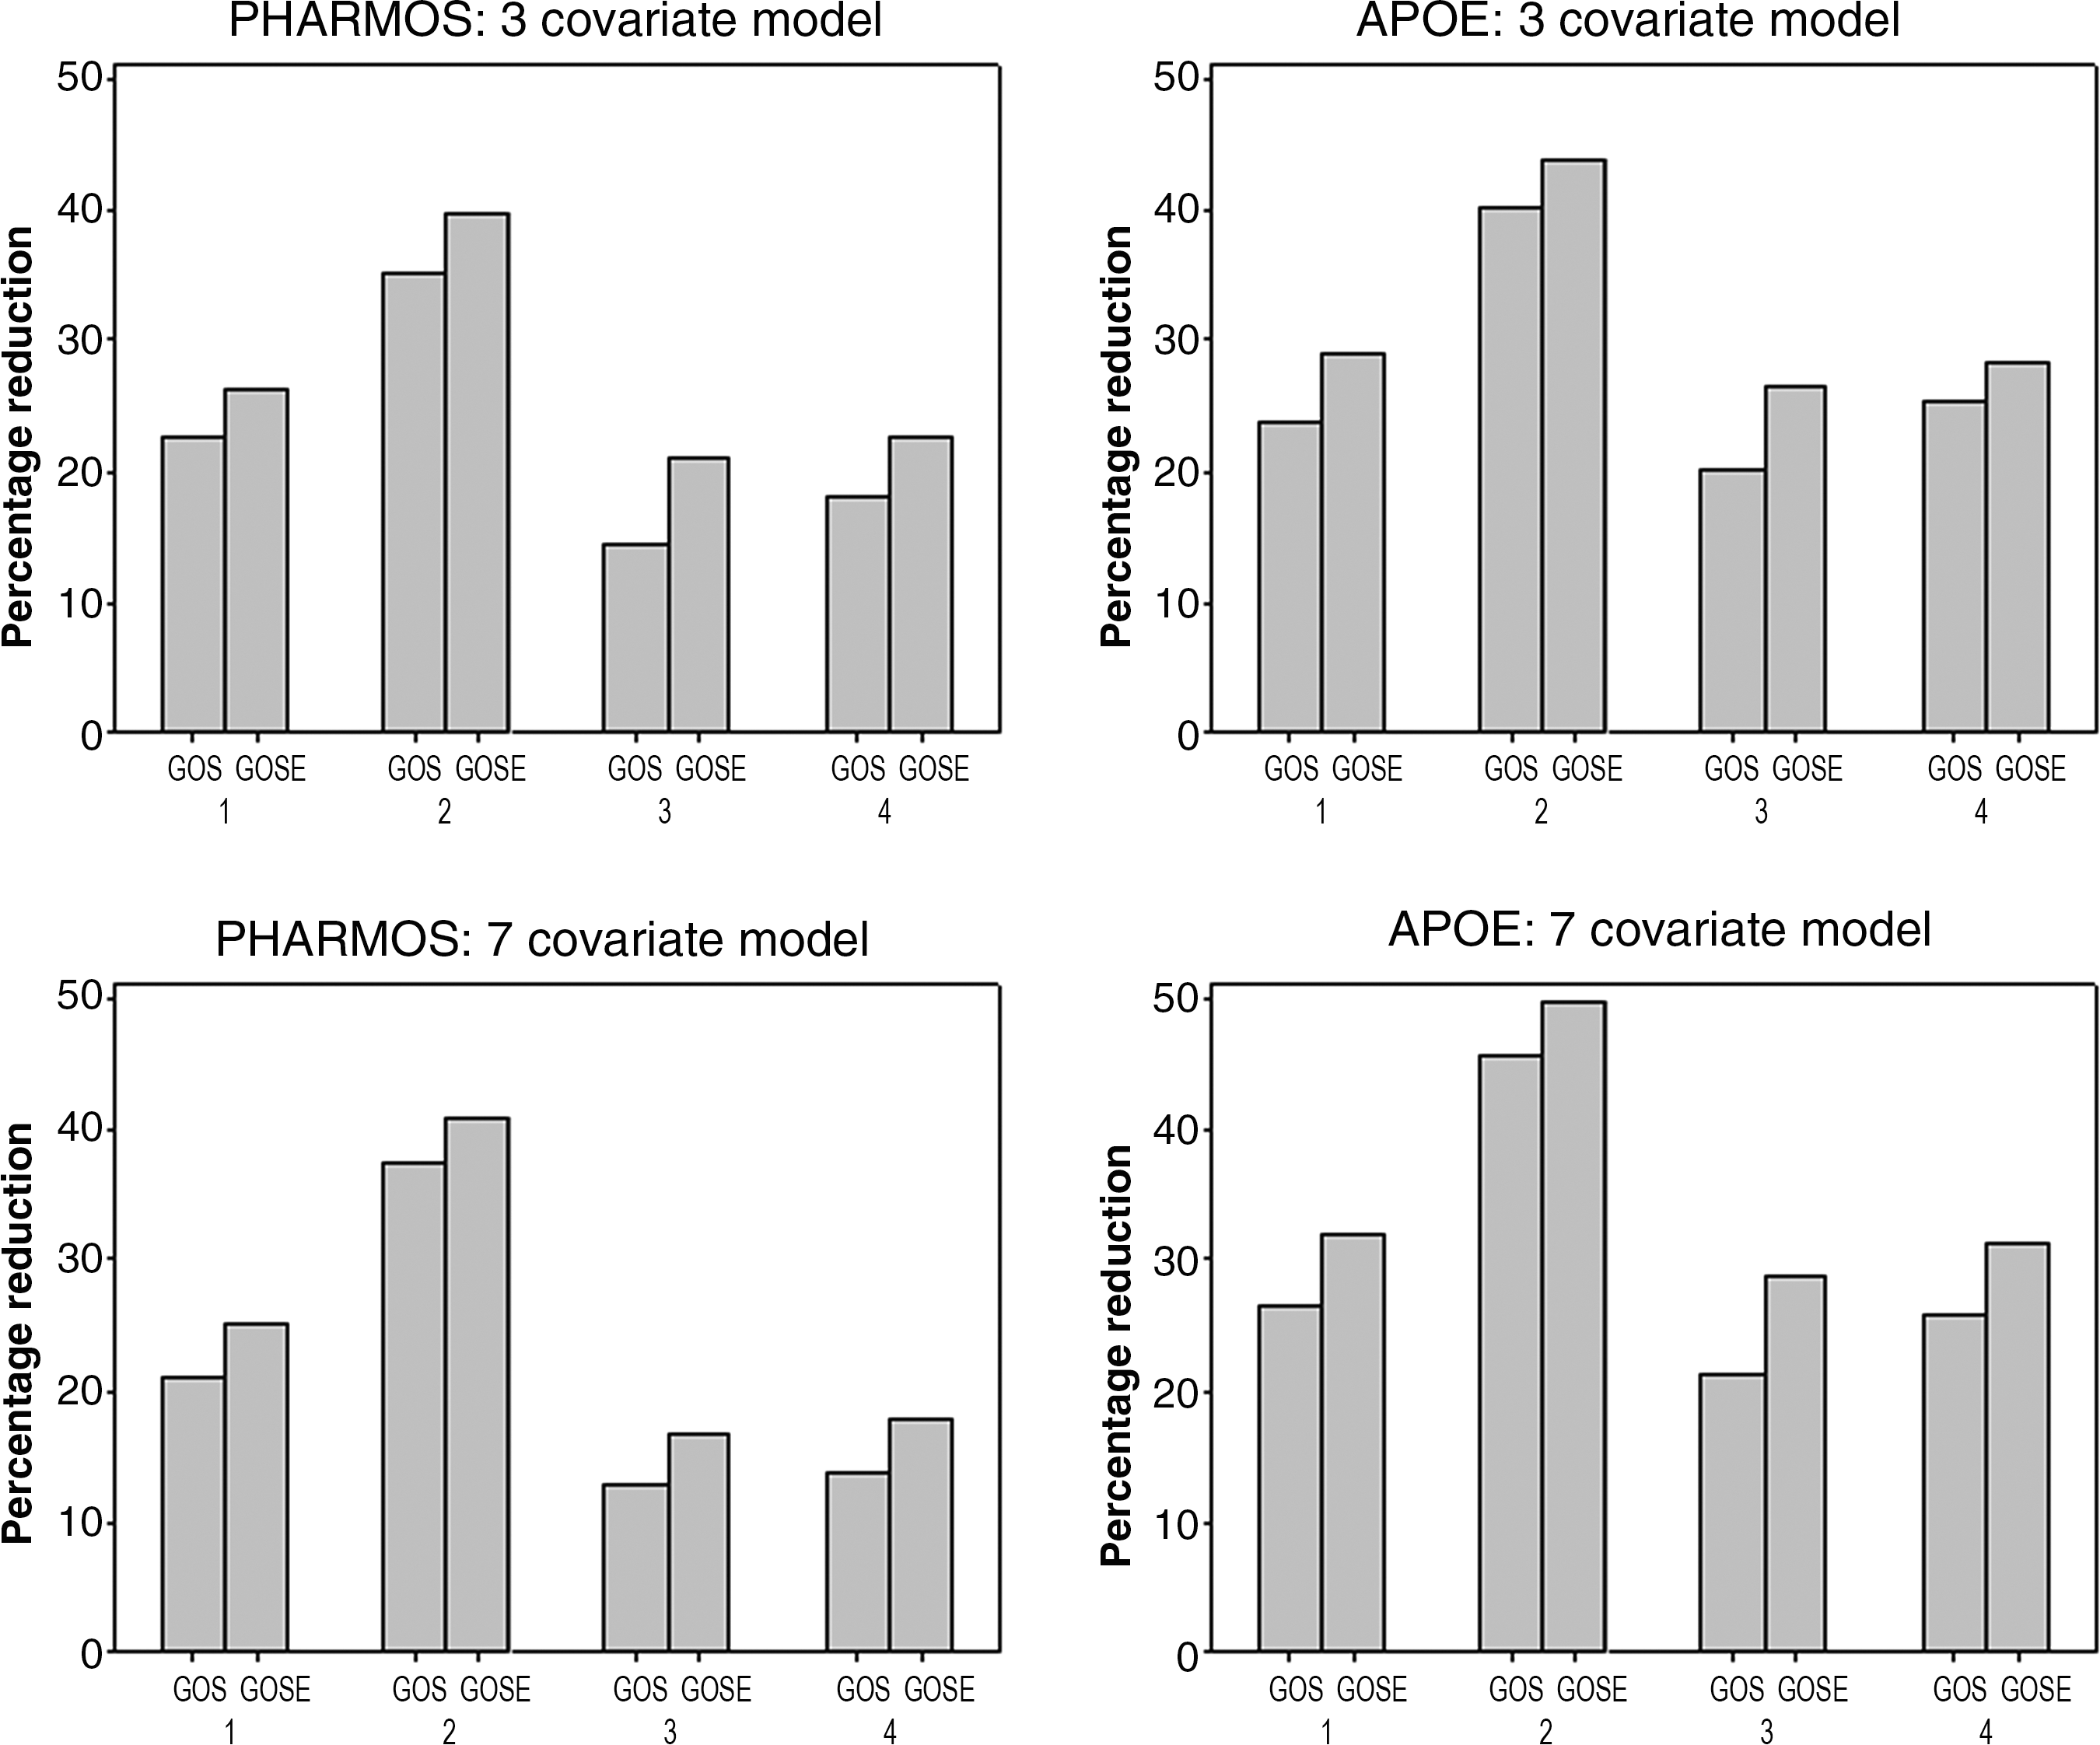
Numbers 1 to 4 on the horizontal axis correspond to following methods: 1, proportional odds, treatment only; 2, proportional odds, treatment+covariates; 3, sliding dichotomy, treatment only; and 4, sliding dichotomy, treatment+covariates. “Treatment only” means that the final analysis model contained the treatment variable only, while “Treatment+covariates” means that the final analysis model contained the treatment variable plus covariates (3 or 7). See the statistical analysis section for a list of the covariates used. GOS, Glasgow Outcome Scale; GOSE, Glasgow Outcome Scale-Extended.
Discussion
Two main conclusions may be drawn from our results. First, as has been shown previously (McHugh et al., 2010), it is clear that ordinal analysis of the four-category GOS yields substantial efficiency gains relative to the conventional dichotomous analysis. Second, using the seven-category GOSE gives modest but consistent efficiency gains over and above those achieved by the use of the four-category GOS. These additional gains correspond to a sample size reduction of the order of 3–5%. In our opinion such an additional gain easily justifies the additional effort required to assess outcome using the full GOSE in place of the GOS.
In these analyses an important point we had to consider was how to collapse the eight-category GOSE. We chose to group Death and Vegetative State together to form a seven-category scale. An alternative would have been to group Death, Vegetative State, and Lower Severe Disability together to form a six-category scale as used in the original analysis of the PHARMOS trial (Maas et al., 2006). In a sensitivity analysis we repeated the analyses described above using the six-category GOSE, and in general this approach was inferior to using the seven-category scale.
Ordinal analysis using the proportional odds model or the sliding dichotomy does require a greater degree of statistical sophistication than that required for a conventional binary analysis. However, this has not prevented such approaches from being used in practice (Maas et al., 2006; Sandset et al., 2011). An alternative approach to the analysis of the GOS has been suggested by Aoki and associates (1998). Based on interviews with doctors, nurses, and medical students, they assigned a numerical utility to each level of the GOS, allowing the ordinal scale to be mapped onto an interval scale relating to quality of life. It is not clear, however, whether this approach would achieve the efficiency gains that have been demonstrated for the proportional odds model and the sliding dichotomy.
Any potential efficiency gains that would result from an extended outcome scale could be lost if the inter-observer variability increases along with the length of the scale. In order to address how best to assess the GOSE, Wilson and colleagues (1998) developed a set of structured interview questions. A study carried out by the same authors demonstrated kappa values of 0.89 for the GOS and 0.85 for the GOSE. In comparison to the results shown by Maas and associates (1983), there was a substantial improvement in the degree of inter-observer agreement when using the structured interview.
Further evidence in support of the GOSE can be found in a subsequent article by Wilson and associates (2000), in which the relationship between outcome scales and other measures of outcome and clinical status was explored. The results suggest that both the GOS and GOSE show good agreement with injury severity, rating of disability, cognitive testing, perception of health, and symptoms reported by people with head injury and their relatives. In a similar vein, Levin and colleagues (2001) explored the relationship of the scales to functional and neuropsychological outcome measures. They found that the GOSE performed better than the GOS, a result that the authors believe will make the GOSE more sensitive than the GOS to interventions, especially when measuring changes over time.
In conclusion we recommend that the GOSE should be recorded in future studies, given the potential for increased sensitivity relative to the GOS. To realize this potential it is essential that ordinal analysis is used. Every effort should be taken to minimize inter-observer variability, including the use of structured interviews. Regular feedback and training sessions can serve to highlight the importance of taking great care to standardize the assessment of the GOSE.
This study can be seen as the final piece of the set of recommendations for trial conduct and analysis in TBI (Maas et al., 2010). In summary, we recommend that for future Phase III trials in TBI: (1) entry criteria should be broad, to include all patients who would be expected to benefit from the intervention being tested; (2) the analysis should be adjusted for key baseline covariates; (3) ordinal analysis should be used, based on either the proportional odds model or the sliding dichotomy; and (4) the GOSE should be used in preference to the GOS, since with an ordinal analysis this can yield a further modest but clinically-relevant increase in statistical efficiency that outweighs the additional effort required to assess the GOSE instead of the GOS.
Footnotes
Acknowledgments
This work was supported by the U.S. National Institutes of Health (Clinical Trial Design and Analysis in TBI Project: R01 NS-042691), and the U.K. Medical Research Council (Edinburgh Hub for Trials Methodology Research: G0800803).
Author Disclosure Statement
No competing financial interests exist.