
Abstract
The severity of injury to cardiovascular autonomic pathways following clinical spinal cord injury (SCI) can be evaluated with spectral analyses. Whether this technique provides a translatable assessment of cardiovascular autonomic function in rodent SCI is unknown. Beat-to-beat blood pressure and pulse interval were measured in male rats 1 month after complete T3 or T10 SCI, and in uninjured control animals. Univariate autoregressive spectral analyses were performed and the power of the low frequency (LF), high frequency (HF), and very low frequency (VLF) peaks identified. Frequency domain variables were correlated with the severity of orthostatic hypotension (OH) and the severity of hypertension during autonomic dysreflexia (AD). Total heart rate variability (HRV) and blood pressure variability (BPV) were reduced in animals with T3, but not T10, SCI. VLF and LF HRV were reduced and HF HRV was increased in animals with T3 SCI compared to controls; there were no changes in animals with T10 SCI. BPV in the VLF and LF range was reduced in animals with T3 SCI, but not T10 SCI. In all animals with SCI, severity of OH was positively correlated with LF BPV, and negatively correlated with HF BPV. Severity of AD was positively correlated with HF BPV and HF HRV, and negatively correlated with VLF HRV. Spectral analyses can detect alterations in cardiovascular autonomic function in animals with SCI at rest. These parameters underscore the distinct cardiovascular ramifications of high- versus low-thoracic SCI, and correlate with the severity of AD and OH, clinically-relevant measures of abnormal blood pressure control.
Introduction
A
The cardiovascular consequences of injury are a significant concern for those living with SCI (Anderson, 2004). Supine and orthostatic hypotension (OH) contribute to impaired concentration and memory (Duschek et al., 2003; Jensen et al., 2007; Perimuter and Greenberg, 1996). Autonomic dysreflexia (AD) and profound blood pressure (BP) increases following sensory stimulation below the lesion can be distressing and life-threatening (Krassioukov and Claydon, 2006). Both OH and AD negatively impact physical activity (Claydon et al., 2006a; Drory et al., 1990; Hol et al., 2007; Vidal et al., 2003), limiting rehabilitation. AD, OH and “silent” cardiac ischemia (Bauman et al., 1994) are all thought to contribute to increased severity of cardiovascular disease in SCI patients, which not only occurs earlier and progresses more rapidly than in the able-bodied (Imai et al., 2004; Whiteneck et al., 1992), but also is the leading cause of morbidity and mortality after SCI (Garshick et al., 2005; Myers et al., 2007).
Despite the need to focus on cardiovascular dysfunction after SCI (Krassioukov et al., 2007), there is no gold standard to measure injury to descending cardiovascular pathways. Accordingly, there is a need for simple physiological assessments of cardiovascular autonomic function after SCI that can be used in both humans with SCI and animal models. The ideal approach should be simple enough to use in both the laboratory and clinical settings without specialized equipment, and should be able to predict autonomic outcome and/or track changes over time. One candidate assessment is spectral analysis of cardiovascular parameters, to evaluate autonomic function using heart rate variability (HRV) and blood pressure variability (BPV). These analyses are of particular interest because they have already been applied to rodent models (Cerutti et al., 1991), and thus provide a useful means to translate results from bench to bedside.
In both humans and rats, frequency analyses permit quantitative evaluation of cardiac sympathetic and vagal control, sympathetic control of the vasculature (Akselrod et al., 1985; Baselli et al., 1986; Kuwahara et al., 1994; Parati et al., 1995; Ramaekers et al., 2002), and the sensitivity and delay of the cardiac baroreflex (Baselli et al., 1986; Cerutti et al., 1994; Cevese et al., 2001; Gulli et al., 2001,2003). These parameters are obtained by quantifying spontaneous beat-to-beat fluctuations in heart rate (HR) and BP. A time series of the interbeat interval, generated by plotting interbeat interval against beat number (i.e., a tachogram), can be represented as a spectrum, a sum of sinusoidal components, each with separate values for central frequency and amplitude. In these spectra, power spectral density (derived from the amplitude of oscillation) is plotted against frequency. The primary outcome measures for this type of analysis are three frequency domains (or ranges) in the spectra of BPV and HRV: high frequency (HF), low frequency (LF), and very low frequency (VLF).
These frequency domains have been identified as indicators of neural activity governing the heart and the vasculature. The most clear-cut of these are the HF HRV, which represents cardiac vagal control (Akselrod et al., 1985; Baselli et al., 1986; Cerutti et al., 1991; Parati et al., 1995; Ramaekers et al., 2002), and the LF BPV, which represents sympathetic drive to the resistance vessels (Baselli et al., 1986; Cerutti et al., 1991,1992,1994; Julien et al., 1995). The LF HRV is generally accepted to be due to oscillations in vagal outflow that are driven by sympathetically-induced LF BPV acting through the baroreflex (Akselrod, 1988; Akselrod et al., 1985; Cevese et al., 2001; Grasso et al., 1997; Kuwahara et al., 1994). The HF BPV results from mechanical changes in intrathoracic pressure associated with respiration (Akselrod et al., 1985; Baselli et al., 1986; Parati et al., 1995; Ramaekers et al., 2002).
The physiological significance of HRV and BPV in the VLF domain is more complex and controversial. VLF HRV is affected by many influences on the heart, including thermoregulation, the renin-angiotensin system, and endothelial factors (Cohen and Taylor, 2002; Parati et al., 1995). Despite its complex nature, VLF HRV is important because reduced VLF HRV is a strong independent predictor of all-cause cardiovascular mortality (Kleiger et al., 2005). VLF BPV is also modulated by many factors, including catecholamines, angiotensin, heat stress, and hypovolemia (Cohen et al., 2002; Omboni et al., 1996). It has recently been suggested to be largely due to L-type calcium channel activity in the vasculature generated by the myogenic response to spontaneous perturbations in BP (Langager et al., 2007).
The utility of these measures has been explored extensively in other populations; however, their use in SCI has been limited. We have shown that these analyses are related to clinical measures of cardiovascular dysfunction after chronic SCI, and provide useful and reproducible tools to assess the functional completeness of injury to autonomic pathways in humans (Claydon and Krassioukov, 2007; Ditor et al., 2005). In this study, we wanted to determine whether spectral analyses are able to detect differences in cardiovascular autonomic function in animals with SCI. We also wanted to determine whether spectral analyses relate to functional cardiovascular tests in these animals. We hypothesized that animals with T3 SCI would have impaired cardiovascular control, as demonstrated by profound OH and AD, which would be associated with abnormal HRV and BPV. In animals with T10 SCI, in whom the injury is below the key spinal levels for normal cardiovascular control, we expected responses to be similar to neurologically-intact control animals.
Methods
Ethical approval
All animal procedures were performed in accordance with the guidelines of the Canadian Council for Animal Care and approved by the University of British Columbia Animal Care Committee.
Surgical procedures
Thirty-eight male Wistar rats were used in these experiments (300–400 g). On the day of surgery, the animals were anesthetized with ketamine hydrochloride (Vetalar; 70 mg/kg IP; University of McGill Animal Resources Centre, Montreal, Quebec, Canada) and medetomidine hydrochloride (0.5 mg/kg IP). Buprenorphine (Temgesic; 0.02 mg/kg SC; University of McGill Animal Resources Centre), and ketoprofen (5 mg/kg SC) were administered prior to surgery.
A complete spinal cord transection was performed at T3 (n=15) or T10 (n=9). Uninjured control animals did not undergo surgery at this time. Our surgical protocols have recently been described in detail elsewhere (Inskip et al., 2010). In short, T3 SCI was performed through the intervertebral gap at T2/T3. The spinal cord was cut using fine scissors. Anesthetic was reversed with atipamezole hydrochloride (50 μL, 5 mg/mL SC). T10 SCI was performed as above, with complete transection of the spinal cord at T10. The injuries were confirmed as complete under the surgical microscope, by observing retraction of the rostral and caudal cord stumps and visualization of the ventral surface of the spinal canal.
Post-injury care
The animals were monitored closely after injury (Ramsey et al., 2010). Antibiotics (Baytril; 10 mg/kg SC), and analgesics (Temgesic; 0.02 mg/kg SC; and Anafen; 5 mg/kg SC) were administered daily for 3 days post-injury. Urinary bladders were emptied by manual compression four times daily for the first week post-injury, until reflex micturition occurred. All animals received a high-calorie diet, including fruit, Ensure (meal replacement, Abbott Nutrition, Saint-Laurent, Québec, Canada), and TransGel liquid supplement (Charles River Laboratories Inc., Pointe-Claire, Québec, Canada). Rat kibble (Lab Diet 2001; PMI Nutrition International, Jamieson's Pet Food Dist., Delta, B.C., Canada) was provided ad libitum, and water was provided using modified low-reaching water bottles. The animals were housed in modified cages, each with a rubber mat to facilitate locomotion and minimize wetness (Ramsey et al., 2010).
Carotid cannulation
Carotid artery cannulations were performed 1 month post-injury. The animals were given ketoprofen (5 mg/kg SC) pre-operatively, and surgery was carried out under isoflurane anesthesia (5% induction, 1–2% maintenance in 100% O2). The left common carotid artery was cannulated with an intra-arterial polyurethane catheter (3 F) and filled with a lock solution (1:10 heparin in 5% dextrose). The cannula was tunneled subcutaneously to a small exit point between the scapulae.
Physiological recording
The animals were acclimated to the testing room for at least 1 h prior to testing and continuous beat-to-beat BP recording was performed 3–4 h after carotid cannulation. At the time of testing, the cannula was flushed with small amounts of heparin solution (0.01 mL; 1:10 heparin in 5% dextrose), and attached via a 30-cm length of polyethylene tubing (PE-50) to a fluid-filled dome on a pressure transducer (SP844 MEMScAP, Norway). Data were recorded using a PowerLab data acquisition system (AD Instruments, Sydney, N.S.W., Australia), with a sampling frequency of 1 KHz. Pulse interval was calculated from the interbeat interval and used to determine HRV. Systolic (SAP) and diastolic (DAP) pressures were derived from the BP waveform maxima and minima. Mean arterial pressure (MAP) was calculated as DAP+1/3 (SAP−DAP). Beat-to-beat BP and pulse interval data were stored for off-line analysis.
Orthostatic hypotension and autonomic dysreflexia
Severity of OH was defined as the maximum decrease (or in the absence of OH, the minimum increase) in SAP during head-upright tilting. A larger fall in SAP indicates more severe OH. Following the 10-min baseline recording, acute orthostatic stress was applied by a weight-supported 90° head-up tilt for 10 sec under loose restraint. Ten animals (1 control, 4 with T3 SCI, and 5 with T10 SCI) experienced the acute orthostatic stress protocol consisting of three tilts each, separated by a rest period to allow BP to return to baseline values. There was no difference in the SAP change between trials; therefore, the average response of each animal to tilting was used for further analysis.
Colorectal distension (CRD) was performed in 16 animals (9 with T3 SCI and 7 with T10 SCI), as described previously (Krassioukov et al., 2002). Severity of AD was defined as the maximum increase in SAP during the stimulus. To perform CRD, the distal tip of a Swan-Ganz catheter (Edwards Lifesciences, Mississauga, Canada) was lubricated and inserted 5 cm into the rectum. The catheter was secured to the proximal tail using tape, followed by a 5-min rest period to allow BP to return to baseline if it was altered during the process of inserting the rectal balloon. The balloon tip of the catheter was then filled with 2 mL of air over a period of 10 sec, using a 3-cc syringe connected to the balloon inflation port. The balloon distends to the approximate size of several fecal boli, and exerts a pressure of about 35 mm Hg (measured through a sidearm of the catheter). The pressure was maintained for 60 sec. Two distensions were performed, with a rest period of at least 10 min between each test to allow BP to return to baseline values. There was no difference in the SAP change in response to colorectal distension between trials; therefore, each animal's response was averaged over the two trials. CRD was not performed in control animals because AD cannot be elicited in neurologically intact animals (Krassioukov and Weaver, 1995).
Spectral analyses
Frequency domain analyses were performed using the standard technique in our laboratory (Claydon and Krassioukov, 2007; Gulli et al., 2007). In brief, time series of successive beats from the beat-to-beat BP and pulse interval data were generated, and any significant outliers due to ectopic beats or spasticity were corrected by linear interpolation of the surrounding normal beats. Significant trends were corrected by subtracting the best-fitted polynomial function from the data. Autoregressive monovariate models were fitted to the time series (Bartoli et al., 1985; Cevese et al., 2001; Gulli et al., 2003). VLF (<0.1 Hz), LF (0.4–1.0 Hz), and HF (1.0–3.0 Hz) peaks were identified for each spectrum, and the power and central frequency at each peak were calculated by computation of the residuals (Johnsen and Andersen, 1978). When appropriate, powers were normalized by dividing the power by total variance minus VLF, and multiplying by 100 (Task Force of the European Society of Cardiology and the North American Society of Pacing and Electrophysiology, 1996).
Data analyses
Baseline cardiovascular parameters were averaged over the 10-min resting recording period. During the tilt and CRD procedures, BP and pulse interval were averaged over 1-sec intervals during the stimulus. The magnitude of OH was defined as the maximum decrease (or minimum increase) in SAP during the stimulus, relative to the average value of the 30 sec prior to the tilt. The magnitude of AD was defined as the maximum increase in SAP during the stimulus.
Statistical analyses
Data are expressed as mean±standard error of the mean (SEM). Statistical analyses were performed using SigmaPlot version 11 (Systat Software Inc., San Jose, CA). Data were tested for normality using the Shapiro-Wilk test. Comparisons between groups were performed using a one-way analysis of variance (ANOVA) with the Tukey or Bonferroni post-hoc test for parametric data, or the Kruskal-Wallis ANOVA on ranks with the Dunn post-hoc test for non-parametric data. Correlations between variables were conducted using the Pearson Product Moment Correlation for parametric data and the Spearman Rank Order Correlation for non-parametric data.
Results
At 1 month after SCI, resting SAP, DAP, and MAP were significantly lower in rats with T3 SCI than in those with T10 SCI and uninjured controls (Table 1). Resting HR was significantly higher in both SCI groups than in controls (p<0.05).
p<0.05 indicates significant difference from controls.
p<0.05 indicates significant difference from T10 SCI.
Baseline blood pressures were significantly reduced in animals with T3 SCI compared to control animals and those with T10 SCI. Baseline pulse intervals were significantly reduced in T3 and T10 animals compared to controls (and thus heart rates were increased).
SAP, systolic arterial pressure; DAP, diastolic arterial pressure; MAP, mean arterial pressure; SCI, spinal cord injury.
Example time series traces and power spectra from representative animals with T3 SCI, T10 SCI, and an uninjured control can be seen in Figure 1. Time series for both pulse interval and SAP show markedly reduced variability in the animal with T3 SCI compared the control. Spectra for pulse interval and SAP also depict reduced variability in the animal with T3 SCI, particularly in the VLF and LF ranges. Variability in the animal with T10 SCI was intermediate between the control and the animal with T3 SCI. Group data showing HRV (derived from pulse interval) and BPV can be seen in Figures 2 and 3 respectively.
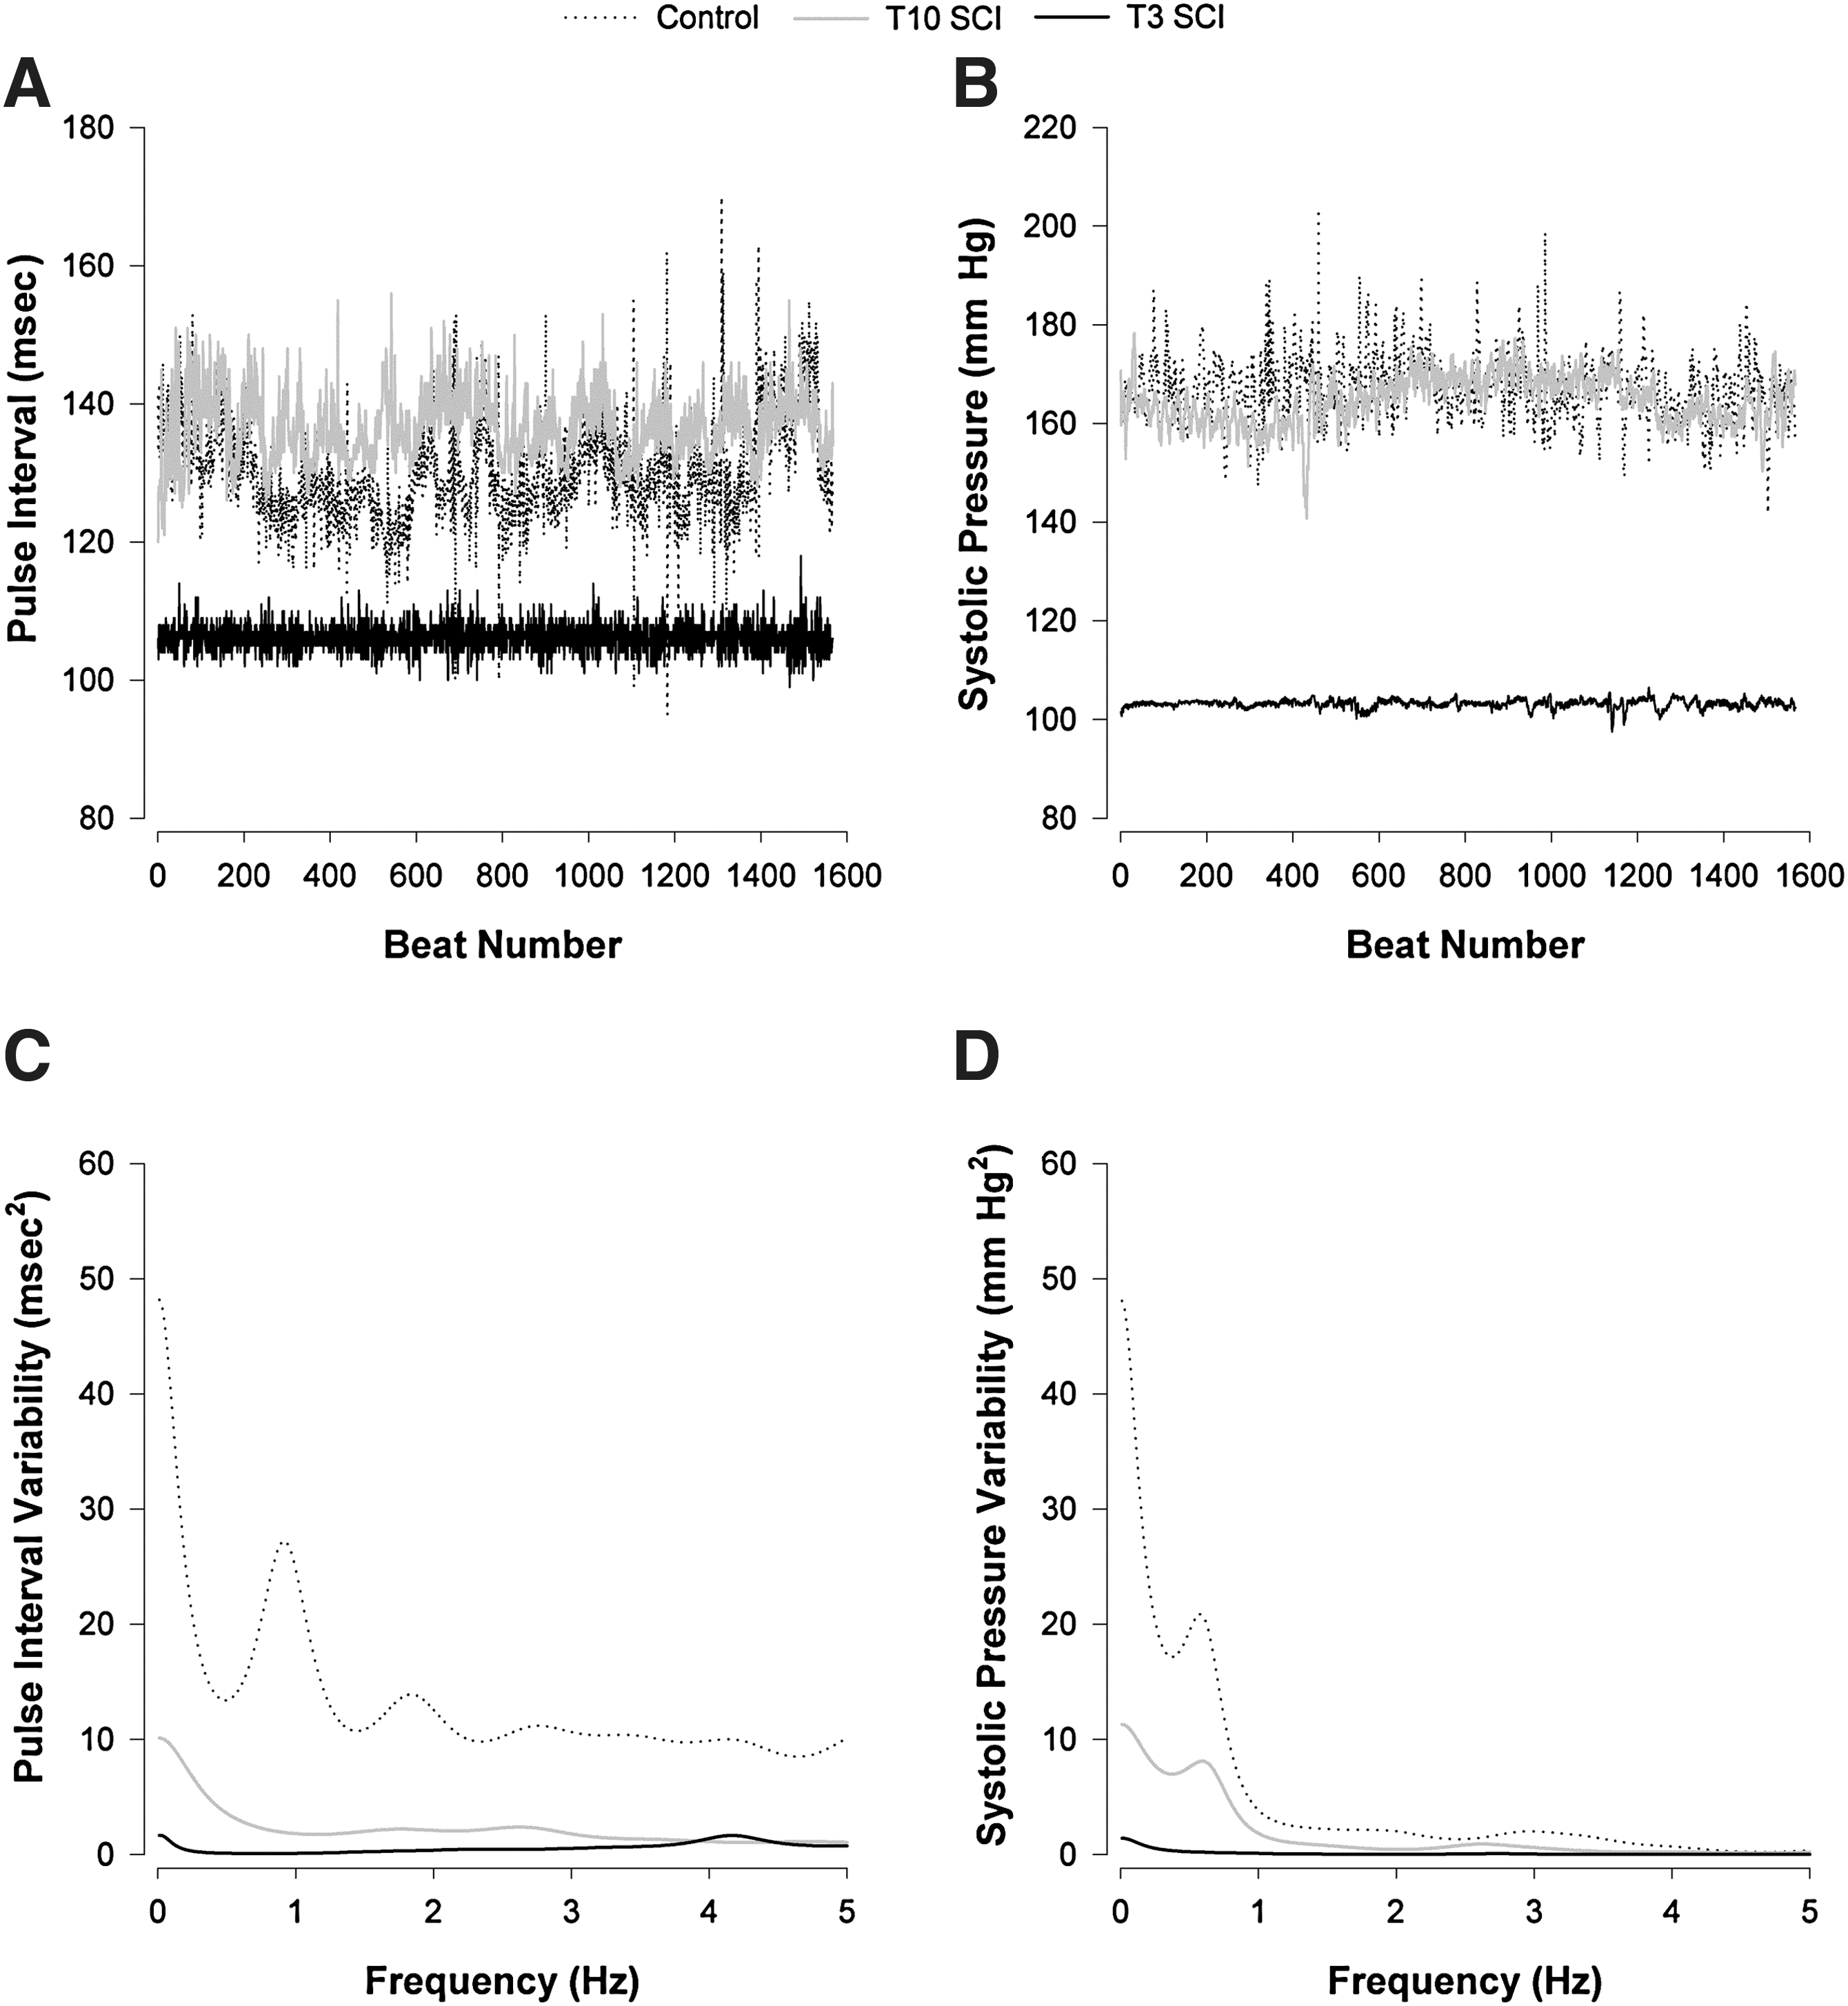
Example time series and power spectra of pulse interval and systolic arterial pressure variability from representative animals in the three groups studied. Time series were generated for pulse interval

Heart rate variability (HRV) in the three groups studied for each frequency of interest. The HRV power was expressed in absolute units (
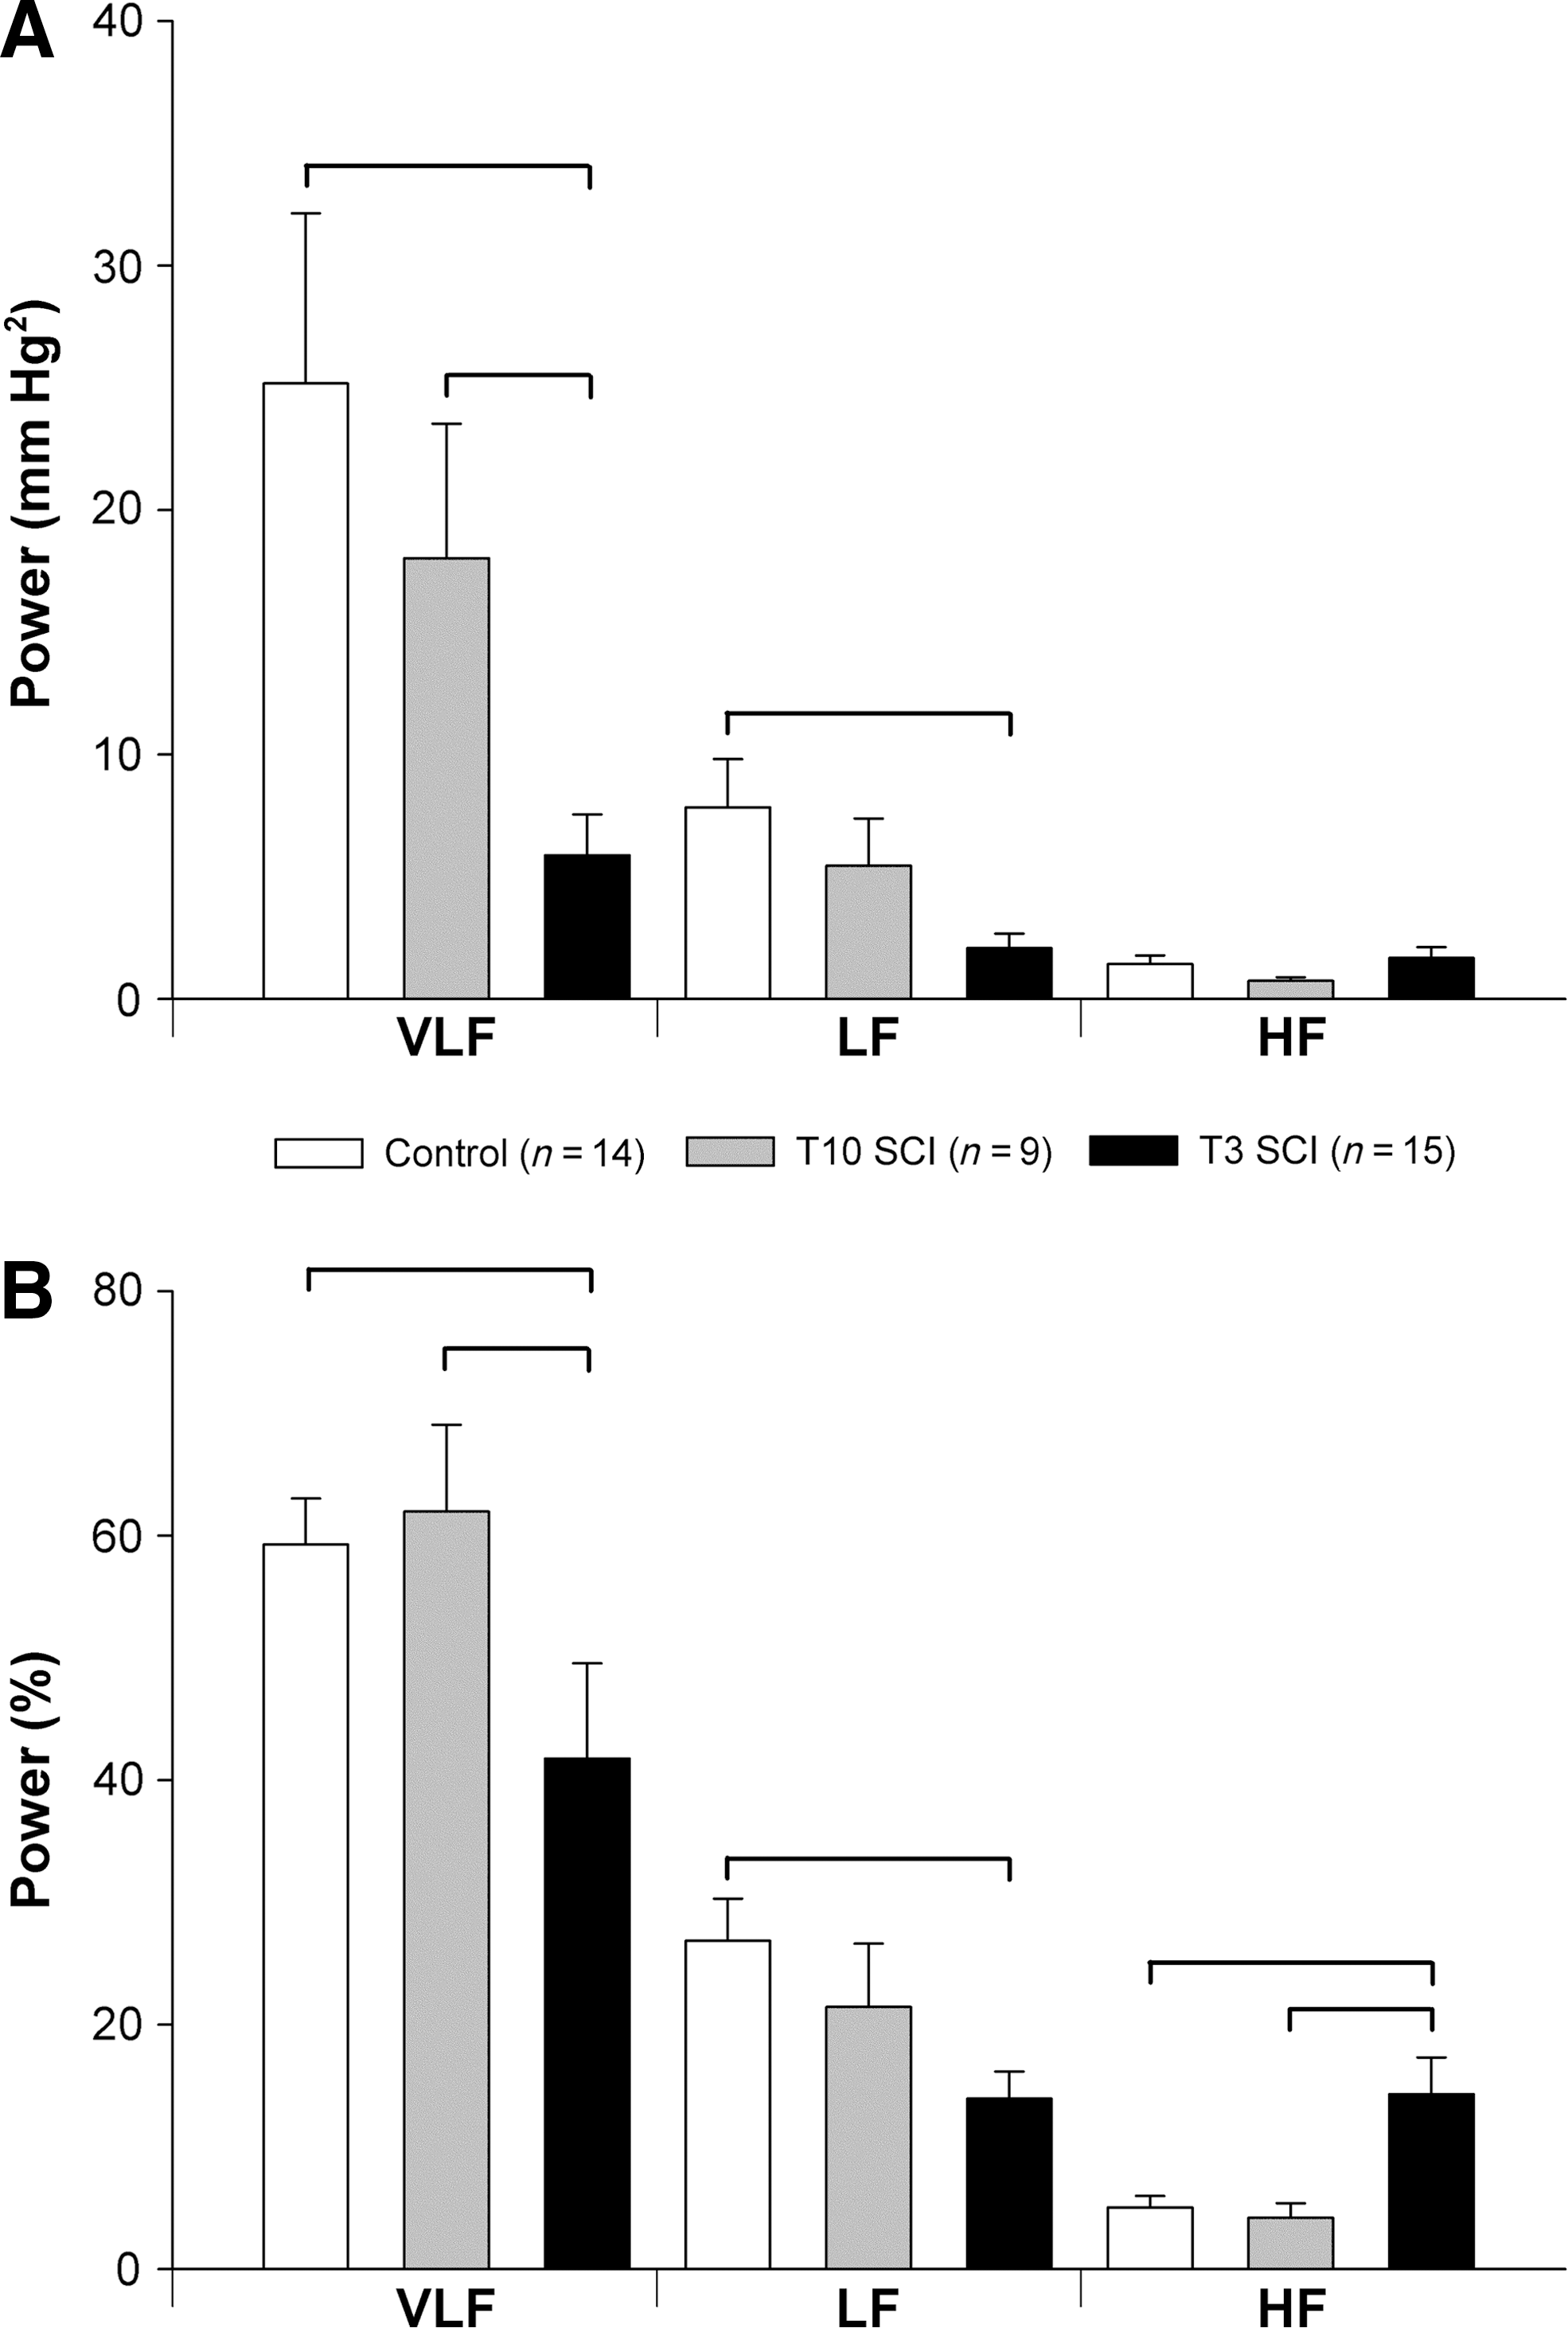
Blood pressure variability (BPV) in the three groups studied for each frequency of interest. The systolic arterial BPV power was expressed in absolute units (
The central frequencies of the LF HRV and HF HRV were not different between the three groups (LF: control 0.797±0.07; T10 SCI 0.783±0.06; T3 SCI 0.762±0.03 Hz; and HF: control 1.798±0.13; T10 SCI 2.188±0.17; T3 SCI 1.990±0.11 Hz). VLF HRV was significantly lower in animals with T3 SCI compared to controls and animals with T10 SCI (Fig. 2). LF HRV was also lower than in controls and animals with T10 SCI. The HF component of HRV in absolute units (msec2) was smaller in animals with T3 SCI than in controls, but when expressed as the percentage of the total variance, was high compared to both animals with T10 SCI and controls (Fig. 3). This reflects the smaller total HRV in animals with T3 SCI compared to controls (Fig. 4). The LF:HF ratio was also significantly smaller in animals with T3 SCI than in controls (Fig. 5).
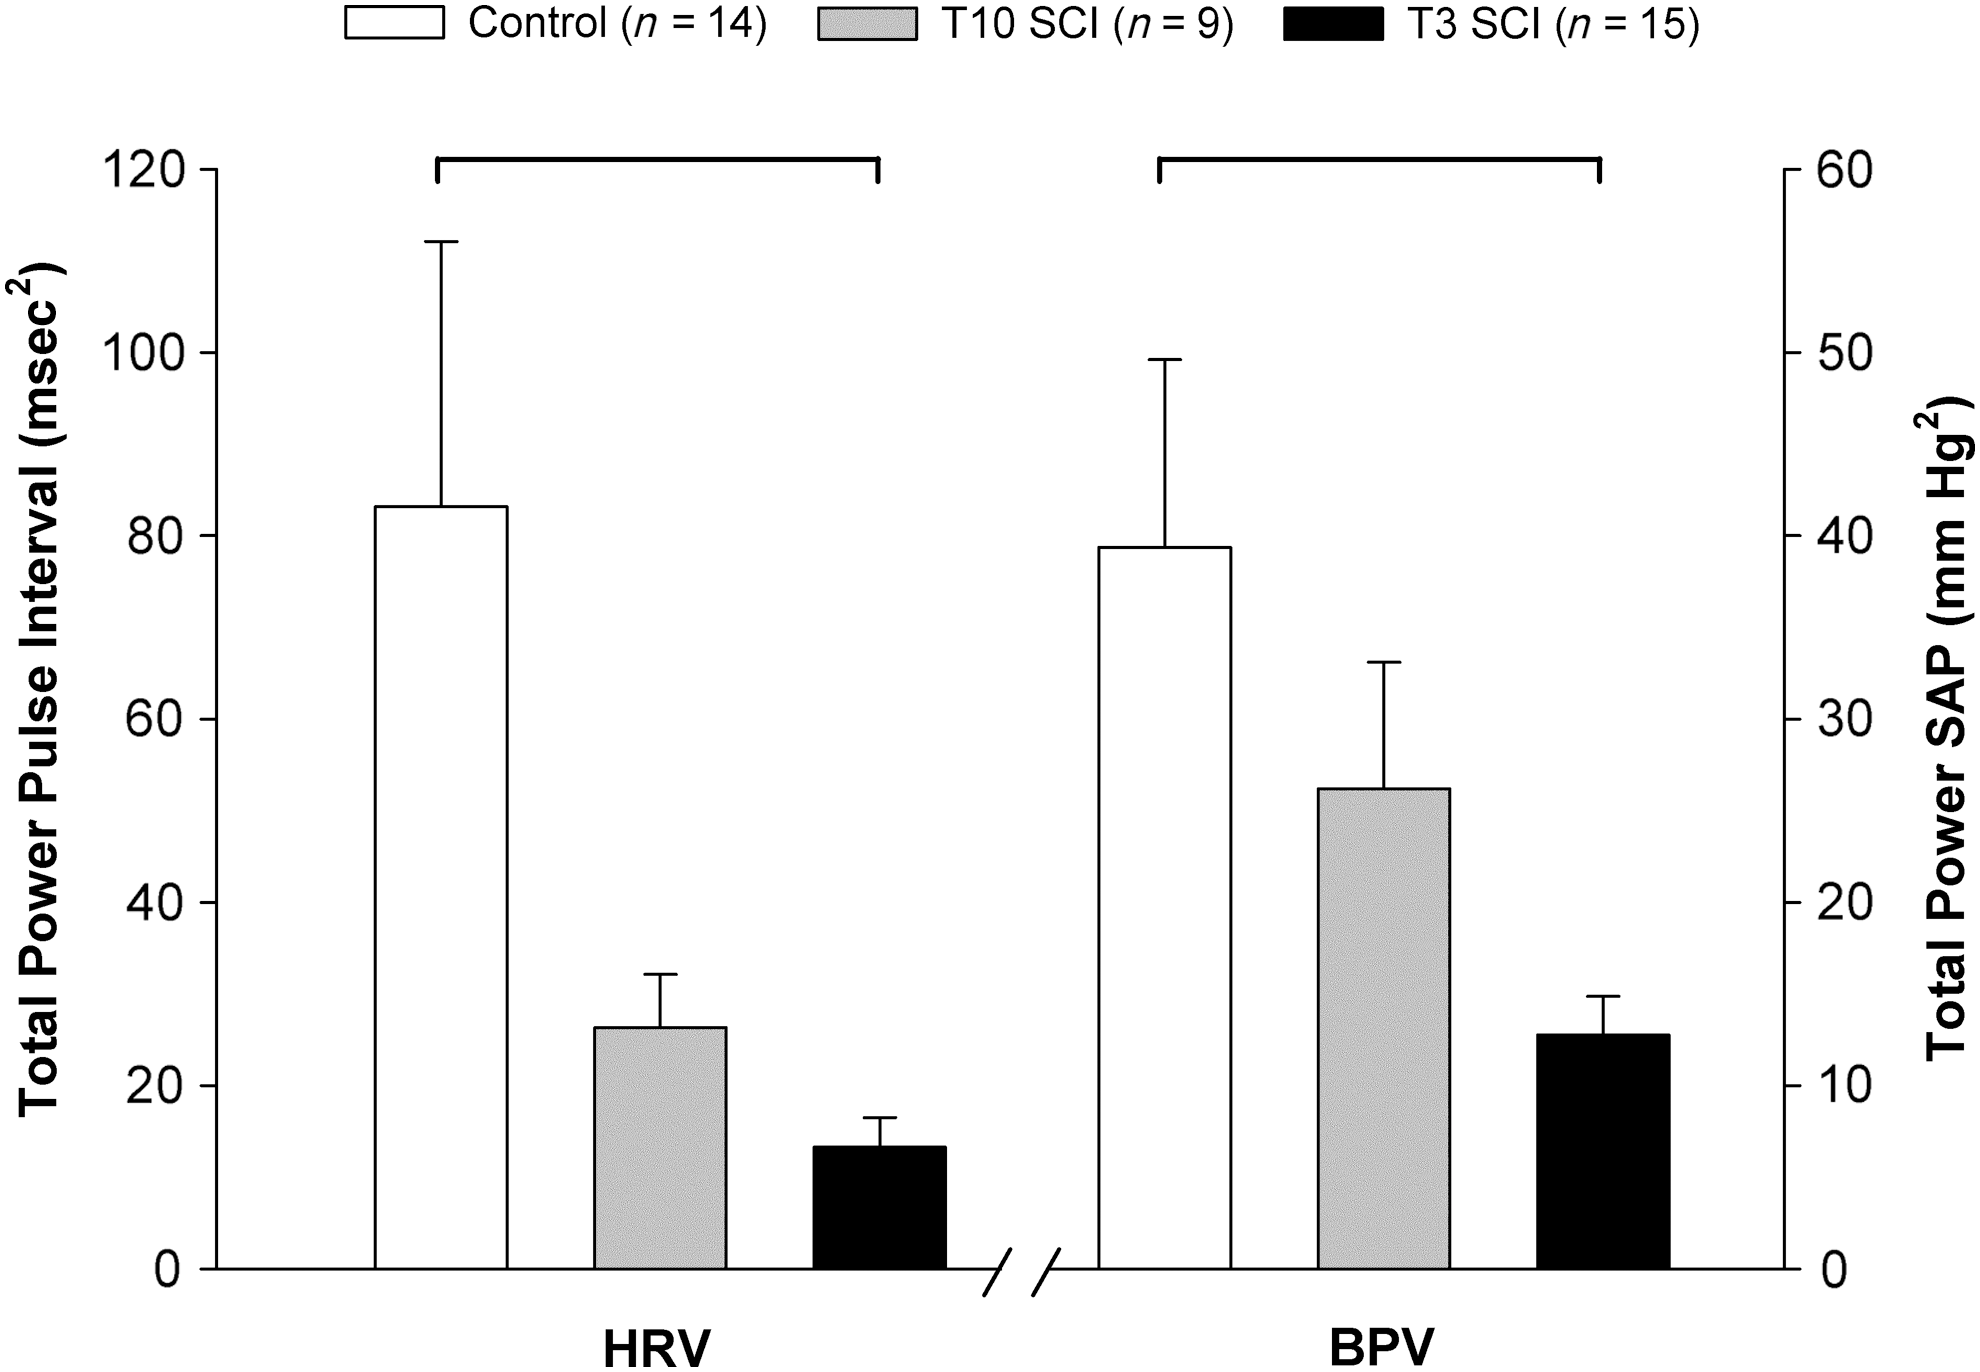
Total heart rate variability (HRV) and blood pressure variability (BPV) in the three groups studied. HRV was calculated from pulse interval variability. BPV was calculated from the systolic arterial pressure (SAP) variability. Significant differences between groups are denoted by the horizontal bars (p<0.05; SCI, spinal cord injury).
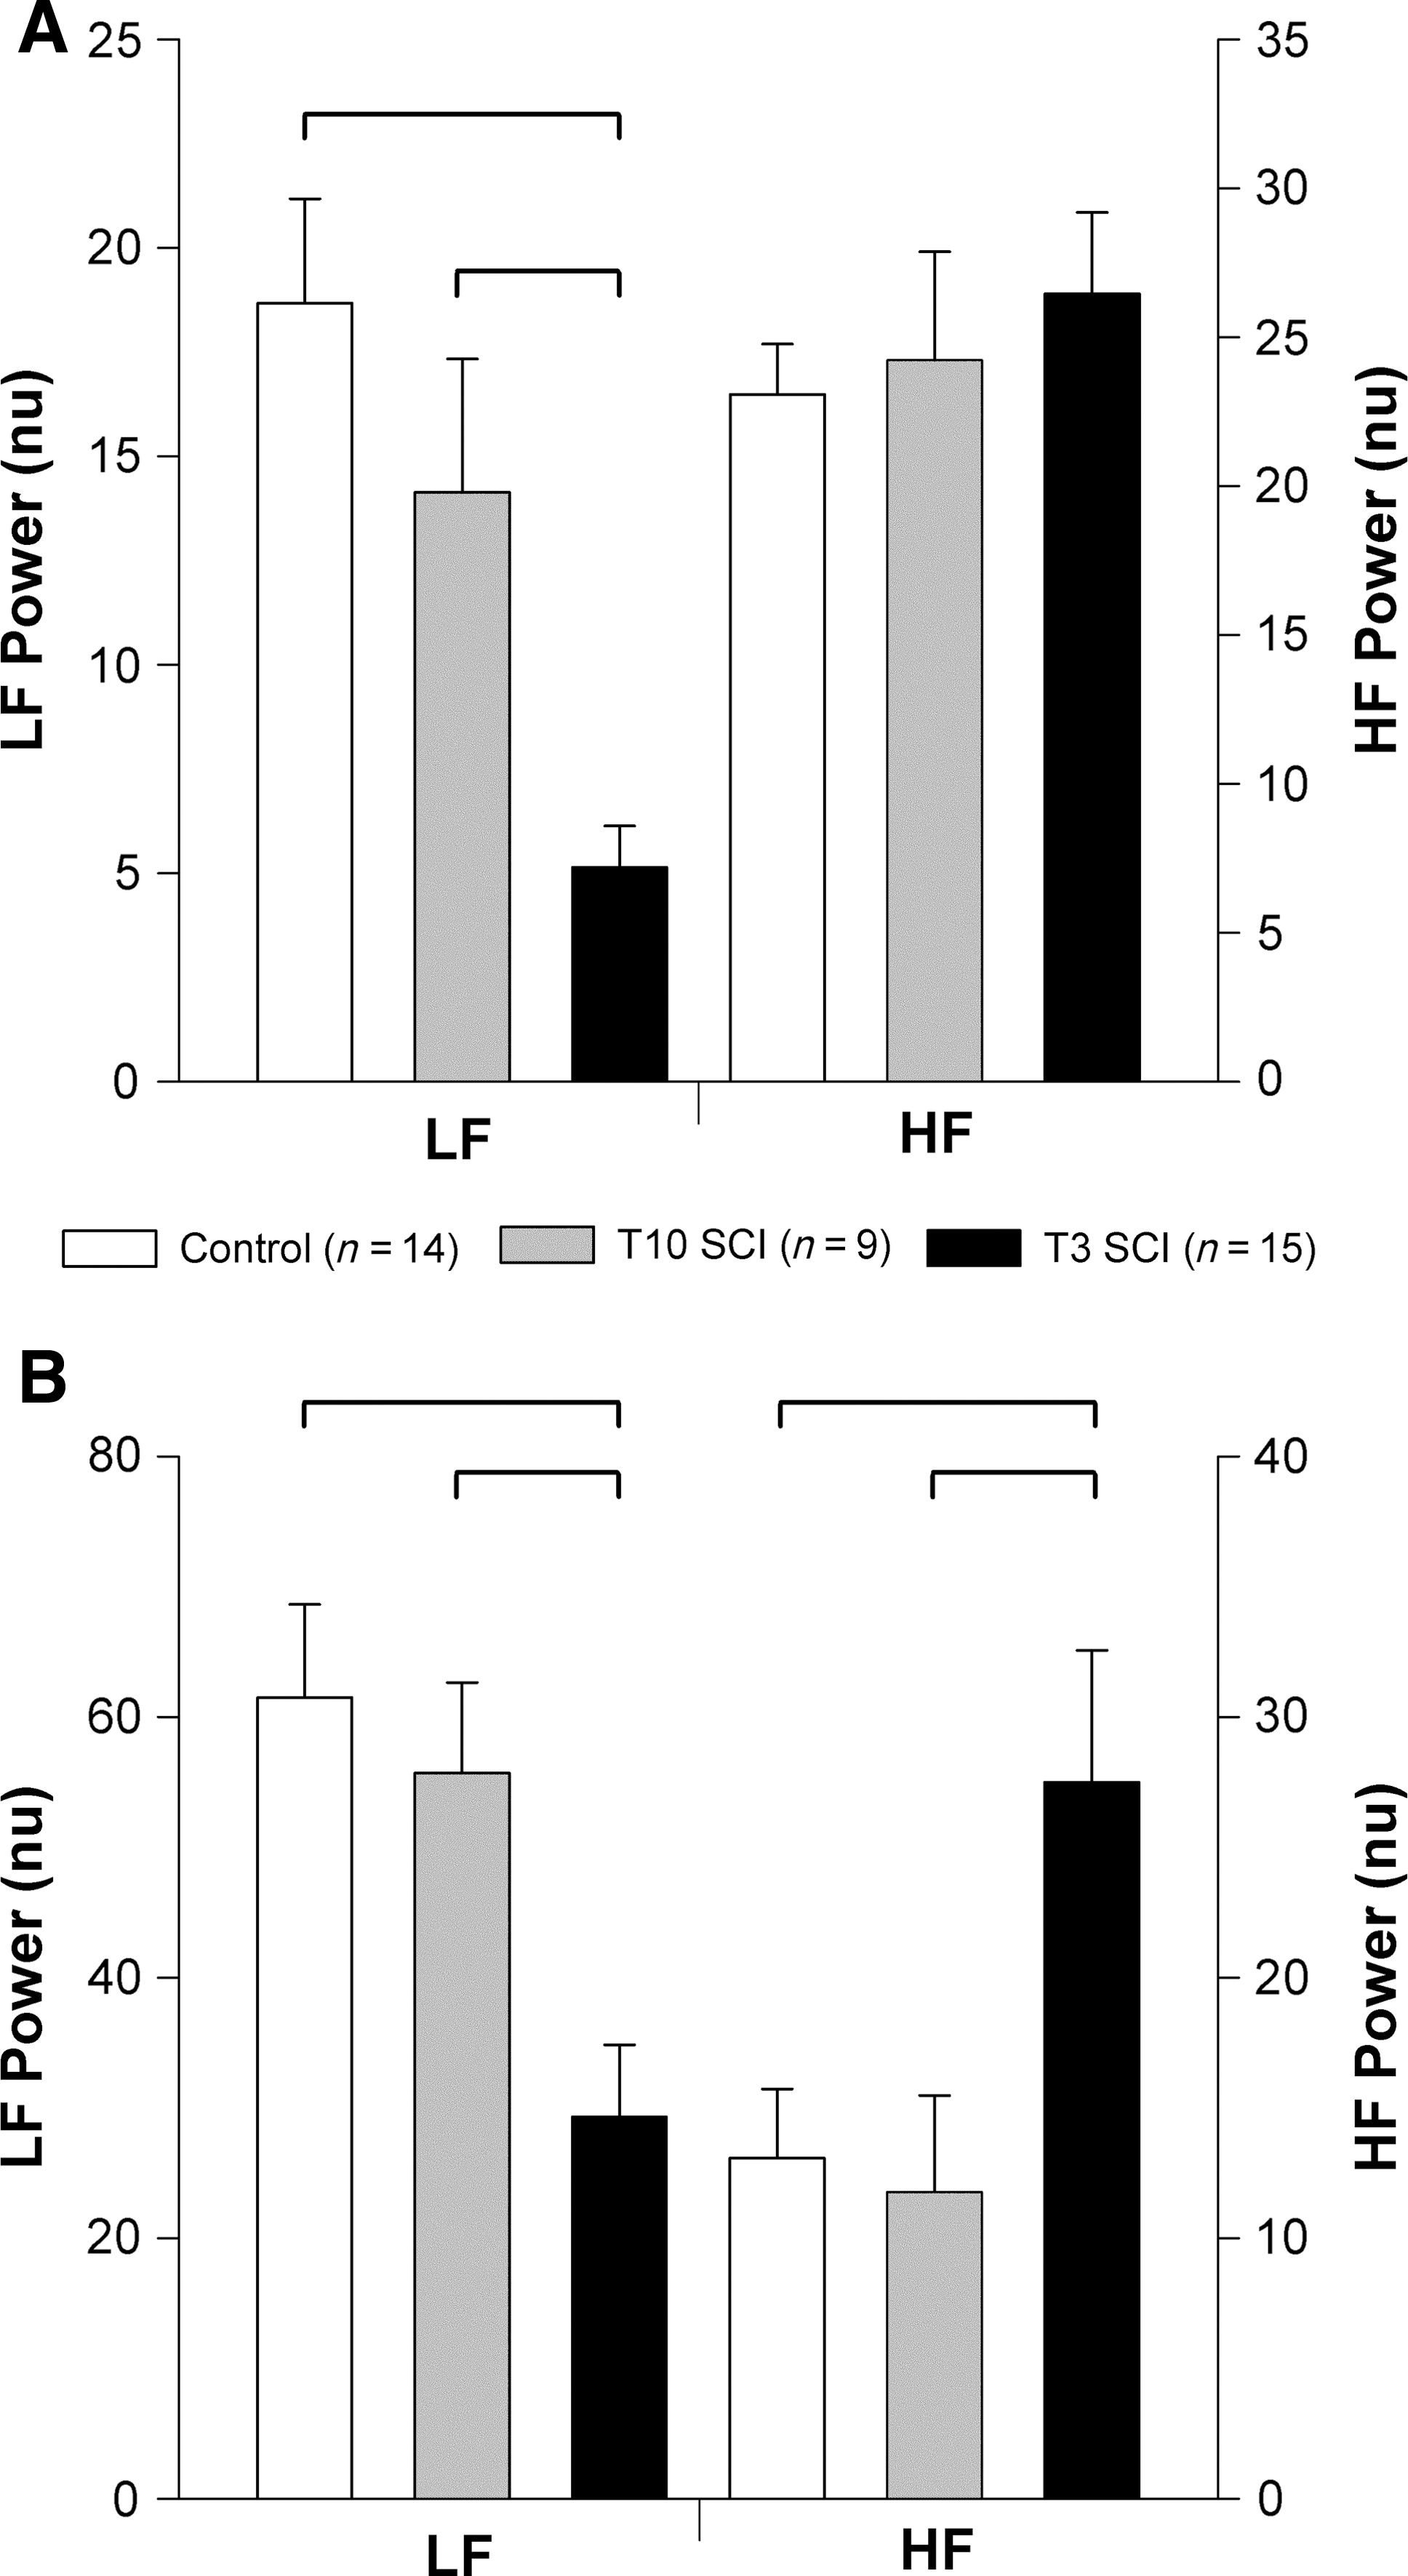
Normalized power of heart rate variability (HRV) and blood pressure variability (BPV) in the low frequency (LF) and high frequency (HF) ranges. HRV was calculated from pulse interval variability (
The central frequency of the HF SAP was not different between groups (control 1.547±0.13; T10 SCI 1.920±0.17; T3 SCI 1.972±0.11 Hz). The central frequency of the LF SAP was right-shifted in animals with T3 SCI (0.716±0.05 Hz) compared to controls (0.472±0.02 Hz; p<0.05), and those with T10 SCI (0.555±0.02 Hz; p<0.05). Animals with T3 SCI showed significantly lower VLF SAP variability compared to controls and animals with T10 SCI (Fig. 3). LF SAP variability was also lower in animals with T3 SCI than controls, and (when expressed as normalized units) T10 SCI animals. The absolute HF SAP variability (mm Hg2) was similar between groups, but both the percentage variability (and normalized variability) in the HF range were greater in animals with T3 SCI than in controls and those with T10 SCI (Fig. 3). Similar results were obtained from the variability analyses of DAP and MAP (data not shown).
Total HRV and BPV were markedly reduced in animals with T3 SCI compared to controls (Fig. 4). When expressed as normalized units, LF oscillations in both pulse interval and SAP were lower in animals with T3 SCI than in controls and animals with T10 SCI (Fig. 5). Normalized HF HRV was similar in all three groups. Normalized HF BPV was significantly larger in animals with T3 SCI than in controls and T10 SCI animals.
There were no significant differences in any HRV or BPV variability parameters between T10 SCI animals and controls.
Correlations between spectral analyses and severity of orthostatic hypotension and autonomic dysreflexia
Figure 6 shows a representative beat-to-beat BP recording illustrating marked OH and AD from an animal with T3 SCI.

Example beat-to-beat blood pressure recordings showing autonomic dysreflexia (AD) and orthostatic hypotension (OH) in a representative animal with T3 spinal cord injury (SCI). AD was elicited by 1 min of colorectal distension (
The severity of OH was positively correlated with the LF SAP, and was negatively correlated with HF SAP (Fig. 7A and B). The severity of OH was also positively correlated with the resting SAP and negatively correlated with the magnitude of the HF HRV (Fig. 7C and D).
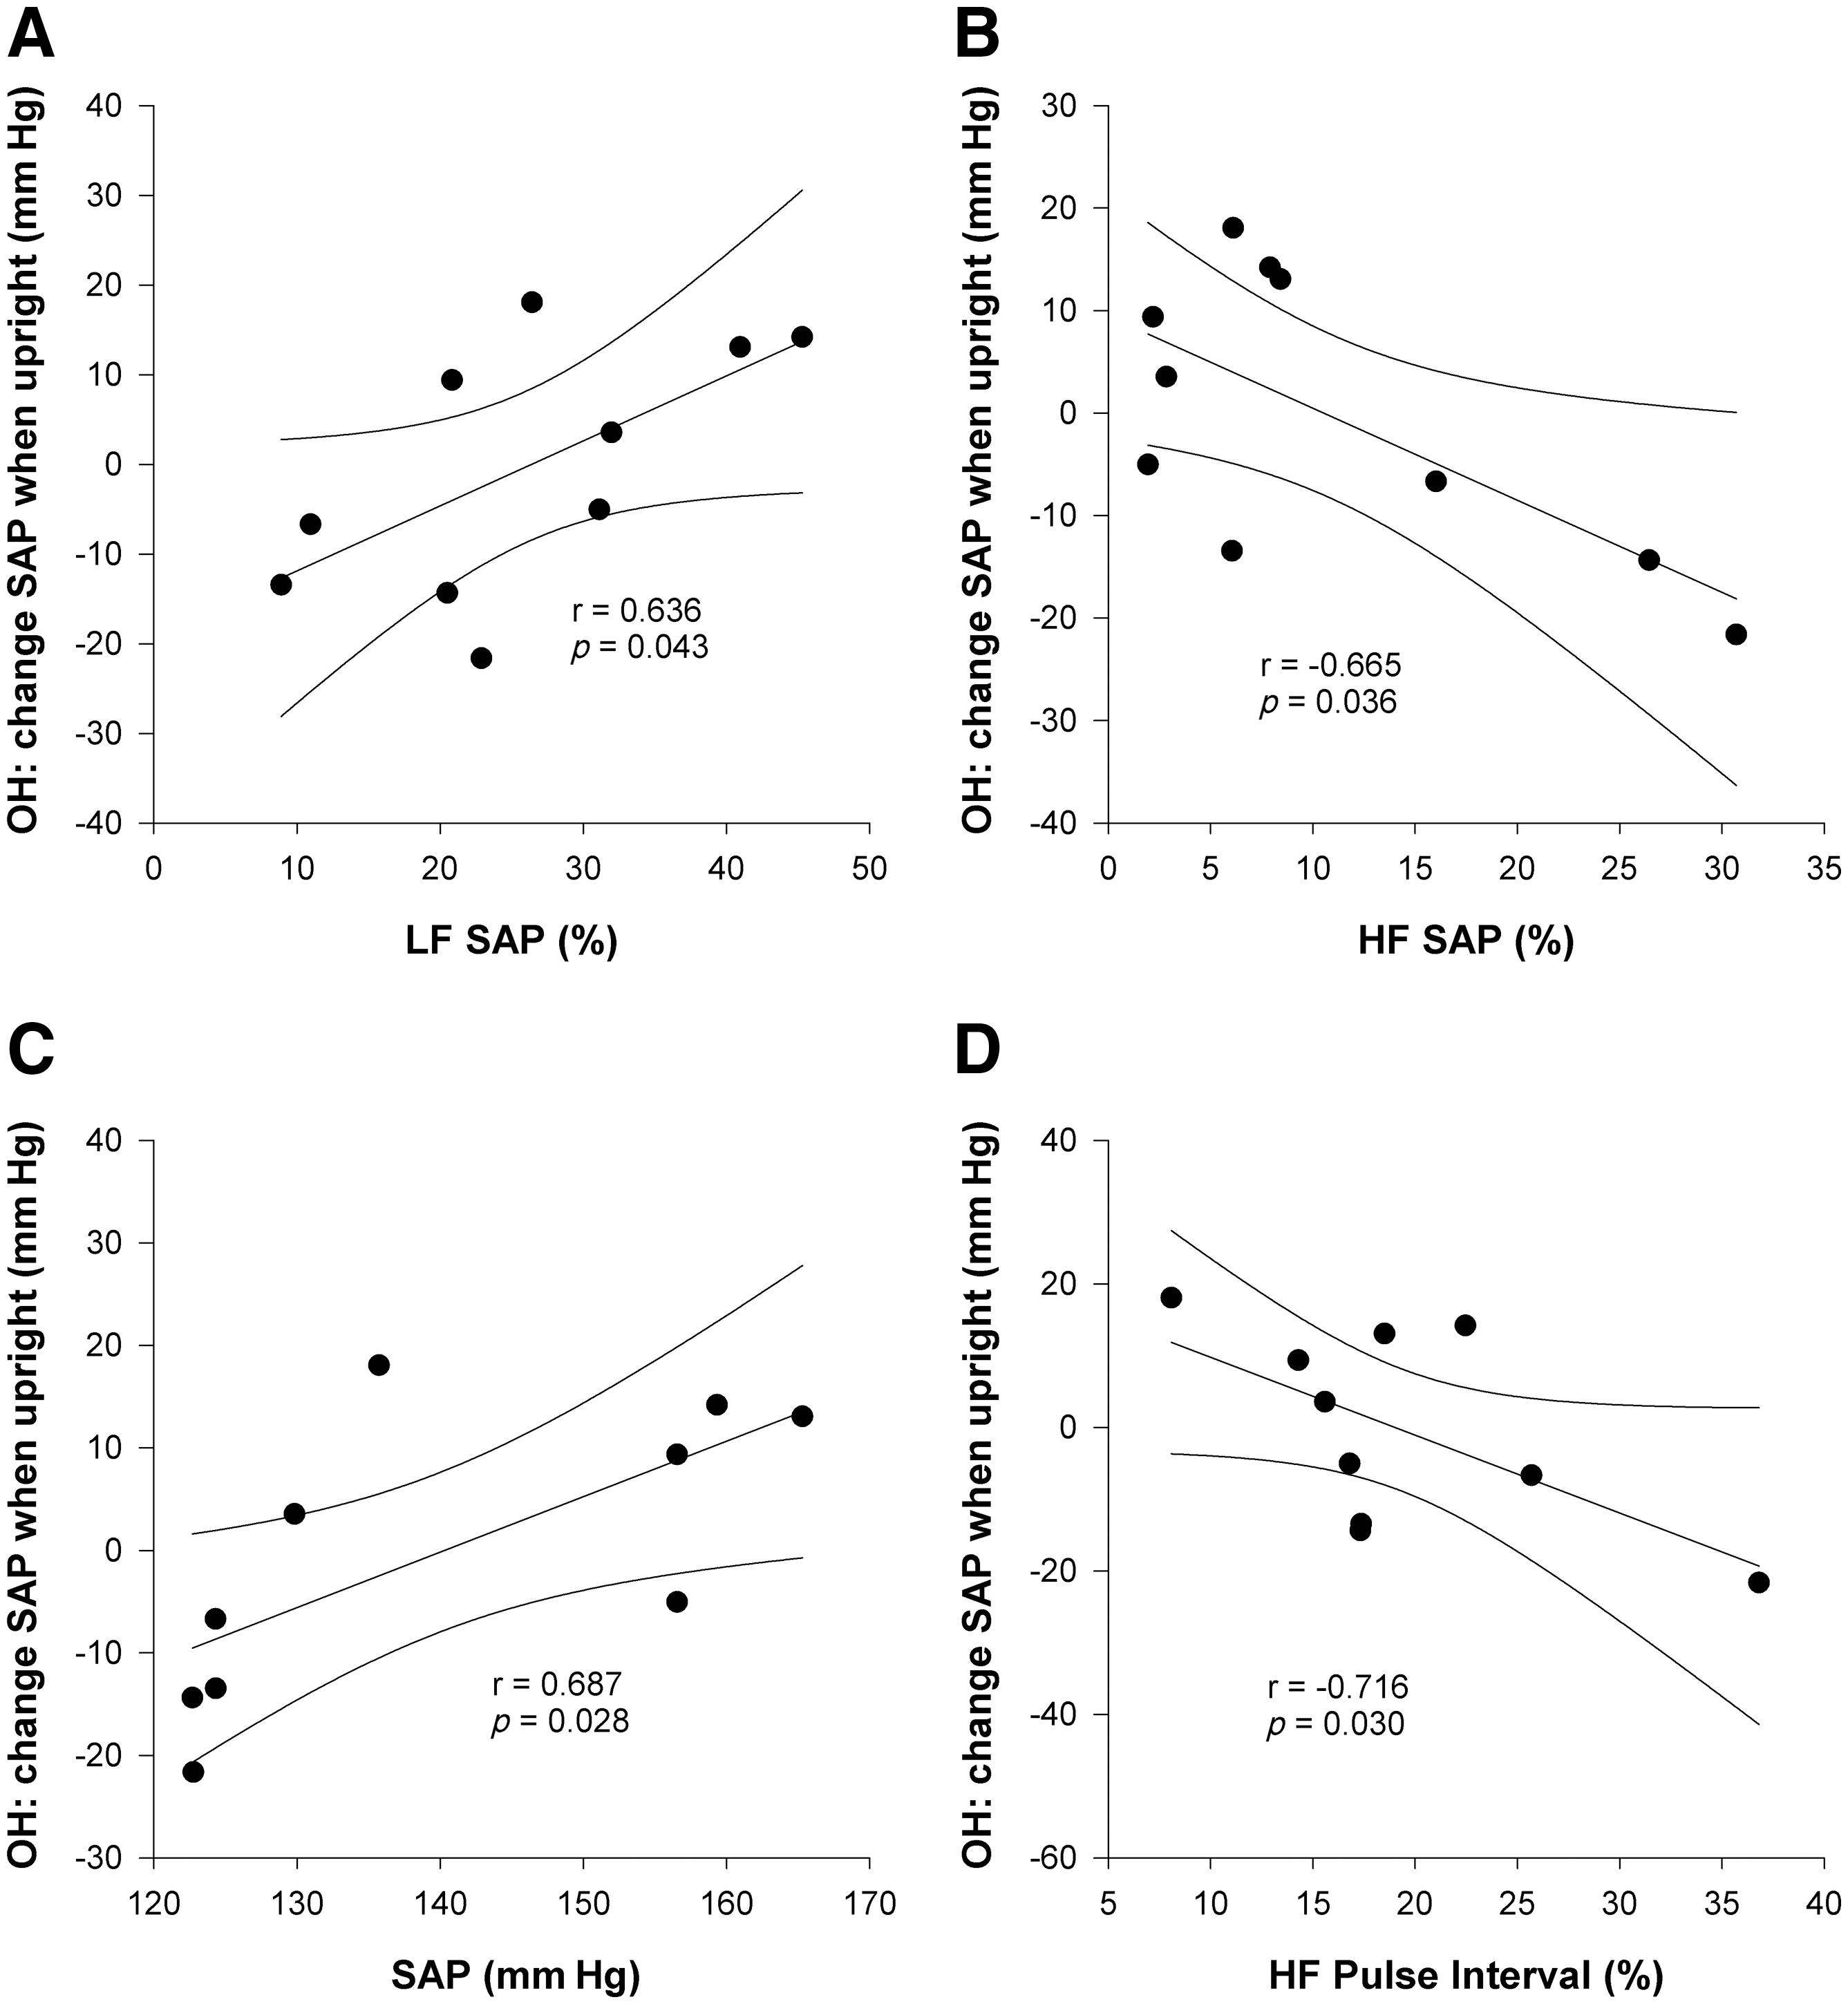
Correlations between resting frequency domain variables and severity of orthostatic hypotension (OH). The change in systolic arterial pressure (SAP) during head-upright tilting was used to determine the severity of OH. The maximum decrease (or minimum increase) in SAP when upright is plotted against frequency domain variables from data collected during resting conditions (LF, low frequency; HF, high frequency; VLF, very low frequency).
The severity of AD was positively correlated with the HF oscillations in both SAP and HRV (Fig. 8A and B), and was negatively correlated with the VLF oscillations in HRV (Fig. 8C and D).
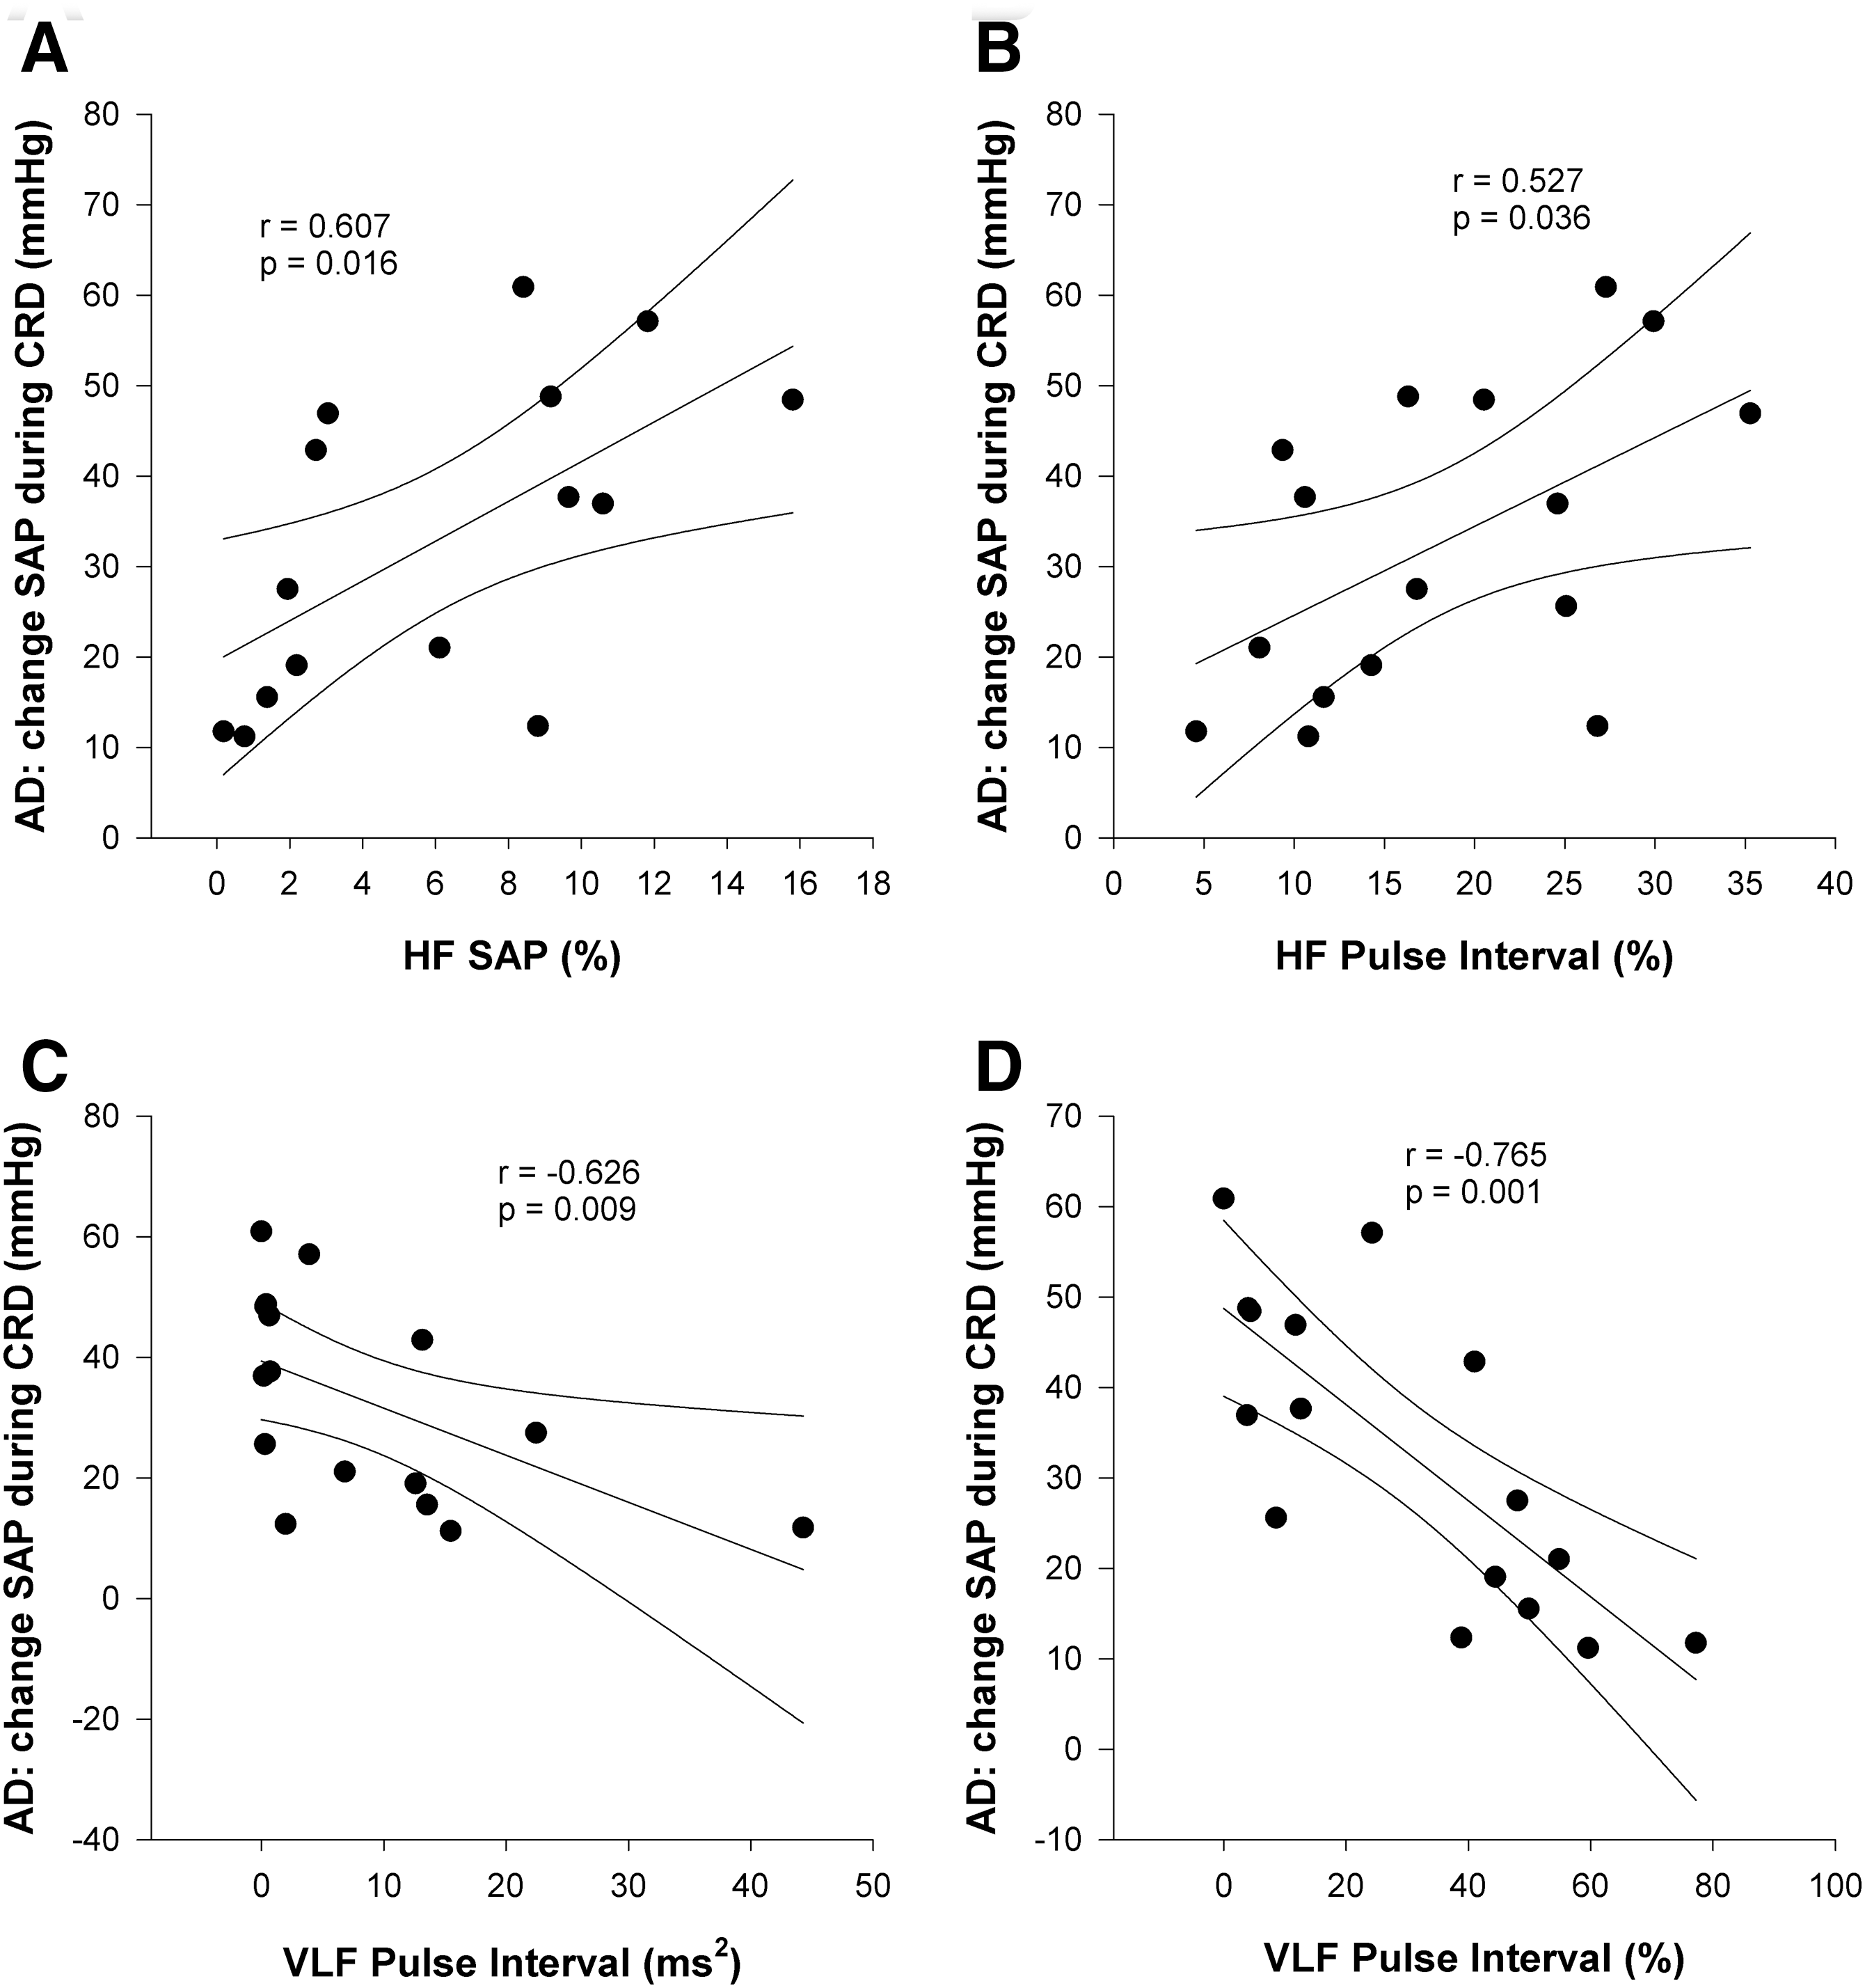
Correlations between resting frequency domain variables and severity of autonomic dysreflexia (AD). AD was triggered by one minute of colorectal distension (CRD). Severity of AD was defined as the maximum increase in systolic arterial pressure (SAP) during CRD (HF, high frequency; VLF, very low frequency).
Discussion
We have shown that spectral analyses can detect alterations in cardiovascular control at rest in animals with SCI, and can distinguish between animals with high-thoracic and low-thoracic SCI. Importantly, these parameters also correlated well with the severity of AD and OH, which are clinically important measures of abnormal BP control after SCI. Furthermore, these observations directly parallel similar studies in humans with SCI (Claydon and Krassioukov, 2007), highlighting the potential for this technique to provide a translatable measure of cardiovascular autonomic function from the bench to the bedside and vice versa.
Frequency analyses can distinguish between animals with high- and low-level SCI
We observed markedly reduced LF SAP in animals with high, but not low, thoracic SCI. This is consistent with previous studies in humans (Claydon and Krassioukov, 2007; Houtman et al., 2000; Inoue et al., 1991; Munakata et al., 2001), and likely reflects injury to descending sympathetic pathways (Randall et al., 2005), and consequent loss of tonic sympathetic drive to the key resistance and capacitance vessels in the splanchnic vascular bed in those with high-level SCI (Claydon and Krassioukov, 2007; Inoue et al., 1991). Accordingly, hypotension was apparent in animals with T3 SCI, but not in those with T10 SCI. We, and others, have observed this resting hypotension in rodents with chronic high-level SCI (Laird et al., 2006), and in people with SCI (Claydon and Krassioukov, 2007; Claydon et al., 2006; Mathias, 2006). One other study examined LF SAP in rodents after acute (up to 1 week) high-level SCI and found a similar reduction in LF SAP (Randall et al., 2005). It is interesting that the LF oscillations in SAP were markedly reduced, but not abolished, in the T3 SCI animals. This is compatible with a small component of this variability being indicative of spinal rhythmicity in the absence of supraspinal control (Houtman et al., 2000; Munakata et al., 1997).
As in humans with SCI (Claydon and Krassioukov, 2007), VLF BPV was reduced in animals with high-level SCI. These oscillations reflect alterations in myogenic tone, mediated by an L-type calcium channel-dependent mechanism in response to spontaneously occurring perturbations in BP (Langager et al., 2007). Thus, reduced VLF BPV could simply reflect reduced total BPV in these animals, resulting in fewer and smaller spontaneously occurring BP oscillations to generate myogenic responses, or it could imply an intrinsic alteration in myogenic function. Further experiments will be required to identify the underlying mechanism, but it is possible that endothelial adaptations and/or alterations in myogenic vascular responsiveness could accompany SCI (Kooijman et al., 2007).
HF BPV was increased in animals with high-thoracic SCI. This could be due to the effects of high-level injury upon respiration (Mateus et al., 2007), and the transmission of the accompanying alterations in intrathoracic pressure to the BP waveform (Akselrod et al., 1985; Baselli et al., 1986; Parati et al., 1995; Ramaekers et al., 2002). An alternative explanation could be a “feed-forward” mechanism, whereby the greater HF oscillations in HRV observed in this group generate greater HF oscillations in BPV (Akselrod et al., 1985).
As in humans (Claydon et al., 2007), LF HRV was markedly reduced in animals with T3 SCI, but not T10 SCI. This likely reflects loss of supraspinal control of cardiac sympathetic pathways in animals with high-level lesions (Claydon and Krassioukov, 2007; Grimm et al., 1995,1997; Inoue et al., 1995). However, it is also possible that the reduction in LF HRV partly reflects the loss of LF SAP variability being transmitted into the HRV spectrum via a baroreflex-mediated mechanism. The fact that these oscillations were not abolished is compatible with a significant proportion of these oscillations being underscored by cardiac vagal activity, as has been reported previously (Akselrod et al., 1985; Grasso et al., 1997). This would not be expected to be impaired by SCI, because the cardiac vagus exits the central nervous system at the level of the brainstem, without descending through the cord (Claydon et al., 2006c). VLF HRV was also markedly reduced in animals with T3 SCI. Accordingly, the total HRV (which is dominated by VLF oscillations) was also reduced in these animals. Again, this is similar to observations in humans with SCI (Claydon and Krassioukov, 2007). The mechanism underlying the VLF oscillations is not clearly understood (Cohen et al., 2002; Parati et al., 1995), but it is known that reduced VLF HRV is associated with increased cardiovascular morbidity and mortality (Kleiger et al., 2005).
As in BPV, HF HRV was increased in animals with T3 SCI, presumably reflecting altered respiratory mechanics after high-level SCI (Mateus et al., 2007), coupled with high and unopposed vagal influences on the heart (Claydon et al., 2006c; Krassioukov and Claydon, 2006), and associated pronounced respiratory sinus arrhythmia. Interestingly, we observed faster resting HR in both groups of animals with SCI. This has been observed before in rodents with SCI (Collins et al., 2006; Krassioukov and Weaver, 1995), but at first glance appears inconsistent with the increase in vagally-mediated HRV observed in the HF range. However, increased HF HRV reflects increased variability in heart period driven by oscillations in vagal outflow, and does not necessarily imply that the absolute vagal tone is high, merely that it is fluctuating more. This relative tachycardia in both groups of SCI animals is different than responses seen in humans with SCI, in whom those with high-level injuries tend to experience bradycardia (Claydon and Krassioukov, 2006; Claydon et al., 2006c). The reasons for this discrepancy are unknown. It is unlikely to be related to the SCI surgical procedures, such as hypovolemia due to fluid loss during surgery, since these recordings were performed 1 month after injury. While the acute carotid cannulation procedure could conceivably have influenced our results, we have shown similar resting HR in control animals of the same strain using telemetric recording conducted 1 week after cannulation (Krassioukov and Weaver, 1995; Mayorov et al., 2001); therefore, we believe that our current results are unlikely to reflect an acute response to the cannulation procedure. Furthermore, we also observed tachycardia in SCI animals using the same technique 1 week after cannulation, again suggesting that this is not an artifact induced by the cannulation surgery. A deconditioning response is unlikely, because if this were the case, tachycardia would also be expected in humans with high-level SCI.
Therefore we have demonstrated that as in humans with SCI, frequency analyses of cardiovascular variability are able to identify abnormalities in cardiovascular autonomic control in rodents with SCI, and can distinguish between those with complete high- and low-level injuries. The fact that animals with T10 SCI did not show abnormalities in these measures suggests that the deficits observed after high-level SCI reflect injury to cardiovascular autonomic pathways rather than a deconditioning response, since both groups of animals with SCI experienced hindlimb paralysis and thus a similar impact upon locomotion.
Frequency analyses are correlated with clinically-relevant measures of cardiovascular dysfunction in rodents with SCI
We observed significant correlations between markers of HRV and BPV and clinically-relevant measures of autonomic dysfunction after SCI.
Increasing severity of OH was correlated with low resting BP, reduced LF SAP, and increased HF oscillations in both BPV and HRV. This likely reflects the direct relationship between destruction of descending sympathetic pathways and impaired baroreflex-mediated increases in sympathetic outflow to resistance vessels during orthostatic stress (Claydon and Krassioukov, 2006). We propose that the correlation with HF HRV reflects an indirect relationship between high-level SCI and injury to sympathetic pathways (and thus severe OH) with dependence on vagal modulation of HR. The correlation between severity of OH and increased HF BPV likely reflects an indirect relationship between high-level SCI and altered respiratory mechanics, and/or the generation of greater HF BPV in response to greater HF HRV in these animals through a proposed “feed-forward” mechanism (Akselrod et al., 1985).
More severe AD was correlated with lower VLF HRV, increased HF HRV, and increased HF SAP. The relationship between severity of AD and VLF HRV supports a potential link between AD and cardiovascular morbidity and mortality (Alan et al., 2010). The relationship between severity of AD and respiratory oscillations in both HRV and BPV is consistent with the relationships between these parameters and OH, likely reflecting similar mechanistic effects. The lack of a significant relationship between LF SAP and severity of AD is interesting. It might be expected that those animals with severe destruction to descending sympathetic pathways, and thus with low LF SAP, would experience severe AD. However, this was not the case. This underscores the concept that the loss of descending control of sympathetic outflow to resistance vessels is necessary, but not sufficient, for the development of AD, in which a role for neuronal plasticity sympatho-sensory coupling has been proposed (Ramer et al., 2007).
Implications for the assessment of injury to cardiovascular autonomic pathways
Despite the extent and severity of cardiovascular disease after SCI, research into its causes, mechanisms, and consequences is sorely lacking. Furthermore, the severity of cardiovascular dysfunction after SCI, which is related to the autonomic completeness of injury (Claydon and Krassioukov, 2006; Claydon et al., 2006a,2006b,2006c; Curt and Dietz, 1999; Curt et al., 1996; Elliott and Krassioukov, 2005; Krassioukov and Claydon, 2006), cannot be predicted from the standard American Spinal Injury Association Impairment Scale (Claydon and Krassioukov, 2006), which only quantifies motor and sensory dysfunction after SCI. Following a new impetus to incorporate clinical cardiovascular autonomic assessments within this scale, an addition has been proposed with definitions and diagnostic criteria for cardiovascular deficits after SCI (Krassioukov et al., 2007). While this represents a considerable step in the care and management of cardiovascular complications of SCI, it does not include a comprehensive quantitative measure of severity of injury to cardiovascular autonomic pathways. Given the robustness of frequency analyses in both rodents and in humans, its ability to quantitatively evaluate and discriminate different levels and severities of injury to cardiovascular autonomic pathways after SCI, as well as its ability to predict clinically-relevant measures of cardiovascular dysfunction, morbidity, and mortality, we suggest that this technique represents a strong translatable tool for the evaluation of the cardiovascular consequences of SCI. Accordingly, this technique may provide a measure of cardiovascular autonomic function for use in preclinical trials that could be readily translated into clinical reality.
Limitations
Here we have only tested animals with complete SCI at two injury levels. Further studies will be required to test this technique in incomplete injury models, which replicate clinical SCI more closely. The two levels of SCI were chosen with the rationale that they result in two very different degrees of cardiovascular autonomic impairment, due to the importance of the splanchnic vasculature in BP control. However, we have not yet established whether this technique is sensitive enough to discriminate between more similar levels or severities of injury. Importantly, these data were strongly correlated with functional measures of cardiovascular control, whereby small changes in spectral parameters were associated with considerable functional benefit, suggesting that this technique might be a useful surrogate.
The control animals in this study were uninjured, as opposed to sham-injured animals. The main benefit to using intact control animals for our comparisons is that this is more readily translatable to studies in humans, in which control volunteers do not undergo a sham procedure. We are confident that any potential impact of the anesthetic or post-operative care would have been negated because we performed our recordings 1 month after injury. Supporting this, HRV and BPV analyses conducted in sham-injured control animals (n=4, unpublished observations) were similar to those of intact animals; one of the key variables of interest, the LF BPV, was 26.9±3.5% and 26.3±6.5% in intact and sham-injured controls, respectively.
We did not perform the colorectal distension experiments in control animals. Earlier studies have shown that it is not possible to elicit AD in intact animals (Krassioukov and Weaver, 1995). Furthermore, this stimulus is known to evoke (understandably) a confounding escape reaction in intact animals, making it inappropriate for comparison in the present study.
We did not conduct cross-spectral analyses to evaluate baroreflex function after SCI (Baselli et al., 1986; Cerutti et al., 1994; Cevese et al., 2001; Gulli et al., 2001,2003). This is because T3 SCI creates a model where BP and HR oscillate independently. This leads to a lack of coherence between the two signals, and renders cross-spectral analyses invalid.
Finally, we assume that the complete spinal cord transections conducted in this study resulted in complete destruction of spinal autonomic pathways below the lesion level. This assumption remains to be confirmed histologically.
Conclusions
These observations attest to the use of a rodent model to study cardiovascular dysfunction after SCI. As in humans, rodents with high-level SCI experience resting hypotension and marked OH and AD, as well as altered HRV and BPV, due largely to destruction of descending spinal sympathetic pathways and associated alterations in autonomic function. Similarly, frequency markers of autonomic dysfunction after experimental SCI are strongly related to clinically-relevant measures of cardiovascular dysfunction after SCI: the presence and severity of OH and AD. We have now shown that these parameters can be observed using the same techniques in rodents and in humans, facilitating translational research.
Footnotes
Acknowledgments
Thanks to Nima Alan and J. Byron Ramsey for their help with animal care. L.M.R. was supported by a doctoral research award from the Heart and Stroke Foundation of Canada.
This work was supported in part by the Heart and Stroke Foundation of Canada (A.V.K., M.S.R., and V.E.C.). This work was also supported by funding from Simon Fraser University. V.E.C. receives salary support from a Heart and Stroke Foundation of Canada New Investigator Award.
Author Disclosure Statement
No competing financial interests exist.