
Abstract
Previous studies have demonstrated that patients with traumatic brain injury (TBI) who also have progressive hemorrhagic injury (PHI), have a higher risk of clinical deterioration and worse outcomes than do TBI patients without PHI. Therefore, the early prediction of PHI occurrence is useful to evaluate the status of patients with TBI and to improve outcomes. The objective of this study was to develop and validate a prognostic model that uses information available at admission to determine the likelihood of PHI after TBI. Retrospectively collected data were used to develop a PHI prognostic model with a logistic regression analysis. The prediction model was validated in 114 patients from a separate hospital. Eight independent prognostic factors were identified: age ≥57 years (5 points), intra-axial bleeding/brain contusion (4 points), midline shift≥5 mm (6 points), platelet (PLT) count<100×109/L (10 points), PLT count≥100 but <150×109/L (4 points), prothrombin time>14 sec (7 points), D-dimer≥5 mg/L (12 points), and glucose≥10 mmol/L (10 points). Each patient was assigned a number of points proportional to the regression coefficient. We calculated risk scores for each patient and defined three risk groups: low risk (0–13 points), intermediate risk (14–22 points), and high risk (23–54 points). In the development cohort, the PHI rates after TBI for these three groups were 10.3%, 47.3%, and 85.2%, respectively. In the validation cohort, the corresponding PHI rates were 10.9%, 47.3%, and 86.9%. The C-statistic for the point system was 0.864 (p=0.509 by the Hosmer-Lemeshow test) in the development cohort, and 0.862 (p=0.589 by the Hosmer-Lemeshow test) in the validation cohort. In conclusion, a relatively simple risk score using admission predictors accurately predicted the risk for PHI after TBI.
Introduction
I
The reported incidence of PHI ranges from 20–60% (Chang et al., 2006; Chieregato et al., 2005; Engstrom et al., 2005; Narayan et al., 2008; Oertel et al., 2002; Sanus et al., 2004; Schnuriger et al., 2010; Seifman et al., 2011; Servadei et al., 2000; Tong et al., 2011). The wide variation is due to different evaluation and enrollment criteria at different research centers.
Several factors have been implicated as PHI determinants, including older age, increased time from injury to first CT scan, male gender (Oertel et al., 2002), low initial level of consciousness, volume of the initial hematoma (Chang et al., 2006), presence of the spot sign on CT angiography (Wada et al., 2007), and coagulopathy (Allard et al., 2009; Hiroshi et al., 1997). In our previous study, D-dimer, a fibrinolysis breakdown product, was also significantly related to PHI and may be a potential PHI prognostic factor (Tian et al., 2010). However, the results of studies have been somewhat inconsistent. For example, Stein and associates indicated that abnormal values for the International Normalized Ratio (INR), activated partial thromboplastin time (aPTT), and platelet (PLT) count were independently correlated with PHI (Stein et al., 1992). However, a study by Oertel and colleagues of 142 patients with TBI found that only prolonged aPTT was correlated with PHI (Oertel et al., 2002), whereas Engstrom and co-workers reported that only low PLT count was correlated with PHI (Engstrom et al., 2005). Moreover, previous studies have not presented these prognostic factors in the context of a predictive model or validated them with external data.
PHI, one of the most important and devastating complications after initial brain injury, is associated with a fivefold increase in the risk of clinical deterioration and is a significant cause of morbidity and mortality (Sanus et al., 2004; Stein et al., 1993). Therefore, predicting the occurrence of PHI early and precisely would be useful to evaluate the status of patients with TBI, and to decrease morbidity and mortality rates.
The objectives of this study were to evaluate the prognostic value of admission risk factors related to PHI, and to develop a risk score by combining independent predictors associated with PHI. The validity of this risk score was then tested in a separate cohort of patients.
Methods
Patient population
We reviewed all cases of TBI treated at Shanghai Sixth People's Hospital (SSPH) China from January 1, 2009 until December 31, 2010, a period covering the initial 2 years of the use of an electronic medical record system (Electronic Medical Record v1.80; Shanghai KingStar Winning Information Technology Co., Shanghai, China). Laboratory parameters were collected via a Laboratory Examination Database Query System (Shanghai KingStar Winning Information Technology Co.). Radiological images were reviewed via Centricity Enterprise Web v3.0 (GE Medical Systems Information Technologies) at SSPH.
During the study period, 806 patients with head injury were admitted. As this study focused on early predictions of PHI after TBI based on admission characteristics, which were slightly different from our previous inclusion criteria, adult patients with isolated TBI (Abbreviated Injury Score ≤3), who were admitted and who had their first CT scans and first routine laboratory examination within 6 h post-injury were included. Similarly to our previous criteria, we excluded (1) patients with known coagulation disorders, such as deep venous thrombosis or pulmonary embolism, and those taking anticoagulant therapies that could result in coagulopathies; (2) patients who died in the emergency department before a CT scan was performed or who deteriorated and died before a second CT scan was performed; and (3) patients with intracranial pathological changes before their injury. Accordingly, we retrospectively reviewed the clinical records of the remaining 468 patients, all of whom had at least two CT scans within 24 h of admission, and these cases were used to derive the prognostic models. Separate cohort data were collected for model validation at the Department of Neurosurgery at Fengxian Center Hospital, a district hospital located in south Shanghai, using the same inclusion and exclusion criteria. We included 114 patients from June 2010 to December 2010.
All patients were evaluated and treated according to the Guidelines for the Management of Severe Head Injury (The Brain Trauma Foundation, 2007). Refer to our previous study for detailed patient management information (Tian et al., 2010).
PHI definition
PHI was defined as the appearance of new lesions or a conspicuous increase in the size of hemorrhagic lesions (i.e., a 25% increase or more compared to the first post-injury CT scan; Oertel et al., 2002; Sanus et al., 2004).
PHI admission predictors
Electronic medical records, admission and follow-up head CT scans, and routine laboratory examinations for all patients meeting the study inclusion and exclusion criteria were reviewed by two authors. Demographic variables (age and gender), cause of injury, clinical predictors on admission (Glasgow Coma Scale [GCS] score, pupil reactivity, systolic blood pressure, time from first CT scan post injury), CT scan characteristics, and routine laboratory parameters within 6 h after TBI were recorded for subsequent analysis.
Of the CT scan characteristics, types of intracranial hemorrhage were first recorded as epidural hemorrhage, subarachnoid hemorrhage, subdural hemorrhage, intra-axial bleeding, and brain contusion. Then these features were divided into intra-axial bleeding/brain contusion and extra-axial bleeding (epidural hemorrhage, subarachnoid hemorrhage, and subdural hemorrhage) for risk score derivation. The volume of the lesion was calculated using the formula A×B×C×0.5, where A and B represent the largest perpendicular diameters through the hyperdense area on CT scan, and C represents the thickness of the lesion. The position of hematoma/contusion was recorded as the major proportion of hematoma/contusion. A midline shift was defined as a shift ≥5 mm. Skull fracture was categorized as linear fracture and other (basal fracture or non-fracture on CT).
The normal values for PLT counts, INR, PT, aPTT, fibrinogen (Fg), and D-dimer were 100–300×109/L, 0.8–1.2, 11–14 sec, 28–40 sec, 2–4 mg/L, and 0.0–0.3 mg/L, respectively. We carefully examined the distribution of laboratory values to identify biologically impossible values. The shape of the relationships between the continuous variables and PHI were examined by univariate analysis with linear and cubic spline functions. A positive linear relationship was observed for aPTT, D-dimer, INR, PT, and glucose, with higher levels associated with PHI, whereas a negative linear relationship was observed for Fg. These relationships were continuous without any clear indication of the presence of threshold values. To obtain comparable odds ratios for the linear relationships, we rescaled each variable in the following way: PT≤14 and PT>14 sec; aPTT≤40 and aPTT>40 sec; INR≤1.2 and INR>1.2; D-dimer≥5 mg/L and D-dimer<5 mg/L (according to our previous study, determined by the area under the receiver operating characteristic curve); glucose≥10 mmol/L and glucose<10 mmol/L (chosen because of clinical relevance and for intervention purposes); and Fg<2 and Fg≥2 mg/L. A change point was identified for age and led to rescaling this variable to age ≥57 years and age <57 years. For systolic blood pressure, which had a U-shaped relationship with PHI, we created three categories: low (<p25, <120 mm Hg), intermediate (p25–p75, 120–140 mm Hg), and high (>p75, >140 mm Hg) levels. For PLT, which had an L-shaped relationship with PHI, we also created three categories: normal (≥150×109/L), slightly low (≥100×109/L to <150×109/L), and low (<100×109/L).
Outcomes after TBI
Neurological outcome was recorded using the 6-month score on the Glasgow Outcome Scale (GOS). The 6-month GOS was split into dead (GOS=1), unfavorable survival (GOS=2 or 3), and favorable survival (GOS=4 or 5).
Derivation and external validation of the risk score
We derived our prediction model using stepwise logistic regression, with PHI as the prediction, and the demographics, CT scans, and laboratory variables, as predictors or potential risk factors. As a first step, we constructed our logistic regression model including variables of old age (≥57 years), low PLT count, prolonged PT (>14 s), high D-dimer level (≥5 mg/L), high glucose level (≥10 mmol/L), intra-axial bleeding/brain contusion, and a midline shift (≥5 mm). To develop a practical prognostic score, we assigned the risk factors identified by multivariate logistic analysis weighted points proportional to the β-regression coefficient values (rounded to the nearest integer). A risk score was then calculated for each patient, and the population was divided into three categories: patients at low risk, patients at intermediate risk, and patients at high risk for PHI. Finally, we externally validated the model in an external series of 114 patients. Discrimination and calibration were also assessed to indicate the performance of the risk score for the external patients.
Statistical analysis
The Pearson's chi-square test was used for categorical variables. Prediction models were developed with stepwise logistic regression analysis for PHI. During the process of external validation, the C-statistic was used to assess the model's discrimination ability, and the Hosmer-Lemeshow (H-L) test was used to assess the model's calibration ability. Furthermore, a smooth, non-parametric calibration line created by the Lowess algorithm was used to graphically assess the model's calibrating ability. In the logistic regression models and H-L tests, p values <0.05 were considered significant. The statistical packages used for analyses were R for Windows Version 2.12.1 (The R Foundation for Statistical Computing), and SPSS 13.0 for Windows (SPSS Inc., Chicago, IL).
Results
Patient characteristics in the derivation cohort
The patient characteristics in the derivation cohort are shown in Table 1. Patients were classified into a PHI group and a non-PHI group. Of the 468 patients, 108 (23.1%) demonstrated PHI on the second CT scan. The distribution of characteristics differed between the two patient groups. The patients with PHI were generally older than those without PHI (mean age, 42 versus 52 years, respectively). The proportion of patients with intra-axial bleeding/brain contusion, midline shift≥5 mm, PT>14 sec, low PLT count, aPTT>40 sec, INR>1.2, Fg<2 mg/L, D-dimer≥5 mg/L, and glucose≥10 mmol/L, was significantly higher in the PHI group than in the non-PHI group. Patients who suffered PHI had worse outcomes (36.1% dead) than patients who did not (3.6% dead).
p-value by t-test; ** p-value by Fisher's exact test.
The position of the major proportion of hematoma/contusion.
Parietal/occipital/cerebellum.
INR, International Normalized Ratio; PT, prothrombin time; aPTT, activated partial thromboplastin time; Fg, fibrinogen; PLT, platelets; GCS, Glasgow Coma Scale; SD, standard deviation; First CT time, time from injury to the first computed tomography scan.
Midline shift≥5 mm. Fractures categorized as linear fracture and other (basal fracture or non-fracture on CT).
Multivariate logistic regression and risk-scoring system
We used a univariate analysis to test the ability of the risk factors to predict the risk for PHI. Table 1 shows that several variables were associated with a higher risk for PHI. We performed a multivariate analysis using the stepwise logistic regression model to identify independent predictor variables. Variables were dichotomized for ease of use in the subsequent risk score. Because multivariate analysis requires a complete set of variables for each patient, missing data from routine laboratory tests restricted the analysis to 396 patients (84.6%). However, no significant differences in predictors or occurrence of PHI were observed between patients with complete data and those with missing data. After the exclusion of variables with a poor predictive performance, and those exhibiting multicollinearity, seven variables maintained their prognostic significance after the multivariate analysis (Table 2): old age (≥57 years), low PLT count, prolonged PT (>14 sec), high D-dimer level (≥5 mg/L), high glucose level (≥10 mmol/L), intra-axial bleeding/brain contusion, and a midline shift (≥5 mm). We assigned each of the seven prognostic variables a number of points proportional to that variable's regression coefficient, to calculate a risk score (Table 2). A score was calculated for each patient by adding together the points corresponding to the patient's risk factors. The patients were then divided into three subgroups based on the score: a low-risk group (0–13 points), an intermediate-risk group (14–22 points), and a high-risk group (23–54 points; Table 3). The PHI rates in these three groups were 10.3%, 47.3%, and 85.2%, respectively.
Because glucose data were missing in 72 patients, the final sample used in the multivariate analysis consisted of 396 patients.
Assignment of points to risk factors was based on a linear transformation of the corresponding β-regression coefficient. The coefficient of each variable was divided by 0.74 (the lowest β-value, corresponding to intra-axial bleeding/brain contusion), multiplied by a constant (4), and rounded to the nearest integer.
PT, prothrombin time; PLT, platelets; OR, odds ratio; 95% CI, 05% confidence interval.
Risk category was calculated by adding the points for each of the following risk factors: age ≥57 years (5 points), intra-axial bleeding/brain contusion (4 points), midline shift≥5 mm (6 points), PLT count <100×109/L (10 points), PLT count≥100 but <150×109/L (4 points), PT>14 sec (7 points), D-dimer≥5 mg/L (12 points), and glucose≥10 mmol/L (10 points). The prognostic index was categorized into three groups: low risk (0–13 points), intermediate risk (14–22 points), and high risk (23–54 points).
CI, confidence interval; PLT, platelets.
Validation of the risk score
We validated the risk score in an external series of 114 patients. Discrimination and calibration were assessed to indicate risk score performance for the external patients. In the validation cohort, the risk score had a C-statistic of 0.862 and a p value of 0.589 (H-L test), indicating that the risk score discriminated and calibrated well with the validation data. The PHI calibration curve is shown in Figure 1.
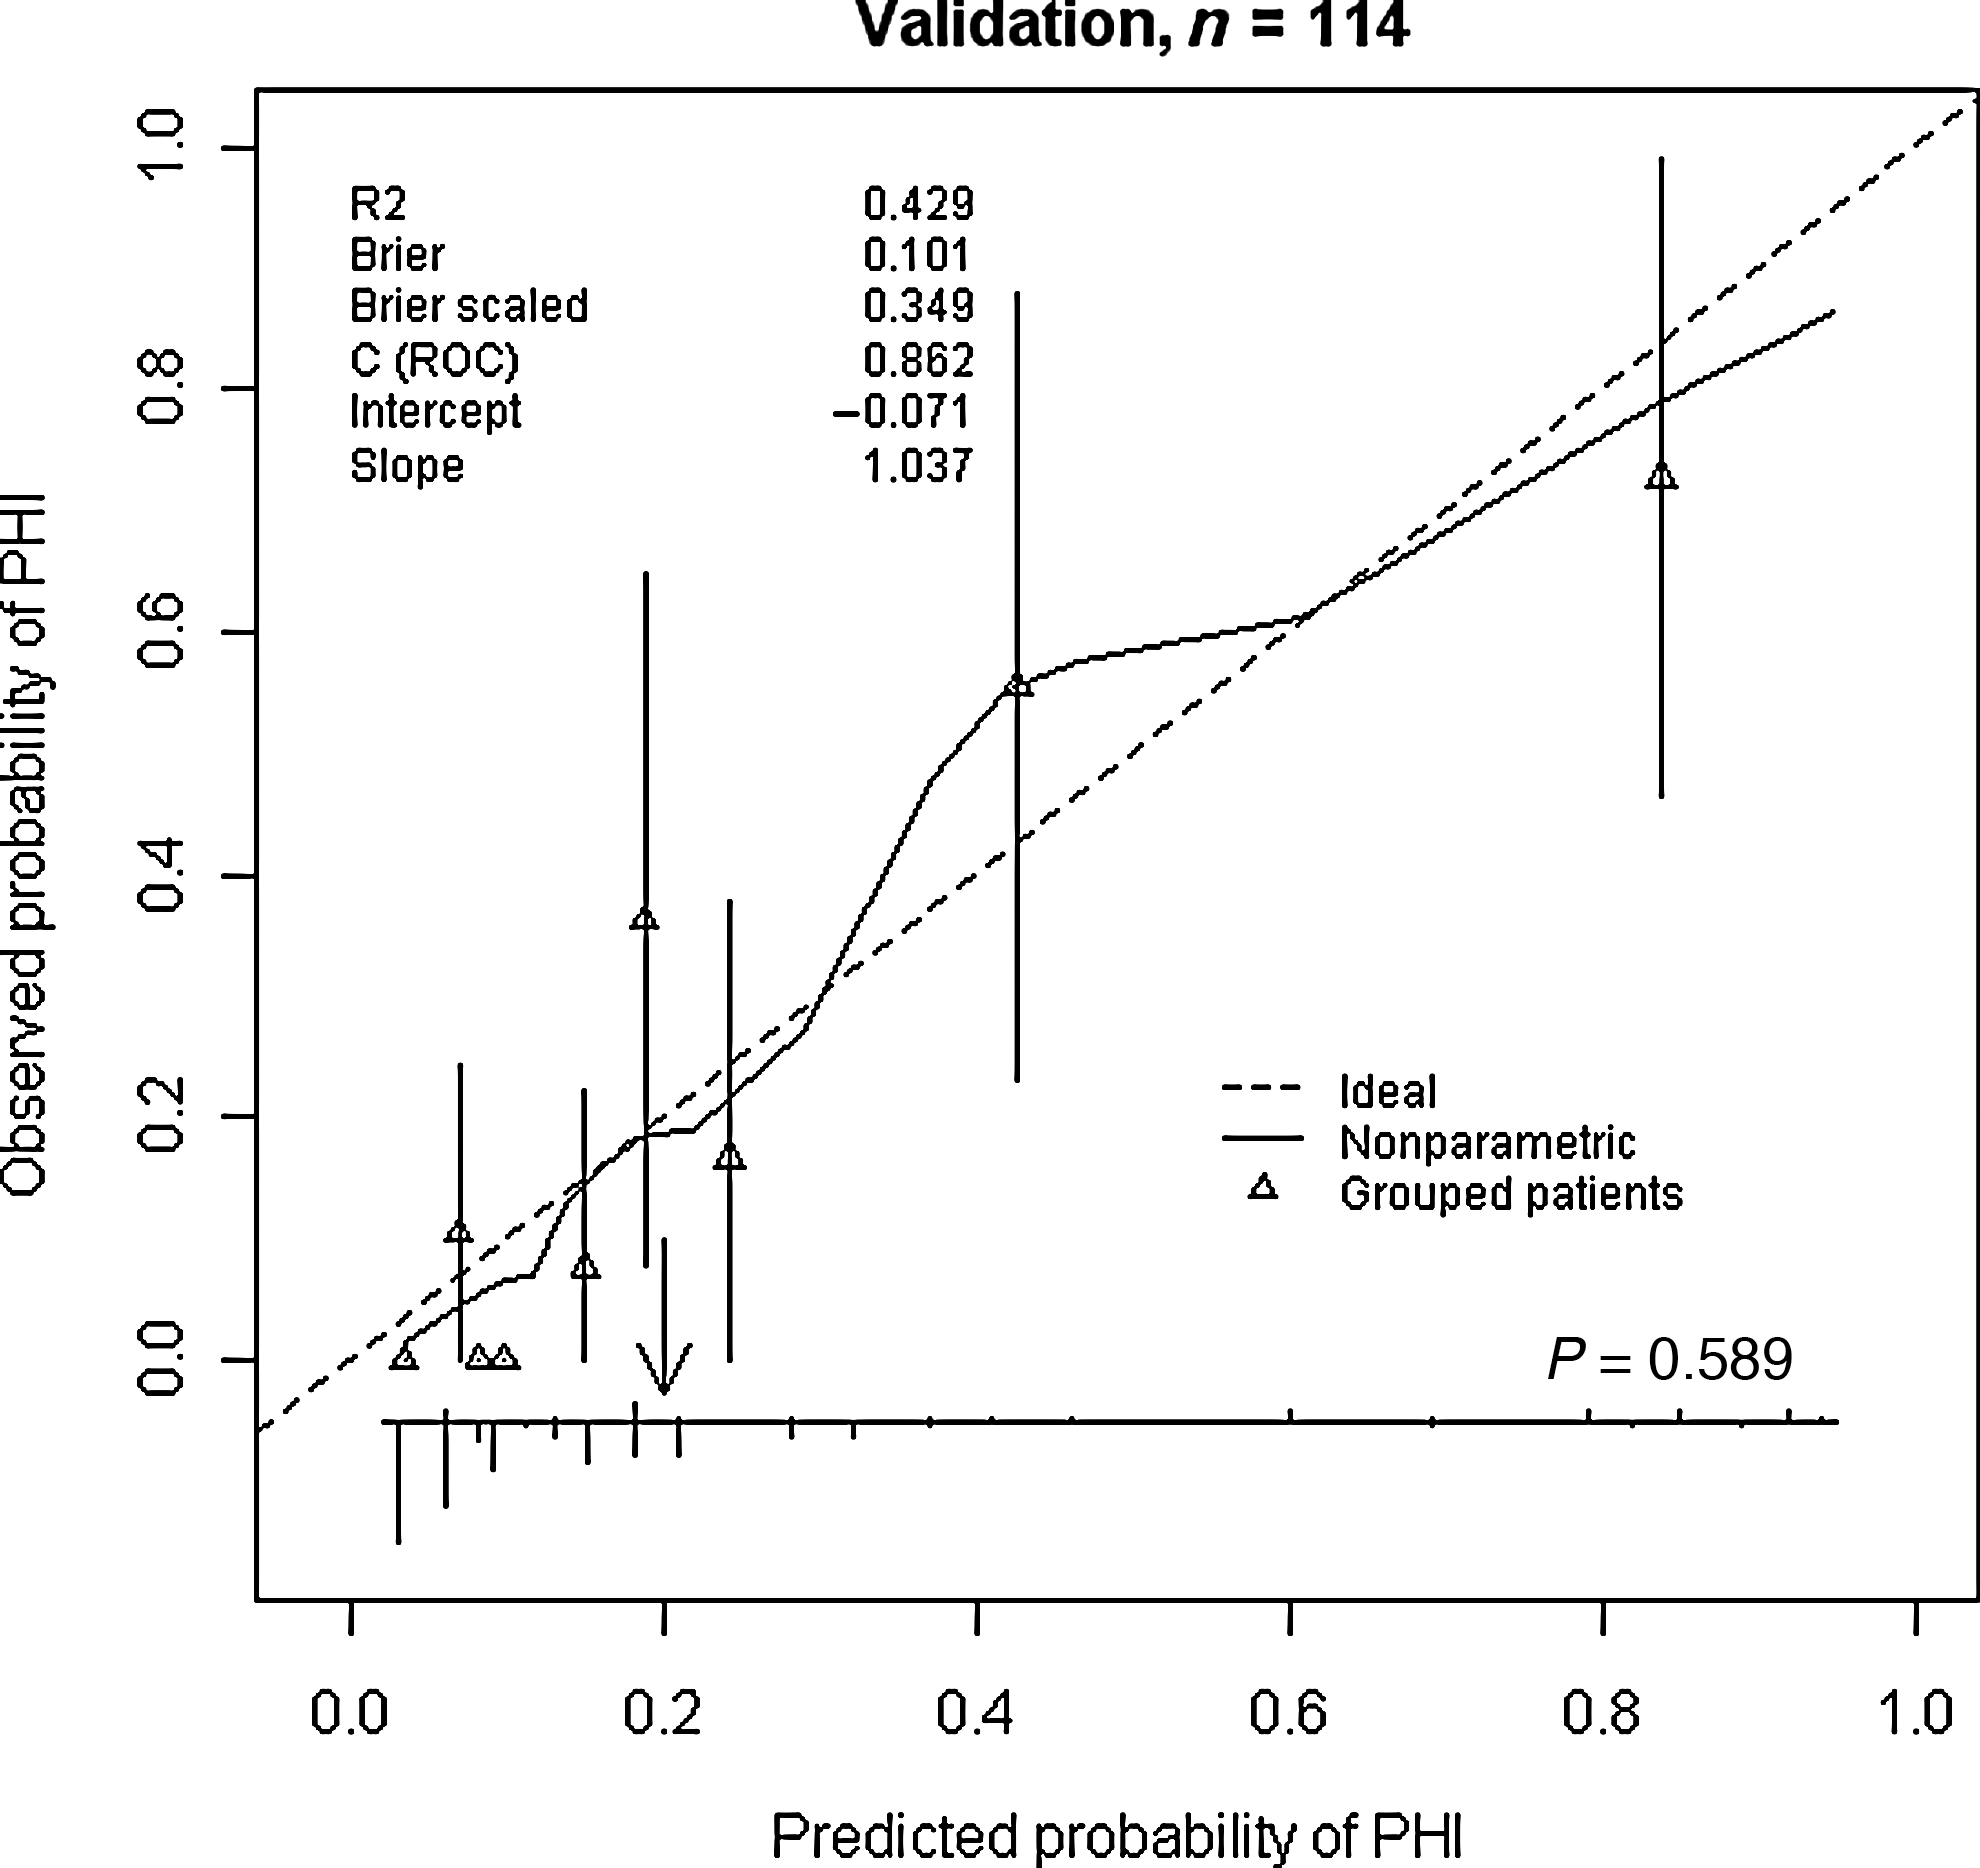
Validation of the risk score in the external patients (n = 114). The smooth solid curves reflect the relationship between observed probability of progressive hemorrhagic injury (PHI) and predicted probability of PHI. The distribution of predicted probabilities is shown at the bottom of the graph, separately for those with PHI and those without PHI. The triangles indicate the observed frequencies by deciles of predicted probability. The p value is based on the Hosmer-Lemeshow test.
Of the 114 patients, 21.1% (24) suffered from PHI, and the incidence was similar to the derived value. Classification of the validation cohort according to risk score resulted in assigning 82.5% of the patients to the low-risk group, 9.6% to the intermediate-risk group, and 7.9% to the high-risk group. The PHI rates for the low-, intermediate-, and high-risk groups were 10.9%, 47.3%, and 86.9%, respectively. These results were similar for the development cohort: 10.3% of the patients were in the low-risk group, 47.3% in the intermediate-risk group, and 85.2% in the high-risk group (Table 3).
Discussion
PHI is a secondary process that may occur after initial brain injury and is certainly one of the most important and devastating complications after TBI. Previous studies have demonstrated that patients with PHI have a higher risk for clinical deterioration and worse outcomes than patients who do not develop PHI (Chang et al., 2006; Oertel et al., 2002; Sanus et al., 2004; Stein et al., 1993). Therefore, predicting the occurrence of PHI early is useful to evaluate the status of patients with TBI and to improve outcomes.
We identified seven admission variables that classified patients into three classes of increasing risk for PHI to develop a risk score for PHI prognosis. The performance of the risk score was highly reliable when validated in a separate retrospective external validation sample.
This is the first attempt to derive and validate a risk score for predicting PHI after acute TBI. We demonstrated that the risk of PHI after TBI can be predicted by admission variables. In descending order of importance, these admission features were high D-dimer level, prolonged PT, low PLT count, a midline shift, a high glucose level, older age, slightly low PLT count, and intra-axial bleeding/brain contusion, all of which can be readily assessed upon admission to a neurosurgical unit. The risk score derived by combining points for each of these predictors accurately classified patients into subgroups at low, medium, and high risk for PHI. In the development cohort, the PHI rates in these three groups were 10.3%, 47.3%, and 85.2%, respectively. The respective figures in the validation cohort were 10.9%, 47.3%, and 86.9%. Patients in the high-risk group could potentially benefit from the most aggressive therapies, including promptly repeating a CT scan, administration of recombinant activated factor VII, which is believed to be safe and cost-effective (Stein et al., 2009), and hematoma/contusion evacuation. Whether these high-risk patients with PHI after TBI could potentially benefit from more intensive forms of surveillance and therapies remains to be shown.
The strengths of our study include that all risk factors can be easily assessed at admission, the risk score system may support clinicians in their early prognosis of PHI, and the generalizability of the risk score was supported by validation in separate data collected from another center.
Our prediction model had several limitations. First, we rescaled continuous variables into categorical variables. Although this strategy simplifies the creation of a risk score, the use of continuous variables has the potential to provide more refined information and better predictive performance. Second, predictors after admission, such as intracranial pressure, also have prognostic value for PHI and may improve the model's performance. Additionally, we could not assess the effect of therapy on PHI because treatment was not controlled but varied according to the manifestations and severity of disease and changed after admission to the neurosurgical unit. Third, the model did not include some important previously described prognostic variables, such as time from first CT scan, volume of the initial hematoma, abnormal INR values, and prolonged aPTT, which may reflect different inclusion criteria compared with other studies, and the logistic regression modeling strategy. Finally, although we believe that the risk score derived from our single center discriminated and calibrated well in validation patients, a prediction model based on large patient populations from multiple centers should be developed to increase the model's generalizability, and international validation on a broad scale is also strongly recommended.
In conclusion, we developed a risk score based on admission factors that predicted the occurrence of PHI after acute TBI, and validated this in an independent cohort of patients from a different research center. Patients with TBI who were identified as being at low risk for PHI had the potential to save costs, whereas those identified as at high risk for PHI had the potential for direct early medical intervention to improve their outcome. However, it should be noted that the prognostic model cannot replace clinical assessment of an individual patient, and that the prediction should be regarded with care and not directly applied when making clinical decisions.
Footnotes
Acknowledgments
This study was supported in part by a grant from the Shanghai Science and Technology Committee (grant no. 10JC1412500). We would like to thank Dong-Qing Shen, Department of Neurosurgery at Fengxian Center Hospital, for making the external validation data available for analysis.
Author Disclosure Statement
No competing financial interests exist.