
Abstract
Among the 3.5 million annual new head injury cases is a subpopulation of children and young adults who experience repeated traumatic brain injury (TBI). The duration of vulnerability after a single TBI remains unknown, and biomarkers have yet to be determined. Decreases in glucose metabolism (cerebral metabolic rate of glucose [CMRglc]) are consistently observed after experimental and human TBI. In the current study, it is hypothesized that the duration of vulnerability is related to the duration of decreased CMRglc and that a single mild TBI (mTBI) increases the brain's vulnerability to a second insult for a period, during which a subsequent mTBI will worsen the outcome. Postnatal day 35 rats were given sham, single mTBI, or two mTBI at 24-h or 120-h intervals. 14C-2-deoxy-D-glucose autoradiography was conducted at 1 or 3 days post-injury to calculate CMRglc. At 24 h after a single mTBI, CMRglc is decreased by 19% in both the parietal cortex and hippocampus, but approached sham levels by 3 days post-injury. When a second mTBI is introduced during the CMRglc depression of the first injury, the consequent CMRglc is depressed (36.5%) at 24 h and remains depressed (25%) at 3 days. In contrast, when the second mTBI is introduced after the metabolic recovery of the first injury, the consequent CMRglc depression is similar to that seen with a single injury. Results suggest that the duration of metabolic depression reflects the time-course of vulnerability to second injury in the juvenile brain and could serve as a valuable biomarker in establishing window of vulnerability guidelines.
Introduction
Mechanisms involved in ischemic preconditioning include prolonged changes in cellular energy glucose metabolism, 3,4 which could potentially serve as a biomarker of cerebral vulnerability. Changes in cerebral glucose metabolism have been established as a hallmark response after TBI. Immediately after impact, there is a rapid and transient increase in cerebral glucose uptake in the brain, followed by a prolonged period of depression of the glucose metabolism (cerebral metabolic rate of glucose [CMRglc]; mg/100 g/min). This injury-induced decrease in CMRglc has been observed after FP, 5,6 controlled cortical impact (CCI), 7 –9 and human TBI. 10,11
Alterations in brain glucose metabolism vary with injury severity and age. Glucose metabolic depression was maintained for 5, 10, or 14 days after mild, moderate, or severe FP injury in adults, respectively. 12 Duration of behavioral deficits in the Morris water maze also correlated with injury severity. 13 Administration of d-amphetamine induced recovery of both the CMRglc depression and behavioral deficits, suggesting a correlation between these outcome measures. 14,15 The more severe CCI injury also produced a more profound and longer lasting depression than FP injury 16,17 (Fig. 1). This relationship between CMRglc and injury severity has also been observed in human patients with TBI. 18 TBI in the absence of overt cell death or gross pathology can still produce measurable behavioral dysfunction. Further, mTBI, which may have axonal damage or dysfunction as detected from diffusion tensor imaging (DTI), also shows measurable decreases in CMRglc. 19,20 More importantly, the decrease in CMRglc in mTBI patients was correlated with persistent post-concussive symptoms. 20,21
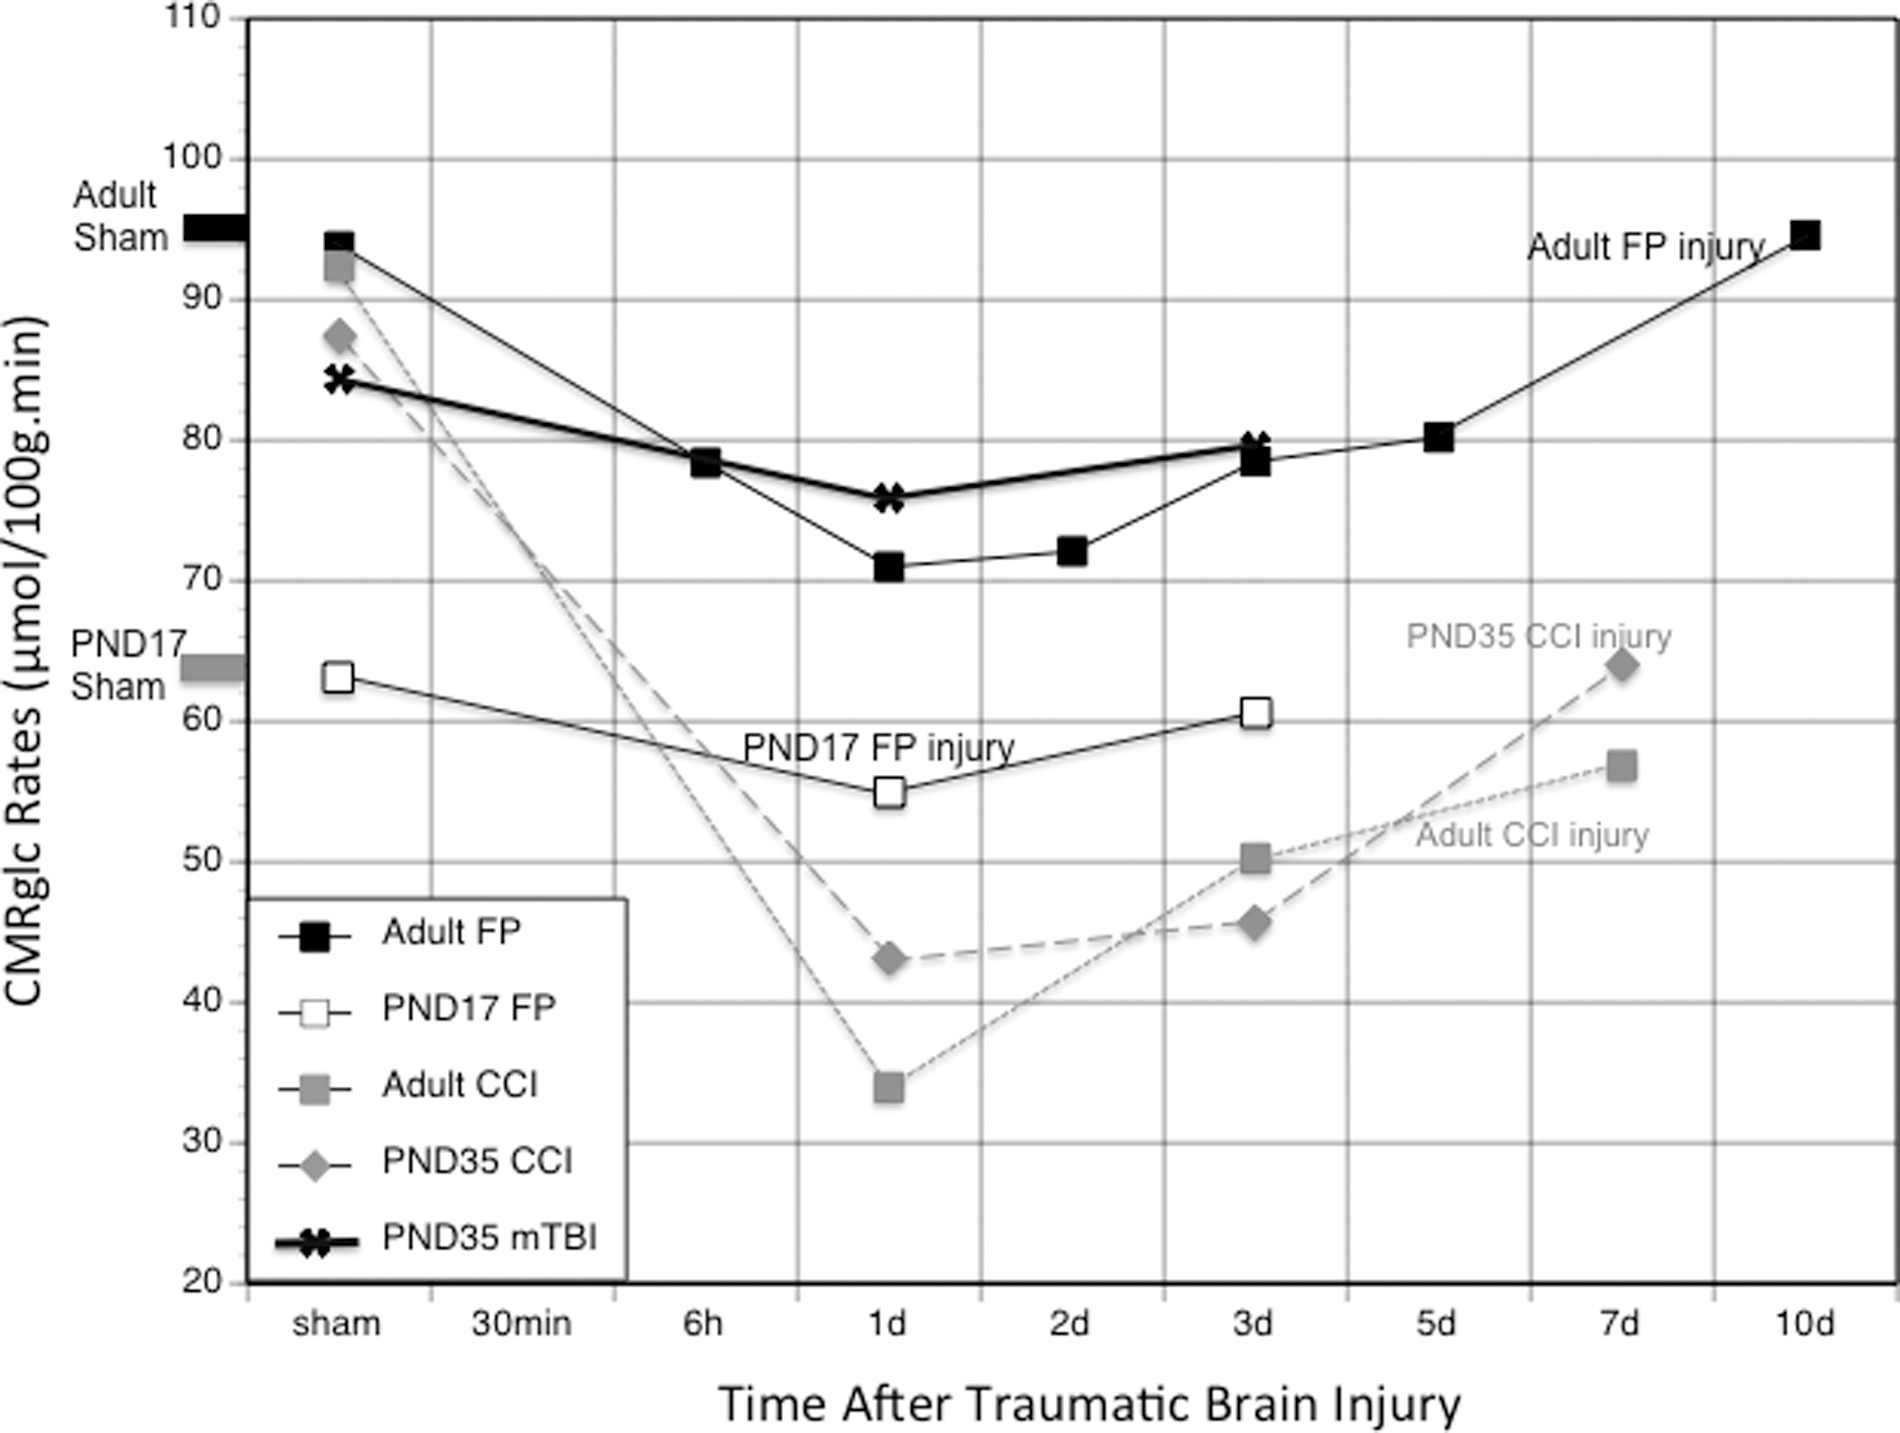
Traumatic brain injury (TBI)-induced cerebral metabolic rate of glucose (CMRglc) depression. This graph shows a comparison of the CMRglc changes with time after various types of TBIs in different aged rats as measured by 14C-2-deoxy-D-glucose autoradiography (data from 5,16,17,22,23 ). FP, fluid percussion; PND, post-natal day; CCI, controlled cortical impact.
The magnitude and duration of CMRglc depression after TBI also increases with age 17,22,23 across all injury models (Fig. 1). For example, FP-injured post-natal day (PND)17 rats showed glucose metabolic recovery to age-matched shams within 3 days 22 compared with 10 days in the adult rats. 5 After CCI injury, PND35 rats showed recovery of metabolic rates of subcortical structures within 3 days compared with 7 days in PND90 rats and better metabolic recovery in the cortex by day 7 17 (Fig. 1).
Despite the unclear mechanisms of induction, the presence of metabolic depression reflects an altered cerebral condition that is associated with functional deficits and has been proposed to reflect a vulnerable cerebral state. 21,24 –26 It is currently unknown how the exposure of a second mTBI during this period of CMRglc depression will affect cerebral metabolism, behavioral function, and histological outcome of the developing brain. The current study will address the central hypothesis that a single mTBI increases the brain's vulnerability to a second insult for a period, during which a subsequent mTBI will worsen the outcome. It is hypothesized that the duration of vulnerability is related to the duration of altered intracellular redox and decreased CMRglc, which may be used as a biomarker for vulnerability (Fig. 2).
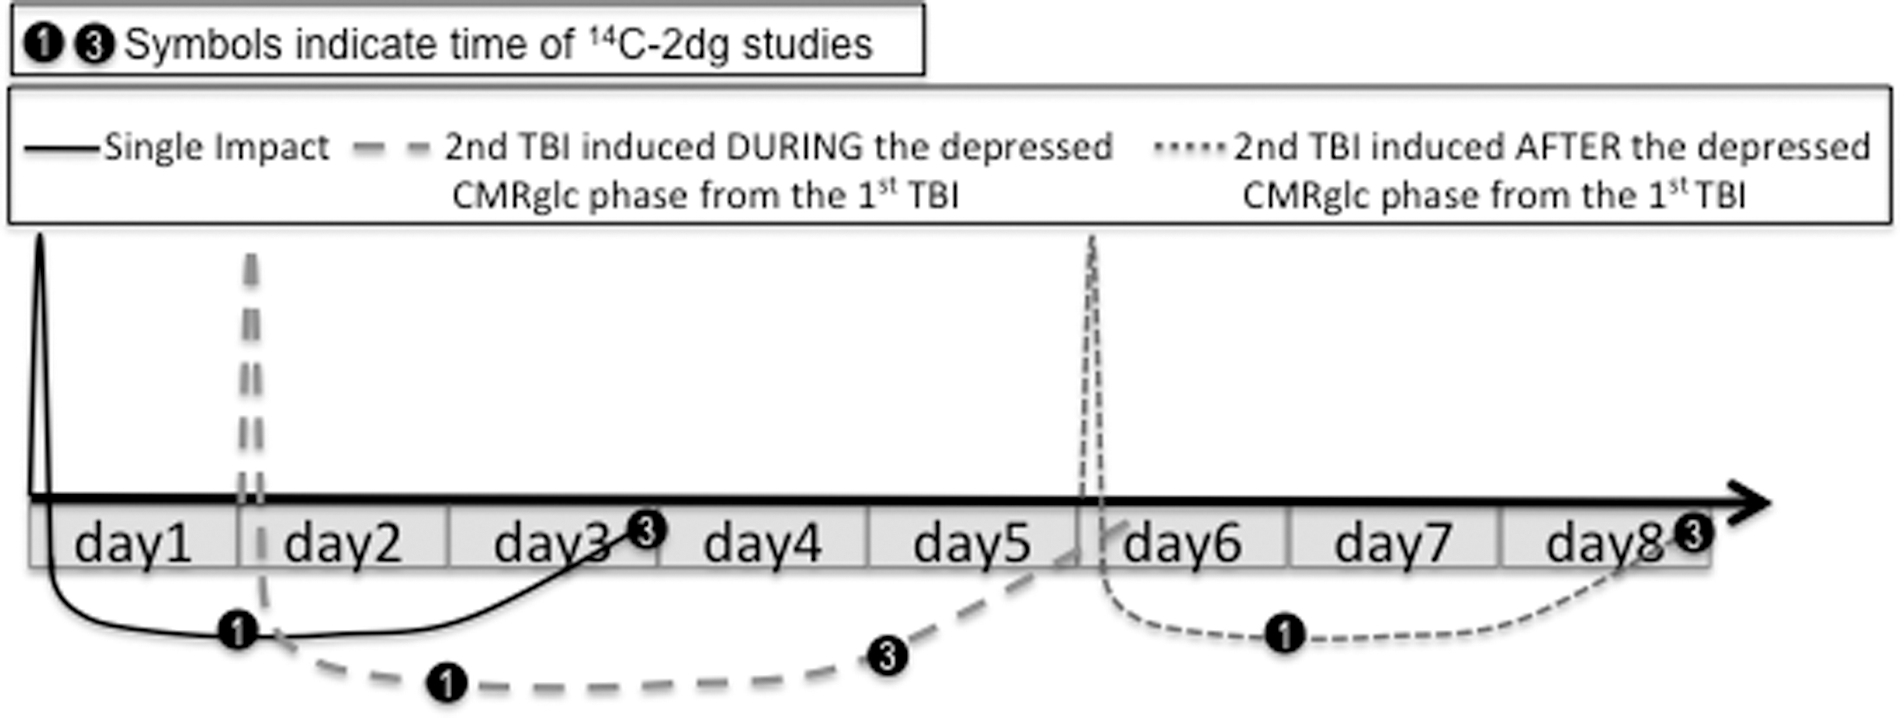
Diagrammatic representation of the central hypothesis. A single mild traumatic brain injury (mTBI) increases the brain's vulnerability to a second insult for a period, during which a subsequent mTBI will worsen outcome. A second injury introduced after this period of vulnerability will result in cerebral metabolic rate of glucose (CMRglc) changes similar to the first injury. 14C-2dg, 14C-2-deoxy-D-glucose.
Methods
14C-2-deoxy-D glucose subjects
PND35 (142.9±3.9 g) male Sprague-Dawley rats were randomly divided into groups that were given sham (n=11), single (n=12), or two injuries at a 24-h interval (n=11) or two injuries at a 120-h interval (n=10). CMRglc were determined using [14C]2-deoxy-
The highest incidence of mTBI and RTBI occurs during adolescents. While there are no exact guidelines for determining interspecies age equivalents, we have selected the PND35 age group based on numerous developmental profiles and previously collected data. PND12–13 has been proposed to reflect human newborns, 27 sexual maturity is between PND45–60, and glucose metabolism is 90% adult values at PND35. 28 The molecular composition of PND34–44 rat synapses was reflective of synaptic changes during the teen years. 29 Similar sleep changes, increased risk taking behaviors, and potential for addiction of teenagers is also observed between PND28–45 in the rat. 30 –32 Based on these data, PND35 animals were specifically chosen for this study to reflect the adolescent age group.
Injury model
As previously described and characterized, 33 under isoflurane (2.0%/100% O2) the head was shaved and the nose placed within the stereotaxic face mask to maintain anesthesia. The animals were placed on a heating pad with the head against a shaped wooden block within the stereotaxic frame, without ear bars. An electronically controlled pneumatic piston cylinder (Hydraulic Control, Inc, Emeryville, CA) was mounted onto a stereotaxic micromanipulator (Kopf Instruments, Tujunga, CA) to allow for precise localization of the impact center. A template was used to mark the center of impact (-3AP,-4ML relative to bregma), and the injury tip was firmly zeroed against the skin. The piston was angled at 23 degrees away from the vertical to allow the impactor to make contact perpendicular to the head's surface. The impactor tip (5-mm diameter) displaced the head 8 mm at 36 psi. The head was free to move in the direction of the injury. This level of impact does not cause skull fractures. It does, however, produce apnea and delays the toe-pinch response and righting time.
2DG autoradiography
Local CMRglc (μmol/100 g/min) were measured by the 2DG method originally described by Sokoloff and associates. 34 Under isoflurane anesthesia (2 L/min), the femoral artery and vein were cannulated with a polyethylene tube (PE-50) on the day of study and restrained on a piece of cardboard for at least 2 h to allow the effects of anesthesia to diminish. Baseline blood-gas measurements were then taken (pH, pO2, pCO2; 1304 pH, Blood Gas Analyzer; Instrumentation Laboratory, Stockholm, Sweden), and 14C- 2DG (150 m Ci/kg) was administered intravenously (IV) over 30 sec. Twelve timed arterial blood samples were collected in polyethylene-heparin lithium fluoride coated microcentrifuge tubes (Beckman) during the 45-min experiment.
At 45 min after 2DG injection, the rats were sacrificed with a lethal dose of sodium pentobarbital (100 mg/kg, IV) and the brains were removed and immediately frozen. Coronal sections (20 μm) were exposed to Kodak Biomax film with 14C-methylmethacrylate standards (Amersham, Arlington Heights, IL). Adjacent sections were processed for cresyl violet staining and examined under light-microscopy to determine the presence of overt histopathology.
Using a computerized image analysis system (NIH Image), the optical densities were measured bilaterally in eight regions. The regions of interest are illustrated in Figure 3 and were selected away from the impact site to avoid regions of potential blood-brain barrier disruption. Optical density values were obtained across at least three sections for each structure and averaged by an investigator blind to group assignment.
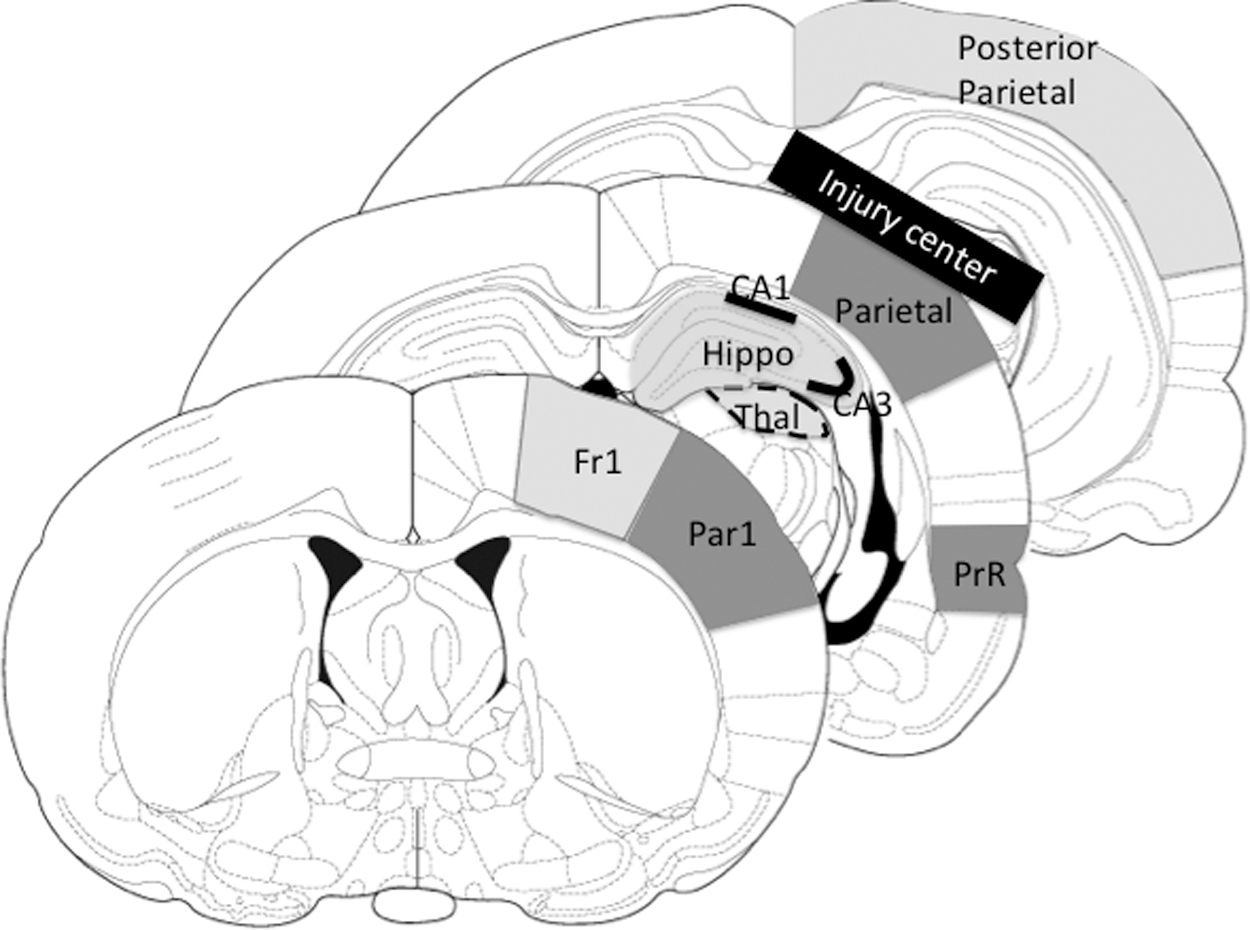
Three coronal sections indicating the nine autoradiographic regions of interest measured. Fr1 (frontal cortex), Par1 (anterior parietal cortex), Hippo (whole hippocampus), CA1, CA3, Thal (thalamus), PrR (perirhinal cortex), Parietal cortex, Posterior parietal cortical strip. The black bar over parietal indicates the center of the impact site.
The CMRglc was calculated using the equations previously described by Sokoloff and colleagues 34 and el Hamdi and coworkers. 35 The blood samples collected (range 20–50 μL) were immediately placed on ice, centrifuged, and the plasma assayed for 14C-activity using a scintillation counter (LS 5000 CE; Beckman Instruments, Inc, Fullerton, CA). The timed plasma samples were processed for glucose with the YSI 2700 Biochemistry Analyzer for the calculation of CMRglc rates.
Novel object recognition (NOR) behavioral task
A separate group of animals was used to determine the recovery time of NOR deficits previously noted between single and RTBI groups. 31 PND35 male Sprague Dawley rats (n=7 for each group, 184.2±7.4 g) were given sham, single, or two injuries at a 24-h interval before NOR testing. This method was based on the original Ennaceau and Delacour 36 procedure and has been described previously. 33,37 Briefly, the NOR testing chamber was a white, Plexiglas arena (52×52×9 cm). Two objects were secured to the testing chamber floor via Velcro and positioned centrally near the back wall of the chamber. During the habituation phase (post-injury day [PID]2), animals were allowed 10 min to acclimate to the new environment. On PID3, animals were given 5 min to explore the environment with two identical objects. On PID4, animals were placed in the arena with one familiar object and one novel object and were allowed to explore for 5 min. The duration of time spent with each object and the number of encounters was determined by the SMART tracking system.
Statistical analysis
Measurements for body weights, apnea, toe-pinch, and righting times were analyzed using one-way analysis of variance (ANOVA) for group (sham, single, RTBI 24 h, RTBI 120 h). CMRglc rates were analyzed using one-way ANOVA for groups. Post hoc analyses were conducted using the Tukey modestly significant difference. Percent time spent with a novel object in the behavioral tasks was also analyzed with one-way ANOVA for groups with the Tukey post hoc analysis.
Results
Physiological changes after TBI
The average weight, apnea, toe pinch, and righting times for 2DG and behavioral animals are shown in Table 1 and Table 2, respectively. There were no significant differences in starting weights between groups for either 2DG animals or behavioral animals. There were no significant group differences in duration of apnea, toe pinch, or righting times from a single injury in both 2DG and behavioral animals. Duration of apnea, toe pinch, or righting times in RTBI groups did not differ between first and second injuries. These physiological changes are consistent with previously reported findings for this mTBI 33 and suggest that injury severity was the same.
RTBI, repeated traumatic brain injury.
RTBI. repeated traumatic brain injury.
CMRglc changes after single mTBI
While all other structures showed decreasing trends in CMRglc rates at PID1, only the parietal and CA1 attained significance. Single mTBI resulted in a significant 19% decrease in CMRglc in both the ipsilateral parietal cortex and CA1 of the hippocampus at PID1. CMRglc of both ipsilateral structures returned toward sham rates by PID3 and remained at sham levels on PID5 (Fig. 4). Contralateral parietal cortex and CA1 hippocampus also showed 12.9% and 15.2% decreases in CMRglc, respectively, at PID1. CMRglc of the contralateral structures returned to sham levels by PID3.

Average (±standard error of the means) changes in the cerebral metabolic rate of glucose (CMRglc) with time after single mild traumatic brain injury in both parietal and hippocampal CA1 regions, illustrating the recovery of metabolism by 3 days after injury.
CMRglc changes after RTBI
Parietal cortex
PND35 sham animals showed average parietal cortex CMRglc rates of 127.1±5.6 (contralateral) and 129.4±7.7 (ipsilateral) μmol/100g/min, which are consistent with previous studies. 17 When a second mTBI was introduced within 24 h after the first mTBI, the CMRglc rates dropped in the parietal cortex by 17.8% contralaterally and 36.5% ipsilaterally (p<0.01) (Fig. 5). While the decreased rates moved toward sham levels by PID3, they remained significantly depressed ipsilaterally. When the second mTBI was delivered 120 h after the first mTBI, the CMRglc rates on PID1 decreased in the parietal cortex by 8.4% contralaterally and 17.1% ipsilaterally, but these changes did not reach statistical significance. AT PID3, the RTBI-120-h cortex was not different from sham rates.
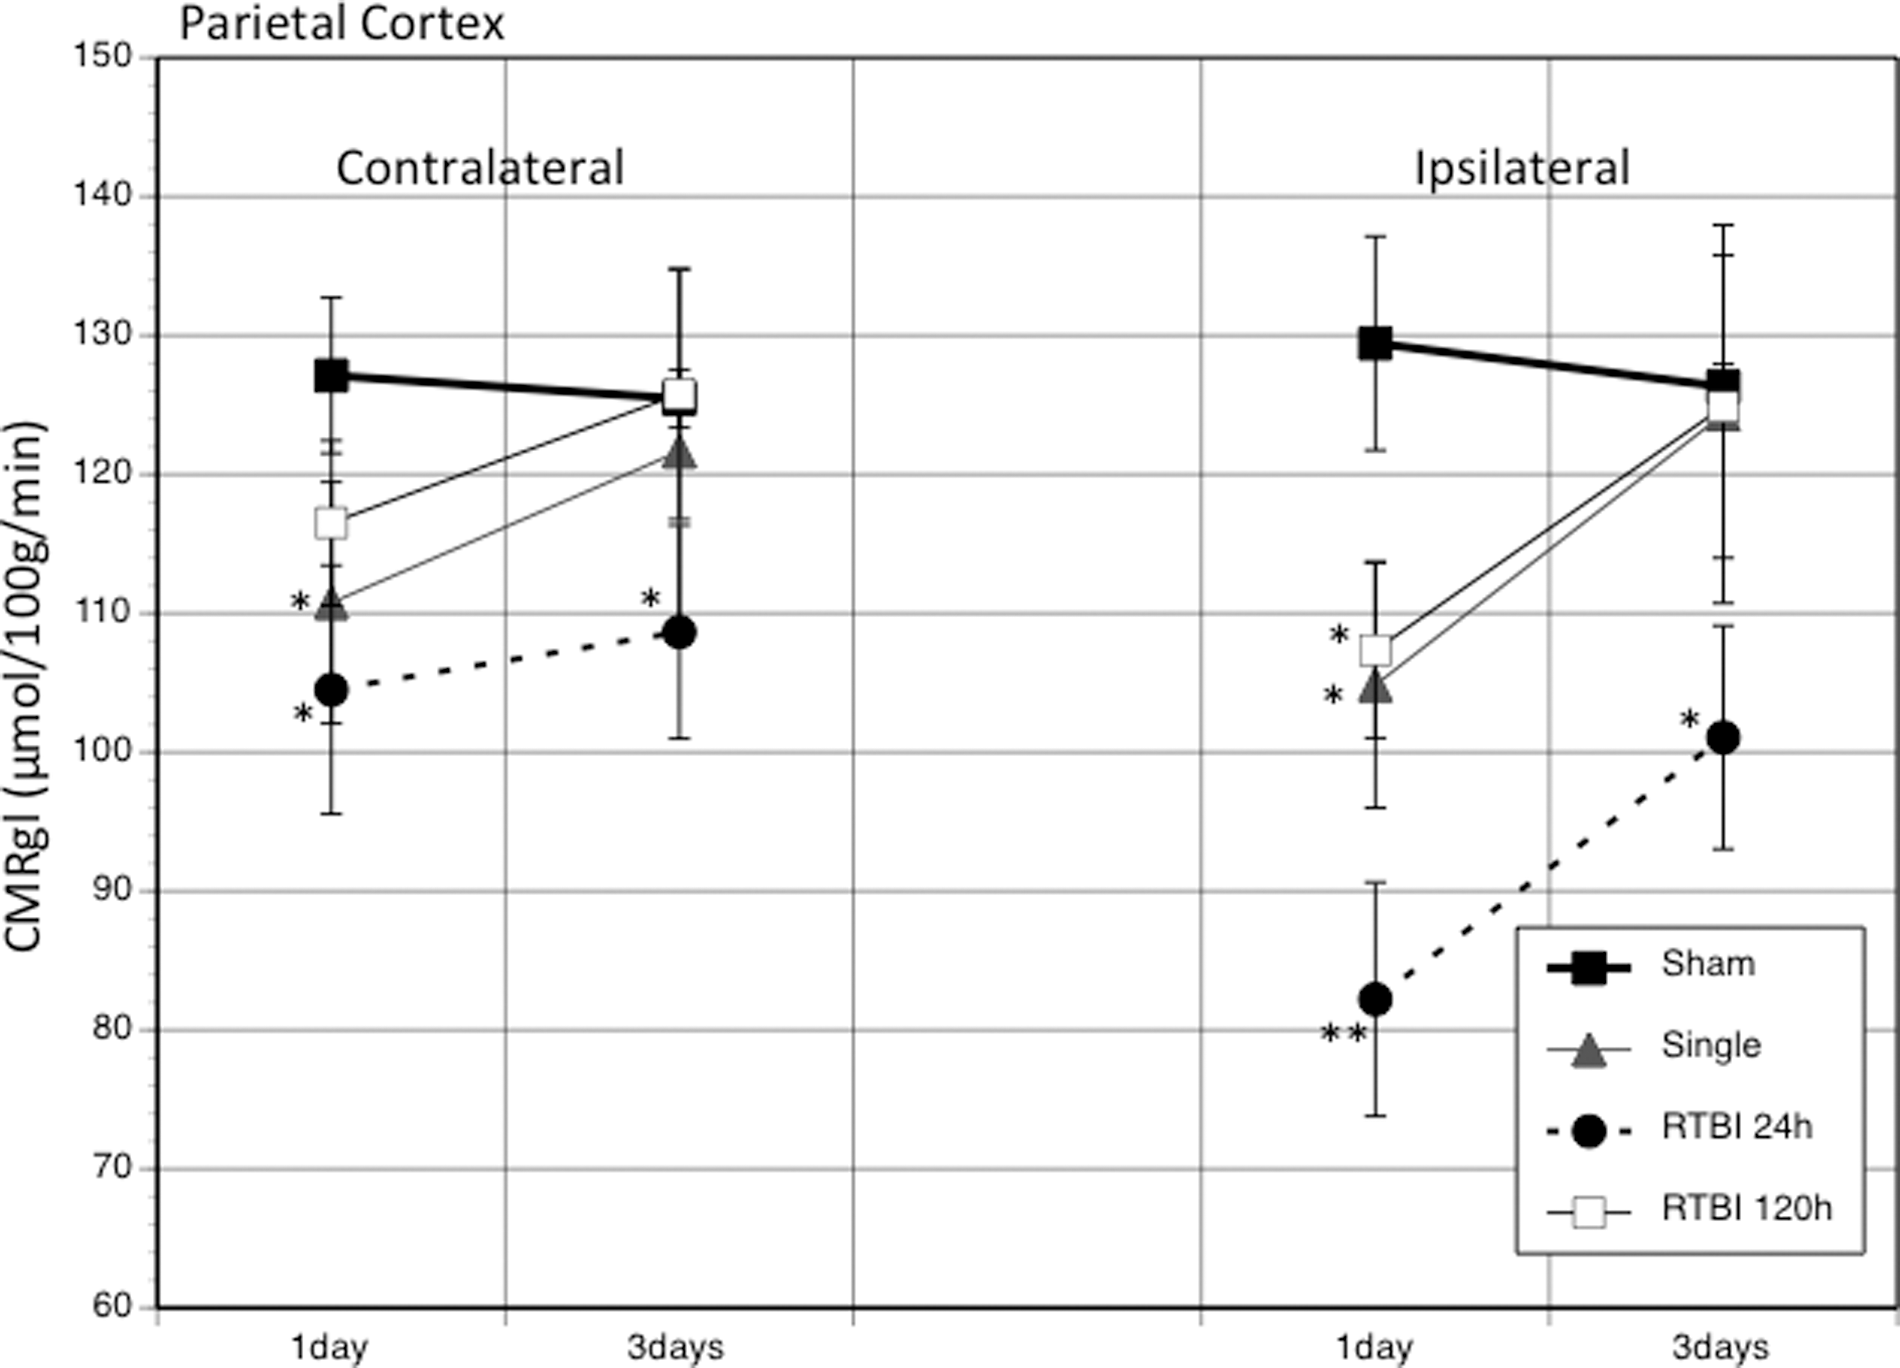
The graph shows the average (±standard error of the mean) changes in the cerebral metabolic rate of glucose (CMRglc) between injury groups at 1 and 3 days post-injury in the contralateral and ipsilateral parietal cortex. *p<0.05; **p<0.01. RTBI, repeated traumatic brain injury.
Hippocampus CA1
The average CMRglc rates for sham PND35 rats were 80.8±4.5 (contralateral) and 83.6±3.1 (ipsilateral) μmol/100g/min (Fig. 6). A single mTBI caused a significant bilateral decrease in CMRglc rates for contralateral and ipsilateral CA1 (15.2% and 19.4%, respectively). RTBI with 24-h interval showed significantly greater bilateral decreases in CMRglc rates (33.5% contralateral and 40.1% ipsilateral). These metabolic rates remained significantly depressed in both hemispheres at 3 days. RTBI with 120-h interval showed no significant changes in metabolic rates relative to sham animals at either PID1 or PID3.
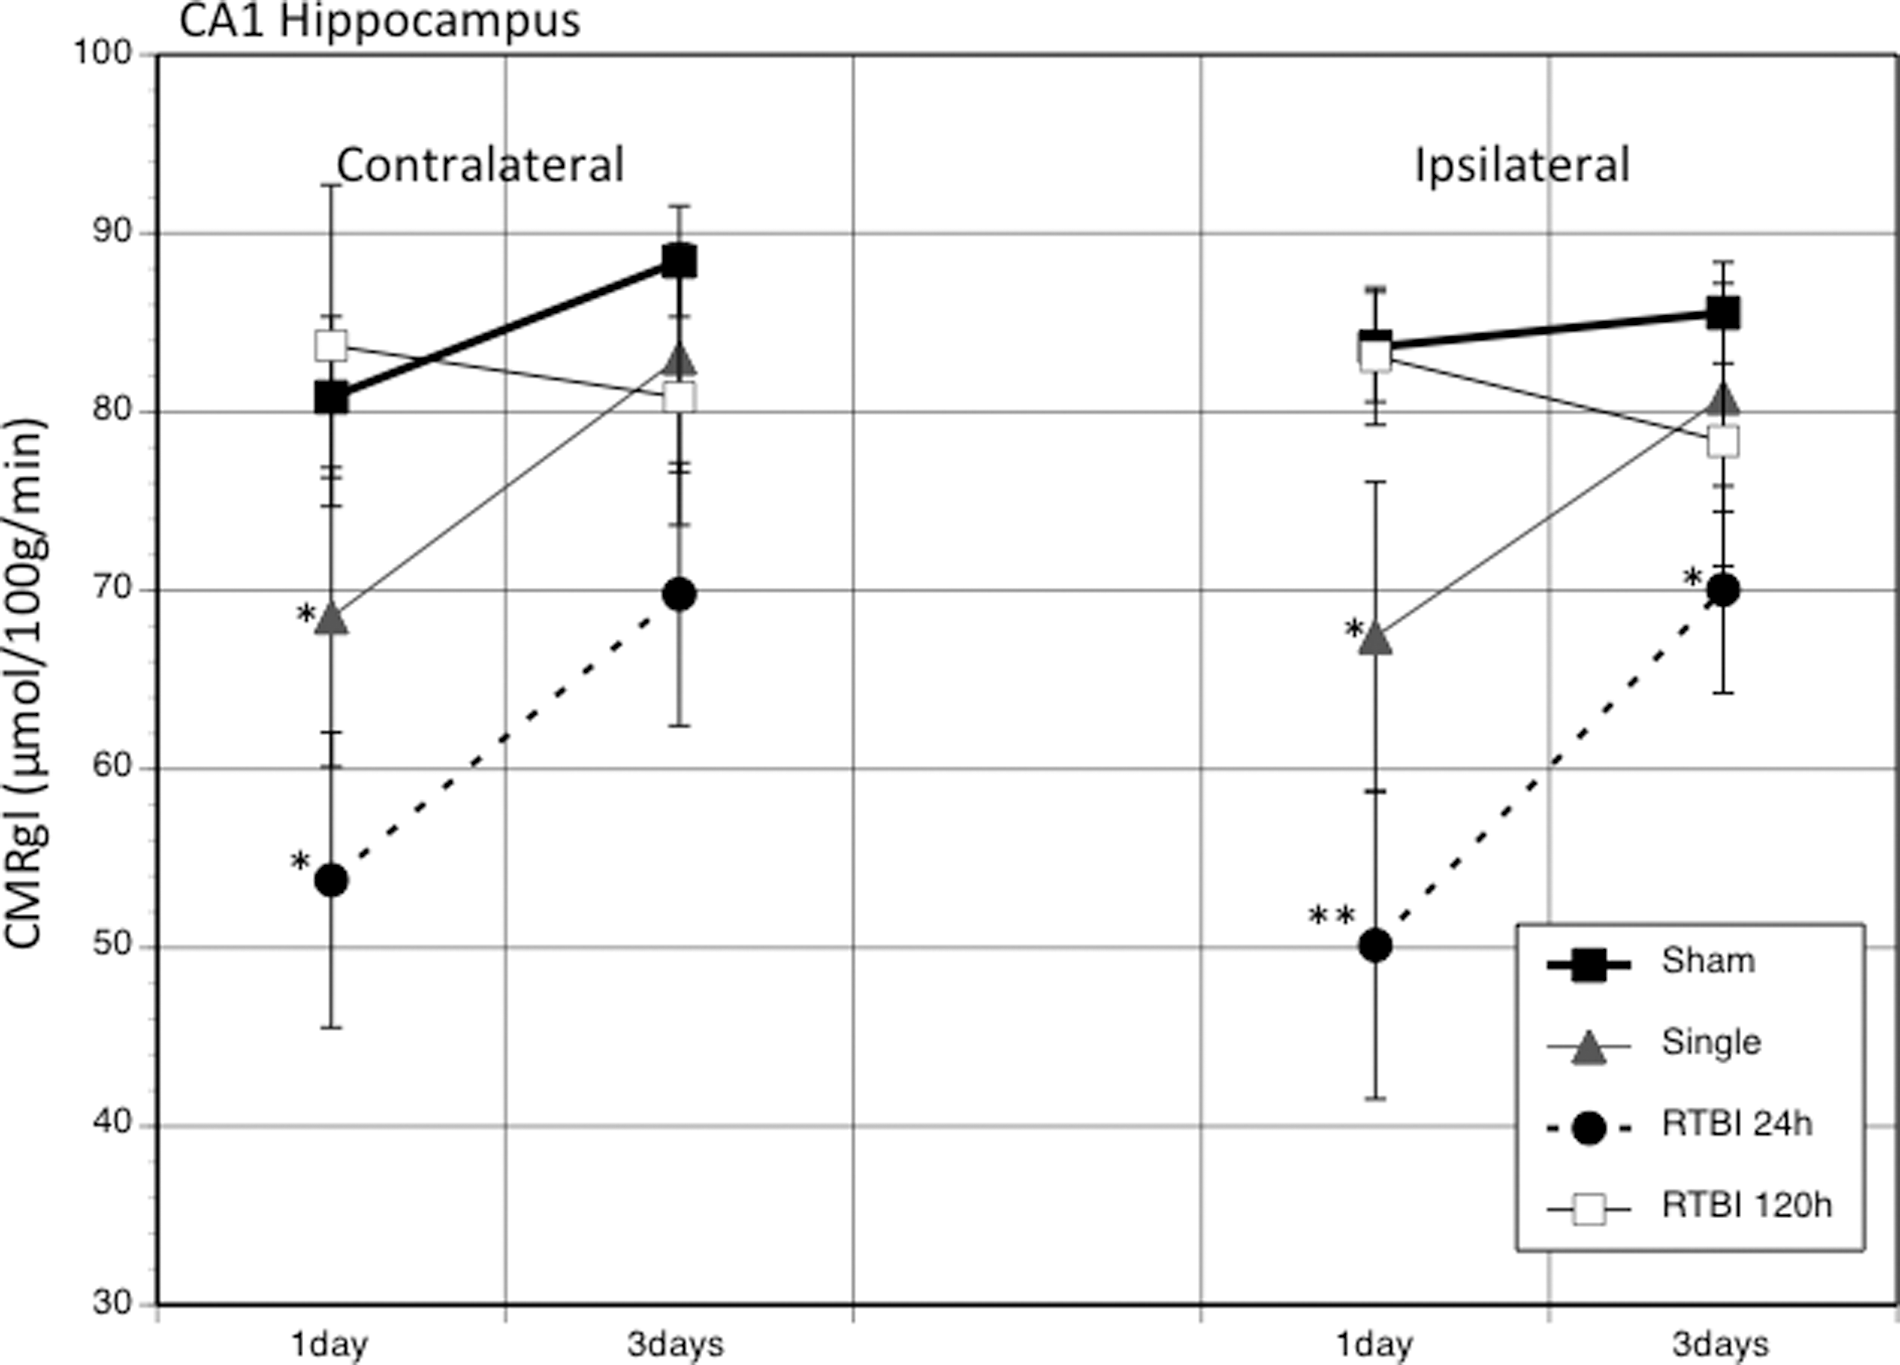
The graph shows the average (±standard error of the mean) changes in the cerebral metabolic rate of glucose (CMRglc) between injury groups at 1 and 3 days post-injury in the contralateral and ipsilateral CA1 hippocampus. *p<0.05; **p<0.01. RTBI, repeated traumatic brain injury.
NOR task
Animals able to discriminate between the old and new objects should spend more than 50% of their exploration time with the new object. Results from a previous study 31 examined behavioral differences between sham, single injured, and RTBI groups at PID1. Only in animals who were assigned to the 24-h interval RTBI group were tested with the NOR at different times after injury to follow the time-course of recovery. Both the single (61.3%) and RTBI 24-h (54.3%) groups showed significant decreases in percent time spent with the novel object relative to sham (78.8%). In the current study, the recovery of this deficit was explored at PID3 (Fig. 7). Sham animals presented with a novel object 24 h after familiarization performed as previously expected at 71.7% time with the novel object. Single injured animals (67.0%) showed no significant difference from sham in percent time spent with the novel object. The RTBI 24-h group, however, continued to show significant deficits in recognition of the novel object at PID3 (57.5%) relative to sham.
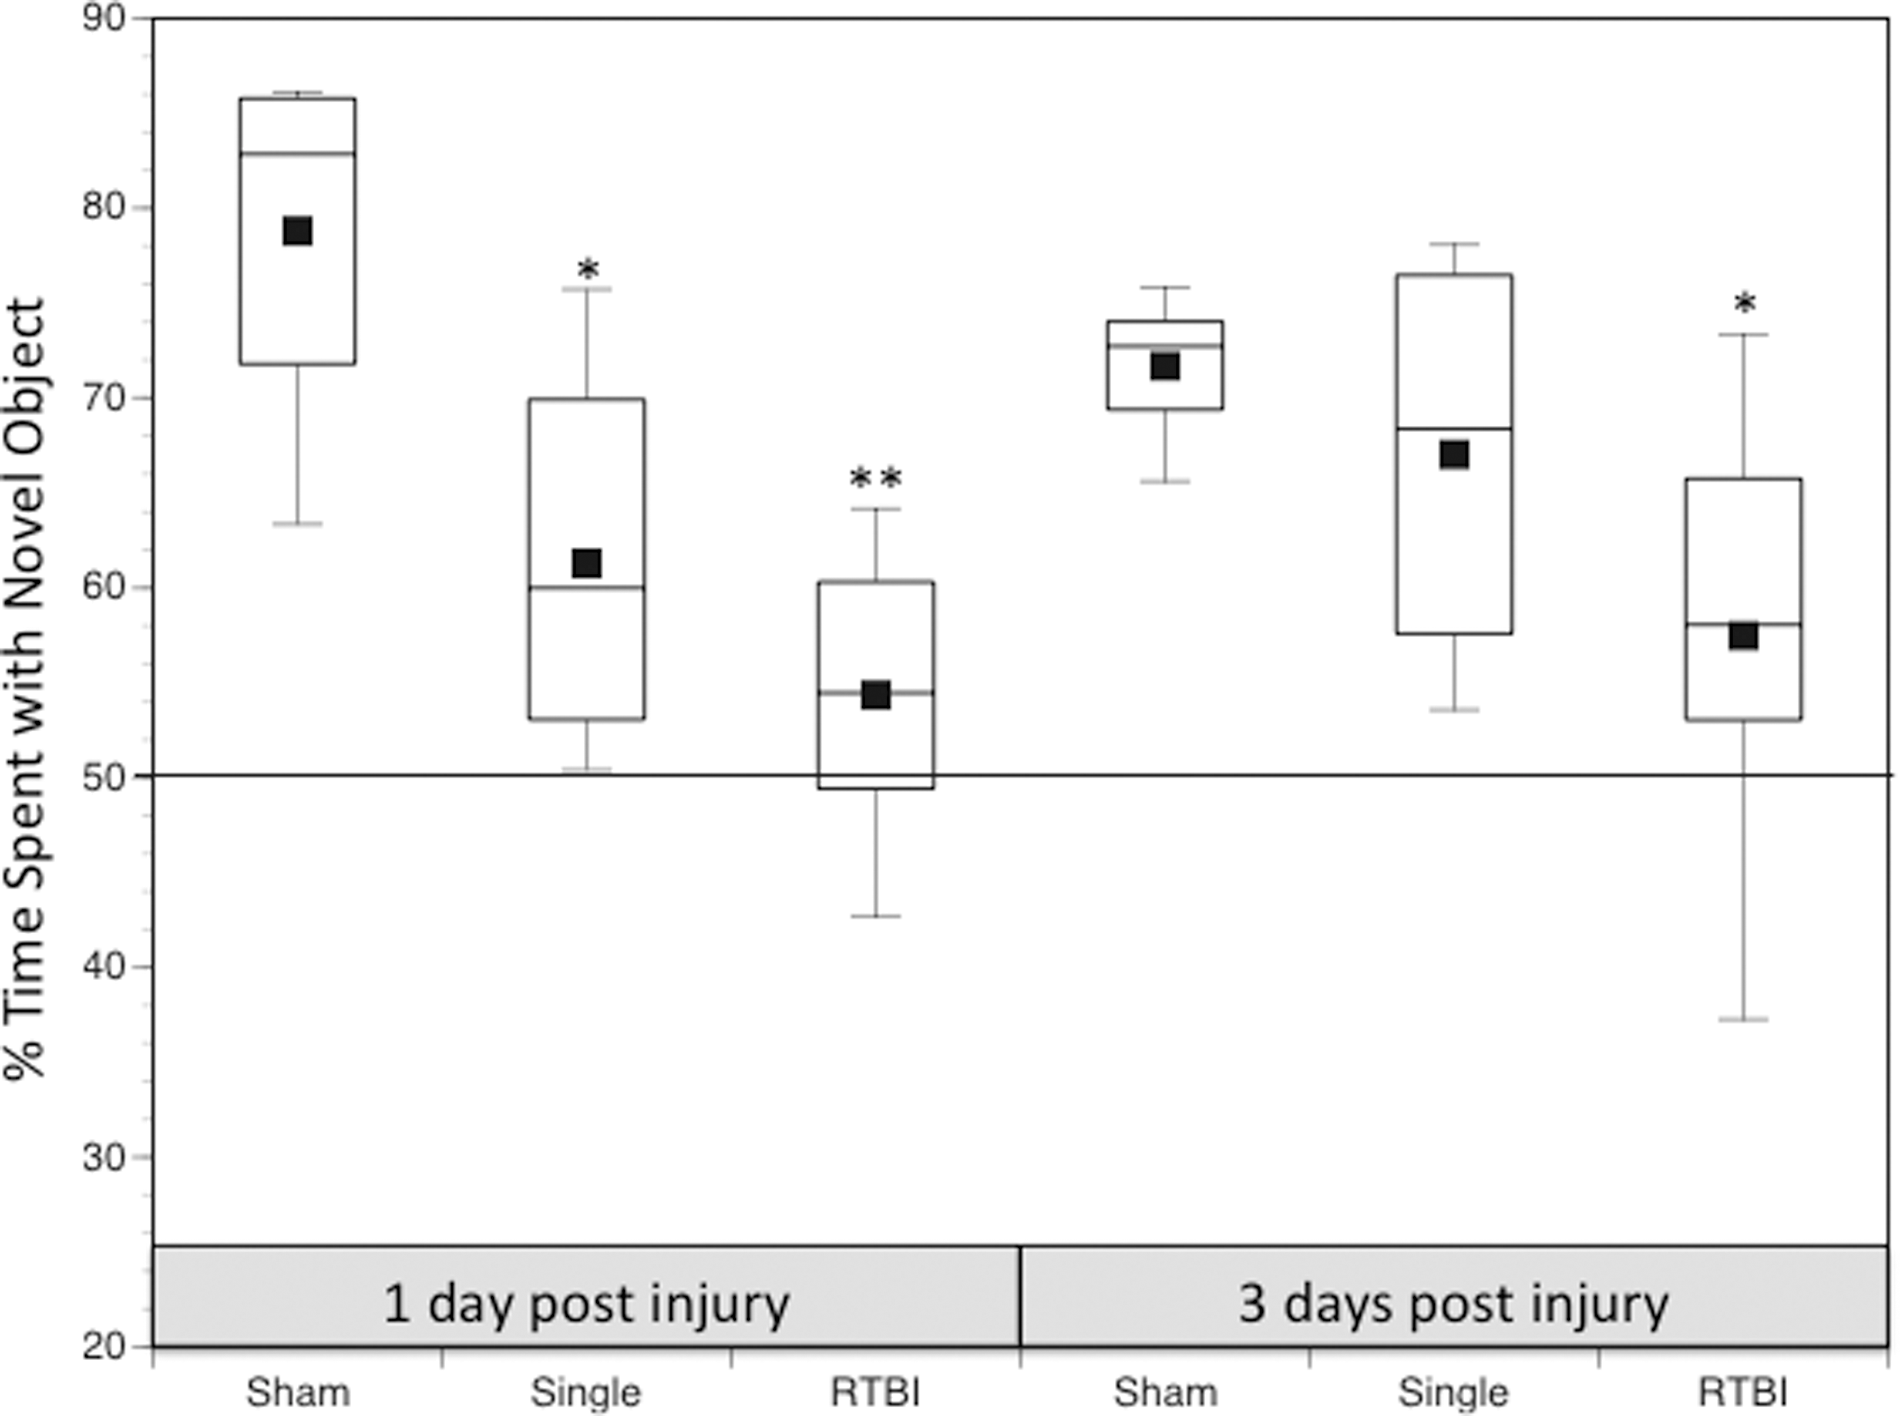
Time course of novel object task recovery are shown for sham, single, and repeated traumatic brain injury (RTBI) 24 h. The box plot shows the median percent time spent with the novel object at 1 and 3 days post-injury. Behavioral changes after RTBI 120 h were not conducted for this experiment. *p<0.05, **p<0.01 relative to sham animals.
Discussion
The CMRglc hypometabolic phenomenon
CMRglc hypometabolism has been observed after various types of brain injuries, including freeze lesions, ischemia, TBI, and blast injury. Unilateral freeze lesions in the adult rat produced widespread ipsilateral cortical decrease in CMRglc with less hypometabolism in subcortical structures between 1–3 days post-lesion. 38 Similar decreases in CMRglc have been reported in the adult rat within 2 h after ischemia. 39 and in numerous models of TBI. 5,40 –42 The magnitude and duration of the hypometabolic phase varies with injury severity in both animal models of TBI 12 and clinical TBI. 20,43 –45 In adult rats, glucose hypometabolism was maintained for 5, 10, or 14 days after mild, moderate, or severe FP injury, respectively. 12 This relationship between CMRglc and injury severity has also been observed in human patients with TBI, where thalamic, brain stem, and cerebellar regions correlated with the Glasgow Coma Scale. 18 And as mentioned in the Introduction, cerebral development also affects the duration of glucose hypometabolism, with the duration of hypometabolism increasing with age.
The duration of the CMRglc depression has been shown to correlate with the time course of cognitive deficits, suggesting that the metabolic abnormalities have functional consequences. This relationship has been demonstrated after freeze lesions in rats, 38 lateral FP injury in rats, 13 and severe closed head injury in adult patients. 46 Lesioned adult rats showed significant increase in latency for a somatosensory task of adhesive removal from the forepaws. The recovery profile of this task was temporally correlated with the recovery of average cortical CMRglc. 38
Manipulation of CMRglc with drugs, such as d-amphetamine, not only induced recovery of CMRglc in the sensorimotor cortex, 15 but also alleviated the locomotor deficits after cortical lesions. 47 It is important to note that mTBI or brain injuries that cause no overt cell loss have been shown to produce both CMRglc depression and detectable behavioral deficits. 48,49 The time course for cognitive recovery of adult rats after FP injury with no cell loss was also shown to correlate temporally with the cortical CMRglc recovery. 13 Collectively, this growing body of evidence demonstrates the fundamental cerebral response to injury involves alterations in CMRglc regardless of injury type, severity, age, or cell loss and consequently produces functional deficits. It should be noted that very few clinical PET studies have been conducted after TBI in children and, therefore, how the corresponding metabolic time course varies with age is currently unknown.
What causes CMRglc depression?
While CMRglc depression appears to be a universal response to brain injury, what is its etiology? CMRglc determined by PET or 14C-2DG autoradiography measures cerebral uptake of glucose up to the hexokinase reaction. Brain glucose uptake can decrease under substrate limiting conditions or alterations in glucose transporter expression. The question of whether head-injured patients show changes in their plasma glucose profile as a result of TBI is difficult to determine, given that blood glucose is aggressively managed within a specific range in human patients to prevent hyper-/hypoglycemia. 50
Results from animal studies show that PND35 rats maintained on standard chow had little change in blood concentrations of glucose or lactate. 17 While rapid increases in the expression of glucose transporter protein, GLUT1, have been reported after hypoxia ischemia, 51,52 a decrease in GLUT1 immunoreactivity was observed 2–4 h after FP injury in adult rats. 53 Clinical evidence, however, suggests that GLUT1 expression along microvessels is patchy, with some regions showing increased expression interspersed with regions of low expression. 54 Studies examining the kinetics of 18F-FDG in head-injured patients showed focal decreases in glucose transport at the contusion site and global reduction in hexokinase activity. 18 Interpretation of these findings is difficult, given that the regional differences may not reflect leakage of glucose through the blood-brain barrier acutely after injury. No studies, however, have addressed the changes in GLUT1 vascular expression with time after TBI, so its contribution to long-term CMRglc depression is unknown.
If one were to assume that glucose supplies are abundant and transport is sufficiently functional, then the decreases in CMRglc must either reflect decreased need for glucose metabolism or metabolic dysfunction. Decreases in CMRglc have been proposed to reflect changes in neurotransmission, 55 thereby resulting in decreased neuronal activity and decreased energy demands. Changes in both the serotonergic and adenosine concentrations have been shown to be altered after TBI 56,57 and affect CMRglc. 28,58 TBI-induced increases in extracellular adenosine and serotonin, however, are acute changes that return to baseline within 40 min after CCI injury 59 and 160 min after FP injury. 56 This acute time course in the rodent is not likely to account for the CMRglc changes that last days. It should be mentioned, however, that severe human TBI has shown elevated cerebrospinal fluid levels of adenosine days after injury, which were correlated with metabolic depression. 60 Freeze lesions have also been shown to induce CMRglc depression at 3 days, at which time serotonin synthesis was significantly elevated. 58 While the current body of evidence does not support neurotransmitter-induced metabolic depression, more research in this area is needed, because there remains a possibility that these earlier chemical changes may be the impetus for longer-lasting metabolic cascades.
The mechanism of CMRglc depression may also differ with time after injury. The possibility remains that the acute initiating mechanisms may result in delayed secondary cascades that are reflected by continued CMRglc depression. While these TBI-induced acute neurochemical changes may initiate decreases in CMRglc, delayed effects may be related to diffuse synaptic loss and/or axonal impairments. TBI has been shown to damage axons 61 and result in white matter damage. 62 After TBI, regions of diffuse axonal injury showing decreased fractional anisotropy were significantly correlated with reduction in CMRglc as measured by PET. 63 The axonal injury is often heterogeneous, because myelinated fibers show earlier recovery of action potentials than non-myelinated fibers of the corpus callosum. 64 In multiple sclerosis, patients who exhibit demyelinated axons also shown remote effects on CMRglc with significant glucose metabolic depression in the thalamus and cerebellum. 65 This type of denervation-induced CMRglc decrease has also been reported in Alzheimer's disease. 66 Damage to axons and/or decreases in synaptic connectivity can directly affect cerebral activity levels, CMRglc, and behavioral outcome. 67
After TBI, axonal changes occur concurrently with ongoing neurometabolic alterations. Our laboratory has proposed that this CMRglc reduction is related to glycolytic dysfunction induced through a cascade of metabolic derangements initiated on impact. This metabolic depression is accompanied by decreased levels of ATP, 68 increased flux of glucose through the pentose phosphate pathway, 69 free radical production, 70,71 and depletion of cytosolic nicotinamide-adenine dinucleotide (NAD+) resulting in the glyceraldehyde-3-phosphate dehydrogenase inhibition. 72 Glycolysis needs a constant supply of NAD+, and when it is experimentally depleted, glycolytic inhibition and decreased glucose metabolism is observed. 72 –74 Despite the unclear mechanism, the state of metabolic depression reflects an altered cerebral state that is associated with functional deficits and has been proposed to reflect a vulnerable cerebral state. 21,24,25
It is important to also mention that the prolonged changes in CMRglc can also reflect changes in cerebral blood flow (CBF) and therefore autoregulation. Post-traumatic release of adenosine can initiate changes in CBF, resulting in uncoupling of CBF and metabolism. Impaired autoregulation has been reported after TBI in humans 75 and rats, 76 but less is known in younger age groups or after mTBI. While lasting hypoperfusion after mTBI in adults 77 –80 and in the young, 81 –83 future studies addressing the relationship between autoregulation at the neurovascular unit and metabolic changes after concussive injuries in different age groups must be conducted.
Metabolic window of vulnerability
One of the most commonly expressed concerns among physicians regarding concussions in sports or military is the issue of safe “return to play” assessment. When is the brain safe to resume normal activities and can this be objectively quantified independent of the patient? Several repeated TBI studies have demonstrated exacerbation of injury outcomes with subsequent injuries, but not many experimental studies have addressed potential biological indicators for the window of vulnerability. In a two-part study on the effects of repeated mild weight drop on adult rats, investigators have demonstrated that in adult rats given two weight drop injuries at different intervals have the greatest decrease in mitochondrial metabolism (N-acetylaspartate (NAA), adenosine triphosphate) and greatest increase in oxidative injury when the interval between injuries is 3 days. 24,84 Those animals receiving two mTBIs at 5 days apart showed similar mitochondrial function as controls. A subsequent clinical report with 1H-MRI in 13 concussed athletes showed NAA/Cr ratios decreased by 18.5% at 3 days post-injury with return to control levels by 30 days. Three of these patients who resumed normal activities shortly thereafter sustained a second concussion that resulted in more prolonged deficits in NAA/Cr ratios with delayed recovery at 45 days. 26
Results from the current study suggest that the duration of metabolic depression reflects the time-course of cerebral vulnerability to second injury in the juvenile brain and could provide a valuable target in establishing an age-appropriate window of vulnerability guidelines. The fact that injuries of various types within numerous age groups produce a common cerebral response suggests a common underlying mechanism. Further, the correlation between duration of the hypometabolic phase and the duration of the cognitive deficits also suggests that the phenomenon of CMRglc hypometabolism can serve as a biomarker for cerebral dysfunction and vulnerability. While it is not reasonable to imply that mTBI patients should undergo routine or repeated PET imaging, these results provide the physiological data, which can be related to metabolic markers that can be imaged through non-invasive modalities or correlated to behavioral measures of dysfunction.
Footnotes
Author Disclosure Statement
No competing financial interests exist.