
Abstract
Diffuse axonal injury (DAI) is the predominant effect of severe traumatic brain injury and contributes significantly to cognitive deficits. The mechanisms underlying these cognitive deficits are often associated with complex metabolic alterations. However, the relationships between temporospatial alterations in cerebral glucose metabolism and the pathophysiology of DAI-related learning and memory dysfunction are not yet completely understood. We used a small animal positron emission tomography (PET) scanner with 2-[F-18]-fluoro-2-deoxy-D-glucose (18F-FDG) as a molecular probe to evaluate temporospatial glucose metabolism in vulnerable areas of rats with DAI. The Morris water maze (MWM) was used to evaluate the development and progression of learning and memory dysfunction. Compared to the sham-treated group, PET-MRI fusion images showed that glucose metabolism was reduced in animals with DAI. In addition, the standardized uptake value (SUV) of 18F-FDG was significantly decreased in the sensorimotor cortex, hippocampus, corpus callosum, caudate putamen, brain stem, and cerebellum at days 1, 3, and 7 after injury. SUV returned to baseline levels by 30 days after injury. The escape latency of the injured group was significantly increased, and the percentages of distance travelled and time spent in the target quadrant were significantly decreased 1 month after injury. These effects persisted for 3 months. SUVs in the hippocampus at the acute stage were significantly correlated with MWM performance during the recovery stage of DAI. These results demonstrate that microstructural injury-induced hypometabolism in the hippocampus at the acute stage are all significantly correlated with learning and memory dysfunctions during the recovery stage of DAI.
Introduction
D
PET is a noninvasive imaging technique that allows for quantitative in vivo measurements of regional brain metabolism. It is suitable for repeated studies and potentially useful for investigating longitudinal changes during recovery or with treatment interventions. 6 Recently, improvements in scanner resolution have enabled the use of PET to monitor cerebral metabolic patterns in rat brains using small animal positron emission tomography (microPET). 7 –9 The tracer used in microPET, 2-[18F]-fluoro-2-deoxy-D-glucose (18F-FDG), is a well-known radiotracer that has frequently been used as a marker of brain glucose metabolism. Because the glucose is the primary fuel source under normal conditions in the adult, 10 –12 the level of glucose utilization correlates with the degree of neuronal activity. 2 Following TBI, neurons exhibit a metabolic state called hyperglycolysis in which glucose metabolism is increased above normal levels. 13 The initial brief period of hyperglycolysis is followed by a relatively prolonged period of metabolic depression that is followed by recovery. 14
DAI is typically characterized by a scattered, multifocal distribution without a focal cerebral contusion. 15 Recently, DAI has become widely recognized as a major factor in the development of cognitive dysfunction, including learning and memory impairments in patients, even when they have no obvious abnormalities on conventional magnetic resonance imaging (MRI). 15,16 In particular, hippocampal damage is thought to contribute to post-traumatic cognitive dysfunction, especially learning and memory impairments, which represent some of the most debilitating and persistent sequelae of DAI. 17 –19 Therefore, the purpose of the present study was to investigate the role of acute hippocampal hypoglycolysis in hippocampus-dependent learning and memory dysfunctions during the recovery stage of DAI in rats.
Methods
Animals
A total of 25 male Sprague-Dawley rats (339.54±28.37 g; National Rodent Laboratory Animal Resources, Shanghai Branch, China) were used in this study. The animals were habituated to the housing conditions for at least 7 days after their arrival in the animal facility. The rats were housed at a constant temperature (20°C) and humidity (50%), maintained under a light/ dark cycle, with the lights on from 7:00 am to 7:00 pm, and provided laboratory animal chow and water ad libitum. All procedures involving animals were approved and monitored by the Animal Care Committee of the Shanghai Jiao Tong University School of Medicine. The rats were divided into two parallel experimental groups: the sham-treated group (n=10) and the injured group (n=15). Both groups received microPET/CT scans at 24 h, 3 days, 7 days, and 30 days following injury.
Animal model preparation
The method for creating the experimental DAI model used for this study has been described previously. 16,20 Briefly, the rats were anesthetized with isoflurane/oxygen mixture (5% for induction) in an anesthetic chamber using a volume ventilator (Summit Anesthesia Solutions, Bend, OR). After induction of anesthesia, the head of the rat was secured to a helmet. An ear pin was squeezed into the ipsilateral external ear canal, and a superior titanium plate was used to compress the bilateral calvaria. The body of the rat was positioned on a foam-covered platform at a 20° oblique angle. For rats in the injured group, the angular displacement of the head was approximately 75°, and the linear displacement was 1.57 cm, while rats in the sham-treated group were freed from the device without exposure to head acceleration. After induction of anesthesia, we used a blind oral endotracheal intubation of the rats, then used a ventilator to verify correct placement. During and after trauma, animals were intubated and mechanically ventilated using an ALC-V8D ventilator (Shanghai Alcott Biotech, Shanghai, China) to assist their respiration.
Animal preparation for image acquisition
Prior to every scan, each rat was anesthetized using isoflurane/oxygen mixture (5% (v/v) for induction and 2% (v/v) for maintenance) as mentioned above. After the appropriate stage of anesthesia was reached, each rat was fitted with a custom-made nose cone in a heated Plexiglas holder to deliver inhalant anesthetic. The head was securely fixed using ear bars and a nose bar, and the trunk was fastened using belts to minimize movement artifacts. Two probes connected to fiber optic cables were placed over the front thorax to monitor respiration and electrocardiographic signals. The signals were fed into an oscilloscope that displayed chest motion throughout the scan. Core temperature, measured with a rectal probe, was kept constant at 37.2±0.1°C using a heating pad.
The microPET/CT scan
The rats were deprived of food for 24 h prior to PET scans to ensure stable plasma glucose levels. PET/CT scans were performed using an Inveon preclinical PET/CT scanner (Siemens Medical Solutions, Knoxville, TN). Prior to FDG administration, a 15-min static CT transmission scan was conducted for MRI co-registration. A 24-G indwelling needle was inserted into the tail vein under light ether anesthesia. Next, pyrogen-free 18F-FDG (specific activity of 1000–2000 Ci/mmol, 0.4 mCi in a maximum volume of 0.5–0.7 mL of sterile saline) was intravenously injected into each rat. PET data acquisition in the three-dimensional mode began immediately after the bolus injection of 18F-FDG. A static PET scan was performed continuously for 45 min. All dimension-mode acquisition data were sorted into three-dimensional sinograms, which were then Fourier rebinned into two-dimensional sinograms and output as DICOM data. For all quantitative data analysis, the images were reconstructed using two-dimensional filtered back-projection with a ramp filter. For visualization purposes only, the data were reconstructed using a statistical maximum a posteriori probability algorithm. 21 All reconstructions were performed on an Inveon Research Workplace with computing times of 10 and 40 min/scan for filtered back-projection and maximum a posteriori probability, respectively. Reconstructed images had a pixel size of 0.15×0.15×0.15 mm 3 .
MRI scans
After completing the PET scans, we scanned the anatomical structure of each rat brain using a 7.0 T magnetic resonance (MR) imaging scanner (V. 70/16; PharmaScan, Bruker Biospin, Rheinstetten, Germany). The MR scanner center was equipped with an inductivity-coupled surface coil and was filled with the Plexiglas tube. The field homogeneity across the brain was optimized. The MRI sequences included scout imaging and T2-weighted imaging (T2WI). Coronal, sagittal, and axial scout images were first acquired to align the subsequent T2WI along standard anatomic orientations. T2WI were obtained by a fast spin echo sequence with the following imaging parameters: repetition time (TR)=5000.0 msec, effective echo time (TE)=36.0 msec, echo train length (ET)=8, field of view (FOV)=35 mm×35 mm, matrix resolution=256×256.
MRI and PET data analysis
Co-registration of FDG-PET images
We used SPM8 software (Statistical Parametric Mapping 8; Wellcome Department of Cognitive Neurology, Institute of Neurology, London, United Kingdom;
Three-dimensional region of interest analysis
The image data acquired from microPET/CT were displayed and analyzed with Image J software (National Institutes of Health, Bethesda, MD;
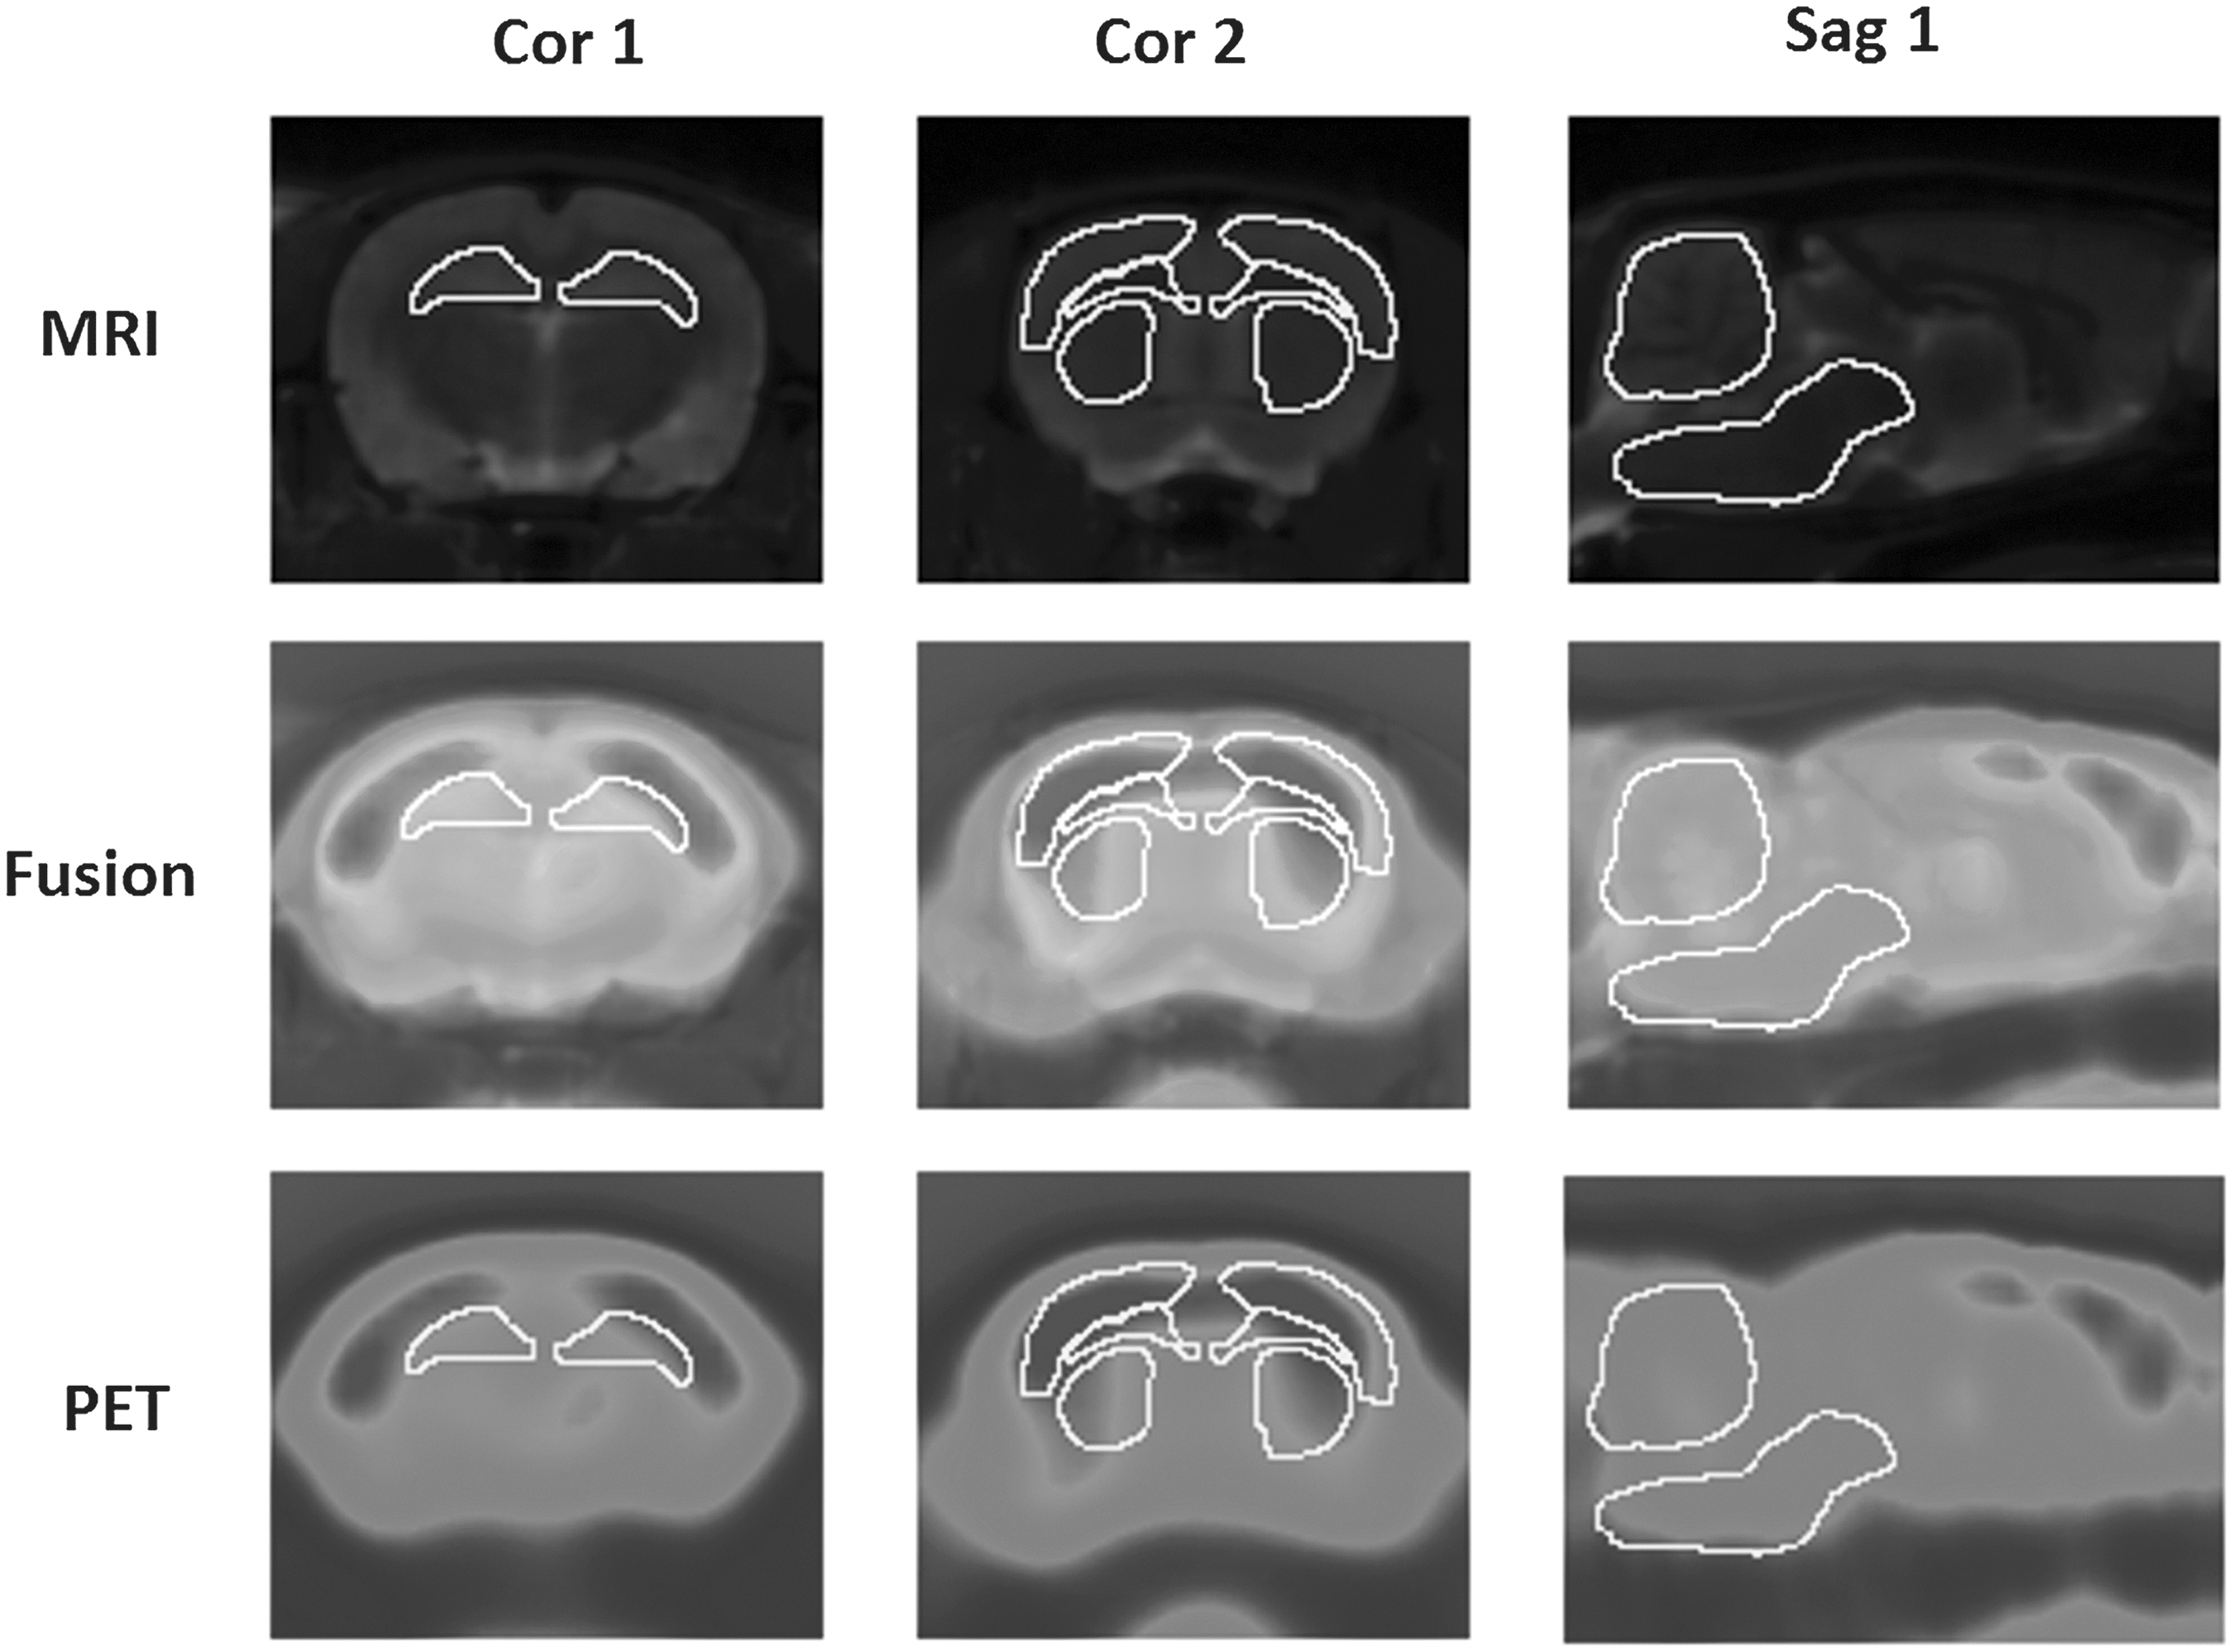
ROIs at the optimal coronal or sagittal layers in MRI co-registered microPET images. Cor 1, hippocampus (−3.80 mm to bregma); Cor 2 (from upper to lower), sensorimotor cortex, corpus callosum, caudate putamen (+0.20 mm to bregma); Sag 1 (from upper to lower), cerebellum, brain stem (mid-sagittal plane). Three consecutive slices containing representative coronal layers from the following volumes of interest were co-registered: hippocampus layers (−2.12 mm–−5.30 mm to bregma); sensorimotor cortex, corpus callosum, and caudate putamen layers (−0.4–1.2 mm to bregma); and brain stem and cerebellum layers (1 mm beside mid-sagittal plane). The intensity of SUV is shown on a pseudocolor scale using the ImageJ software package.
Standardized uptake value calculation
Brain uptake of radioactivity was decay corrected to the injection time and expressed as the standardized uptake value (SUV), which is normalized for the amount of injected radioactivity and for body weight. SUVs were calculated at each voxel in the reconstructed images as an index of FDG accumulation, according to the below equation.
Morris water maze
We used the modified Morris Water Maze (MWM) test in a blind manner to investigate learning and memory processes in rats. The test apparatus consisted of a large, black circular pool (196-cm diameter, 76-cm height) and a 10-cm-diameter Plexiglas black platform submerged 10 mm below the water surface. The temperature of the water was maintained between 20.2 and 23.8°C. During the experiments, the platform remained in a constant location in quadrant III. Place navigation tests assessed spatial learning using a hidden platform task, which consisted of four trials per day for 4 consecutive days. The trials consisted of four drop-spots, completed in random order, as determined by a random number generator. The rats were gently placed in the water facing the wall at one of the four drop-spots, each of which is separated by 90°. The time required for each rat to find the goal platform (escape latency), the mean swimming speed, the percentage of the swimming distance in the correct quadrant, and the percentage of time spent in the correct quadrant were determined from recordings using an overhead camera connected to a computerized video tracking system (Muromachi Kikai, Tokyo, Japan). If a rat did not find the hidden platform within 90 sec, he was manually guided to it, allowed to remain on it for 10 sec, and given the maximum score of 90 sec for that trial. The trial was terminated when the rat reached the submerged platform or when 30 sec had elapsed. All rats remained on the platform for 1 min before beginning the next trial. After completion of one set, each rat was rinsed in warm water, dried, and returned to a heated chamber. Twenty-four hours following the last block of trials, on the fifth day, the platform was removed from the maze, and the ability of each rat to swim to the location of the removed platform area was evaluated (spatial probe test). This test assessed the animal's memory retention of the previously learned task. To limit the effects of motor deficits that may have been present immediately following injury, MWM testing began one week following injury. Blocks of trials were conducted over 5 consecutive days at 7–11, 30–34, and 91–95 days post-injury.
Statistical analysis
All results were expressed as the mean±standard deviation (SD). Intra-observer reproducibility was assessed using intra-class correlation coefficients (ICC), which provide a measure of intra-observer reliability, and the root-mean-square coefficient of variation (CV), which provides a measure of intra-observer precision. Student's unpaired t-tests were performed on comparisons between sham-treated and injured groups, and Student's paired t-tests were performed on comparisons between the left and right cerebral hemispheres within each group. Pearson correlation tests were used to evaluate correlations between SUV and MWM parameters. Statistical analyses were performed using the statistical package from SAS (V. 9.0). A p value of <0.05 was considered to be a statistically significant difference in the comparison of the parameters.
Results
Co-registration of PET and MR images
The present study used 18F-FDG microPET to elucidate the changes in glucose metabolisms that occur in the brains of rats subjected to axonal injury. To improve the accuracy of anatomical localization, microPET and T2WI were co-registered and fused (Fig. 1). ROI boundaries were drawn at the optimal coronal layers according the atlas of the rat brain (Fig. 1).
Temporospatial changes in glucose utilization
Normal ROIs were clearly observed in MRI T2WI with low signals in white matter and high signals in gray matter. In the sham-treated group, the glucose utilization in most brain structures, especially in the sensorimotor cortex, was remarkably decreased on days 1 and 3 but had returned to baseline levels by 30 days after injury. Seven days after injury, the injured rats showed reduced glucose utilization in a wide range of cerebral areas. On average, glucose utilization in the cerebellum was modestly reduced acutely but had returned to baseline levels by 30 days after injury. Reductions in glucose utilization in the sensorimotor cortex within the ROI were noted during the acute stage of injury (Fig. 2). By contrast, conventional T2WI showed no apparent signal changes between the control and post-injury images of the ROIs containing axonal injury.
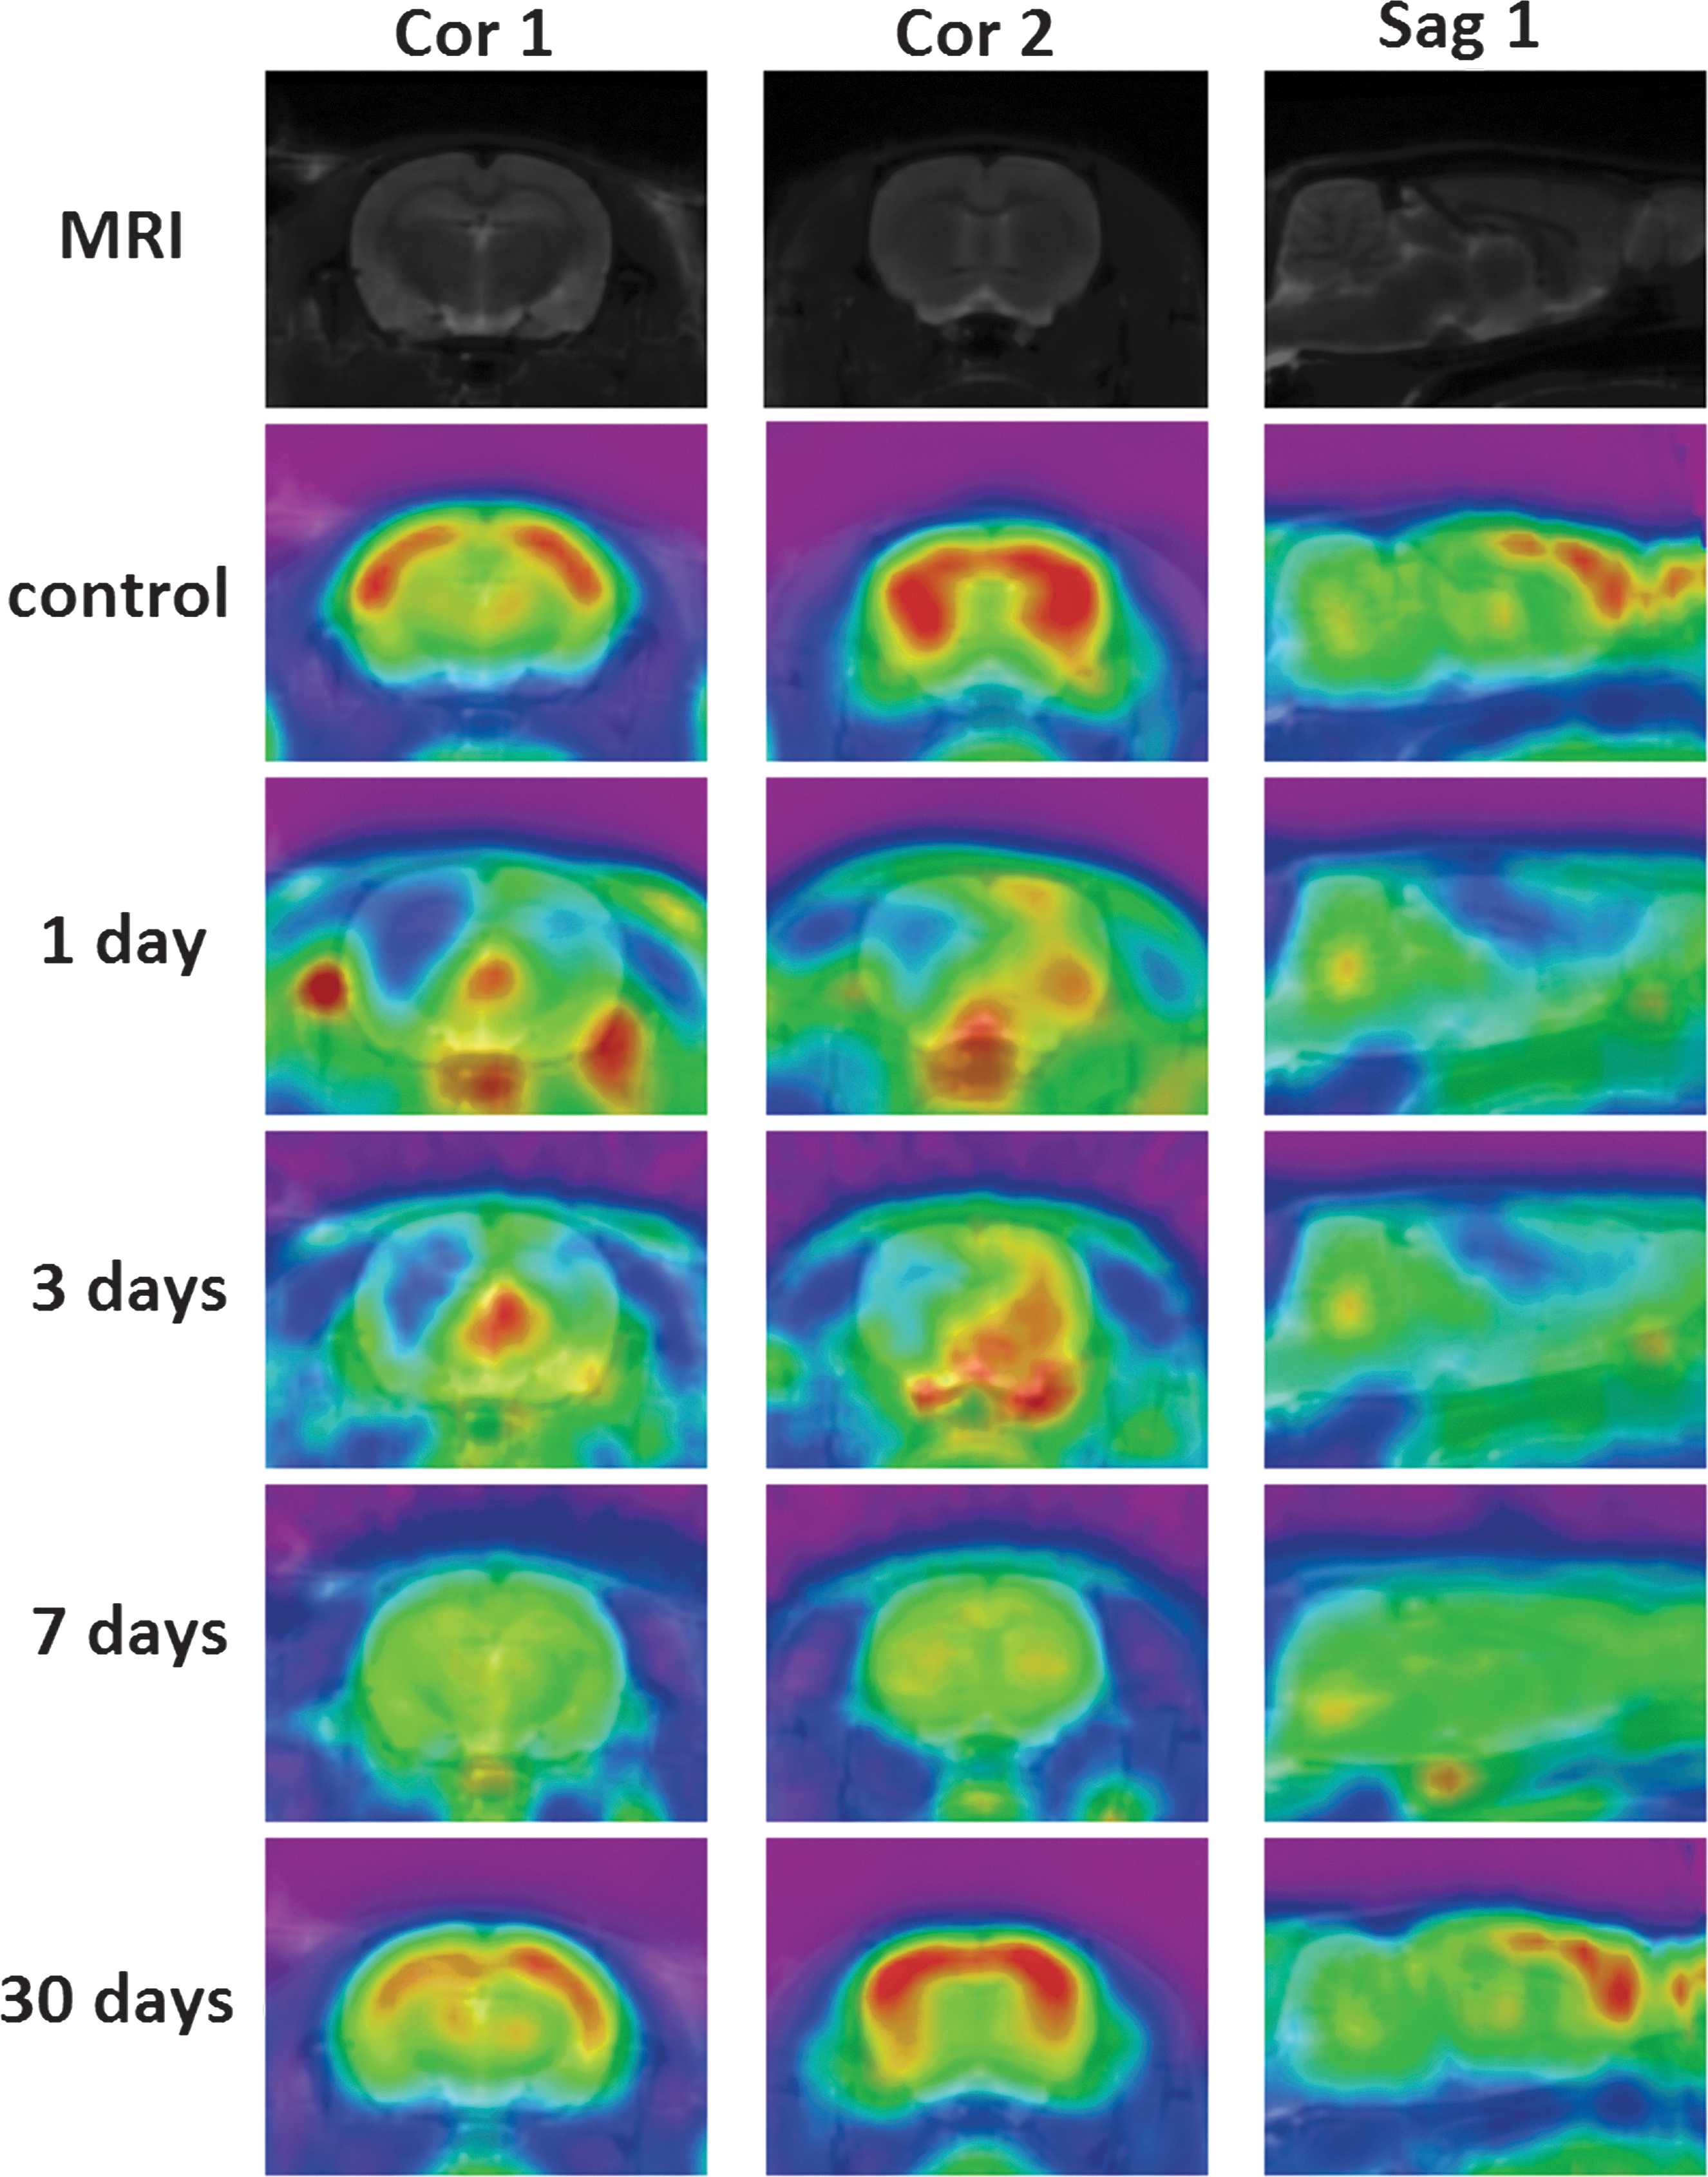
Representative coronal and sagittal 18F-FDG-labeled MRI-PET fusion images of glucose metabolism in ROIs at different time points after injury (red-to-blue indicates high-to-low accumulation of glucose). Color image is available online at
For quantitative analyses, the ROI-based analysis of PET images revealed significant decreases in SUVs in cortical areas. The SUVs in most brain structures, especially the sensorimotor cortex, hippocampus, corpus callosum, caudate putamen, brain stem, and cerebellum, were significantly decreased at 1, 3, and 7 days after injury, but they had returned to baseline levels by 30 days after injury (Table 1).
A P value less than 0.05. No significant differences were observed when comparing SUVs between the left and right ROIs within each time point.
BS, brain stem; Cb, cerebellum; CC, corpus callosum; Cpu, caudate putamen (striatum); Hi, hippocampus; ROIs, regions of interest; Sm, sensorimotor cortex; SUV, standardized uptake value.
MWM results
The rats in the injured group tended to have longer escape latencies than the rats in the sham-treated group; in addition, the injured group had lower percentages of distance travelled and time spent in the correct quadrant. However, there were no significant differences between the two groups for most parameters (Table 2). Thus, learning and memory dysfunctions in injured rats have not yet been established during the sub-acute phase after injury.
A P value less than 0.05.
MWM, Morris Water Maze.
By 31–35 days after injury, the rats in the injured group had significantly longer escape latencies than the rats in the sham-treated group but they exhibited lower percentages of distance travelled and time spent in the correct quadrant (Table 3). Thus, learning and memory dysfunctions had been established in the injured rats by approximately 1 month after injury.
A P value less than 0.05.
MWM, Morris Water Maze.
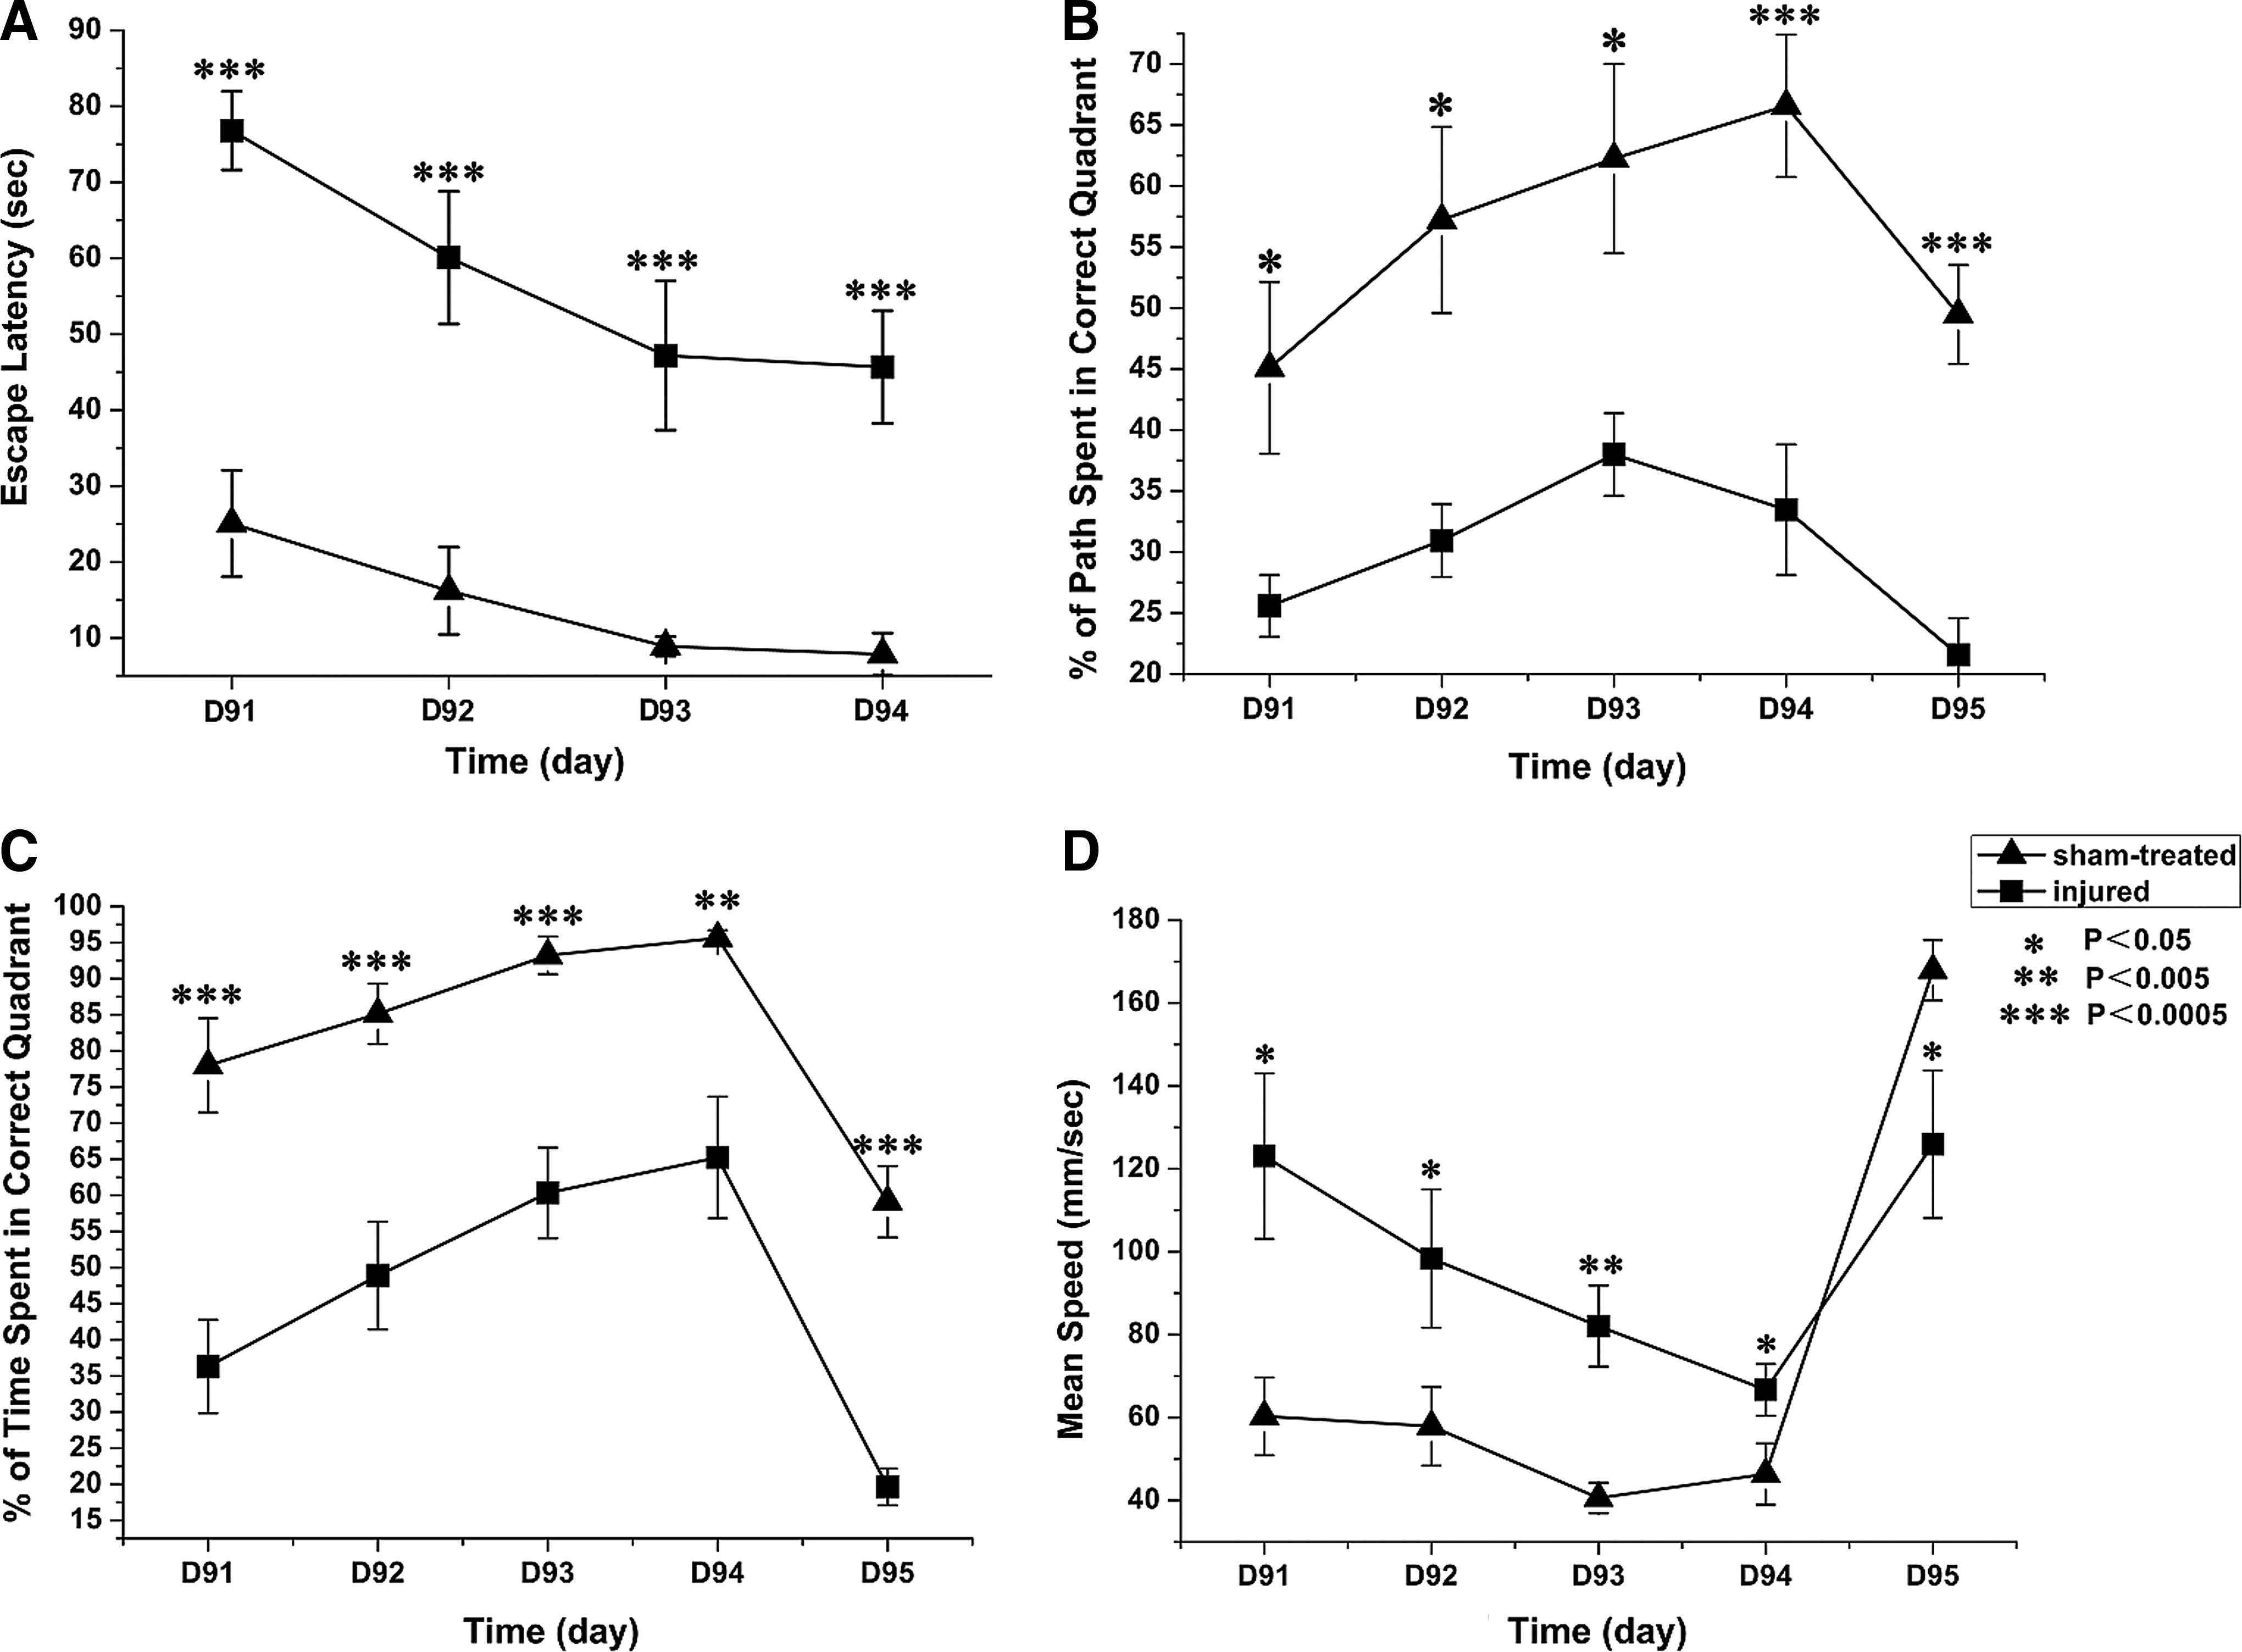
By 91–95 days after injury, the rats in the injured group still had significantly longer escape latencies and exhibited lower percentages of distance travelled and time spent in the correct quadrant (Fig. 3). Thus, learning and memory dysfunction of injured rats persisted through the end of the DAI recovery period.
Correlations between SUVs and MWM parameters
Correlations between SUVs in hippocampal ROIs at 1 and 3 days following injury, as well as MWM parameters at 1 and 3 months after injury were calculated using Spearman correlation tests (Fig. 4). SUV changes in hippocampal ROIs during the acute stage of injury were negatively correlated with the mean escape latency during the injury recovery stage (r=−0.87705, p<0.0001). SUV changes in hippocampal ROIs during the acute stage of injury were positively correlated with the mean percentage of swim distance (r=0.84848, p=0.0001) and the mean percentage of swim time (r=0.84261, p=0.0002) spent in the correct quadrant during the injury recovery stage. However, the SUV changes in hippocampal ROIs during the acute stage of injury did not significantly correlate with the mean speed during the injury recovery stage (r=0.15722, p=0.5914).

Discussion
This study demonstrated that microstructural injury induces extensive and severe hypometabolism acutely and persistent dysfunctions in learning and memory. In addition, hypometabolism in the hippocampus during the acute stage was significantly correlated with learning and memory dysfunctions during the recovery from DAI. By providing a scientific basis for decision-making in the clinic, the use of PET may facilitate the visualization and quantification of glucose uptake and guide the most effective therapeutic approaches in patients with DAI in the near future. 23
Unlike focal brain injury models, which produce a central contusion and axonal injury in the surrounding pericontusional area, 7,8 the animal model used in our study successfully induced axonal injury with a scattered, multifocal distribution on predilection sites similar to DAI patients. This model can therefore be extrapolated to clinical DAI patients and could provide a scientific basis for clinical diagnosis. 16,20 PET with FDG evaluates cerebral glucose metabolism and is considered to be the most reliable imaging modality because glucose is the primary fuel source under normal conditions in the adult. With the rapid development of high-resolution microPET scanners, microPET imaging in rodents has become an important tool for studying brain metabolism. However, PET is a functional imaging modality that lacks precise anatomical localization. Indeed, microPET/CT can be used to provide rough anatomical localizations, but this technique is limited by the partial volume effect. Exact ROI positioning in microPET/CT images in cerebral subregions of rats is almost impossible, which makes PET imaging results difficult to analyze. 24 Generally, there are several ways to fuse and analyze acquired morphological and functional image data. Very different modality images were fused by software and hardware. We co-registered microPET/CT and MRI using common medical image processing software, which greatly improved microPET image analysis. 24 PET-MRI fusion images can provide complementary or supplementary information on metabolic and anatomic changes; thus, the exact ROI location in the cerebral regions of the fusion image can be established. Changes in functional activity due to physiological and pathological challenges can also be readily measured.
The visual fusion is very time-consuming and the success in revealing additional information on the two independently acquired images depends very much on the experience and skill of the observer; thus it is still a challenge. 25 One reason for this is the question of whether the two imaging modalities can operate together without performance compromise and without mutual interference. 25 Firstly, the imaging of PET and MR is not simultaneously but sequentially acquired on separate scanners; there are always some mismatches and registration errors in fusion because of different positions for each scanner in one rat. 26,27 Secondly, artifacts caused by the breathing motion of rats or pulsation of the heart can significantly reduce image quality. 28 Thirdly, glucose was taken up in musculature and some adipose tissue from the rat cerebrum 29 ; this phenomenon also could be observed in a previous study. 30 Therefore, there seems to be some errors introduced in co-registration. In our study, particularly in days 1 and 3 after DAI, glucose hotspots were found in the musculature and some adipose tissue from the rat cerebrum. However, the error in co-registration could have affected estimations of regional SUVs. To make the SUVs based on ROI analysis as robust as possible (referred to the previous studies on manual ROI delineation 9,31 –33 ), we employed a quality control protocol when delineating ROIs. Certainly, to overcome the limitation radically, recent research concentrates on the combination of PET and MRI into one single machine. 29 In the future, we hope to employ an integrated PET/MRI system to provide anatomical and functional images simultaneously for small animals. The simultaneous acquisition of PET and MRI data is an advantage, not only because it reduces the total scan time, but also because it allows a temporal and spatial co-registration of PET and MR images.
In a previous study, Alkire and colleagues 34 found that during isoflurane anesthesia the cerebral metabolic rate was globally reduced by 46% at loss of consciousness. Similarly, cerebral glucose metabolism was found to be reduced 41% in the rat cortical regions under isoflurane anesthesia compared to an awake state. However, isoflurane produces cerebral vasodilatation or leaves the global cerebral blood flow essentially unaltered. 35,36 Because all the sham-treated rats and injured rats were performed PET/CT scans with isoflurane anesthesia, the influence of reduced cerebral glucose metabolism caused by isoflurane anesthesia will be eliminated in the time of statistical analysis.
The SUV is obtained semiquantitatively from a static scan, conducted 45 min post-injection. Dynamic PET imaging over 45 min of tracer uptake allows the use of a two-compartment model to derive multiple quantitative parameters, such as glucose metabolic rate estimated from FDG (MRFDG), glucose blood-to-tissue delivery, and FDG flux constant. 37,38 Clinicians most frequently quantify glucose metabolism from static images using the SUV despite known limitations, 39 –41 including the inability to separate background from cerebral activity. To be consistent with clinical application, we chose static scans for anesthetized rats, although the SUVs are reflective of glucose metabolism at rest. However, percentage changes in MRFDG and SUV between serial scans correlated with each other (r=0.84), 37 so the SUVs of static PET can correlate the activated brain during MWM activity, which may be better quantified from MRFDG of dynamic PET.
The cause of the hypometabolism resulting from DAI has not been elucidated. Some studies have shown that this hypometabolism may be associated with axonal degeneration and neuron loss in affected areas. 42 As a highly energy-consuming organ, the cerebrum is vulnerable to glucose and oxygen deprivation. Evidence indicates that a major determinant of the uptake of FDG is the activity of Na, K-ATPase, which consumes 50% of the total cerebral energy. Following the acute phase of DAI, the cerebral metabolic state is complex, dynamic, and regionally heterogeneous. 14 The activity of phosphofructokinase/hexokinase, which is the principal rate-limiting enzyme of glycolysis, is stimulated when ATP concentrations are low. 13,43 The initial brief response of hyperglycolysis has been seen predominantly adjacent to hemorrhagic lesions, possibly caused by the disruption of the blood brain barrier (BBB) and increased glucose uptake through a mechanism that bypasses endothelial membrane glucose transporters (this initial process was sustained for 3 h). 6 Decreased glucose utilization has been observed in pericontusional and remote (seemingly uninjured) areas. 44 This may be the result of limited transport of glucose across the BBB or reduced phosphorylation attributable to the loss of hexokinase activity. If this does result from limited glucose transport, it is possible that swollen mitochondria and glucose depletion in the brain lead to a reduction in mitochondrial oxidative phosphorylation and the rapid loss of high-energy phosphates, such as ATP. This would indicate that cerebral glucose deprivation (despite normal or elevated plasma glucose concentrations) plays a key role in the etiology of reduced cerebral metabolism. If the latter explanation holds, then hexokinase activity is the key determinant of glucose utilization in areas of apparently intact tissue, whereas transporter activity plays a role in limiting glucose utilization in injured tissue. 14 Limited transport of glucose would subsequently cause irreversible neuronal dysfunction. Therefore, the sustained imbalance between the reduced energy supply and the normal cellular energy demand triggers various cascades of metabolic disorder, which lead to irreversible secondary neuronal axotomy and soma death. 46 Functional or anatomical disconnect between deep brain regions and cerebral cortex, due to traumatic white matter damage in DAI, can cause an abrupt transfer of mechanical energy into the cerebral parenchyma. In turn, this leads to decreased neuronal activity and extensive glucose hypometabolism in the related gray matter, which results in the disruption of normal neurological function. 2,23 Therefore, the metabolism of glucose and mitochondrial oxygen is a centrally important cellular function that shows long-term alterations following DAI. 47
In our present and previous studies, MRI T2WI did not reveal focal structural damage in the hippocampus or the cortices in which hypometabolism was evident in the injured group as compared to the control group. However, our previous studies have demonstrated that white matter structures are more likely to be affected following DAI than gray matter structures. 16,20 Histopathological and diffusion tensor imaging studies have shown widespread axonotomy in cerebral white matter after DAI. 16,20 It is widely accepted that axons are not typically torn upon impact (i.e., primary axotomy); rather, secondary biochemical cascades including hyper- and hypoglycolysis, which occur in response to the primary injury and develop hours to days after the initial injury, are largely responsible for the secondary axotomy observed in DAI. 20 Axotomy can lead to downstream (anterograde) degeneration and deafferentation, as well as upstream (retrograde) neuronal injury. Therefore, widespread metabolic reductions in the corpus callosum, brain stem, and cerebellar medulla are due to neuronal injury, including loss of neurons or loss of receptors on dendrites or cell bodies. Deafferentation caused by the axotomy to the neurons that connect the cortex with gray matter nuclei of the bilateral hemisphere may result in bilateral metabolic reductions in these regions. The widespread metabolic reduction that occurs in the hippocampus, sensorimotor cortex, caudate putamen, and cerebellar cortex has been suggested to arise from the deafferentation of the neurons that connect the hypometabolic regions with myelinated regions of the cerebrum. 2 Thus, the dysfunction of the bilateral cortex and gray matter nuclei produced by axotomy may be the fundamental mechanism underlying the neuropsychologic deficits after DAI.
Regarding temporal changes in glucose utilization after DAI, our PET-MRI fusion images showed that hypoglycolysis in vulnerable areas did not recover to normal levels until 1 month after injury. Consisted with our results, metabolic reductions typically persisted for several weeks following both mild and severe TBI. 14,48 In previous reports, traumatic axonal injury studies in animals and patients reveal a well-defined triphasic pattern of the cerebral metabolic rate of glucose. 14,49 The initial brief response of hyperglycolysis (from hours to 5 days post-injury) is followed by a relatively prolonged period of metabolic depression, 14,49 –51 then followed by an uncoupling metabolic and neurological deficit recovery period. In the initial phase, uncoupling of local cerebral hyperglycolysis and depressed blood flow were observed after acute fluid percussion injury in rats; marked local cerebral-glucose metabolism to blood-flow ratio revealed striking elevations in ipsilateral hippocampus, neocortex, and contralaterally. 49,51,52 The loci of pronounced metabolism-flow dissociation corresponded closely to histological distribution of neuronal necrosis. 51
Generally, the cerebellum was used as a “reference” in the interpretation of functional imaging studies, owing to its relative metabolic homeostasis of glucose. 14,53 In a previous study, 54 diffuse brain injury, specifically diffuse axonal injury, did not appear to be associated with any noted cerebella hypometabolism. In fact, diffuse injury tended to “dilute” association of focal lesions with crossed cerebellar diaschisis, which was attributed to discrete and specific interruption of white matter communication between the area of primary injury and pontine nuclei. 54 –56 Because white matter fibers are diffusely damaged in DAI, no such discrete and specific interference can be expected. This particular aspect of the injury most likely occurred less, and it created a cerebella hypometabolism variance. Therefore, consistent with a previous study, 54 it is also difficult to see the SUV changes in the cerebellum in only one injury rat (Fig. 2). But, in our study, there definitely was a significant cerebella hypometabolism according to the statistical analysis (Table 1).
In addition to exploring the temporospatial changes in glucose utilization that occur after DAI, we also investigated the relationship between regional cerebral glucose metabolism and cognitive function. Cognitive deficits are believed to be connected to impairments of the hippocampal and neocortical cholinergic system. 57 –61 As shown in experiments in animals and post-mortem studies in humans, TBI is able to induce massive changes in cholinergic synthesis, storage, release, receptor binding, and neurotransmitter inactivation. Cholinergic neurons use acetyl-CoA not only for energy production but also for the synthesis of Ach; they have higher demands of energy and are therefore more sensitive to glucose deprivation. 62 The hippocampus is known to be important for memory formation and for learning processes, which require a neuron to translate a transient signal into gene expression changes that have long-lasting effects on synaptic activity and connectivity. 63 Therefore, it is now widely accepted that the primary role of the hippocampus is to form long-term memories and to facilitate the process of learning. This process requires a high degree of neuronal plasticity, including the capacity for life-long neurogenesis, which renders the hippocampus particularly vulnerable to many types of insults. 43 Our preliminary histopathological studies have shown that the hippocampus, cerebral cortical neurons, and nerve fibers exhibit different degrees of degeneration and necrosis, which provided a pathological basis for learning and memory dysfunction. 16,20 Previous investigations have demonstrated that basal forebrain cholinergic neurons play an important role in learning and memory process formation. These neurons have a wide range of underlying cholinergic nerve fibers and project to various regions of the cerebral cortex. 64 Rats with DAI demonstrated significant injury in cholinergic neurons of the abdomen basal forebrain, septum, and basal nuclei, along with significant impairments in spatial memory. 65 Following axonal injury, excitotoxicity has been observed, with high levels of glutamate leading to increased calcium influx. In turn, this results in apoptosis and necrosis of glutaminergic and cholinergic neurons in the hippocampus and impairments in spatial learning and memory, which can be evaluated by MWM test. 65,66
In the acute phase after TBI, cerebral glucose utilization is increased, 14,49 which could cause impairment of cholinergic cells. Cholinergic neurons use choline for cell membrane formation (as phosphatidylcholine) and for synthesis of Ach. During the initial phase of TBI, a constant depolarization of cholinergic neurons may cause autocannibalism, because the intracellular choline reservoir is depleted and phosphatydilcholine from cell membranes is broken up and used for Ach synthesis, 67 which can ultimately cause neuronal degradation. Therefore, between 24 h and 1 week post-injury, several studies found lower densities of cholinergic receptors compared to the control groups. 59,68,69 Studies found that apoptotic cholinergic neurons were identified as early as 24 h post-injury, peaked at 4–7 days, and then declined by 14 days, 64 but statistical significance was present at 10 and 14 days. 70 Time-dependent alterations of cholinergic system may be induced that learning and memory dysfunctions, which have not yet been established in the acute 7–11 days after injury in rats. In previous studies, at 3–6 days after injury, no changes in learning and memory dysfunction were observed. 71,72 Therefore, during the acute time after injury, the degree of the sensorimotor deficit, not the learning and memory dysfunction, was significantly correlated with the extent of the depression of glucose utilization in the cortical areas of the lesioned hemisphere. 71 Consistent with our study, 4 weeks post-injury learning and memory dysfunctions had been established in rats using the Morris Water Maze. 64
Our longitudinal results revealed the temporal pattern of learning and memory impairments that occur in DAI rats. Learning and memory dysfunctions did not appear in injured rats until approximately 1 month after injury. However, these impairments persisted into the DAI recovery period at 3 months post-injury. These results indicate that the learning and memory dysfunctions in rats with DAI are established gradually and continue until at least 3 months after injury. Sinson and colleagues 64 found that rats with DAI exhibit spatial memory impairments beginning 4 weeks after fluid percussion brain injury due to the sparing of cholinergic septal neurons. Schmidt and colleagues 73 reported that water maze learning in rats subjected to the moderate parasagittal fluid percussion injury model was severely impaired between 1 and 5 weeks, but water maze learning recovered to normal by 10 weeks. The spontaneous recovery of these WMW parameters at different time points may result from varying degrees of axonal injury. Our results indicate that the mean speed is highly heterogeneous, perhaps because the MWM is one of the most frequently used tests of learning and memory in animals and is relatively weak in regards to the assessment of motor function, as has been claimed previously. 17 In addition, our results support the hypothesis that MWM impairments are not due to difficulty in swimming because axonal-injured rats have been shown to swim faster than sham animals. 74 Our results demonstrated that hypometabolism in the hippocampus at the acute stage is significantly correlated with learning and memory dysfunctions observed during the recovery stage of DAI. Therefore, we propose that acute hippocampal hypoglycolysis following axonal injury can predict learning and memory dysfunction during the subsequent recovery stage of DAI.
There are several limitations of our study that should be mentioned. First, ROI analysis only lends itself to sampling a finite number of regions, and our findings should be confirmed in a larger group in the future. Nonetheless, we selected multiple predilection sites as ROIs that feature hypoglycolysis after DAI and employed a conservative approach to analyze the data to detect only robust effects in this study. Second, although ROI delineations were performed by a single observer in all of the measurements to minimize inter-observer variability, intra-observer error and partial volume effects can be introduced when placing ROIs in close proximity to the boundary of other cerebral subdomains. 9,32,75 In this study, we employed a quality control protocol to minimize uncertainty inherent in manual placement of ROIs. Moreover, the ICC of the hippocampal SUV was 0.93, and the CV was 2.5. Similar to a previous study, the intra-observer reliability (ICC≥0.90) and precision (CV≤3.5%) for ROIs in the hippocampus exhibited good reproducibility. 76 In additional, there is no reason to expect these errors would occur in a systematic manner that selectively affects one group, leading to false positive findings. Rather it is likely that small intra-observer errors would not mask real findings. 23 Thus, we believe that our findings represent a conservative measure of the extent of brain abnormalities that occur after DAI.
Conclusion
In conclusion, we validated a visualized, quantitative, and longitudinal PET-MRI fusion method in combination with MWM testing to assess the relationships between hypoglycolysis and persistent learning and memory dysfunctions induced by microstructural injury in a rat model of DAI at multiple predilection sites and time points following trauma. Interestingly, hypometabolism in the hippocampus during the acute stage of injury was significantly correlated with learning and memory dysfunction during DAI recovery. This observation may assist in evaluating parallel neuropsychological testing and rehabilitation, and it has promise for elucidating the mechanisms underlying learning and memory dysfunction. Further studies are required to validate the notion that metabolic alterations that occur rapidly in response to injury can predict functional recovery and treatment outcomes and may be helpful in determining the prognosis of patients.
Footnotes
Acknowledgments
This study was supported by grants from the Shanghai Committee of Science and Technology (No. 114119a8300), Baosan Science and Technology Development Fund (No. 11-E-1) and the Medicine-Engineering Combination Project of Shanghai Jiao Tong Universtiy (No. YG08PETMS19).
Author Disclosure Statement
No competing financial interests exist.