
Abstract
Blast waves generated by improvised explosive devices (IEDs) cause traumatic brain injury (TBI) in soldiers and civilians. In vivo animal models that use shock tubes are extensively used in laboratories to simulate field conditions, to identify mechanisms of injury, and to develop injury thresholds. In this article, we place rats in different locations along the length of the shock tube (i.e., inside, outside, and near the exit), to examine the role of animal placement location (APL) in the biomechanical load experienced by the animal. We found that the biomechanical load on the brain and internal organs in the thoracic cavity (lungs and heart) varied significantly depending on the APL. When the specimen is positioned outside, organs in the thoracic cavity experience a higher pressure for a longer duration, in contrast to APL inside the shock tube. This in turn will possibly alter the injury type, severity, and lethality. We found that the optimal APL is where the Friedlander waveform is first formed inside the shock tube. Once the optimal APL was determined, the effect of the incident blast intensity on the surface and intracranial pressure was measured and analyzed. Noticeably, surface and intracranial pressure increases linearly with the incident peak overpressures, though surface pressures are significantly higher than the other two. Further, we developed and validated an anatomically accurate finite element model of the rat head. With this model, we determined that the main pathway of pressure transmission to the brain was through the skull and not through the snout; however, the snout plays a secondary role in diffracting the incoming blast wave towards the skull.
Introduction
I
It is important that any experimental TBI model (in vivo or in vitro) satisfy the following criteria: (1) the biomechanical loading conditions (the injury cause) are replicated as accurately as possible; (2) the mechanical forces used to induce injury are controllable, quantifiable, and reproducible; (3) the inflicted injury is quantifiable and reproducible, and mimics the components of human conditions; (4) the injury outcome is free of any loading artifacts and is related to the mechanical force causing the injury; and (5) the intensity of the mechanical force used to inflict the injury should predict the outcome severity (Cernak, 2005). In order to fulfill these criteria, it is important to accurately reproduce field conditions (i.e., in our case, blast wave associated with an explosion). While blast explosions can result in primary (pure blast), secondary (interaction with shrapnel or fragments), tertiary (impact with environmental structures and head acceleration-deceleration; i.e., inertial effects), and quaternary (toxic gases) effects (DePalma et al., 2005; Moore et al., 2008), in this work, we focus on the consequences of primary blast. Further, we consider blast parameters that are likely to cause mild TBI. The IED detonation results in blast shockwave propagation, which subsequently interacts with the head and the body, causing a blast mild traumatic brain injury (bmTBI). We will refer to these blast waves traveling at supersonic speed with a shock front, followed by an exponential decay of the pressure-time profile, simply as blast waves, without the loss of generality. In an open free-field blast, at a distance from the explosion epicenter where bmTBI is the expected outcome, the blast wave adopts a planar form and is characterized as Friedlander wave (Fig. 1). Consequently, the Friedlander waveform is most commonly used for simulating blast conditions by researchers analyzing mTBI using shock tubes (Chavko et al., 2011; Bass et al., 2008). Although complex blast waves due to Mach stem effect; explosive casings; and reflections due to the ground, structure, or enclosure, are common in the theater of war, the Friedlander wave provides an idealized blast profile that can be used to understand the effects of various blast spectrum parameters on injury, and for comparisons among different models. Further, the results of these studies can be combined using the principle of superposition to study the effect of complex wave forms.

Mathematical representation of a planar Friedlander waveform. Instantaneous pressure p at time t is expressed in terms of po the peak overpressure, and td the positive phase time duration. The nonlinear decay is specified by the waveform parameter b. The area under the curve hatched with solid lines represents the positive phase impulse, and that shaded with dotted lines represents the negative impulse. The sharp rise from ambient pressure to peak overpressure po represents the shock front, and the nonlinear (exponential) decay is the blast wind. All pressures are gauge pressures (above atmosphere).
Although there are a number of researchers who have investigated blast TBI using animal models, we have noticed significant diversity among them (Table 1). There are no standardized methods to simulate field conditions (e.g., chemical explosives or shock tube design), location of the specimen, or the type of animal model employed. All these factors make the development of general bTBI theories extremely challenging. Considering the complexity of the variations in the test methodologies used, comparison of the results between different laboratories is virtually impossible.
Compression driven unless stated otherwise.
The goal of this work is threefold: (1) to understand the relationship between the animal placement location (APL) along the length of the shock tube and related biomechanical loading; (2) to evaluate the effect of the incident peak overpressure on the biomechanical loading (surface and intracranial overpressures) experienced by the animal; and (3) to identify the pathways of the major pressure transmission from the incident planar blast wave to the brain.
Methods
Shock tube experiments
The experiments were carried out in the 229×229-mm (9″×9″) cross-section shock tube designed and tested at the University of Nebraska–Lincoln's blast wave generation facility (Chandra et al., 2011). The three main components of the shock tube are the driver, transition, and straight/extension sections (includes the test section; Fig. 2). The driver section is filled with pressurized gas (helium), and separated from the transition by several Mylar membranes. The remaining sections contain air at atmospheric pressure and at room temperature. The transition section is an “adapter” for seamless circular-to-square cross-section conversion. The square cross-section is designed to facilitate observation and recording of specimen-blast wave interactions using high-speed video imaging (typically frame rates of 5000–10,000 frames per second are used). Upon membrane rupture a blast wave is generated, which expands through the transition and develops into a planar shock-blast waveform in the extension section. The test section is strategically located to expose specimens to the blast wave profile of interest (Friedlander in this case). The shock tube is designed and built to create a fully developed planar shock-blast wave in the test section, located approximately 2800 mm from the driver (the total length of the shock tube is 6000 mm; Chandra et al., 2011). The cross-sectional dimensions of the shock tube are designed such that the test specimen experiences a planar blast wave without significant side-wall reflections. The planarity of the blast wave is verified through blast wave arrival time measurements made along the cross-section of the test section of the shock tube (Kleinschmit, 2011). By varying the length of the breech (i.e., the driver section), and by varying the number of Mylar membranes, the blast parameters (overpressure, duration, and impulse) can be varied. This ability to vary blast parameters is important to replicate various field scenarios, and to study the effects of a blast spectrum on animal response.
Shock-blast wave generator at the University of Nebraska–Lincoln. (
Sample preparation and mounting
Approval from the University of Nebraska Lincoln's Institutional Animal Care and Use Committee was obtained prior to testing. All the animals were obtained from Charles River Laboratory and were housed in the same conditions. Five male Sprague-Dawley rats weighing 320–360 g were sacrificed by placing them in a carbon dioxide (CO2) chamber for approximately 5 minutes until all movements had ceased. The death of the animal was confirmed before the experiment by ensuring no reaction to a noxious stimulus. Immediately following sacrifice, a pressure sensor was placed on the nose, and two additional sensors were implanted in the thoracic cavity and in the brain, respectively. Figure 3 shows the approximate positions of these sensors. A surface mount Kulite sensor (Kulite, Basingstoke, U.K.; model no. LE-080-250A) was used on the nose, and two probe Kulite sensors (model no. XCL-072-500A) were used for the thoracic cavity and brain. Kulite probe sensors are 1.9 mm in diameter and 9.5 mm long. The brain sensor was inserted through the foramen magnum 4–5 mm into the brain tissue. Before inserting the sensor, the tip of the sensor was backfilled with water to ensure good contact with tissue. If the sensor tip contacts the air, the impedance mismatch between the brain tissue, air, and sensing membrane would cause inaccurate pressure measurements.
Location of surface/internal pressure sensors on the rat model. The external surface pressure gauge on the nose measures reflected pressure (actual pressure that loads the animal). The internal pressure probes in the head and the lungs measure intracranial and thoracic pressures, respectively. Pressure is measured as a function of time.
An aluminum bed was designed and fabricated for holding the rat during the application of blast waves. The aerodynamic riser is attached to the bed to hold the sample away from the surface of the shock tube. Figure 4(a) shows the placement of rat on the aluminum bed. Each rat was in the prone position and strapped securely against the bed by a thin cotton cloth wrapped around the body.
(
Blast wave exposure
All rats were exposed to the blast wave at four different APLs along the length of the shock tube. These APLs are: (a) the test section located 3050 mm inside from the exit (open end); (b) 610 mm inside from the exit; (c) at the open end of the shock tube; and (d) 152 mm outside the exit (Fig. 4b). Control over burst and incident pressure is achieved by adjusting the number of Mylar membranes. At APL (a), the rats were tested at different average incident overpressures of 100, 150, 200, and 225 kPa, with Mylar membranes thicknesses of 0.02, 0.03, 0.04, and 0.05 inch, respectively. At APL (b), (c), and (d), the peak incident pressure was set at 125 kPa. This pressure was achieved with 0.03 inch membrane thickness in the case of (b), and with membrane thickness of 0.034 inch for (c) and (d). For each pressure level, the experiment was repeated three times (n=3). High-speed video was recorded at APLs (a) and (c) to detail the motion of the rat, which was not constrained to the rat bed.
Numerical modeling
Finite element (FE) discretization
The finite element (FE) modeling technique is used to simulate the propagation of the planar blast wave through the shock tube, the interaction between the blast wave and rat head, and the response of the rat head/brain to such loading.
A three-dimensional rat head model was generated from the combined use of high-resolution MRI and CT datasets of a male Sprague-Dawley rat. This technique has already been used to develop a realistic human head model from a series of MRI/CT images (Ganpule et al., 2011), and to develop a two-dimensional model of rat brain (Peña et al., 2005). Two different T2-weighted MRI scans (one for the muscle skin and the other for the brain), and one CT scan (for the skull and the bones) were used. These three different scans were necessary to achieve proper contrast and segmentation of various tissues (i.e., muscle, skin, brain, skull, and bones). The brain MRI has an isotropic resolution of 256×256×256 pixels, for a field of view of 30 mm in all three directions. The MRI for muscle and skin has an anisotropic resolution, with a pixel size of 512×512×256, for a field of view of 30, 30, and 50 mm, respectively. The three datasets were overlapped, registered, segmented, and triangulated using Avizo 6.2® software. The triangulated mesh (i.e., surface mesh) is imported into HyperMesh® meshing software, and a volume mesh with 10 noded tetrahedron elements is generated from this surface mesh. The skull, skin, and brain share the node across the interface. These elements are treated as Lagrangian elements. The model was then imported into the finite element software Abaqus® 6.10, and the rat model was inserted in the shock tube model.
The generation and propagation of blast waves are modeled in the shock tube environment. The air inside the shock tube in which the blast wave propagates is modeled with Eulerian elements (Fig. 5). The size of the Eulerian domain corresponds to the physical dimensions of the shock tube used in the experiments (cross-section: 229×229 mm). A biased meshing approach was adopted, with fine mesh near the region of the rat head, and coarse mesh elsewhere, to reduce the total number of elements in the model without sacrificing accuracy. To further understand flow field at the exit of the shock tube, an additional FE model with shock tube and an outside environment was used. The main purpose of this model is to understand flow mechanics once the blast wave exits the shock tube.
(
Material models
Skin and skull are modeled as a homogenous linear elastic isotropic material with properties adopted from the literature (Willinger et al., 1999). Brain tissue is modeled as elastic volumetric response and viscoelastic shear response with properties adopted from the work of Zhang and associates (2001). Air is modeled as an ideal gas equation of state (EOS). The Mach number of the shock front calculated from our experiments is approximately 1.4, and hence the ideal gas EOS assumption is acceptable; the ratio of specific heats does not change drastically at this Mach number value. The material properties along with longitudinal wave speeds are summarized in Table 2.
Solution scheme
The FE model is solved using the nonlinear transient dynamic procedure with the Euler-Lagrangian coupling method (Abaqus 6.10). In this procedure, the governing partial differential equations for the conservation of mass, momentum, and energy, along with the material constitutive equations and corresponding equations defining the initial and boundary conditions, are solved simultaneously. The Eulerian framework allows the modeling of highly dynamic events (e.g., shock) which would otherwise induce heavy mesh distortion. An enhanced immersed boundary method was used to provide the coupling between the Eulerian and the Lagrangian domains.
Loading and boundary conditions
The experimental pressure boundary condition (i.e., experimentally measured pressure-time [p-t] profile) was used as an input for the FE simulation. The velocity perpendicular to all other remaining faces of the shock tube is kept at zero to avoid escaping (leaking) of the air through these faces. This will maintain a planar shock front traveling in the longitudinal direction with no lateral flow. The displacement of the nodes on the bottom and rear faces of the rat head is constrained in all degrees of freedom [Fig. 5(b)].
Results
Role of the APL in biomechanical loading
Figure 6 shows incident pressure, and pressure in the brain and thoracic cavity, corresponding to various locations along the length of the shock tube. At APLs (a) and (b), incident pressure profiles follow the Friedlander waveform (Fig. 1) fairly well. Pressure profiles in the brain and thoracic cavity also have similar profiles (the shape is almost identical) to that of the incident pressure profiles. At these locations, peak pressures recorded in the brain are higher than the incident peak pressure, and the peak pressure recorded in the thoracic cavity is equivalent to the incident peak pressure. It is clear from the figures that at APL (c) the incident pressure profile differs significantly from the ideal Friedlander waveform; the overpressure decay is rapid and the positive phase duration is reduced from 5 msec at APL (a) to 2 msec at APL (c) [Fig. 6(a) and (c), respectively]. The pressure profile in the brain shows a similar trend. The pressure profile in the thoracic cavity shows a secondary loading with higher pressure and longer duration. The pressure profile in APL (d) is similar to the pressure profile recorded in APL (c), except the value of the peak pressure reported in the brain is lower than the incident peak pressure.
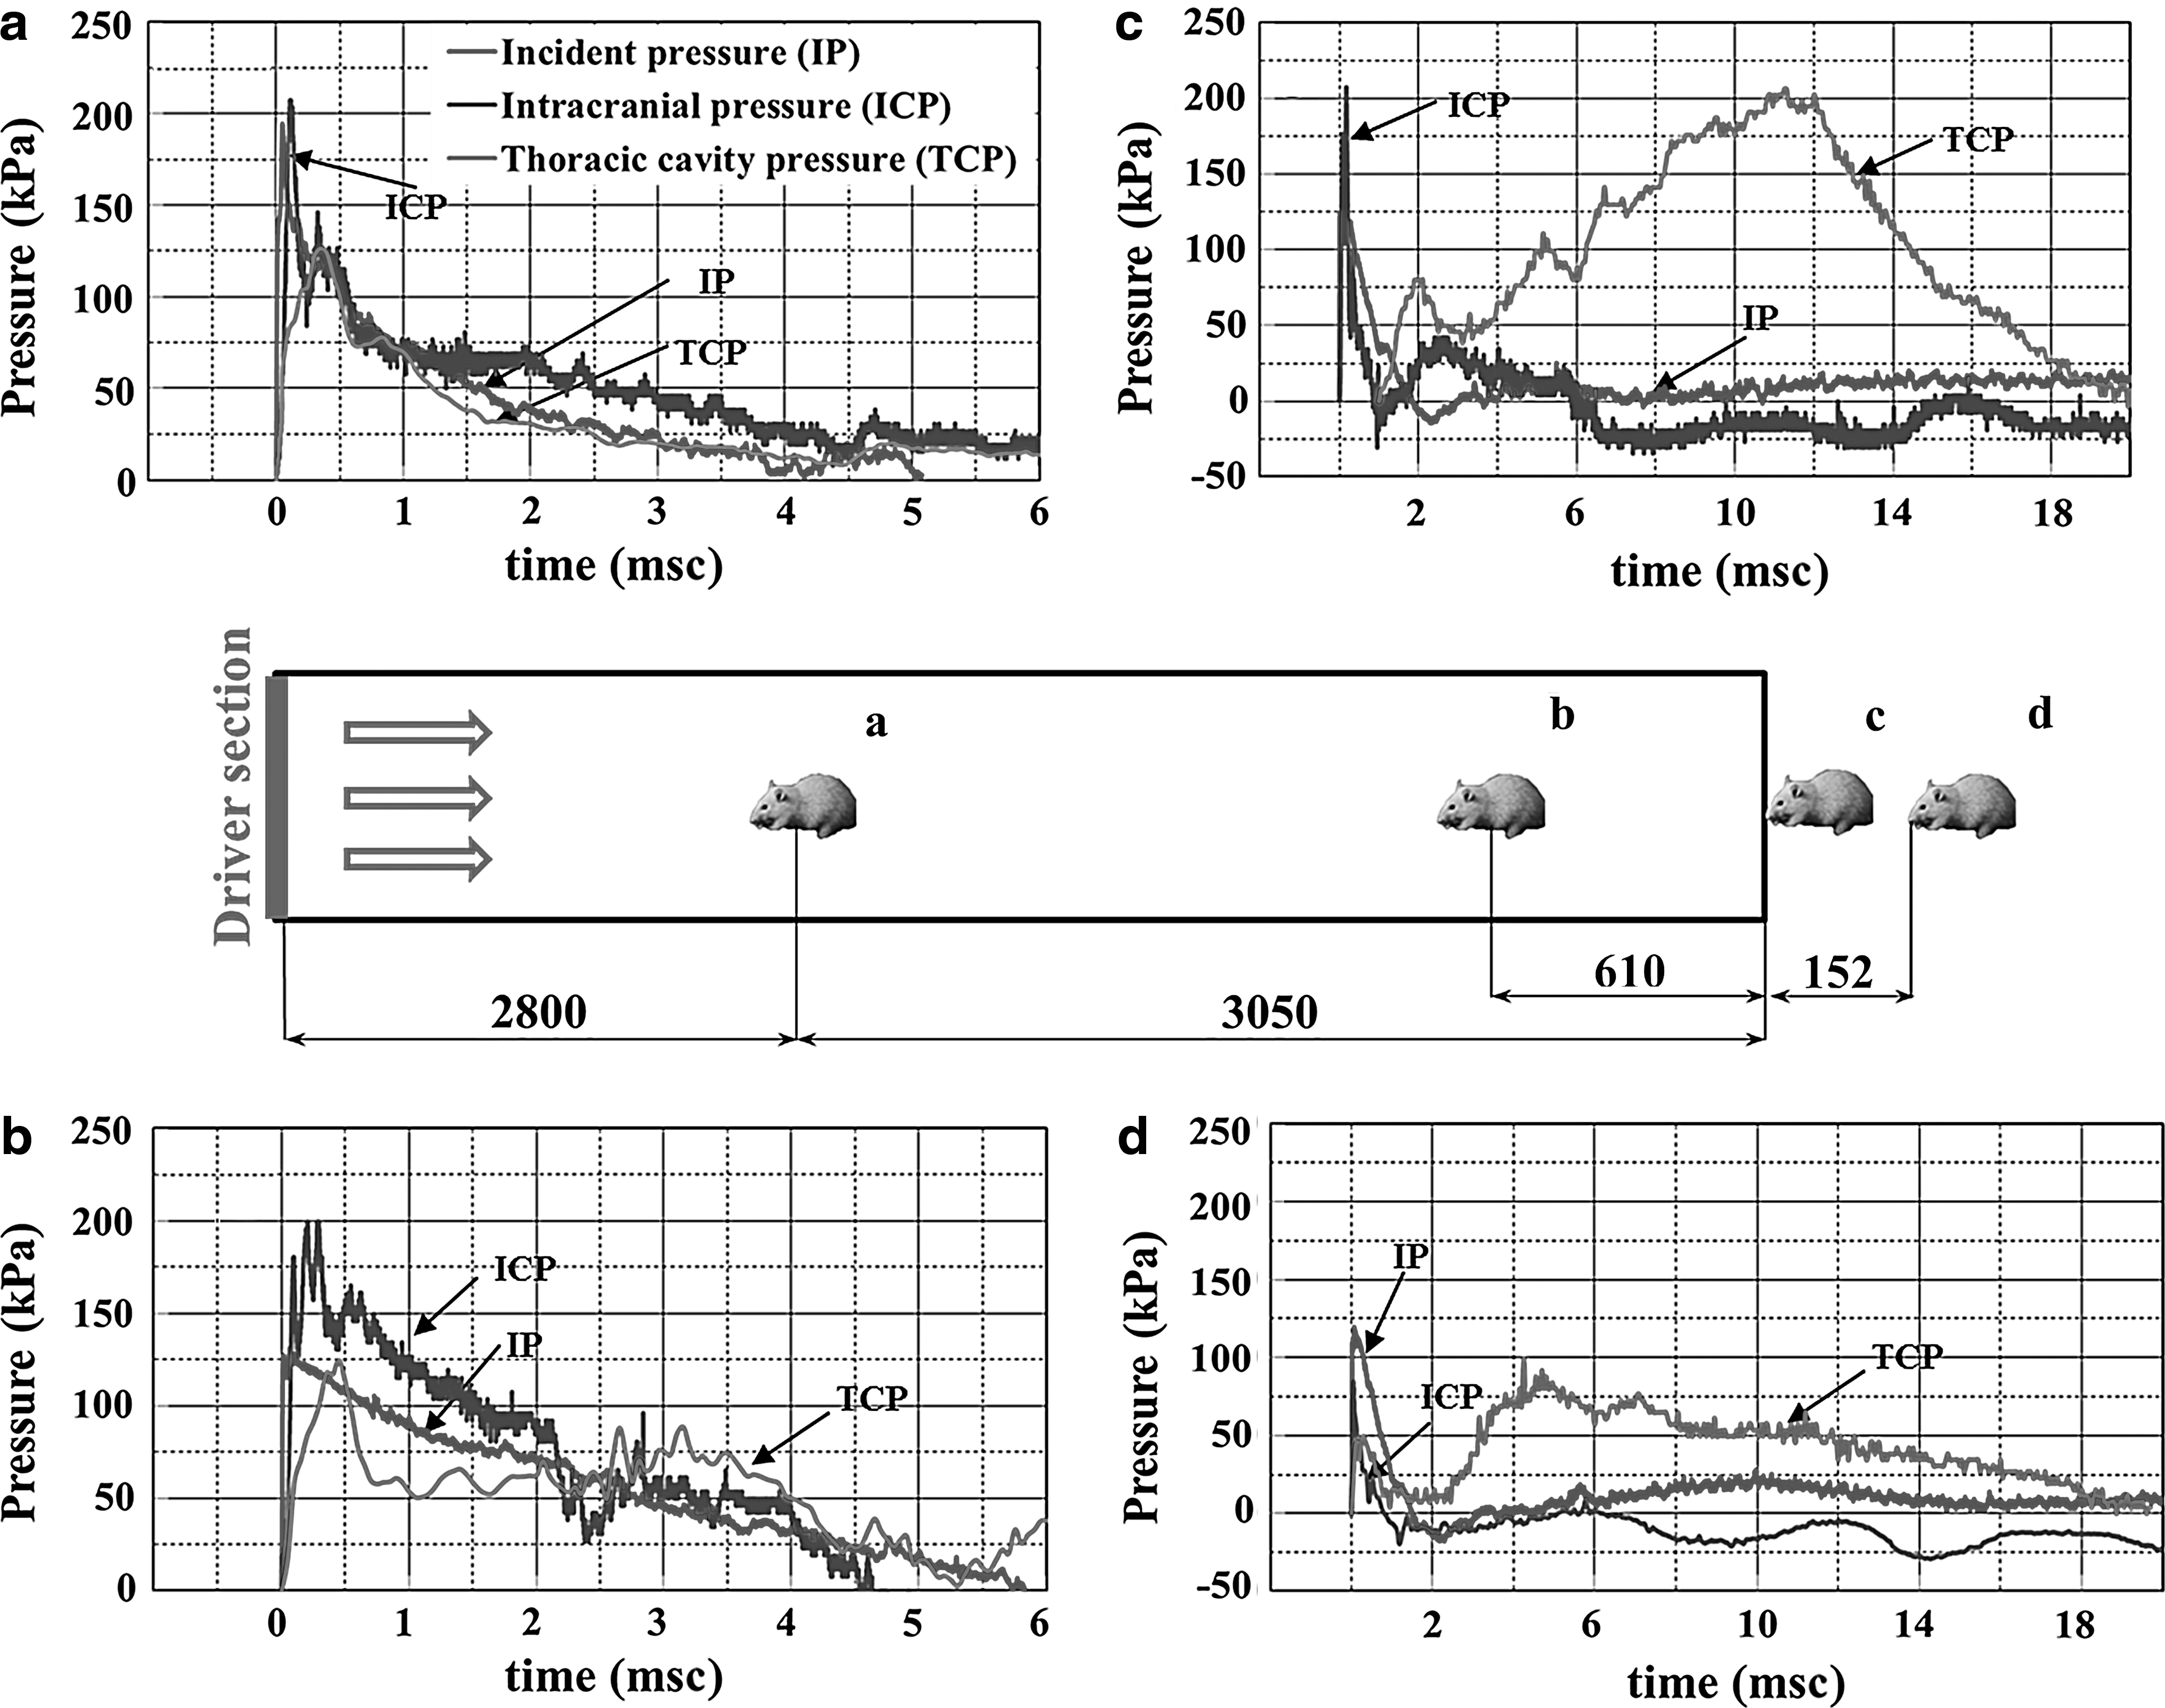
Measured pressure-time profile in the brain and thoracic cavity with their corresponding incident pressures at all APLs. At APL (
Role of incident blast intensity on biomechanical loading
Figure 7 shows the plot of peak incident pressure versus peak pressure on the surface of the rat (nose), and peak incident pressure versus peak pressure in the brain (intracranial pressure, ICP). The data points are based on testing at APL (a). Both surface and ICP are linear functions of the incident pressure.
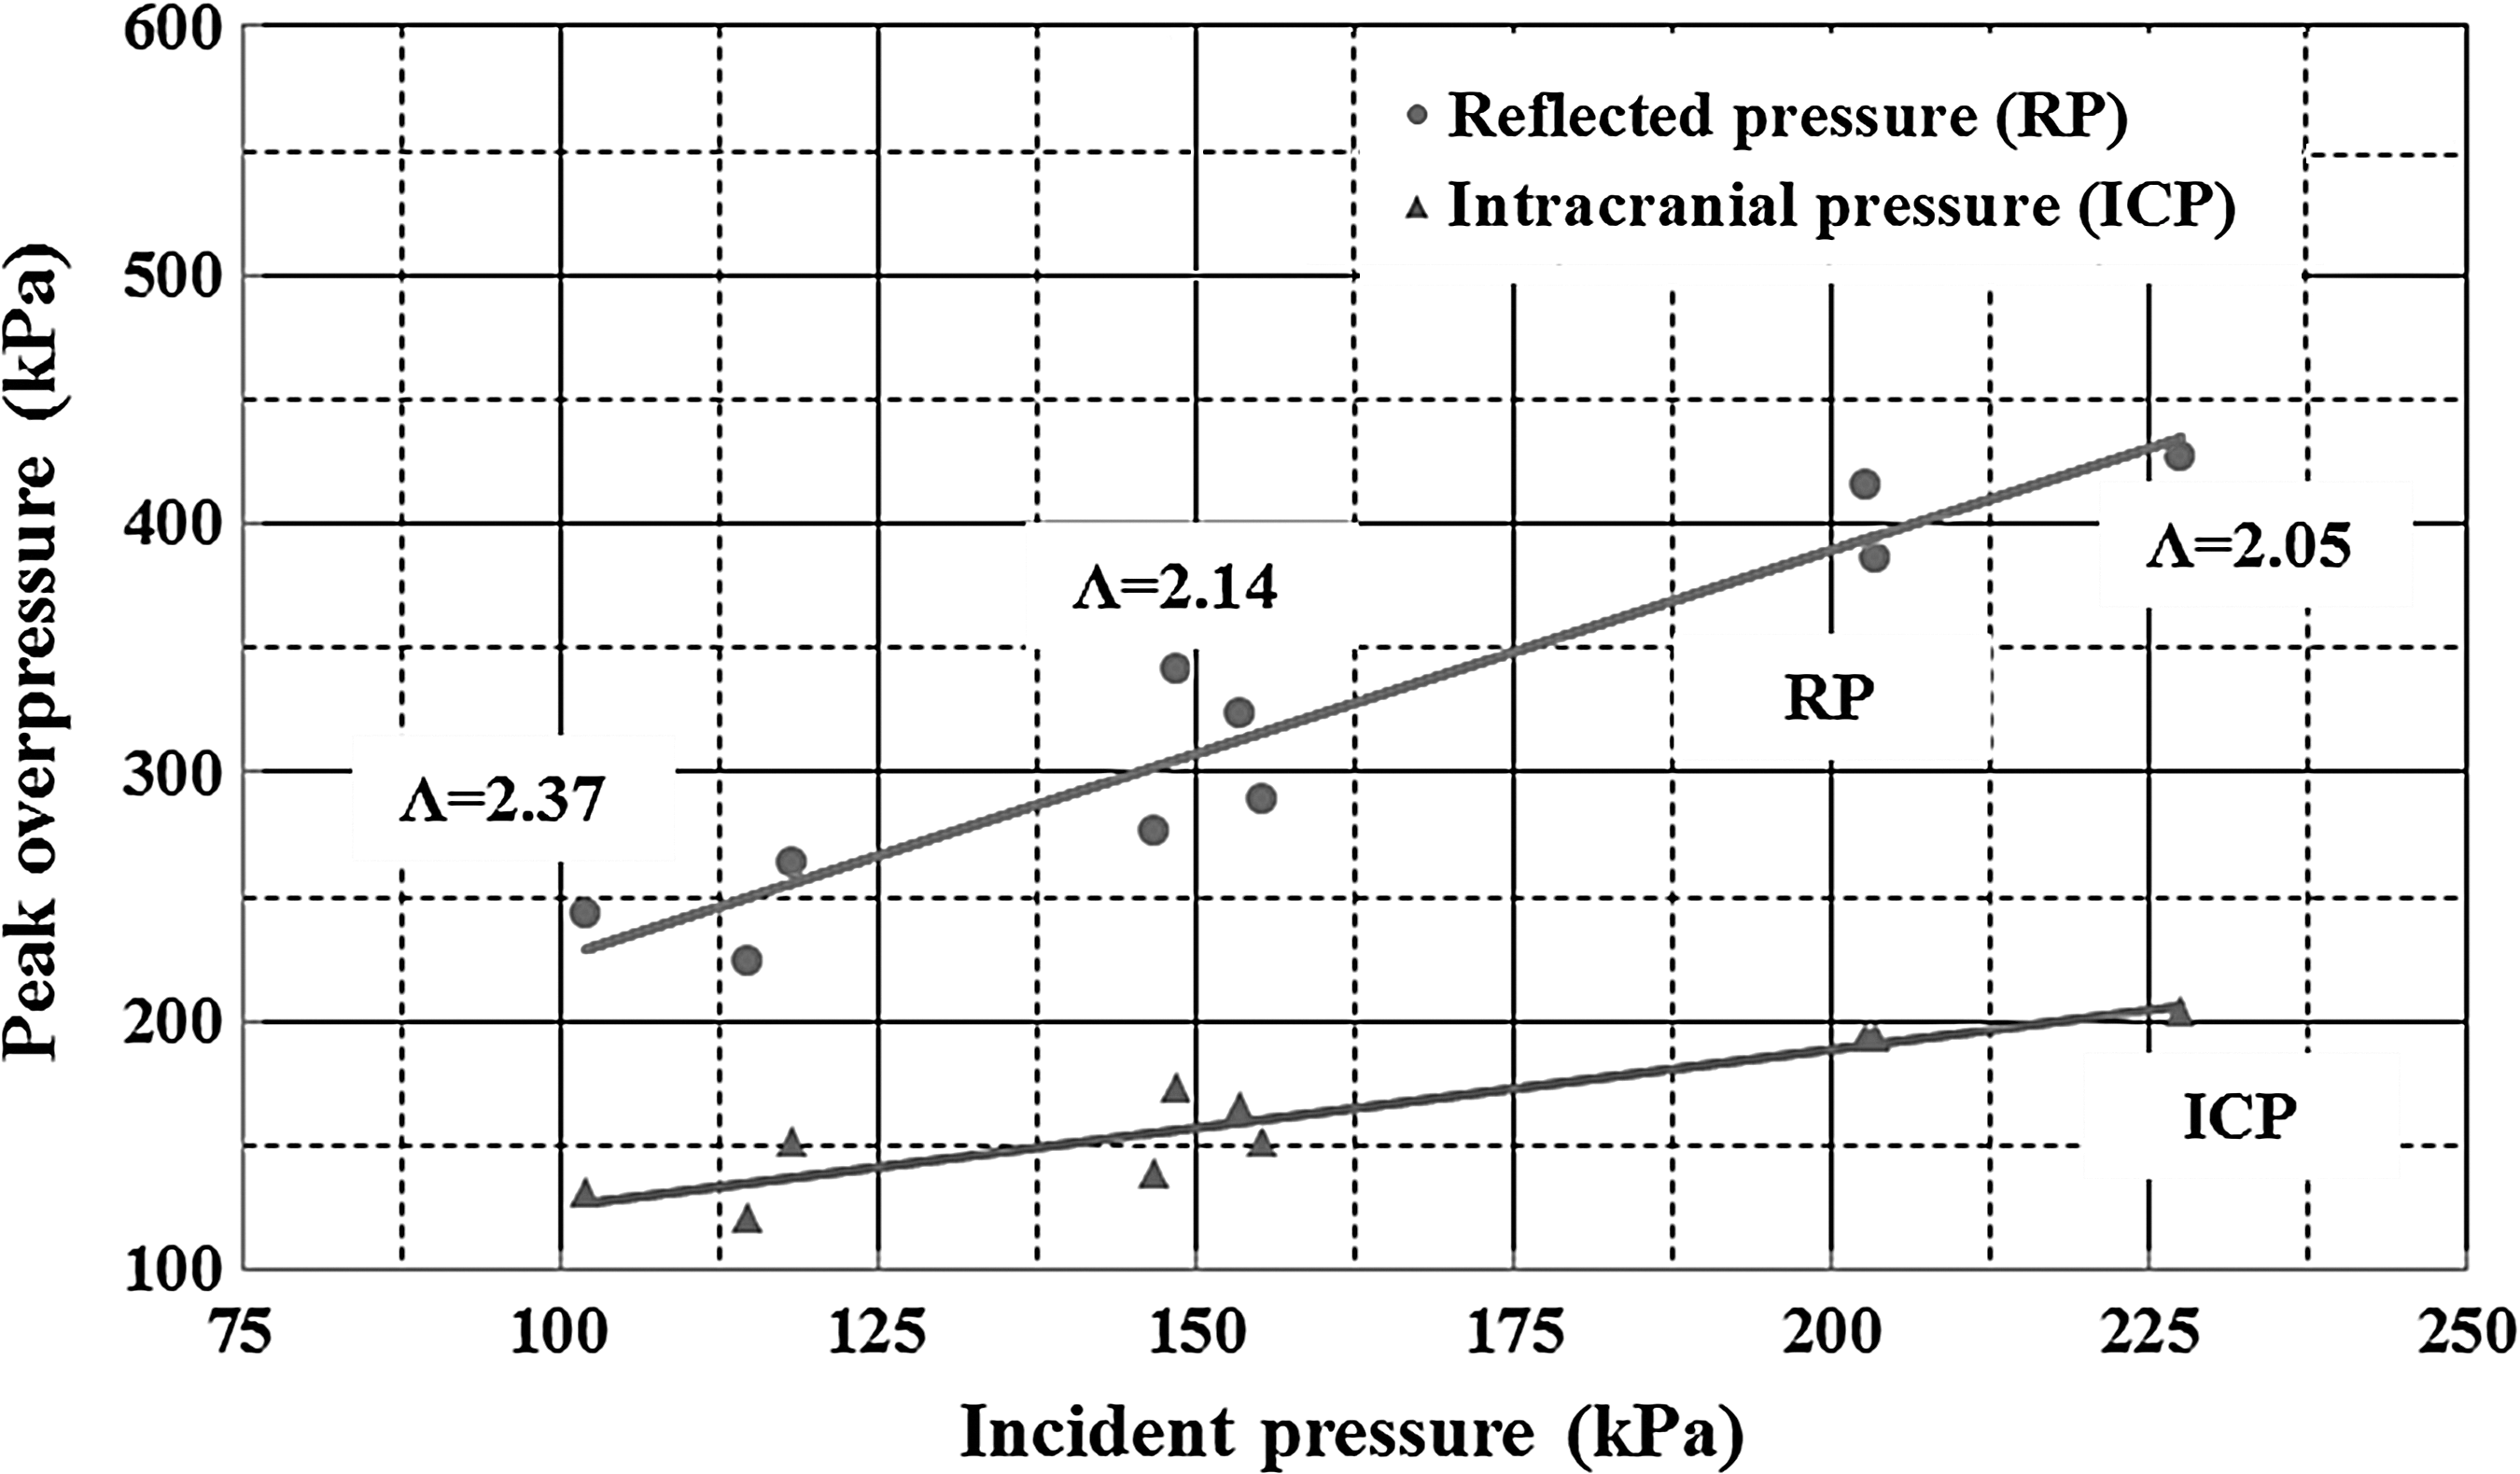
Variations of reflected pressure (RP) and intracranial pressure (ICP) with respect to four incident pressures (IP): 100, 150, 200, and 225 kPa at APL (a). Λ represents the ratio of reflected pressures to incident pressures.
Validation of finite element model
We used the finite element numerical model to get insight into flow dynamics around the rat, and to identify wave transmission pathways to the brain. We found that at APL (a), optimized loading conditions in the shock tube exist. Consequently, in the finite element model APL (a) was preferred to perform the extended sets of finite element simulations. Before we use this finite element model to make predictions it is necessary to validate the model against experimental data. Figure 8 (a), (b), (c), and (d), show comparison of p-t profiles for the nose and the brain sensors at APL (a) and (c), respectively. There is good agreement between the experiment and finite element simulation at two different APL. Hence the model can be used as a predictive tool for understanding the loading pathways at APL (a).

Comparison between experiments and numerical models both inside and outside the shock tube. (
Wave transmission pathways
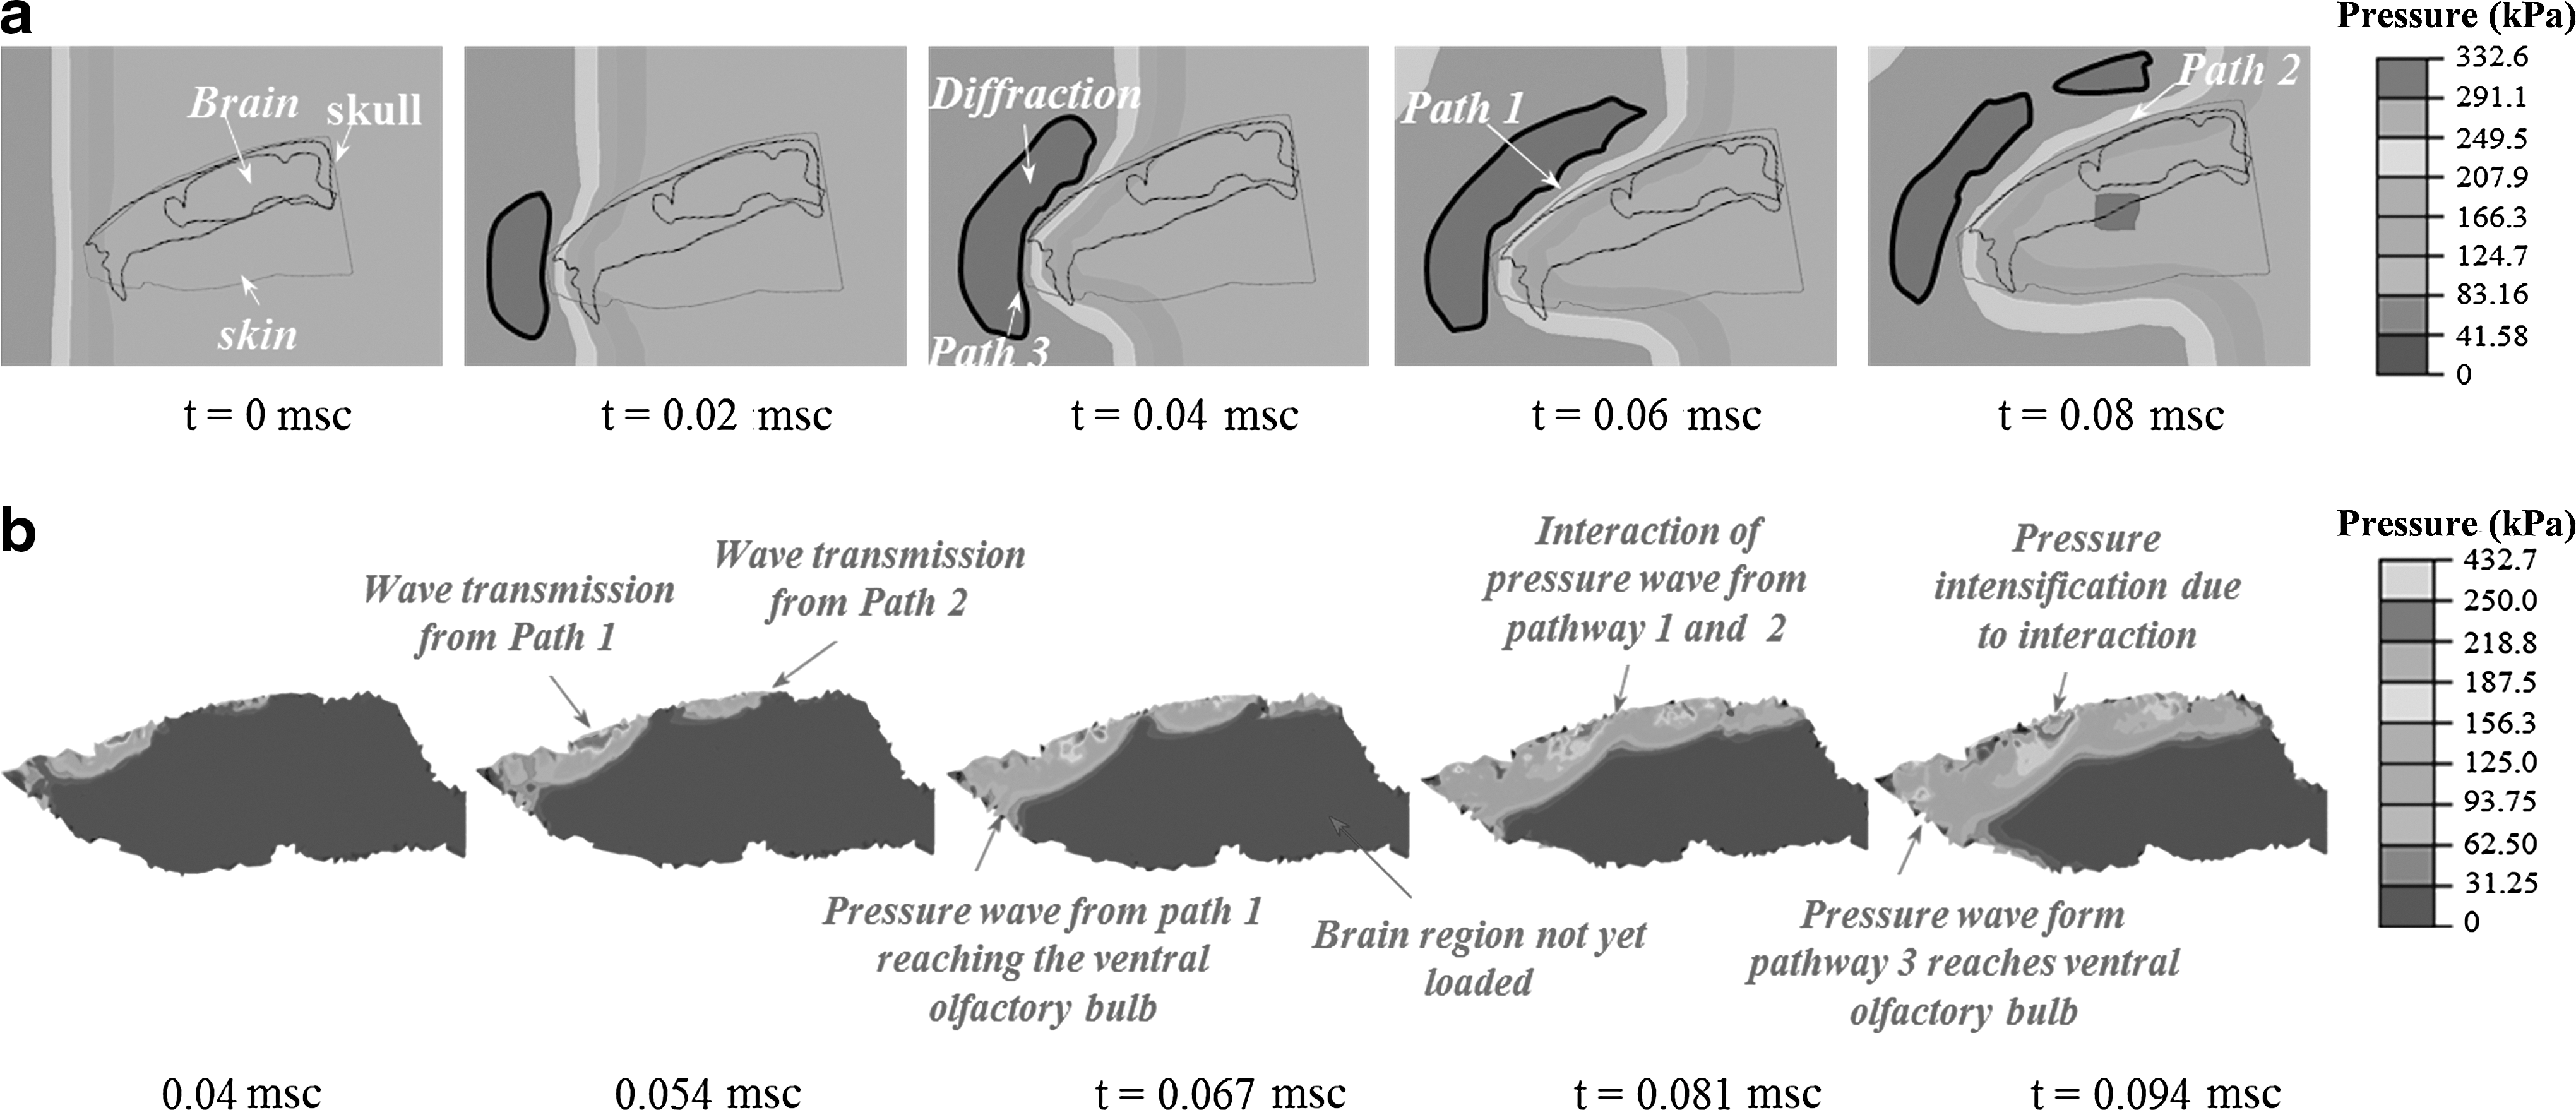
Figure 9 (a) and (b) show the pressure contour plots on the surface, around, and inside the brain of the rat. As the blast wave impinges on the rat, the blast wave first interacts with the snout and undergoes diffraction, where it bends and converges towards the eye socket (pathway 1), and top of the skull [pathway 2; Fig. 9(a)]. The surface pressure loadings along pathway 1 and pathway 2 are transmitted to the rat brain as depicted in Figure 9(b). These transmitted waves start moving into the rat brain, and at the same time converge towards each other. The loading through the snout (pathway 3) does not reach the brain before the transmitted pressure waves from pathways 1 and 2 completely load the brain.
(
Discussion
Distinguishing and reproducing field conditions resulting from a military explosion in battle is an important TBI research challenge. It is believed that blast wave interactions with the body causing mild and moderate bTBI occur in the far field range, where the blast wave is planar and characterized by a Friedlander wave. In this scenario, an injury is governed by three key parameters: (1) peak overpressure, (2) the overpressure (positive phase) duration, and (3) positive phase impulse (the integral of overpressure in the time domain). A fourth parameter, under-pressure, is sometimes considered to be important and is believed to cause cavitation in the brain, though this has yet to be verified.
It has been reported that input biomechanical loading experienced by the animal determines both the injury and mortality (Long et al., 2009; Svetlov et al., 2010). Thus it is significant in the study of mild and moderate TBI to reproduce these far field conditions as accurately as possible without any other artifacts. In this work the response of the animal at various APLs along the length of the shock tube was studied to understand the role of this key parameter on injury type, severity, and lethality. Once the optimal APL is determined, parametric studies are conducted to understand the effect of incident blast overpressures on surface and ICP; validated numerical models are then used to determine critical loading pathways.
The biomechanical response of the animal significantly varies with the placement location. For APLs inside the shock tube [i.e., (a) and (b) in Fig. 6] the load is due to the pure blast wave, which is evident from the p-t profiles (Friedlander type) recorded in the thoracic cavity and brain. For APLs at the exit (c) and (d), p-t profiles show a sharp decay in pressure after the initial shock front. This decay is due to the expansion wave from the exit of the shock tube eliminating the exponentially decaying blast wave, which occurs in APL (a) and (b). This has two consequences: first, the positive blast impulse (area under the curve) decreases drastically. Second, since the total energy at the exit is conserved, most of the blast energy is converted from supersonic blast wave to subsonic jet wind (Haselbacher et al., 2007). This expansion of blast wave at the exit (subsonic jet) produces entirely different biomechanical loading effects compared to the blast wave. Consequently, the thoracic cavity experiences secondary loading (i.e., higher pressure and longer positive phase duration). When the animal is constrained on the bed, this high-velocity subsonic jet wind exerts severe compression on the tissues in the frontal area (head and neck), which in turn causes a pressure increase in the thoracic cavity (lungs and heart). To further illustrate the effect of subsonic jet wind on the rat, experiments at APLs (a) and (c), without any constraint, were performed. Figure 10 shows the displacement (motion) of the rat at various time points starting the moment the blast wave interacts with the animal. At APL (a), the displacement is minimal; however, at APL (c) the rat is tossed away from the bed (motion) due to jet wind. This clearly illustrates the effect of high velocity subsonic jet wind on the rat when placed outside the shock tube. Consequently, the animal is subjected to extreme compression loading when constrained, and subjected to high-velocity (subsonic) wind when free, both of which are not typical of an IED blast. This in turn changes not only the injury type (e.g., brain versus lung injury), but also the injury severity, outcome (e.g., alive versus dead), and mechanism (e.g., stress wave versus acceleration). Svetlov and associates exposed the rats to blast loading by placing the rats 50 mm outside the shock tube (Svetlov et al., 2010). They found that the subsonic jet wind represented the bulk of the blast impulse. They concluded that the rat was injured due to the combination of blast wave and subsonic jet wind, as opposed to a pure blast wave injury. Similar subsonic jet wind effects were reported by Desmoulin and colleagues, during their experiments on dummy heads placed at the exit of the shock tube (Desmoulin and Dionne, 2009). Long and co-workers studied the effects of Kevlar protective vests on acute mortality in rats. In their experiments all rats (with or without vests) were placed in a transverse prone position in a holder secured near the exit of the shock tube, and exposed to 126- and 147-kPa overpressures. The Kevlar vest was completely wrapped around the rat's thorax, leaving the head fully exposed. They found a significant increase in survival (i.e., decrease in mortality) for the rat with a protected body. However, without armor only 62.5% and 36.36% rats survived at 126 and 147 kPa, respectively. This indicates that the lung/thorax experiences significant pressure loads, and that mortality is higher near the exit of the shock tube. In a separate study performed in our laboratory (those results are being separately reported), to determine mortality as a function of incident pressures, we found that when experiments were performed inside the shock tube at APL (a), the rats survive much higher peak overpressures than those reported by the Long group in their experiments performed outside the tube. Further, the cause of death in our case appears not to arise from lung injuries. In order to better explain flow dynamics effects at the exit of the shock tube numerical simulations were carried out. Figure 11 shows velocity fields at the exit of the shock tube. No sample (no rat model) is considered in the numerical simulations to demonstrate the 3D nature of the flow field once the blast wave exits the open end of the shock tube. As the constrained planar blast wave exits the open end of the shock tube, it is fully unconstrained, producing a series of fast-travelling rarefaction waves (expansion waves) from the edges and vorticities (low-pressure regions). These rarefaction waves travel faster than the shock front. The blast wave is nullified, and the remaining flow is ejected as subsonic jet winds. Similar effects at the exit of the shock tube are reported by the various researchers through experiments and numerical simulations (Chang and Kim, 1995; Haselbacher et al., 2007; Honma et al., 2003; Jiang et al., 1999,1998). Due to the spatiotemporal evolution of the blast wave from planar to three-dimensional spherical, the blast wave pressure and impulse are reduced drastically as it moves away from the exit of the shock tube.

Motion of unconstrained rat under blast wave loading (a) inside, and (c) outside the tube. Images (

Velocity vector field near the exit of the shock tube. Jet wind is clearly visible in the velocity vector field along with the initial shock front.
Another aspect of this work is to understand the relation between incident, surface, and ICP at various incident blast intensities at APL (a), an optimal location for such testing. The term “optimal” is used in a very limited sense in this work. As the shock wave propagates from the driver, the peak overpressure continues to decrease and loses total energy due to the tensile (release) waves from the driver. There is a point along the length of the tube where the peak pressure is maximum, and downstream of this point the peak overpressure drops; for this reason the location where the peak overpressure is maximal is termed the optimal location.
We found that both surface pressure and ICP increases linearly with the incident pressure, and both these pressures have higher magnitude than the incident pressure. Pressure amplification is attributed to aerodynamic effects. When the blast wave encounters a solid surface, the incident pressure is amplified, as the high-velocity particles of the shock front are brought to rest abruptly, leading to a reflected pressure on the surface of the body. The amplification factor (the ratio of reflected pressure to incident pressure) depends on the incident blast intensity, angle of incidence, mass and geometry of the object, and the boundary conditions, and can vary by a factor of 2 to 8 for air shocks (Fig. 7; Anderson, 2001; Ganpule et al., 2011). This surface pressure is transmitted to the brain through the meninges and the cranium. A few studies have compared the pressures in the brain to incident pressures (Bolander et al., 2011; Leonardi et al., 2011; Chavko et al., 2007,2011). They find that ICP is higher than the incident pressure. This is true even in our experiments. However, this increase in ICP compared to the incident pressures should not lead one to the false conclusion that the pressure increases as it traverses from outside to the brain. It should be noted that due to the mechanics of the blast wave-structure interaction, the surface (reflected pressure) is always higher than the incident pressure by a large factor (typically 2 to 3, although it can reach up to 8); this pressure actually drops from this higher value to a value possibly more than that of the incident pressure. Thus ICP should be compared to the surface (reflected) pressure
There are some limitations of the current study. In this work only prone position with head and body oriented along the direction of shock wave propagation (perpendicular to the shock front) is considered, which is the most commonly used orientation in current animal model studies with shock tubes (Bolander et al., 2011; Leonardi et al., 2011; Saljo et al., 2010; Zhu et al., 2010). Recently Ahlers and associates studied the effect of orientation (side and frontal) on behavioral outcomes in the rat. They concluded that low-intensity blast exposure produced an impairment of spatial memory that was specific to the orientation of the animal (Ahlers et al., 2012). In order to extend our results in this way, the effects of differing animal orientations at different APLs need to be studied separately. We hypothesized that the loading pathways are likely to be different when orientations (e.g., supine versus prone) are varied.
Also, euthanized animals were used in our experiments. From the tests performed at different post-euthanization time points, it was found that there was no significant variation in the recorded pressures in the brain and lungs. Euthanized rats were also used by Bolander and colleagues to record strains on the skull during blast wave interactions (Bolander et al., 2011). Though acute mechanical loads may not be affected for dead versus live animals, the chronic biochemical sequelae would be expected to be different.
Negative pressures (under-pressure) in the p-t profile were not included in the study; however, we believe negative pressures may play a key role in cavitation behavior, and are among the possible mechanisms currently being explored (Moore et al., 2008).
Finally, although recording acceleration of the rat to study the dynamic effects might yield useful insights, it was not done in this study; however, the authors propose to do this in a future study.
Conclusions
The effect of animal placement location on the biomechanical loading experienced by the animal is a critical issue that it is not well understood. From the current literature it is apparent that different locations inside and outside the shock tube can be used to induce injury to the animal. However, depending on the location, the biomechanical loading experienced by the animal varies, and hence its injury type, severity, and lethality, may vary as well. It is critical to characterize and understand the biomechanical loading experienced by the animal at different locations along the tube in order to recreate field-loading conditions in these animal models. In this work, rats were placed at four different locations along the length of the shock tube to mimic the various options used by other investigators. It was found that the biomechanical response of the rat varied significantly at these differing placement locations. Among these locations, the optimal placement location was identified for blast-induced neurotrauma studies, which was well inside the tube, where a fully-developed Friedlander wave is first encountered. The optimal location was chosen to study the relationship between incident peak overpressure, and surface and ICP. Moreover, the anatomically accurate finite element model allowed for the detection of pressure transmission pathways to the brain. Some of the key findings of this work include the following. (1) Animal placement location plays an important role in the biomechanical loading experienced by the animal. (2) Friedlander waves implicated in TBI are best replicated inside the shock tube. Thus for animal placement locations deep inside the shock tube, the load experienced by the animal is purely due to the blast wave, and is not influenced by the three-dimensional nature of the events occurring at the exit of the shock tube. (3) Near and outside the exit of the shock tube, an expansion wave significantly degrades the blast wave profile, and the remaining flow is ejected as a subsonic jet winds. Thus the loading experienced by the animal is mainly non-blast jet-type loading. (4) Due to subsonic jet wind effects at the exit of the shock tube, the animals are tossed when free, and the lung is heavily loaded when animal motion is constrained. This in turn can change injury type and severity and medical outcome. (5) Surface and intracranial pressures vary linearly with incident pressures; intracranial pressures are governed by both surface and incident pressures. (6) Validated numerical simulations have shown that the major wave transmission pathway to the rat brain is through the cranium. The snout plays only a secondary role in biomechanical loading of a rat by diffracting the blast wave toward the eye socket and skull.
Footnotes
Acknowledgment
The authors gratefully acknowledge the financial support under the U.S. Army Research Office project “Army-UNL Center of Trauma Mechanics” (contract no. W911NF-08-10483, Project Manager: Larry Russell, P.I: Namas Chandra). We are grateful to Dr. Maciej Skotak and Dr. Fang Wang for helpful comments on the manuscript.
Author Disclosure Statement
No competing financial interests exist.