
Abstract
Concussive injury (or mild traumatic brain injury; mTBI) can exhibit features of focal or diffuse injury patterns. We compared and contrasted the cellular and molecular responses after mild controlled cortical impact (mCCI; a focal injury) or fluid percussion injury (FPI; a diffuse injury) in rats. The rationale for this comparative analysis was to investigate the brain's response to mild diffuse versus mild focal injury to identify common molecular changes triggered by these injury modalities and to determine the functional pathways altered after injury that may provide novel targets for therapeutic intervention. Microarrays containing probes against 21,792 unique messenger RNAs (mRNAs) were used to investigate the changes in cortical mRNA expression levels at 3 and 24 h postinjury. Of the 354 mRNAs with significantly altered expression levels after mCCI, over 89% (316 mRNAs) were also contained within the mild FPI (mFPI) data set. However, mFPI initiated a more widespread molecular response, with over 2300 mRNAs differentially expressed. Bioinformatic analysis of annotated Gene Ontology molecular function and biological pathway terms showed a significant overrepresentation of genes belonging to inflammation, stress, and signaling categories in both data sets. We therefore examined changes in the protein levels of a panel of 23 cytokines and chemokines in cortical extracts using a Luminex-based bead immunoassay and detected significant increases in macrophage inflammatory protein (MIP)-1α (CCL3), GRO-KC (CXCL1), interleukin (IL)-1α, IL-1β, and IL-6. Immunohistochemical localization of MIP-1α and IL-1β showed marked increases at 3 h postinjury in the cortical vasculature and microglia, respectively, that were largely resolved by 24 h postinjury. Our findings demonstrate that both focal and diffuse mTBI trigger many shared pathobiological processes (e.g., inflammatory responses) that could be targeted for mechanism-based therapeutic interventions.
Introduction
A
Neurological, cognitive, and behavioral deficits are commonly observed shortly after an mTBI. These deficits, often referred to as postconcussive symptoms, may include headache, vomiting, cognitive slowing, fatigue, dizziness, depression, and problems with attention and memory. 7 –9 In a small proportion of mTBI patients, estimated at between 5 and 15%, some of these symptoms have been reported to linger for up to 1 year or more after injury and can markedly lower self-reported quality-of-life measures. 10 –15 Both clinical and experimental studies have shown that concussive force can elicit physical and/or structural changes in the brain. These changes can be focal, diffused through the brain, or a combination of the two. 16 –21 Therefore, identification of both common and pathology-specific molecular mechanisms may aid in identification of targets for the development or selection of compounds that will be most effective in treating mTBI. Two commonly utilized experimental models of injury have been developed that qualitatively recapitulate a number of the functional deficits and pathologies exhibited in human TBI cases. The fluid percussion injury (FPI) model has been shown to cause diffuse brain injury, whereas the controlled cortical impact (CCI) model causes a more focal brain injury. Both experimental models have been shown to induce memory dysfunction in animals. These experimental injury models have most often been employed to examine the consequences of moderate-to-severe levels of injury (as indicated by contusion and other structural damage), with only relatively few studies employing an injury level that can be described as mild. 22 –24 Consequently, the cellular and molecular mechanisms contributing to mTBI-associated pathologies as well as neurological, cognitive, and behavioral deficits are not well understood.
In this study, we compared and contrasted the cellular and molecular changes initiated by mild FPI (mFPI) and mild CCI (mCCI). The rationale for this comparative analysis is three-fold: 1) investigate the genomic response of the brain to mild diffuse injury and mild focal injury; 2) identify common molecular changes that are triggered by both mild diffuse and mild focal injury; and 3) determine the functional pathways that are altered by both modes of injury that can serve as novel targets for therapeutic intervention. To achieve these objectives, we carried out a microarray analysis of the entire expressed rat transcriptome at 3 and 24 h after mCCI and mFPI. A bioinformatics approach was used to identify functional pathways that were in common, or unique, to these modalities of mTBI.
Methods
Animal subjects and surgeries
Male Sprague-Dawley (SD) rats (275–300 g) were purchased from Charles River Laboratories (Wilmington, MA). All experimental procedures were approved by the local institutional animal care and use committee and were conducted in accord with recommendations provided in the Guide for the Care and Use of Laboratory Animals. Protocols were designed to minimize pain and discomfort during the injury procedure and recovery period.
mFPI
Our FPI was slightly modified from previously described protocols. 25,26 Briefly, male SD rats (275–300 g) were initially anesthetized using 5% isoflurane with a 1:1 N2O/air mixture and then maintained with 2.5% isoflurane with a 1:1 N2O/air mixture through a face mask during the surgical procedure. Animals were mounted on a stereotaxic frame secured by ear bars and an incisor bar. The head was held in a horizontal plane with respect to the interaural line. After exposing the skull, a 4.8-mm-diameter craniectomy was made 1 mm lateral to the sagittal suture midway between the bregma and lambda, with the dura membrane kept intact. A hub modified from a 20-gauge needle was implanted into the craniectomy and initially affixed to the skull with cyanoacrylate. To provide additional stability, dental acrylic was then applied surrounding the hub and allowed to harden. The incision was closed by suturing the skin over the hub, and animals were allowed to fully recover from anesthesia in a warm chamber. Before injury, animals were reanesthetized and mounted on the stereotaxic frame. Sutures were removed to reexpose the hub, and animals were connected to the fluid percussion device by the hub. An overpressure of 1.0 atmosphere (atm) was delivered, causing a mild brain injury. 27 –29 The hub and surrounding dental acrylic were immediately removed after injury, and the incision was closed by wound clips. Sham-operated animals received all the aforementioned surgical procedures, except hub implantation and injury. Body temperature during surgery was maintained at 37°C using a rectal thermometer and heating pad. After surgery, animals were allowed to completely recover from anesthesia in a warmed chamber before being transferred to their home cages.
mCCI brain injury
Animals received a unilateral brain injury from an electronic CCI device essentially as previously described. 30,31 Rats were deeply anesthetized using 5% isoflurane and a 1:1 N2O/air mixture, and anesthesia was maintained during surgery using 2.5% isoflurane and a 1:1 N2O/air mixture. Rats were then mounted in a stereotaxic frame with heads held in a horizontal plane, a midline incision was made, and tissue was reflected. A 6-mm unilateral craniectomy was performed midway between the bregma and lambda with the medial edge 1 mm lateral to the midline. To generate a mild injury, rats received a single impact (0.8 mm depth, 5 m/sec, and 150 msec dwell time) at an angle of 10 degrees from the vertical plane. 32 –34 Sham rats were anesthetized and received a midline incision only. After injury or sham operation, the scalp was closed with wound clips, animals were placed in a warm chamber, monitored during recovery from anesthesia, and then returned to their home cages.
Illumina microarray
Total RNA from the ipsilateral cortex (n=3/group) was isolated using the mirVana™ miRNA Isolation Kit (Invitrogen, Carlsbad, CA), following the manufacturers' recommended protocol, and amplified using the Illumina TotalPrep RNA Amplification Kit (Ambion, Austin, TX). RNA amplification and microarray hybridization was carried out by The University of Texas Health Science Center Houston Microarray Core Laboratory (Houston, TX). Briefly, first-strand complementary DNA (cDNA) was generated from 200 ng of total RNA by reverse transcription with T7-oligo(dT) primers for 2 h at 42°C in a 20-μL reaction. Second-strand cDNA synthesis was initiated by the addition of 80 μL of RNase H/DNA polymerase mix and incubated for 2 h at 16°C. Double-stranded cDNAs were purified using the kit-provided cDNA filter cartridges and eluted in 19 μL of nuclease-free water. The in vitro transcription (IVT) reaction was incubated for 14 h at 37°C in a reaction containing cDNA (17.5 μL) and IVT master mix with T7 RNA polymerase and biotinylated ribonucleotide triphosphates (7.5 μL). Amplified complementary RNA (cRNA) was purified using the kit-provided cRNA filter cartridges, eluted in 100 μL of nuclease-free water, and the concentration was measured using a NanoDrop ND-1000 spectrophotometer (NanoDrop Technologies Inc., Wilmington, DE). cRNA (750 ng) was loaded onto RatRefSeq-12 Illumina Sentrix Beadchip Arrays (Illumina, Inc., San Diego, CA), hybridized overnight at 58°C, washed, and incubated with streptavidin-Cy3 to detect hybridized biotin-labeled cRNA probes. Arrays were dried and scanned with a BeadArray Reader (Illumina). Data were analyzed using BeadStudio (v3.2) software (Illumina).
Luminex assays
Levels of eotaxin, granulocyte colony-stimulating factor (G-CSF), granulocyte macrophage (GM)-CSF, GRO/KC, interferon gamma (IFN-γ), interleukin (IL)-1α, IL-1β, IL-2, IL-4, IL-5, IL-6, IL-10, IL-12p70, IL-13, IL-17, IL-18, IFN-γ-inducible protein (IP)-10, Leptin, monocyte chemotactic protein (MCP)-1, macrophage inflammatory protein (MIP)-1α, regulated upon activation normal T cell expressed and presumably secreted (RANTES), tumor necrosis factor alpha (TNF-α), and vascular endothelial growth factor (VEGF) were simultaneously determined using Luminex xMAP technology and kits obtained from Millipore (Billerica, MA). Procedures were conducted as recommended by the vendor, and a standard curve for each of the target proteins was prepared by serial dilution in assay buffer. Tissues were disrupted by 20 strokes in a Potter-Elvehjem homogenizer in lysis buffer containing 10 mM Tris-HCl pH 7.4, 1 mM EDTA, 1 mM EGTA, 1 mM Na3VO4, 5 mM NaF, 5 mM Na2MoO4, 1 mM DTT, 1 mM PMSF, 0.1μM okadaic acid, 10μg/ml leupeptin, an 1X Roche inhibitor cocktail. Homogenates were then sonicated and aliquots snap frozen on dry ice and stored at −80°C. The frozen homogenate was thawed on ice, sonicated, centrifuged at 20,000g for 30 min at 4°C, and the supernatant was recovered. Total protein content of the supernatant was measured by bicinchoninic acid assay. Undiluted cortical tissue supernatant solutions (25 μL/well) were assayed in duplicate. Homogenization buffer was used as the blank and added to all standards to account for possible reagent interference. Standards and samples were incubated in a 96-well filter bottom with target-specific microparticles overnight at 4°C with shaking. After incubation, microparticles were washed 3 times using the wash buffer provided in the kit and a vacuum manifold. Biotinylated antibodies (Abs) were added and incubated for 1 h and detected using a streptavidin-phycoerythrin conjugate. After extensive washing, samples were analyzed on a Luminex plate reader (Millipore). Experimental samples were analyzed in duplicate and concentrations were calculated by comparison to the appropriate reference standard curve. Quality-control samples (provided by the manufacturer) were analyzed simultaneously and used to validate the accuracy of the assay. Calculated concentrations of each target were normalized against the homogenate protein concentration.
Western blots
Using independent groups of sham and mTBI animals (n=4/group), ipsilateral cortical tissue underlying the injury site was quickly dissected at 3 or 24 h postinjury under ice-cold anti-CSF and snap-frozen on dry ice. Total homogenates were prepared as described above, sonicated, and stored at −80°C until use. Protein concentration was estimated by Bradford's assay using bovine serum albumin as the reference standard and confirmed by Coomassie-stained gel. Total protein (10 μg) was separated on 4–12% sodium dodecyl sulfate polyacrylamide gel electrophoresis (SDS-PAGE) gels and transferred to polyvinylidene difluoride (PVDF). Blots were probed with rabbit anti-GFAP (glial fibrillary acidic protein) Abs (1:5000), rabbit anti-UCHL1 (ubiquitin carboxyl-terminal esterase L1), and mouse anti-β-actin Abs. Because of the differences in molecular weight and host immunoglobulin G, the same blots were simultaneously probed, and the β-actin signal was used as an internal reference to control for loading differences. Immunoreactive bands were detected using antirabbit Alexa 488 and antimouse Alexa 568–conjugated secondary Abs. Blots were scanned on a Typhoon Trio+ fluorescent scanner, and the resulting images were quantified using ImageQuant TL software (GE Healthcare, Little Chalfont, UK). Signal intensity was converted to relative micrograms of total protein using a reference curve consisting of different loading amounts of protein extract and is expressed as the ratio of biomarker to β-actin.
Immunohistochemistry
Three or twenty-four hours after injury or sham surgery, rats were deeply anesthetized and fixed by perfusion with phosphate-buffered saline (PBS), followed by PBS/4% paraformaldehyde (PFA). Brains were removed, postfixed for 24 h in PBS/4% PFA, and cryoprotected in PBS/30% sucrose. Coronal brain sections were cut on a Hacker Instruments cryostat at a thickness of 30 μm (Hacker Instruments, Winnsboro, SC). Sections were collected serially with every ninth section taken for hematoxylin and eosin staining. Every eighth section was taken for immunohistochemical (IHC) analysis. For light-level IHC detection, sections were rinsed 3 times in Tris-buffered saline (TBS) and endogenous peroxidases were inactivated by 30-min incubation in TBS/0.6% H2O2. Sections were then blocked for 1 h in TBS supplemented with 5% donkey serum and 0.25% Triton X-100. Sections were transferred to primary Ab (10 μg/mL of goat α-IL1β or 20 μg/mL of goat α-MIP1α; R&D Systems, Minneapolis, MN) and incubated overnight at 4°C with agitation. Sections were washed, incubated with biotinylated donkey α-goat secondary Ab (1 μg/mL; Jackson ImmunoResearch, West Grove, PA), washed, and developed using the ABC Elite Vectastain kit (Vector Laboratories, Burlingame, CA), following the manufacturer's recommended protocol for NiCl2-intensified staining. Sections were mounted onto gelatin-coated slides, dried, delipidated, and dehydrated before cover-slipping with a nonaqueous mounting medium. Stained sections were imaged using an Olympus BX-61 microscope with a Spot-Flex camera (Diagnostic Imaging, Sterling Heights, MI). Bright field images were captured at 10×magnification and annotated in Adobe Illustrator. Confocal images were captured using a Bio-Rad Radiance 2000 confocal microscope using a mixed-gas krypton/argon laser for excitation at 488 and 568 nm (Bio-Rad, Hercules, CA). The confocal microscope was attached to an Olympus BX-50 upright microscope. Images were acquired using LaserSharp 2000 software on a Dell 3200 server (Dell Inc., Round Rock, TX).
Statistical analysis
Beadstudio software (version 3.2; Illumina) was used for the primary Illumina microarray gene expression data analysis. Background signal (average signal intensity of the negative controls on the array) was subtracted, signal intensities across arrays were normalized using the quantile method, and a multiple testing correction using the Benjamini and Hochberg's false discovery rate
35
was applied. Genes with a detection p-value<0.01 in either sham or injured samples were considered present, and genes with a difference p-value<0.05 were considered to be significantly regulated after injury. For some of the presented microarray analyses, the data sets were additionally filtered using a (log2 [TBI/sham]=± 0.5) change as a cut-off value, where indicated in text. The resulting lists of significantly regulated genes were analyzed using the web-based interface, AmiGO (version 1.8; August 2011 database release; accessed through
Results
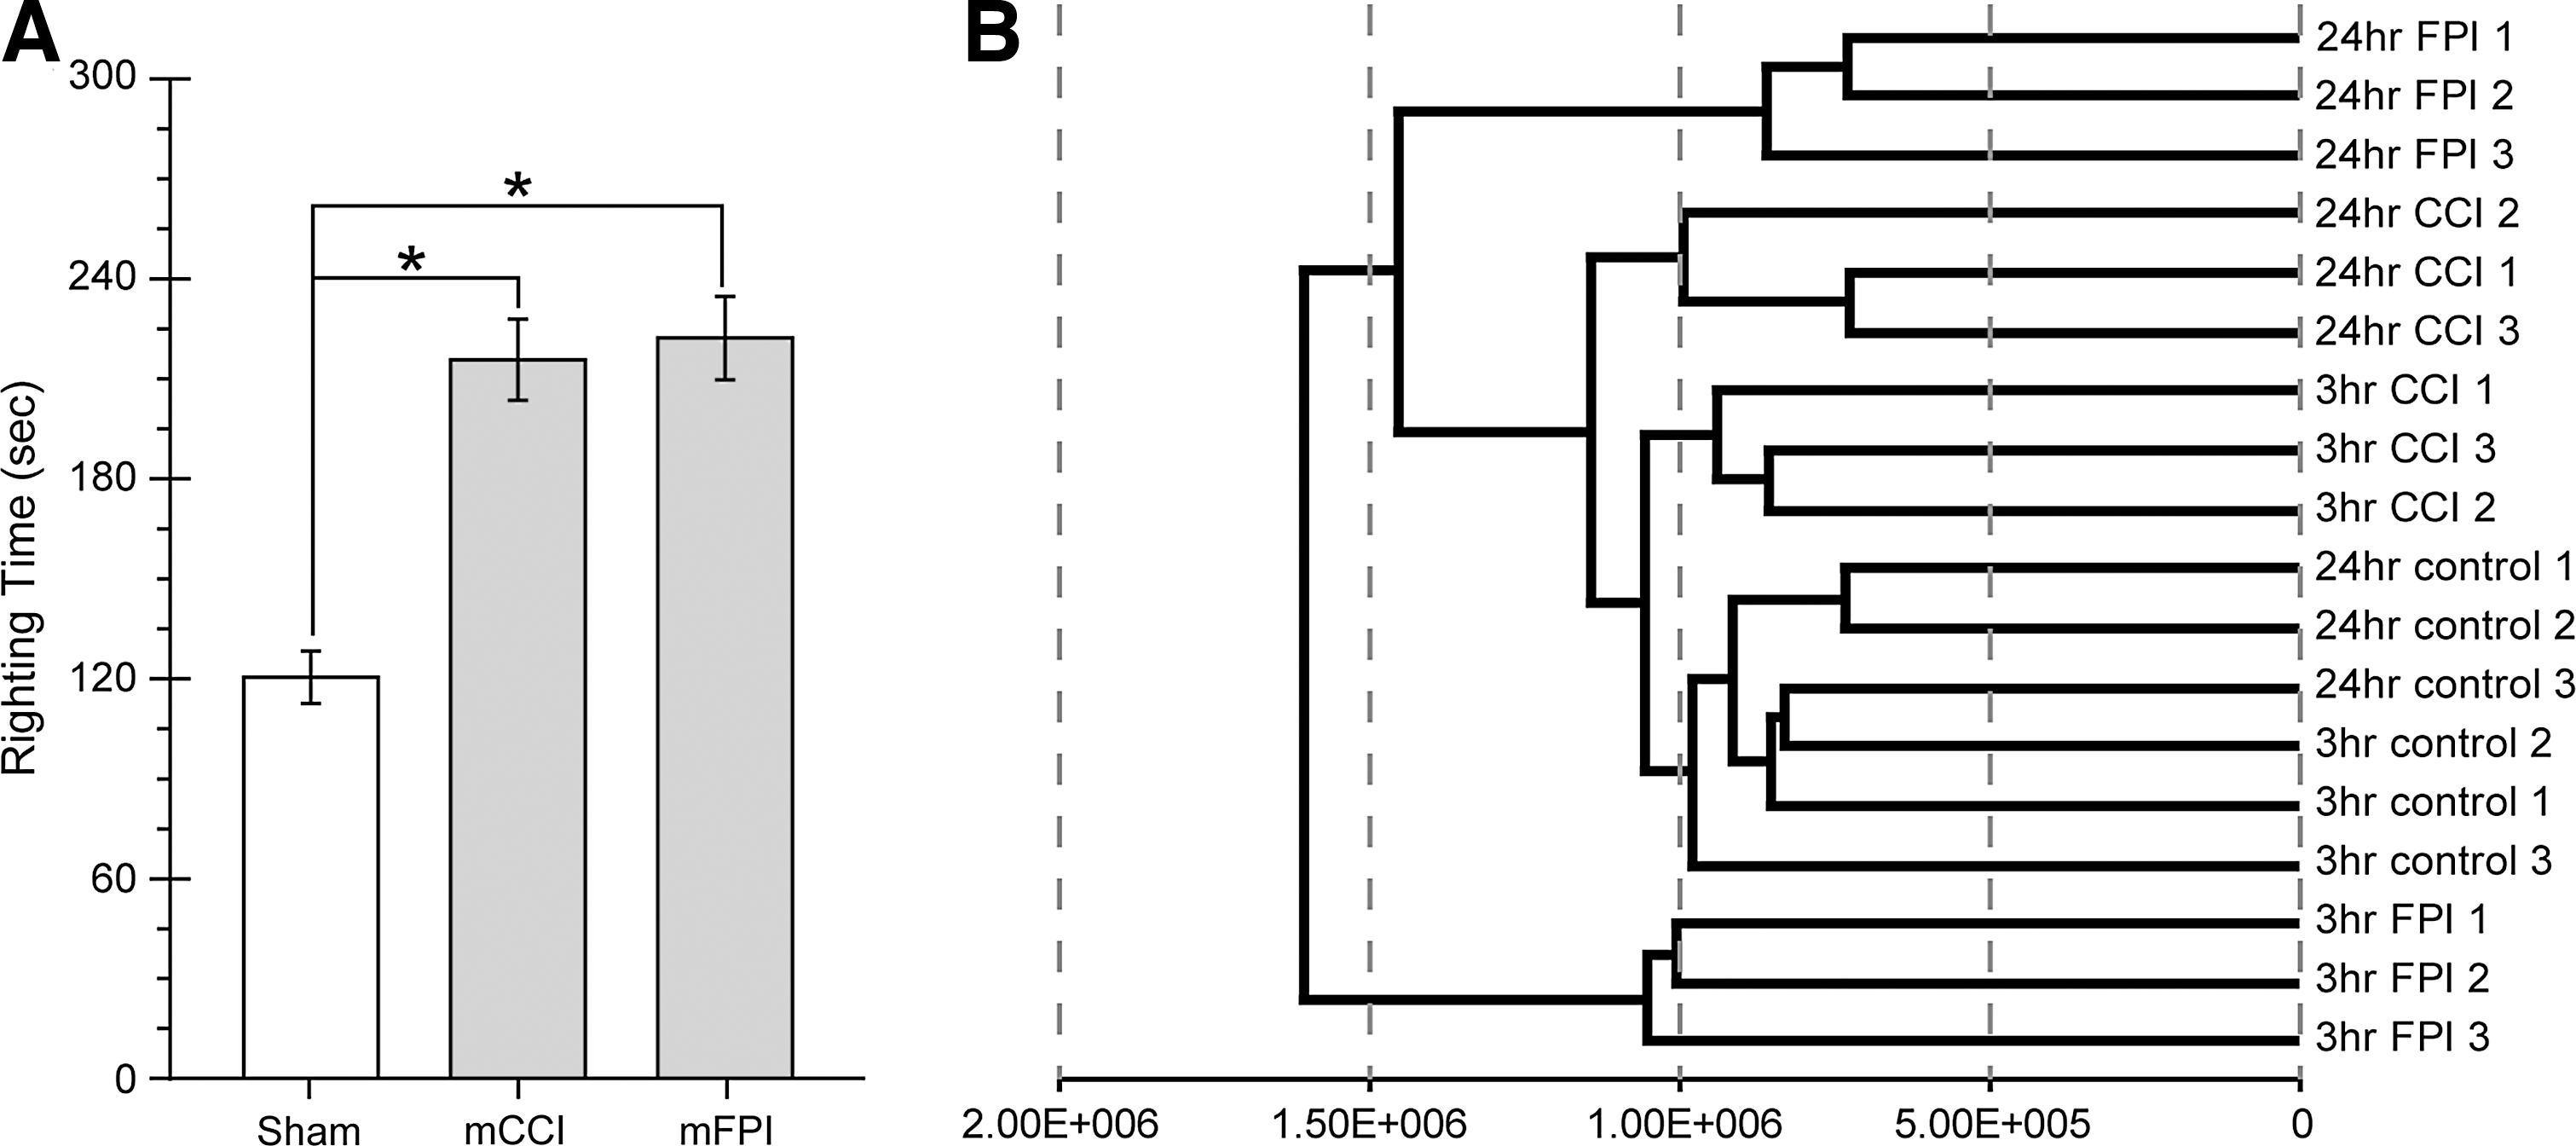
Animals (n=3/group) were subjected to mild injury (mCCI, 0.8 mm depth; mFPI, 1 atm) or sham surgery. 27,28,33 After injury and discontinuation of anesthesia, we measured time to recovery of the righting reflex (spontaneous return to an upright position when the animal was placed on its back), which has been used as an indicator of injury severity, as well as a correlate of loss of consciousness in human mTBI. 38 –40 As shown in Figure 1, righting times for animals receiving mCCI (215.7±12.1 sec) were significantly longer than for control animals (120.4±7.8 sec; one-way ANOVA: F (2,46)=26.165, t=6.115, p<0.0001). Likewise, suppression of righting response for mFPI animals (222.2±12.5 sec, t=6.434, p<0.0001) was also significantly longer than that recorded for uninjured controls (Fig. 1A). However, there was no significant difference between injury models (mCCI versus mFPI; t=0.416; not significant). Times to recovery of righting reflex were consistent with previous reports of recovery after an mTBI. 41 At 3 or 24 h postinjury, animals were euthanized, total RNA was extracted from cortical tissues underlying the injury site, and changes in mRNA expression levels after injury were evaluated by means of Illumina RatRef-12 Expression BeadChip microarrays. Comparisons were carried out between time-matched sham controls and injured groups. To be included in the analyzed data sets, gene probes had to have a calculated detection p-value≤0.01 in either the sham or injured condition as well as a difference in p-value≤0.05 between sham and injured groups. Hierarchical clustering of mRNA expression patterns showed that individuals within each group had the closest relationships (Fig. 1B). As expected, the 3- and 24-h sham groups were the most closely related to each other and existed on a single main branch. Of the injured groups, the 3-h mCCI had the highest overall similarity to sham samples, followed closely by the 24-h mCCI group. The 3-h mFPI samples were the least similar group, forming a distinct cluster with an early branch point.
Characterization of mild injury groups.
Using the data inclusion criteria indicated above, mCCI injury resulted in a total of 845 differentially expressed mRNAs, as compared to shams, at 3 (455) and 24 h (336) or both time points (54) postinjury. In contrast, mFPI initiated a much greater genomic response than the mCCI injury, with a greater than 5-fold increase in the total number of genes showing significantly altered mRNA levels. After mFPI, a total of 4285 genes were differentially regulated, compared to shams, at 3 (1803 genes) and 24 h (1367 genes) or both time points (1115 genes). After further filtering of the data sets to include only those genes with a magnitude-of-change threshold value of (log2 [expression ratio]=± 0.5), there were 354 genes that were significantly altered at 3 (176) and 24 h (151) or both time points (27) after mCCI injury (Fig. 2A), whereas the mFPI resulted in 2308 genes that were significantly altered at 3 (1158) and 24 h (744) or both 3 and 24 h (406) postinjury (Fig. 2B). Using the intersection of these data sets as an indicator, we found that there was a consistently greater concordance between genomic responses initiated by the different injury modalities (Fig. 2C,D; p≤5×10⁻¹⁵; chi-square test) than across time within either injury model (Fig. 2A,B; 1.77×10⁻³≥p≥6×10⁻¹⁵; chi-square test). In total, almost 84% of genes that were significantly regulated after mCCI (320 of the 381 genes at log2 [expression ratio]=± 0.5 cut-off threshold) were found to also be significantly regulated at the same time and in the same direction after mFPI.

Venn diagram representations depicting the intersections of changes in gene expression between injury times and across injury models. Intersections of significantly regulated mRNAs between the indicated data sets were determined using the online tool, VENNY (developed by J.C. Oliveros; accessed at
We next compared the mCCI and mFPI data sets at both 3 and 24 h to identify significantly regulated genes in common and plotted magnitudes of change in expression level (log2 [TBI/sham]) in each model system. As Figure 3 shows, there was a significant positive correlation in magnitude of response of genes that are significantly altered after both mCCI and mFPI at both 3 (184 genes; r s=0.921, p=2.0×10⁻⁷) and 24 h (137 genes; r s=0.942, p=2.0×10⁻⁷) postinjury. Positive slopes of correlation lines (3-h slope=1.519; 24-h slope=1.489) indicated an overall trend toward an increased response magnitude for a given gene target after mFPI injury, as compared to mCCI, at both time points examined.

Relationship between genomic responses initiated by mCCI and mFPI injuries. Microarray data (cutoff at log2 [TBI/sham]=± 0.5) from the 3- and 24-h postinjury data sets were sorted to identify the intersection of regulated genes (184 and 137 genes in the 3- and 24-h data sets, respectively). Data were plotted as the change in signal intensities (log2) and analyzed using Spearman's rank-order correlation. Significant correlations between mCCI and mFPI responses were found for both the 3- (r s=0.921; p=2×10⁻⁷) and 24-h (r s=0.942; p=2×10⁻⁷) time points. Slopes for plotted data are 1.519 and 1.489, respectively. Dashed line indicates a theoretical plot with slope=1.000. mCCI, mild controlled cortical impact; mFPI, mild fluid percussion injury.
To identify the biological processes and molecular functions that may be affected by mild injury, we first examined the significantly altered gene data sets for enrichment of associated GO terms. We found that the significantly up-regulated gene data sets for both injury models and both time points were highly enriched for genes associated with stress and inflammation processes (e.g., GO:0006950, 6.43×10−36<p<9.50×10⁻⁹; GO:0009654, 3.34×10⁻¹⁹<p<2.47×10⁻⁴; GO:0006955, 6.55×10⁻²⁴<p<1.49×10⁻⁴; GO:0070555, 1.73×10⁻⁷<p<3.79×10⁻²; see Supplementary Tables 1, 3, 5, and 7) (see online supplementary materials at
We also used IPA to identify functional networks and canonical pathways affected by mild injury. The IPA software uses the curation of published literature to construct their knowledge base and establish known and inferred protein interconnectivity networks and pathways. Although the IPA knowledge base is related to the analysis of annotated GO terms available through AmiGO, it is constructed independently and uses different association criteria and term definitions and therefore is likely to yield a complementary, but unique, analysis. We submitted the significantly altered gene lists (both up- and down-regulated gene sets from the 3-h mCCI, 24-h mCCI, 3-h mFPI, and 24-h mFPI data sets) for core IPA analysis to map the genes onto functional and molecular networks and canonical signaling pathways. Consistent with the GO term analyses results, inflammatory response/disease was one of the top ranked diseases and disorders for each of the submitted data sets. In the molecular and cellular functions category, “cellular movement” was ranked in the top five across all four data sets, whereas cellular growth and proliferation, cellular development, and antigen presentation were in common between the 3-h mCCI and mFPI data sets. Figure 4 shows a Venn diagram representation depicting the overlap between the top 15 ranked canonical pathways identified by IPA analysis for each of the data sets (see also Supplementary Tables 11 and 12) (see online supplementary materials at
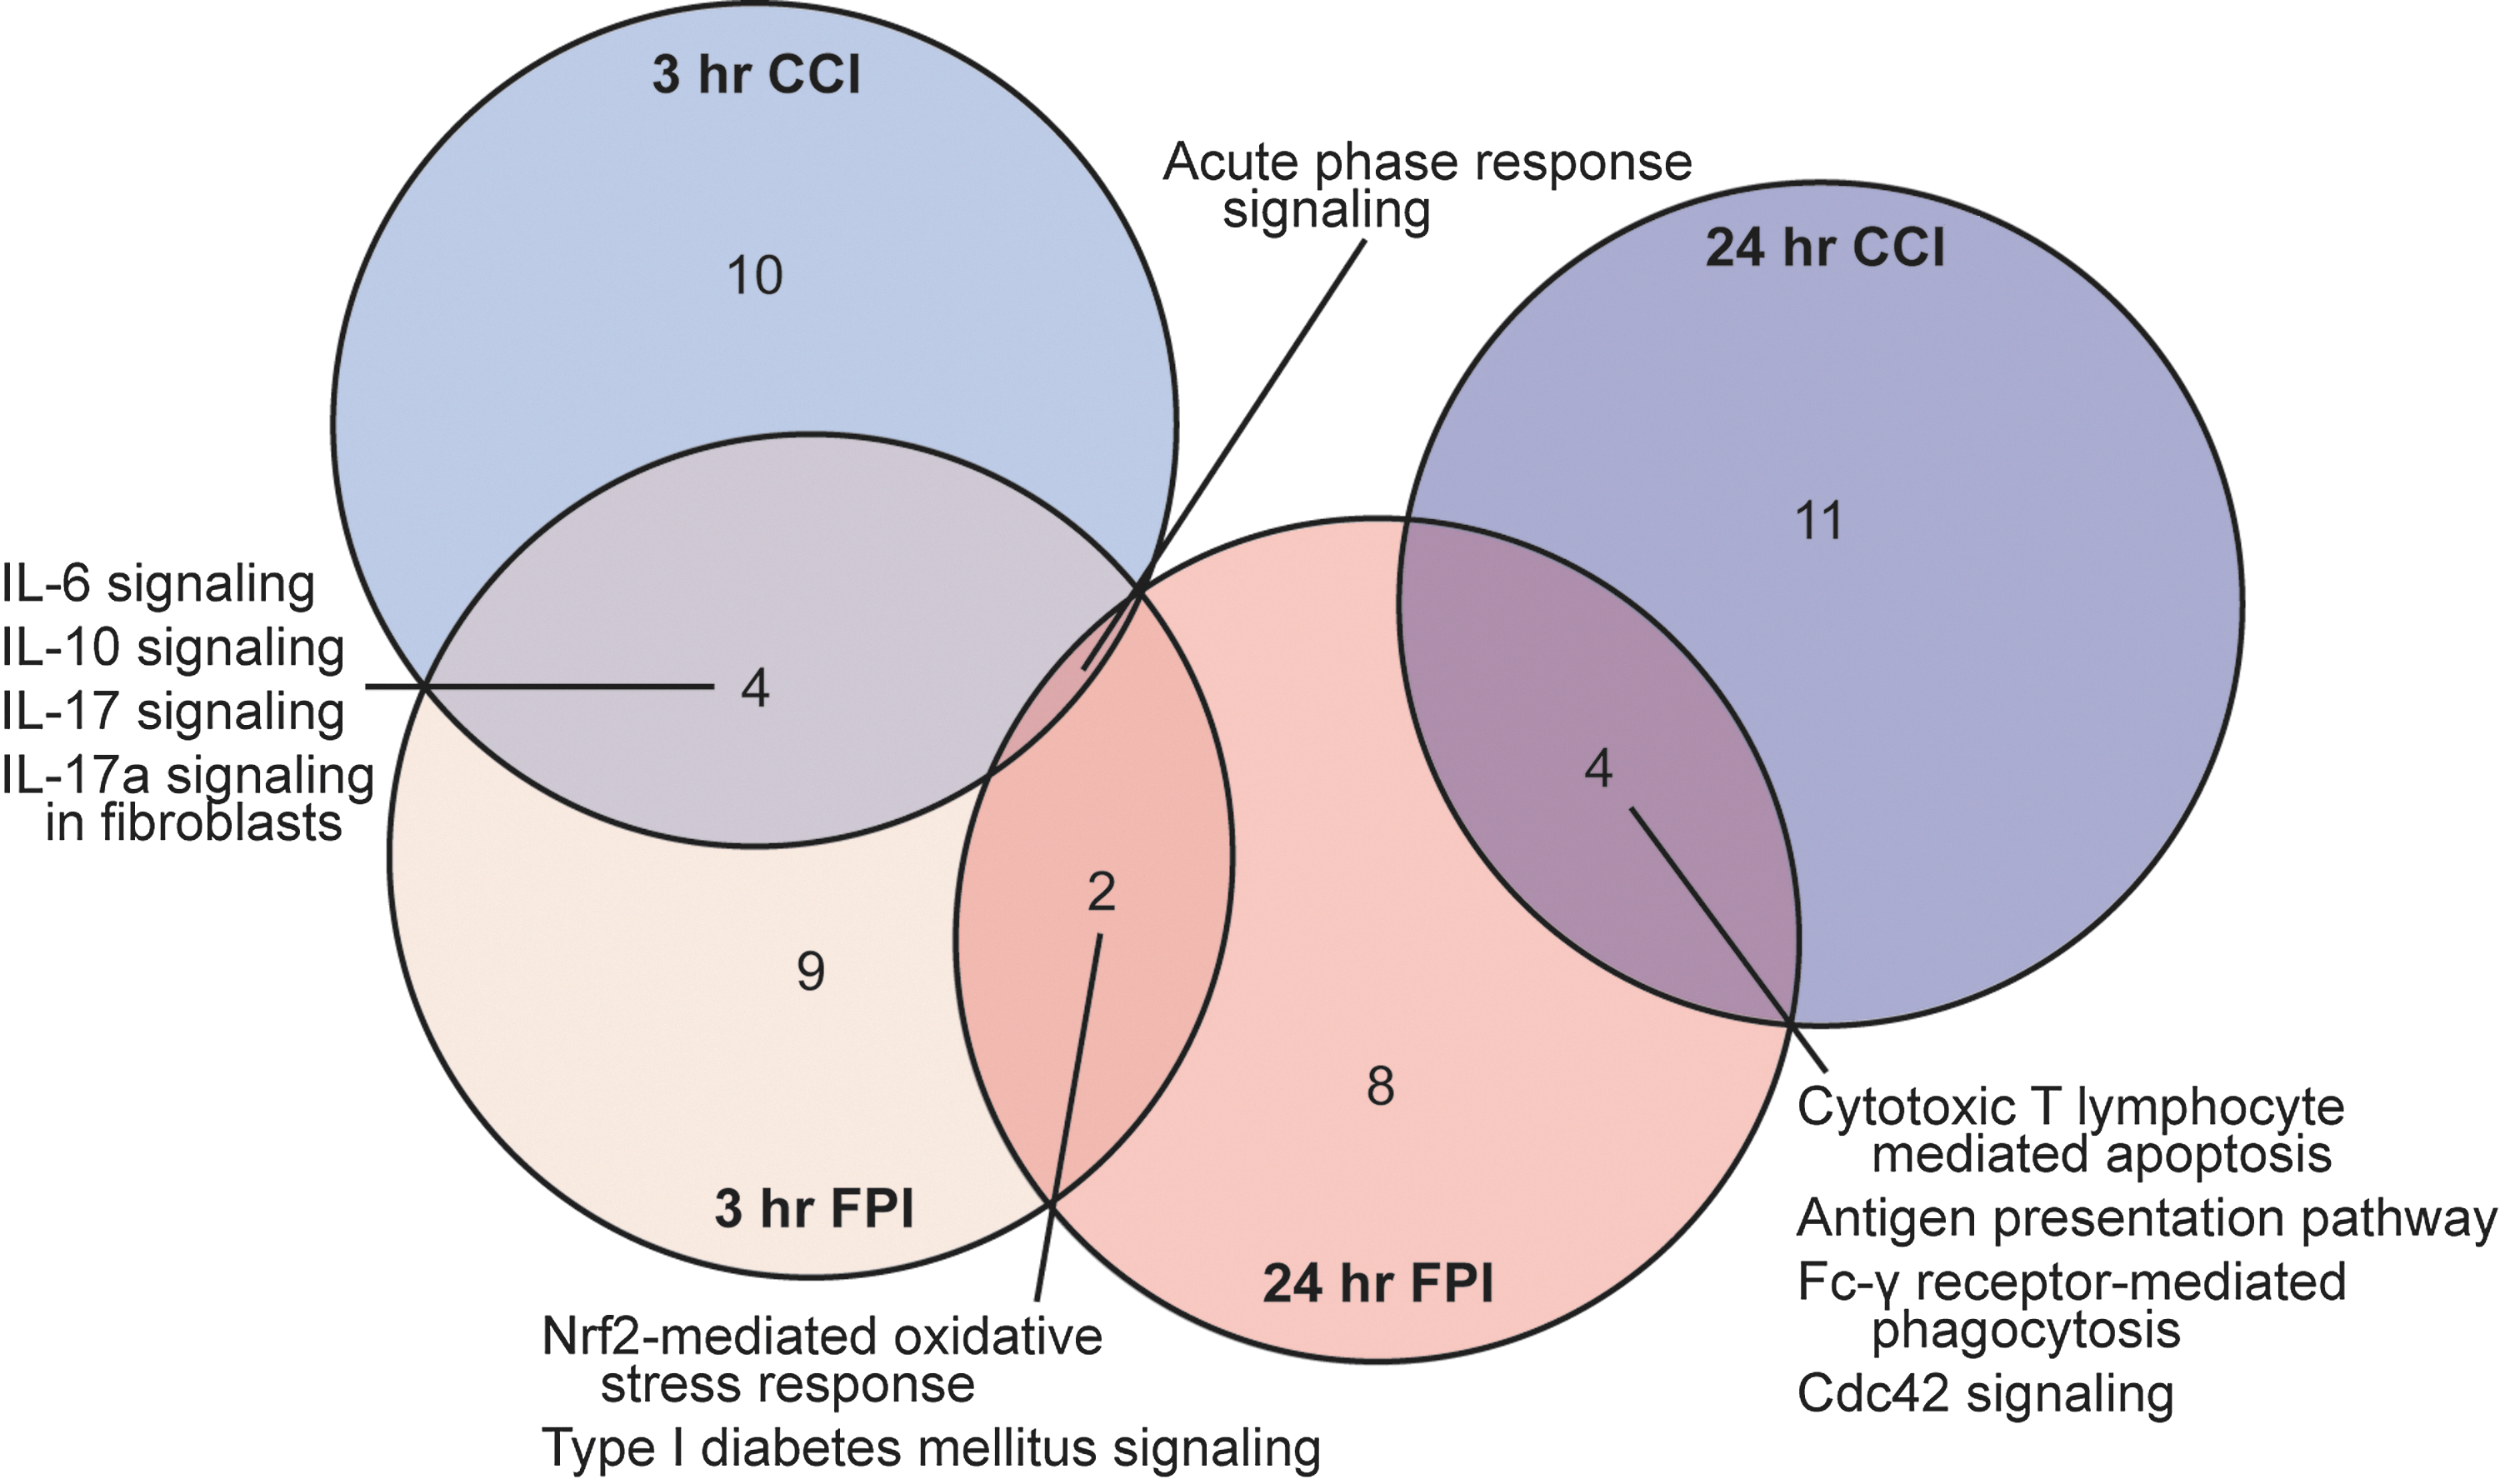
Venn diagram representation showing intersection of canonical pathways altered after mTBI. Complete lists of significantly regulated genes after mTBI detected by microarray analysis were submitted to IPA software (Ingenuity Systems, Redwood City, CA,
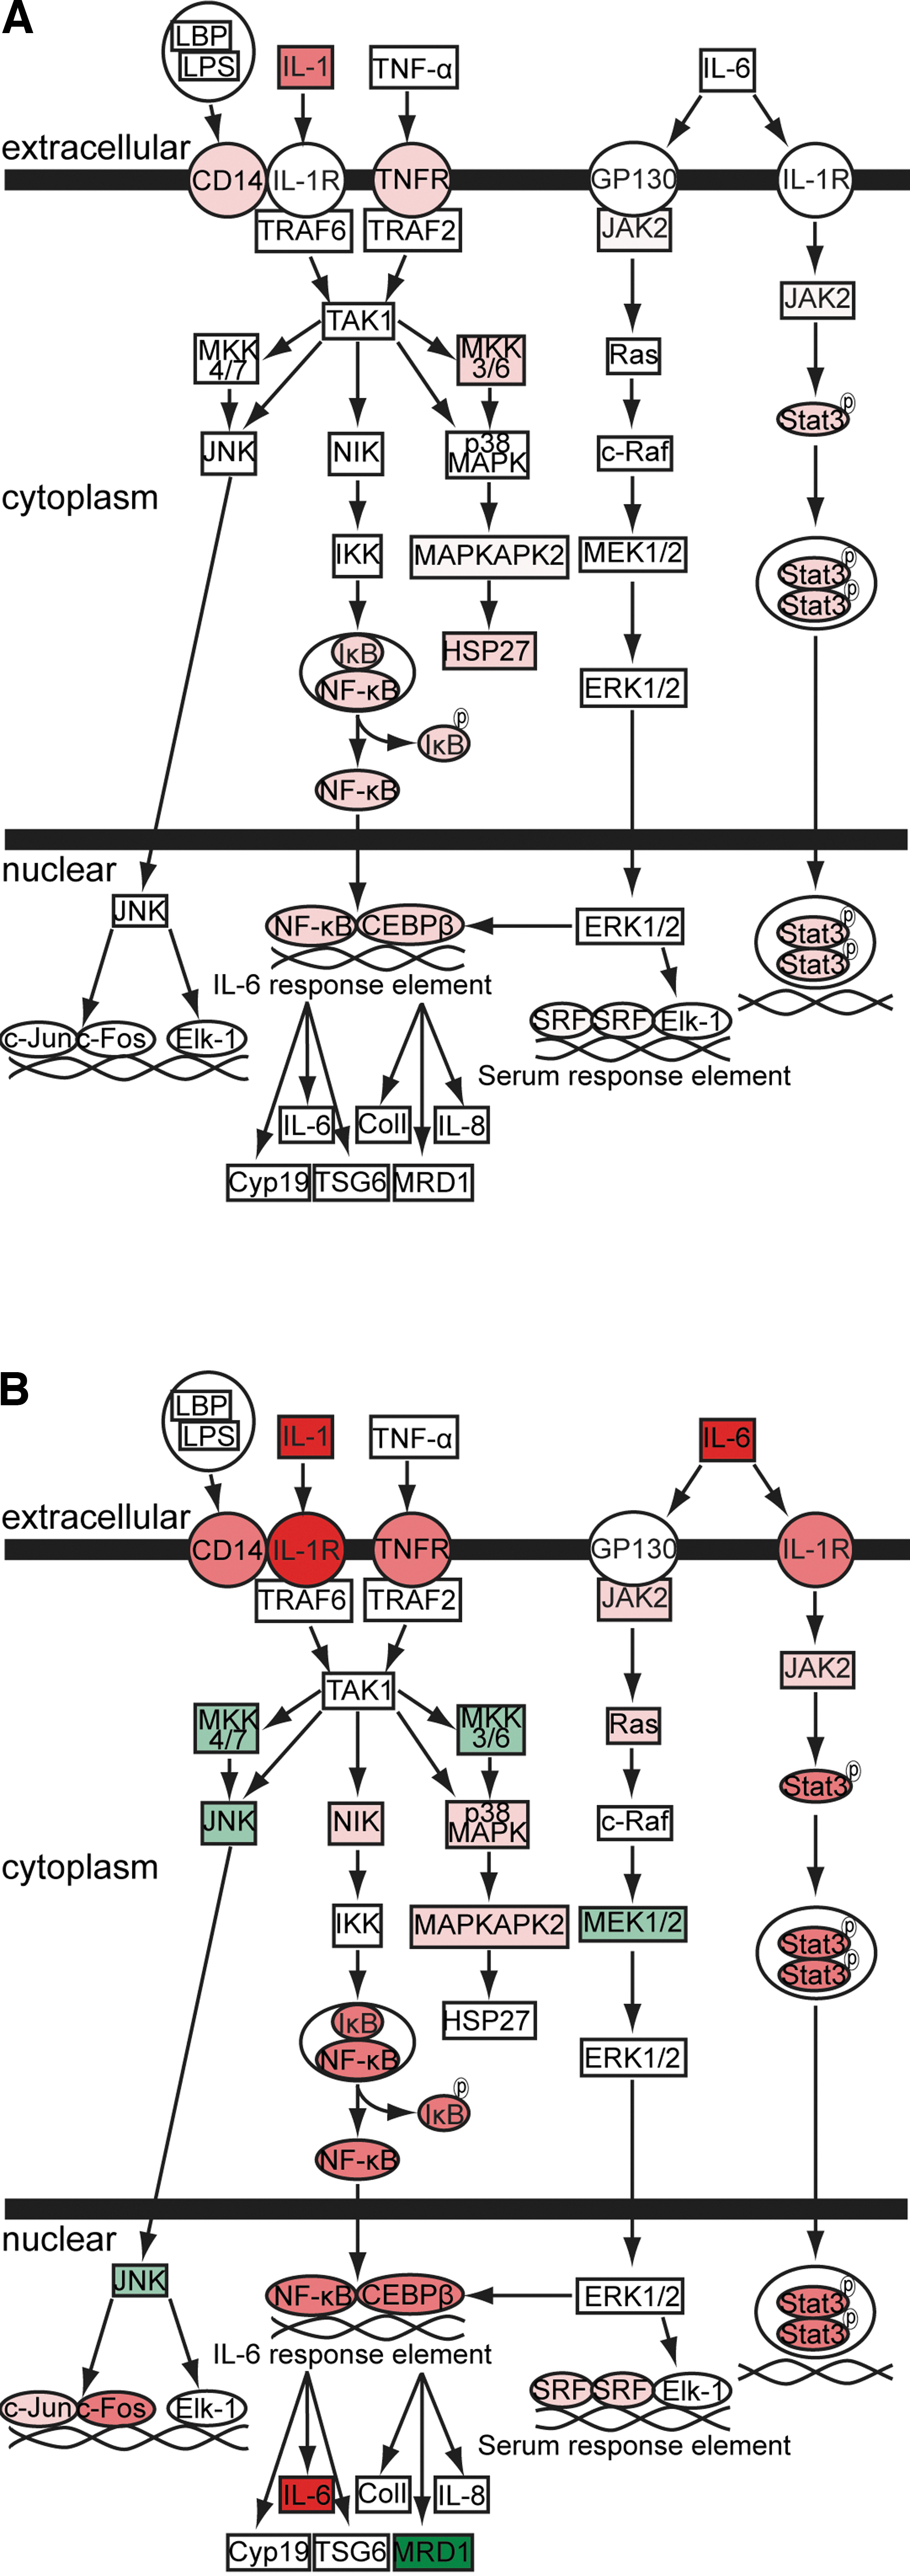
mCCI and mFPI affect levels of multiple mRNAs involved in the IL-6-signaling pathway at 3 h postinjury. Three-hour postinjury microarray data were analyzed using IPA software (Ingenuity Systems, Redwood City, CA,
GO and IPA analyses of the microarray data sets consistently identified alterations within both cytokine and chemokine molecular and signaling pathways and biological processes (Supplementary Tables 9–11) (see online supplementary materials at
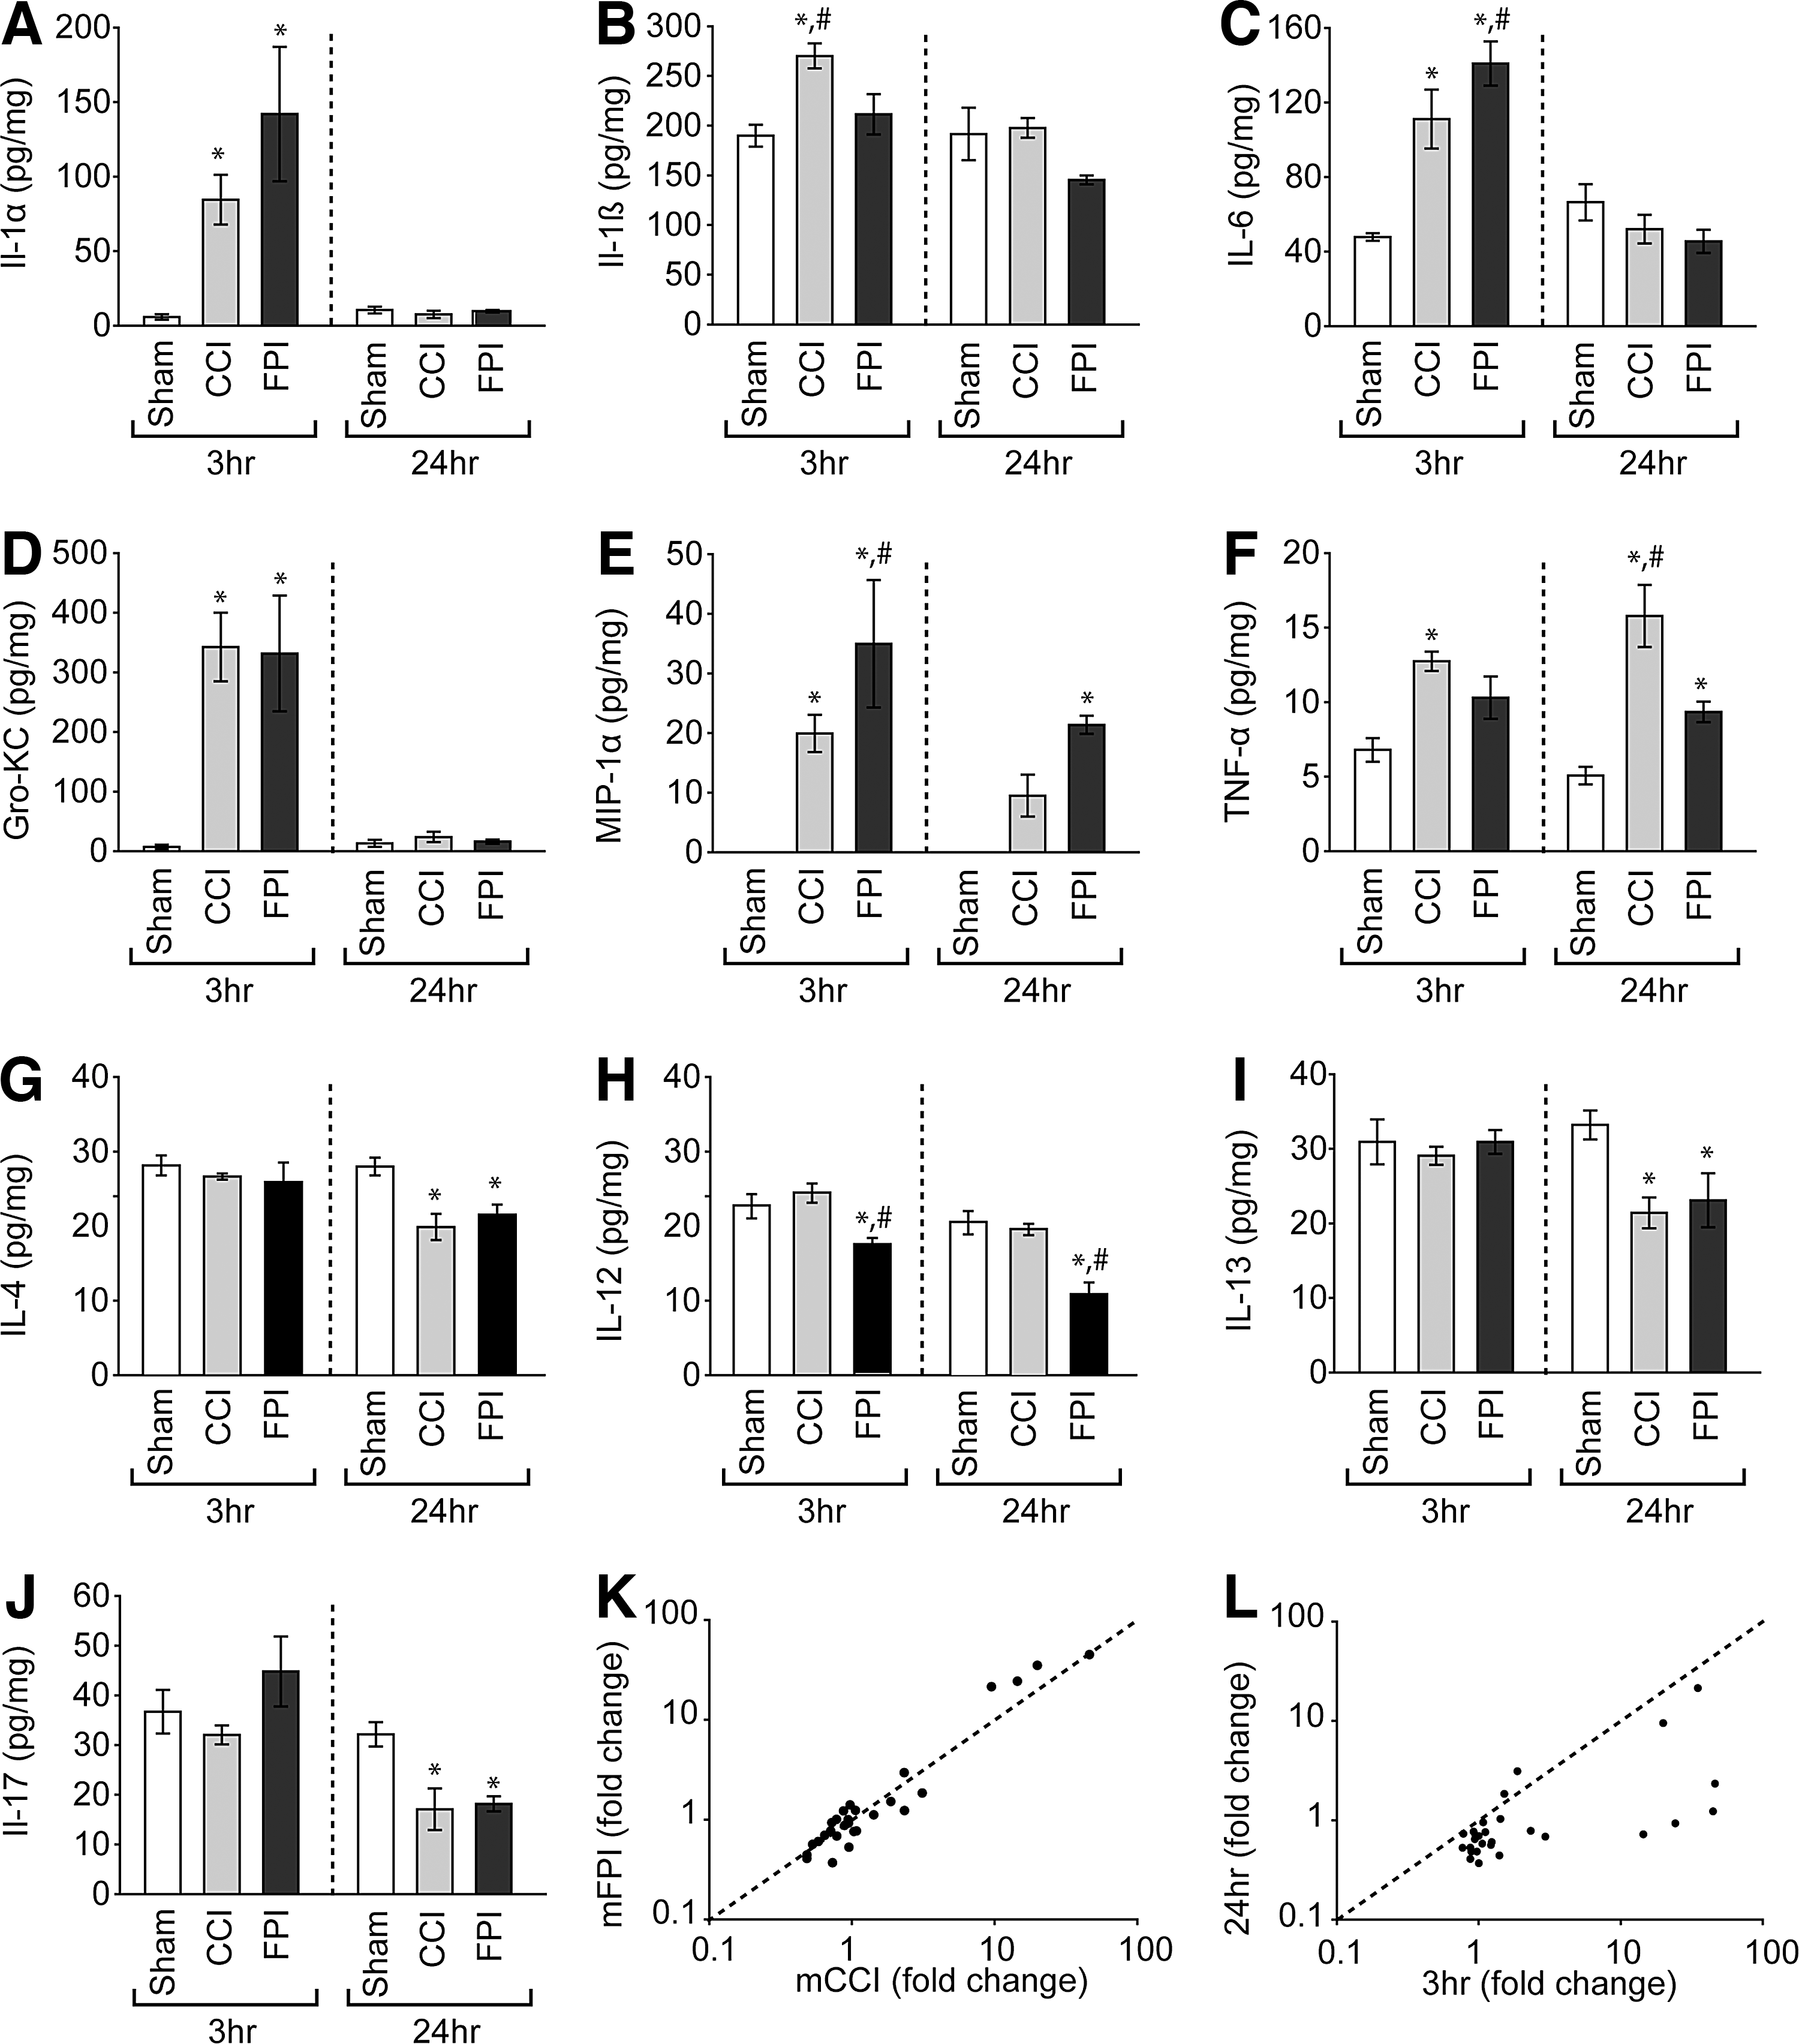
Cytokine and chemokine levels detected in cortical tissue extracts at 3 and 24 h post–mild injury. Cortical tissues underlying the site of injury (n=4/model/time point) were harvested, homogenized, and subjected to parallel analysis of the abundance of 23 different cytokine and chemokine targets. Comparisons across groups and time were carried out using two-way ANOVAs. Levels of
To confirm and extend the Luminex protein expression data, we used IHC localization of selected targets (Mip-1α and IL-1β) to examine the spatial extent of staining in the injured cortex as well as to identify the cell type(s) associated with the increase in protein expression after mild injury. Animals were perfused either 3 h or 24 h postinjury, and coronal sections were prepared for IHC detection of Mip-1α and IL-1β. As predicted from the Luminex data, IL-1β staining was substantially increased in the cortex underlying the impact site in the mCCI model 3 h postinjury (Fig. 7A, panel c), with the increase in staining largely resolved by 24 h postinjury (not shown). A similar increase in cortical IL-1β staining was observed in the 3-h mFPI animals (Fig. 7A, panel d). In sham animals, basal IL-1β staining was very modest and colocalized most often in cells also expressing the astrocyte marker, GFAP (not shown). In contrast, the increased IL-1β staining observed at 3 h after mild injury was commonly associated with the microglial marker, ionized calcium binding adaptor molecule 1 (Iba-1; Fig. 7B). Like IL-1β, basal Mip-1α staining in sham animals was very low. Three hours postinjury, increased Mip-1α staining appeared in vessel-like structures scattered throughout the cortex (Fig. 8A) of both mCCI and mFPI rats. At 24 h postinjury, Mip-1α staining had largely subsided, but was still evident in relatively large vessel-like structures (not shown). To confirm localization in brain vasculature, tissues were double stained with Abs against Mip-1α and the vascular endothelial cell (VEC) marker, rat endothelial cell antigen (RECA). As Figure 8B shows, high-magnification confocal images taken 3 h post-mFPI revealed that Mip-1α and RECA are colocalized in brain VECs.
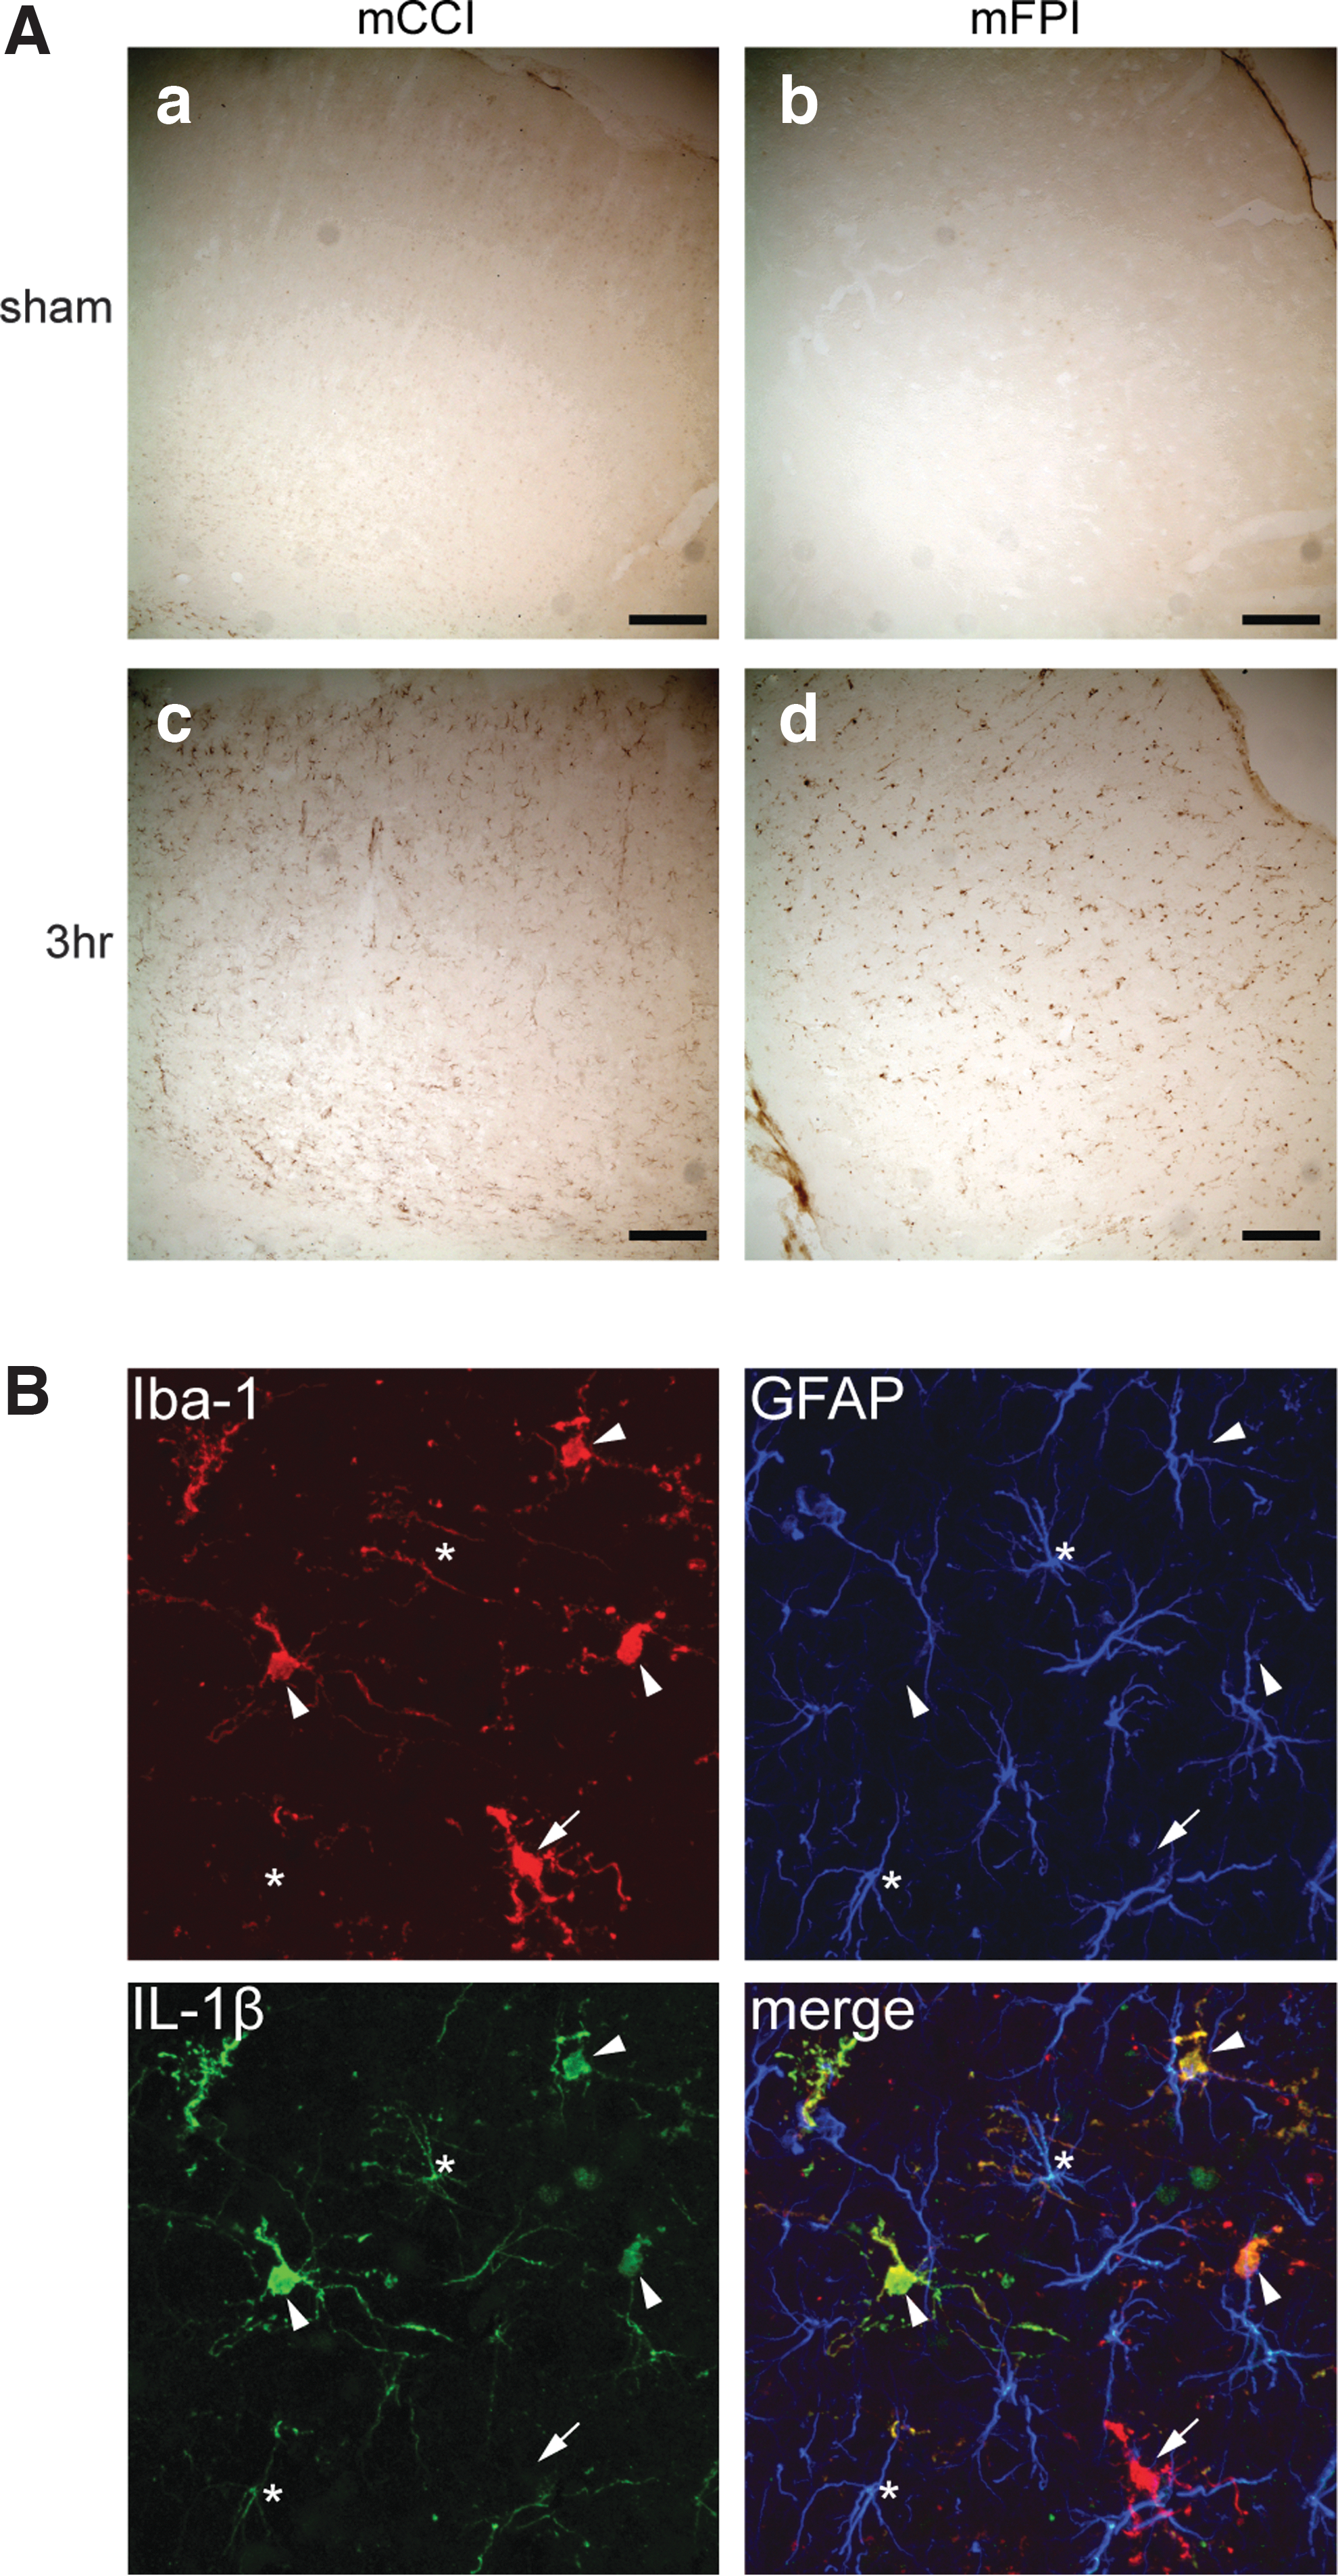
Acute increase in IL-1β immunostaining after mild injury is associated with microglia. Increase in IL-1β staining was largely associated with Iba-1+ microglia, although signal was also detected in astrocytes.

Increased Mip-1α immunostaining after mild injury was associated with cortical vasculature.
We next examined whether expression of putative biomarkers of mTBI (UCHL1 and GFAP) were altered in cortical tissues at 3 or 24 h after mild injury. Equal amounts of total protein extracts were separated by SDS-PAGE, transferred to PVDF membranes, and probed with Abs specific for GFAP, UCHL1, and β-actin (as a loading control). Immunopositive bands were quantified using ImageQuant TL software (GE Healthcare). Figure 9A shows that there was a significant decrease in UCHL1 cortical expression at 3 h postinjury (F (2,9)=6.782, p<0.05; Holm-Sidak's post-hoc comparison). In addition, there was an overall significant group mean difference in GFAP expression at 24 h postinjury (Fig. 9B; sham, 1.13±0.41; mCCI, 1.19±0.24; mFPI, 1.89±0.43; one-way ANOVA group main effect: F (2,9)=5.173, p<0.05).
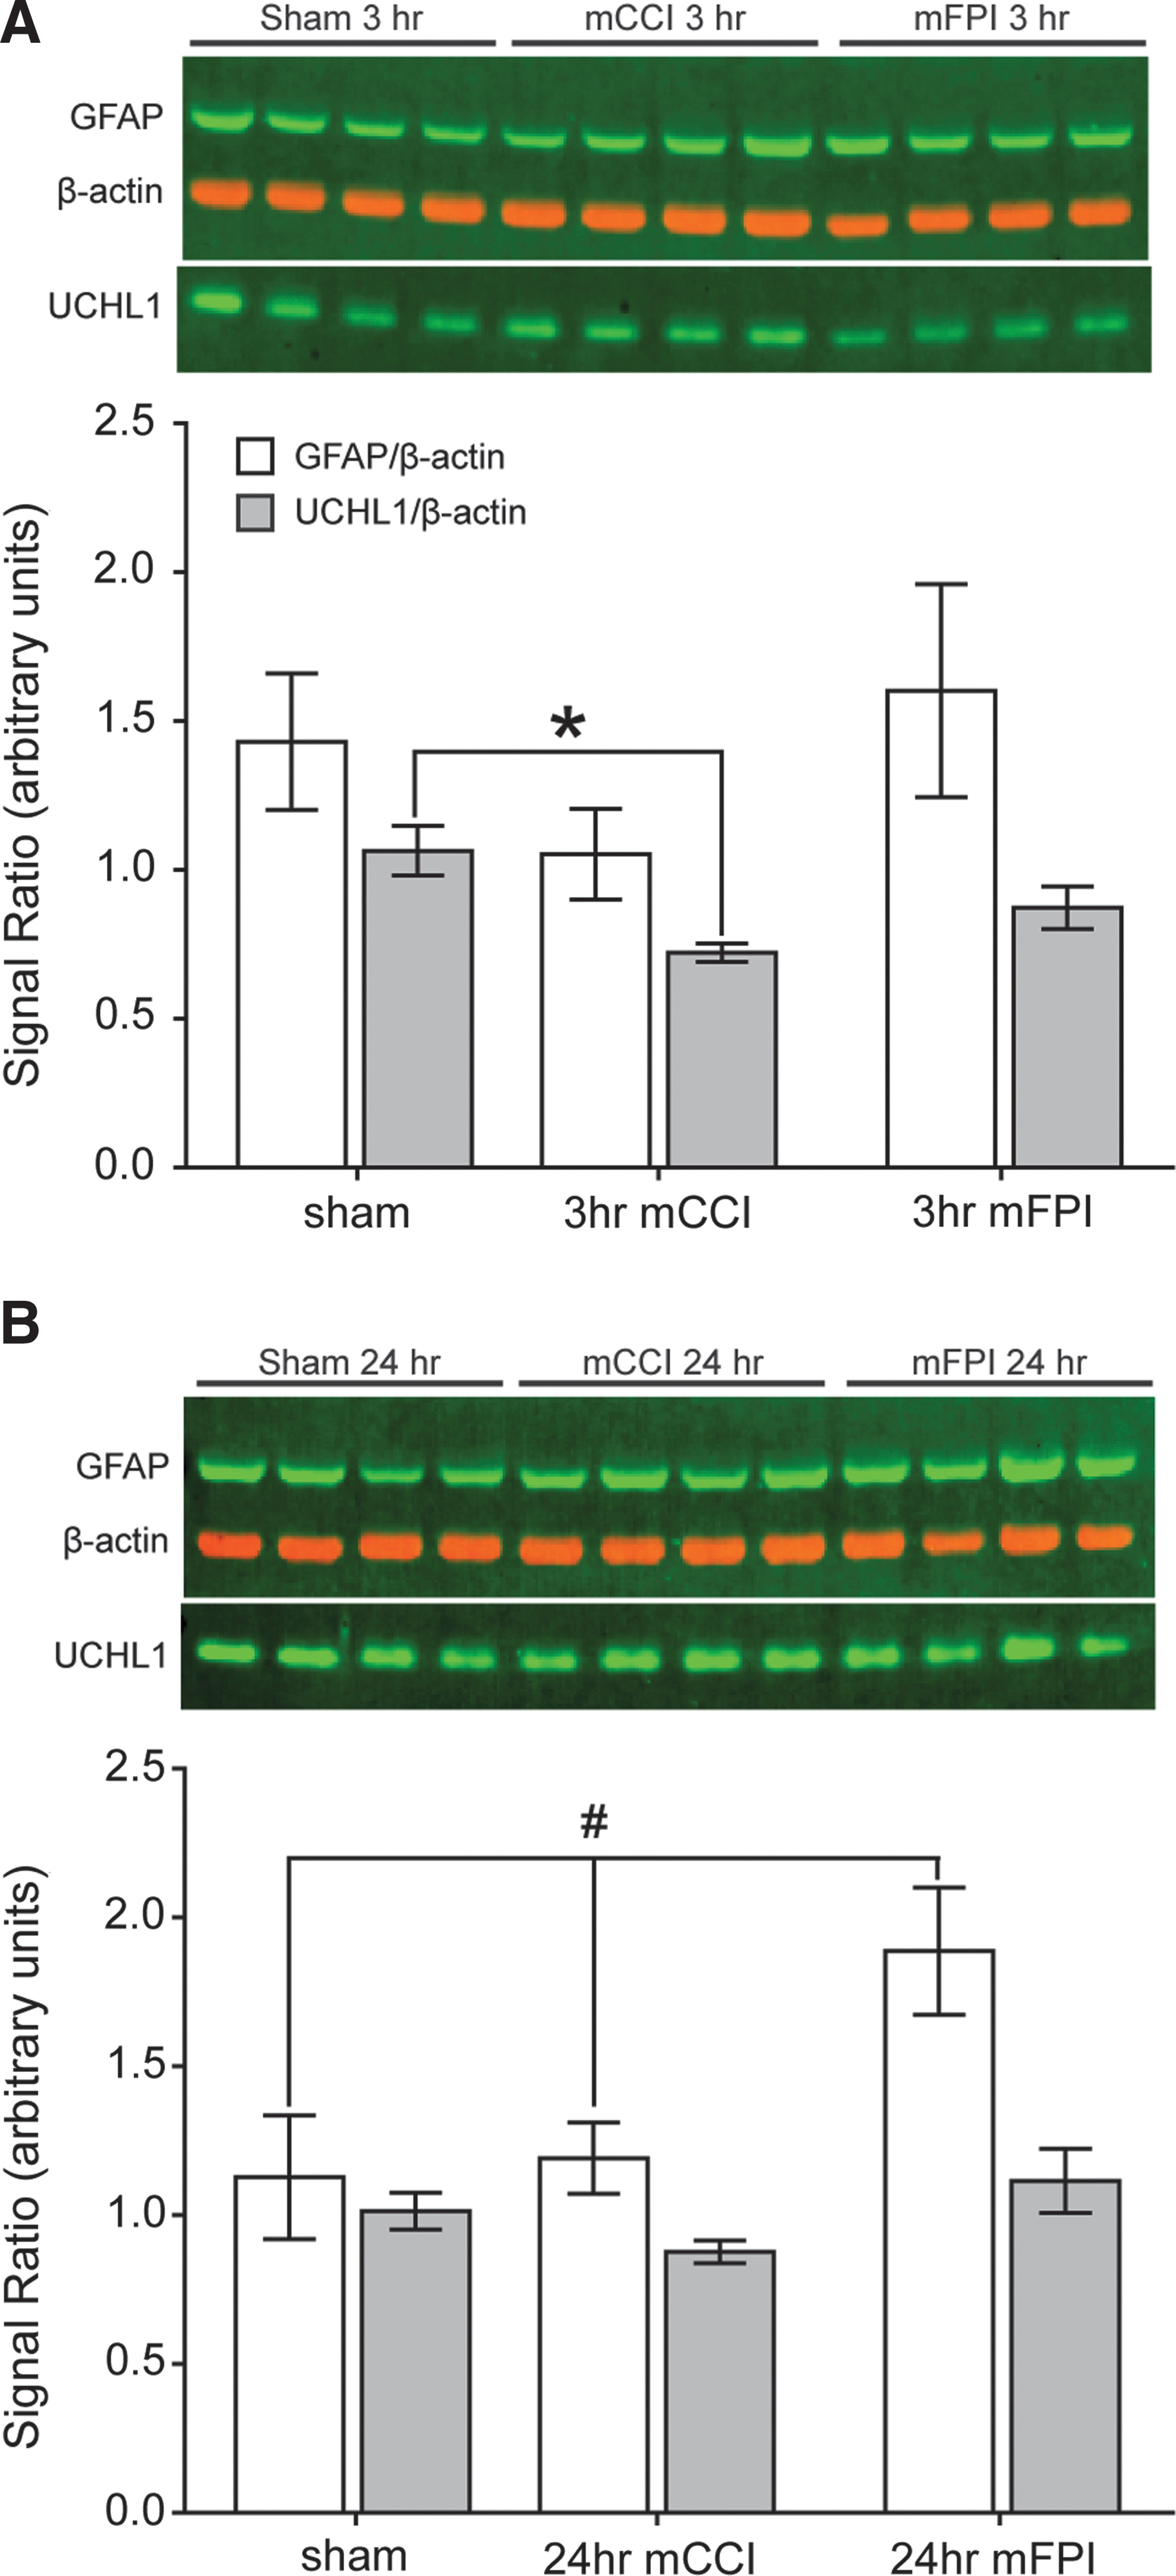
Changes in cortical tissue protein levels of the biomarkers GFAP and UCHL1. Equal amounts of total protein from cortical tissues (n=4/group) taken at 3 (
Discussion
In the present study, we employed models of mild injury that did not cause a visible cortical contusion to evaluate mTBI-induced cellular and molecular changes at 3 and 24 h postinjury. Our results revealed the following key findings: 1) Both mCCI and mFPI induced significant changes in cortical mRNA expression levels. The mCCI genomic response was more restricted in terms of the number of genes whose levels were significantly altered after injury, with almost 90% of the genes altered by mCCI also found to respond similarly after mFPI. 2) Multiple pathways, including cytokine and chemokine signaling, were found to be up-regulated after both modes of injury, while other pathways, such as inhibitory channel activity and GABA-A channels, were found to be selectively altered after mFPI, but not mCCI. 3) Although many similar pathobiological processes were triggered by both mCCI and mFPI, the specific genes whose expressions were altered by the two injuries differed. Commonalities and differences in responses between the two types of injury may have relevance for the development of mechanism-based therapeutic interventions to treat mTBI in general and focal or diffused injury in particular.
The injury magnitudes used in the present study (mCCI, 0.8 mm depth; mFPI, 1 atm) did not cause an obvious cortical contusion. However, the breadth of the genomic response was found to markedly differ between the mCCI and mFPI models. Our data showed that mFPI resulted in approximately 6.5-fold more genes with significantly altered mRNA expression levels than after mCCI injury, whereas mCCI showed a strong bias toward up- over down-regulated expression changes (percentage of responding genes that were up-regulated: 3-h mCCI 78.8% versus 3-h mFPI 49.6%; 24-h mCCI 77.5% versus 24-h mFPI 55.0%; Fig. 2). Although the reason(s) for these differential responses are not clear at this time, it is possible that the 1-atm overpressure and 0.8-mm deformation are not identical injury magnitudes. However, the righting responses, a proposed indicator of injury severity, 38 –40 were not significantly different between the two models (Fig. 1), suggesting similar magnitudes of injury. It is possible that the diffuse nature of the mFPI may have resulted in the involvement of a greater area of the cortex, as compared to mCCI. This would minimize the amount of dilution caused by the inclusion of healthy, unaffected cortical tissue in the dissections, making it easier to detect small changes in expression level. However, analysis of histogram plots of changes in mRNA expression levels after mFPI or mCCI injury showed approximately equal distributions of gene responses between the two models (not shown), suggesting that the mFPI model did not have a bias toward detecting genes with modest changes in expression. Additional experimental parameters, including the effect of these injury magnitudes on behavioral outcomes, will need to be carefully evaluated to determine whether these injuries reproduce the characteristics of mTBI (e.g., axonal injury) observed in humans.
Our bioinformatic analysis showed that both modes of mild injury affected many similar biological processes, such as inflammation and stress responses. Moderate-to-severe TBI is known to alter expression and release of multiple cytokines and chemokines that participate in local inflammatory response after injury. 42,43 These molecules can be released from resident activated microglia and astrocytes (e.g., IL-1β 44,45 ) or VECs (e.g., Mip-1α 46 ) and aid in recruitment of circulating inflammatory cells to the site of injury. Although infiltrating inflammatory cells can serve beneficial functions, such as clearing out damaged and dying cells, an uncontrolled inflammatory response can further exacerbate the damage that occurs after a traumatic insult. 43,47
In support of genomic response results, the Luminex xMAP results presented in Figure 6 showed that both mCCI and mFPI elicited a strong acute inflammatory response, as evidenced by the increased expression of both inflammatory cytokines and chemokines. Levels of these gene products were normalizing by 24 h postinjury, although the protein content of a few of these proteins (e.g., Mip-1α and TNF-α; Fig. 6E,F) remained elevated at this time point. Luminex xMAP data for IL-1β (Fig. 6B) did not show any significant increase in the level of this inflammatory cytokine in cortical extracts from mFPI animals. However, IHC staining for IL-1β showed an overall increase in staining for this target localized in cerebral astrocytes and microglia (Fig. 7). This is consistent with previous reports showing significantly increased IL-1β mRNA and protein expression after moderate-to-severe brain injury. 48,49 Because we observed that increased staining for IL-1β protein occurred predominately in microglia (Fig. 7), the inclusion of other cell types in our cortical extracts may have reduced our ability to detect a significant change using the Luminex detection system. Previous reports have noted both increased Mip-1α mRNA and protein expression levels after TBI, and Israelsson and colleagues reported that increased MIP-1α staining was associated with IB4+ microglia. 50 Although we also found significantly increased Mip-1α mRNA and protein levels after a mild injury, we observed that Mip-1α immunostaining was closely associated with cerebral vessels underlying the site of injury (Fig. 8), with some scattered dense punctate staining that may indicate an association with activated microglia and/or infiltrating monocytes in the vicinity of the cerebral vessels. Taken together, our data suggest that mTBI initiates a relatively widespread neuroinflammatory response in the brain, which may be involved in recruitment of circulating leukocytes to the site of injury. 51,52
Pathway analysis indicated that several molecules involved in both Mip-1α and IL-6 signaling are altered by brain injury (Fig. 5 and Supplementary Fig. 1) (see online supplementary materials at
It has been posited that injury-related changes initiated by an mTBI may exhibit less deviation from normal values, as compared to those caused by a more severe brain injury. 20 However, this assertion has not yet been tested using experimental data. We compared the present mCCI data with previously published data from our laboratory using a more severe injury level. 53 It is important to note that our previous study employed a different microarray platform and detection chemistry, interrogated only a subset of the genes (∼20%) contained on the RatRef-12 Illumina BeadArray, and the cortical tissues analyzed were distal to the injury site. We found that, of the 4429 genes in common on both arrays, moderate-to-severe and mild injury induced a significant change in mRNA expression level of 282 (6.4%) and 152 (3.4%) genes, respectively. Of these, 36 genes responded after both injury levels (13 and 24% of the genes with altered expression after moderate-to-severe and mTBI, respectively), a degree of overlap significantly greater than predicted by chance (chi-square: p=2.03×10⁻¹²). Consistent with this, when these 36 genes were evaluated as a group, changes in their expression levels relative to injury magnitude showed a significant positive correlation (Spearman's correlation on ranks: r s=0.733, p=2×10⁻⁷). It is important to note, however, that although some genes changed in response to both injury levels examined, the majority of genes in these data sets were unique to either mild or moderate-to-severe injury. Thus, it appears that changes in gene expression as a result of mild injury are unlikely to be predicted by examination of more severe forms of TBI. Further, this suggests that treatments that have shown promise in moderate-to-severe injury may not be appropriate when used in mild injury.
There is an ongoing investigation on the utility of GFAP and UCHL1 as diagnostic markers for TBI. CSF and serum levels of these markers have been shown to increase after moderate-to-severe TBI, presumably as a result of tissue damage and their release into the circulating fluid. 54,55 We examined whether or not the tissue level of GFAP and UCHL1 were affected by mild TBI. Our findings, illustrated in Figure 9, showed that there was a delayed increase in cortical tissue GFAP after mFPI, consistent with reports of elevated GFAP after a diffuse mild injury. 56,57 In contrast, we detected an acute decrease in cortical UCHL1 expression after mCCI. Our observation of acutely decreased cortical tissue UCHL1 expression level is consistent with a recent article reporting no significant increase in UCHL1 release into serum after mild pediatric TBI. 58 Although we did not detect an increase in tissue levels of GFAP at earlier time points, this does not preclude its release into circulating fluids for its use as an early diagnostic marker.
Conclusion
Clinically, TBI presents as focal, diffused, or a combination of both pathologies. One of the major aims of the present study was to identify shared and unique molecular pathways activated subsequent to focal and diffused injury that may contribute to subsequent neurocognitive deficits after mTBI. Identification of common pathway(s) could lead to the development of mechanism-based therapies that can be used to treat both injury types. Our results indicate that local inflammation is a common feature for both mCCI and mFPI, and suggests that gene products with altered expression in the biological processes, molecular function, and signaling pathways identified in these studies could be targeted for therapeutic intervention. In addition, targets that are differentially expressed may be useful as part of a combination treatment consisting of common mechanism(s) combined with injury mode-selective (e.g., diffuse versus focal) targets. These strategies will need to be tested in future studies.
Footnotes
Acknowledgments
This work was supported by grants from the Department of Defense (DoD; W81XWH-08-2-0134), The Institute for Rehabilitation and Research/Mission Connect, and award number S10RR027359 from the National Center for Research Resources (NCRR). The content is solely the responsibility of the authors, and does not necessarily represent the official views of the DoD, the NCRR, or the National Institutes of Health.
Author Disclosure Statement
No competing financial interests exist.
References
Supplementary Material
Please find the following supplemental material available below.
For Open Access articles published under a Creative Commons License, all supplemental material carries the same license as the article it is associated with.
For non-Open Access articles published, all supplemental material carries a non-exclusive license, and permission requests for re-use of supplemental material or any part of supplemental material shall be sent directly to the copyright owner as specified in the copyright notice associated with the article.