
Abstract
Traumatic brain injury (TBI) is a major cause of morbidity and mortality. Identifying factors relevant to outcome can provide a better understanding of TBI pathophysiology, in addition to aiding prognostication. Many common laboratory variables have been related to outcome but may not be independent predictors in a multivariate setting. In this study, 757 patients were identified in the Karolinska TBI database who had retrievable early laboratory variables. These were analyzed towards a dichotomized Glasgow Outcome Scale (GOS) with logistic regression and relevance vector machines, a non-linear machine learning method, univariately and controlled for the known important predictors in TBI outcome: age, Glasgow Coma Score (GCS), pupil response, and computed tomography (CT) score. Accuracy was assessed with Nagelkerke's pseudo R2. Of the 18 investigated laboratory variables, 15 were found significant (p<0.05) towards outcome in univariate analyses. In contrast, when adjusting for other predictors, few remained significant. Creatinine was found an independent predictor of TBI outcome. Glucose, albumin, and osmolarity levels were also identified as predictors, depending on analysis method. A worse outcome related to increasing osmolarity may warrant further study. Importantly, hemoglobin was not found significant when adjusted for post-resuscitation GCS as opposed to an admission GCS, and timing of GCS can thus have a major impact on conclusions. In total, laboratory variables added an additional 1.3–4.4% to pseudo R2.
Introduction
T
Multiple studies have been conducted towards outcome prediction of TBI. However, systematic review has identified methodological issues in a majority of these publications. 4 –7 Specifically, sample size was often small, and three quarters of the reviewed studies had less than 500 patients. Recently, 11 large clinical trials and studies comprising the IMPACT database have been investigated for relations of clinical, computed tomography (CT), and laboratory variables towards TBI outcome. 8 A prediction model based on the IMPACT data, and validated on the CRASH trial data, 9 has also been presented. These studies have the advantage of large patient numbers, but the original studies, on which the data are based, were not conducted for outcome prediction modeling per se. Consequently, the available parameters are limited by those chosen in the studies, and are variable.
Age, Glasgow Coma Score (GCS), and pupil reactions are consistently found to be strong predictors of TBI outcome, 10 and CT variables have been shown to supply additional information. 11,12 These variables will hereafter be referred to as reference variables. In addition adverse events such as hypotension and hypoxia, especially early after TBI, have been verified as important predictors. 13
Laboratory values have been less extensively investigated in relation to TBI outcome. The IMPACT investigators examined glucose, hypo- and hypernatremia, pH, hemoglobin, platelet count, and prothrombin time for their associations with outcome, 14 finding all variables significantly related to outcome. Glucose was the most important prognostic laboratory variable, but prothrombin time appeared to explain most additional variance when controlling for reference variables. 15 Glucose 16 –20 and hemoglobin 21 have earlier been related to outcome, but controversy exists over safe levels. In addition, magnesium 22 and albumin 23 have been related to outcome, but therapeutic interventions with these substances may increase mortality. 24,25 Finally, several other studies have identified hypernatremia 26 and coagulopathies 27 –32 as associated with TBI outcome. More research is needed to clarify the importance and additional explanatory power of these additional variables in TBI prediction.
Most TBI studies are conducted on severely to moderately injured populations. The most common inclusion/exclusion criteria have been GCS levels. 33 The object has been to determine a group of patients thought most likely to benefit from treatments and interventions. This can be argued to be somewhat arbitrary as there is in our experience a substantial incidence of clinical deterioration and unfavorable outcome even in mild TBI (GCS 13–15). In addition, GCS has an appreciable inter-rater variability 34 and often varies dynamically during early evaluation. 10,35 Moreover, early GCS may be associated with other factors, such as multiple trauma or intoxication, and not directly related to brain damage. In light of the above, investigating relations to predictors in an initial broad TBI population may help identify selection criterion for future TBI studies.
In this study we focus on laboratory values that are implicated as important and commonly followed in TBI and trauma patients and explore their relations towards prediction of favorable/unfavorable outcome from information gathered within 24 h of hospital admission in a population of mild to severe TBI. Parameters are analyzed with linear and non-linear techniques, adjusting for reference variables. The goal is to ascertain the composite additional explanatory values of laboratory parameters. Such data mining must be recognized as hypothesis generating as opposed to hypothesis testing.
Methods
The study was approved by the local ethics committee on human research at the Karolinska Institutet and the Karolinska University Hospital. There were no interventions performed as part of this study.
Patient selection and data collection
All patients in the Karolinska TBI database from 1996 through 2001 (n=1029) were reviewed. This is an extensive database where TBI information is collected during the course of treatment and rehabilitation. A dedicated nurse in charge of database upkeep follows Glasgow Outcome Score (GOS) from questionnaires, interviews, or case notes. The population consists of all patients admitted to the neurosurgical unit, including ward and neurointensive care unit (NICU), due to TBI at the Karolinska University Hospital (referral population 1.9 million). The Karolinska is also the only level 1 trauma center in Stockholm and is the primary facility for most major trauma in the region. Patient care was standard neurosurgical and NICU practice as earlier described. 36 The TBI database did not contain laboratory variables.
For laboratory variables, case notes were retrospectively sought for all patients 15 years or older. A list of laboratory parameters implicated or believed as related to TBI or trauma outcome were compiled and sought from the case notes for the period within 24 h of primary admission (Table 1). Reference variables were primarily available from the trauma database, which where complemented with laboratory parameters. GCS was recorded from initial hospital admission (GCSadm). In addition, a post-resuscitation GCS (GCSresus) was recorded from the case notes as the best noted GCS within 24 h of admission. Pupils were noted as reactive/non-reactive and/or dilated/non-dilated. In addition, information on adverse events––hypotension (systolic pressure <90 mmHg), hypoxia (SaO2<90%), or seizures during the first 24 h—was noted. If any were noted, the case was marked as positive for an adverse event. The CTs of this group of patients have recently been reviewed and analyzed by us and CT data was therefore available for most patients. A CT scoring was used that has earlier been derived from patients in this database. 12 As this score was derived on this data, the inclusion of this score as a reference variable, for adjustment in regression analyses, will be near equivalent to including the CT variables.
Odds ratios and confidence intervals are shown for normalized data. For clarity the Wald (z) score is also given, indicating the level of significance (p<0.05 outside±1.96) in univariate analyses, and also showing the sign of the variable's regression. The Nagelkerke is a pseudo R2 test and gives an approximation of the explained variance (0–1). For laboratory values taken several times during the first 24 h, the highest and lowest values are recorded. The statistics are given when a variable is found significant (p<0.05), (n, non-significant). In addition, significant (*) laboratory parameters are indicated after adjusting for reference variables (age, Glasgow Coma Scale (GCS), pupil response, and CT score). Results when adjusting for reference variables using an admission (GCSresus) vs. post-resuscitation GCS (GCSadm) are shown separately. ALT, alanine transaminase; INR, international normalized ratio; APTT, activated partial thromboplastin time.
GOS (dead=GOS 1, vegetative state=GOS 2, severe disability=GOS 3, moderate disability=GOS 4, good recovery=GOS 5) was evaluated at three time points in the database: at neurosurgical discharge (GOS A), 3–6 month (GOS B), and ≥1 year (GOS C) after trauma. The highest score of these three (best GOS) was used in further analysis. 12 GOS was dichotomized as unfavorable (GOS 1–3) versus favorable (GOS 4–5) outcome. GOS 1 at any time point was marked as GOS 1 at all further time points. Patients with only discharge GOS (GOS A), where this was between 2 and 4, were excluded, thus retaining patients with only GOS A with level 5 in the study.
Univariate analyses
Univariate analyses of laboratory variables were performed in isolation and also adjusted for known important reference parameters (GCS, age, pupil response, CT score), with logistic regression. Missing reference parameters (0.5% pupil response and 8.0% CT score) were imputed with regressive imputation and results of imputated datasets were compared to case deletion. The accuracy of models was assessed by Nagelkerke's Pseudo R2. 37 The design package in the R statistical computing language was used for logistic regression. 38
Multivariate analyses and missing data
A multivariate logistic regression was performed, including reference variables and laboratory variables (those with <25% missing data), using multiple imputation (MI) to substitute missing data. MI is the preferred method for handling missing data that incorporates the uncertainty of the imputed data in regression analyses and has been shown to handle missingness in the range mentioned above and higher. 39,40 The need for standard transformations of input data was explored. Significant variables were identified with a step-down procedure. The MICE package for R was employed. 38
As a full analysis with all laboratory variables is not readily performed with the above method, and to enable non-linear properties of variables to be modeled in analyses, machine-learning technique was also employed for multivariate analyses, the relevance vector machine (RVM). This Bayesian method (explained below) also allowed for alternative handling of missing data. In RVM analysis predictions are based on compound probabilities. Missing data can be marginalized as to not affect prediction probabilities and, in contrast to logistic regression, need not be substituted to analyze the full dataset.
Non-linear multivariate regression/classification analyses
Full multivariate analyses including reference variables and laboratory variables were performed using relevance vector machines. RVM is an analysis method 41 akin to the prevalent support vector machine (SVM), 42 but uses Bayesian inference for regression or classification. Training data are typically transformed through a so-called kernel function, in our case a radial Gaussian basis function, to a non-linear hyperspace representation of the data. An optimum or most probable function towards outcome is then found with an iterative method, the expectation-maximization algorithm. In doing so the algorithm identifies a subset of the data as typical or “type” vectors that together define potentially non-linear decision boundaries. These are typically much fewer than the training data examples and hence RVMs and SVMs are denoted sparse kernel methods. RVM, unlike SVMs, immediately produce a probabilistic output, and results can thus readily be compared to logistic regression area under curve (AUC) and pseudo R2. These methods have a principled algorithm for optimization and are not subject to the trial-and-error decisions necessary, for example, in neural network construction.
The motivation for using RVM is to allow for non-linear properties of the data to contribute in prediction models, to evaluate this contribution, and to assess alternative methods of handling missing data. In addition, RVM inherently automates variable selection. Accuracies of models were determined as estimated explained variance with Nagelkerke's Pseudo R2 and AUC. The MATLAB code provided by Tipping (
Results of all multivariate regression analyses (logistic regression and RVM) are reported from test data only, after a 20-fold cross-validation procedure, and are thus results of internal validation.
Results
Patient selection and missing data
Of 1029 patients in the Karolinska TBI database from 1996 through 2001 (Fig. 1), 988 were ≥15 years of age. Of these, 32 patients were lost to follow up, 36 had no blood samples recorded, and 156 patient charts could not be located. Of the remaining, seven were excluded due to uncertain or late trauma in relation to hospital admission (>1 differenced trauma-to-admission dates). The residual 757 were used for analysis. Missing patient charts were believed caused by the then concurrent transitional process from paper to computer-based systems, but was not completely at random as trauma-to-admission time differed significantly (p<0.001) between non-missing and missing patients. The cause of this remains unclear, but 25% percent of these missing patient charts would additionally have been excluded by the trauma-to-admission time condition. There was a significant relation between GCSresus and “missingness” in lab variables. No significant relations were found between missingness and, gender, age, pupil responses, CT variables, first-admitting hospital, or GOS.
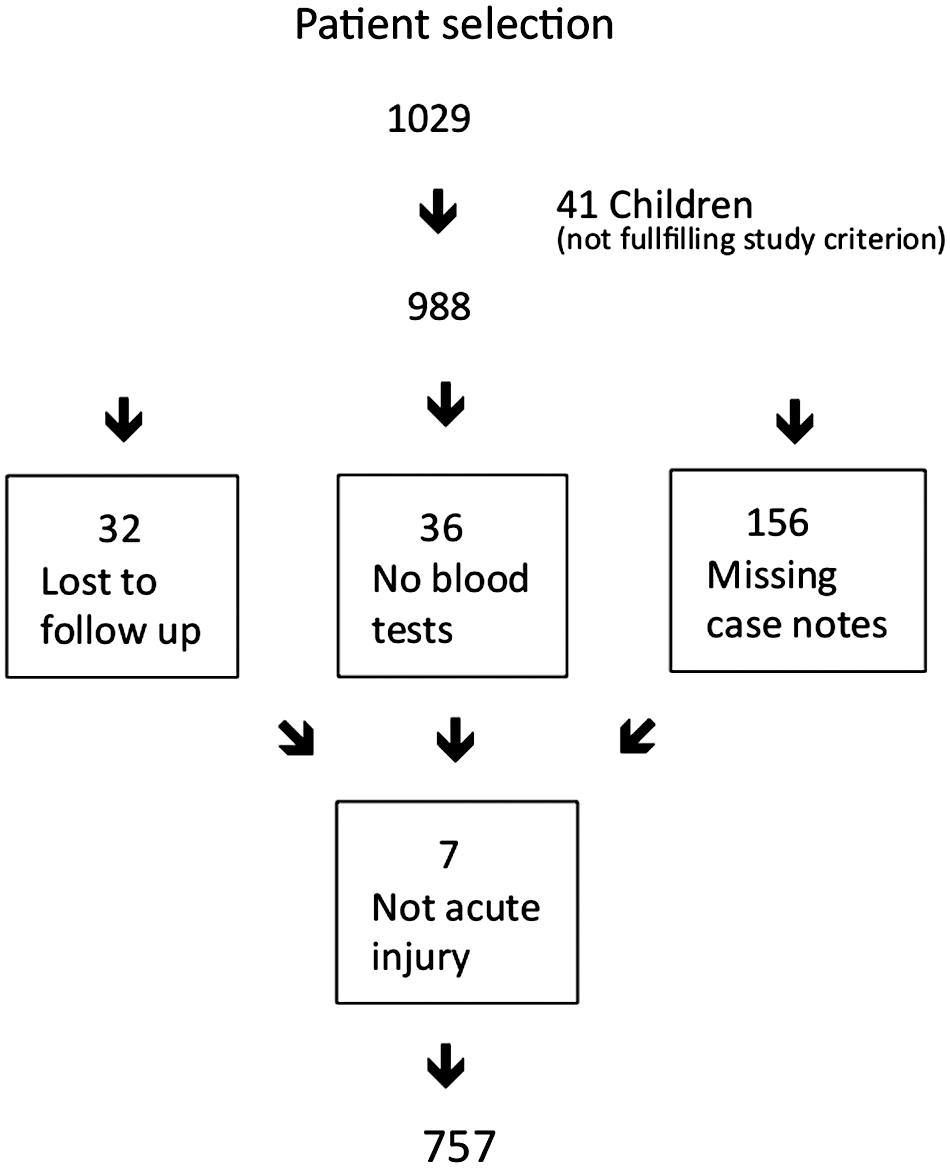
Patient selection.
Demographics
Age, GCS, and GOS distributions are shown in Figure 2. Seventy-four percent were male. Gender was not related to outcome in regression analysis. Fifty-two percent of patients were initially treated at a primary hospital. All but one patient had a closed head injury. The trauma profile was motor accidents 14%, bike 7%, pedestrian 6%, falls 56%, battering 13%, and other 3%. Of patients with available CT scans (7.9% missing), 14% had epidural hematomas, 43% subdural hematomas, 64% some degree of subarachnoidal hemorrhage or intraventricular blood, 49% contusions, and 7.0% CT visible indicators of diffuse axonal injury. GOS was evaluated at three time points and was available to GOS A (100%), GOS B (72.4%), and GOS C (66.0%), with 95.1% having GOS B or GOS C. As patients with only GOS A and of levels 2–4 were eliminated by the study inclusion criterion, all patients with only GOS A (4.9%) available were of level 5 and unlikely to deteriorate to an unfavorable outcome after discharge due to their TBI. This was also suggested by the data as all patients that exhibited any decrease of GOS level (7.1%) moved to GOS 1 (death), including the 0.9% that crossed over from a favorable to unfavorable outcome. In contrast, of the 12% that showed increasing levels of GOS after GOS B, 9.1% were crossovers from unfavorable to favorable, highly motivating the later GOS.
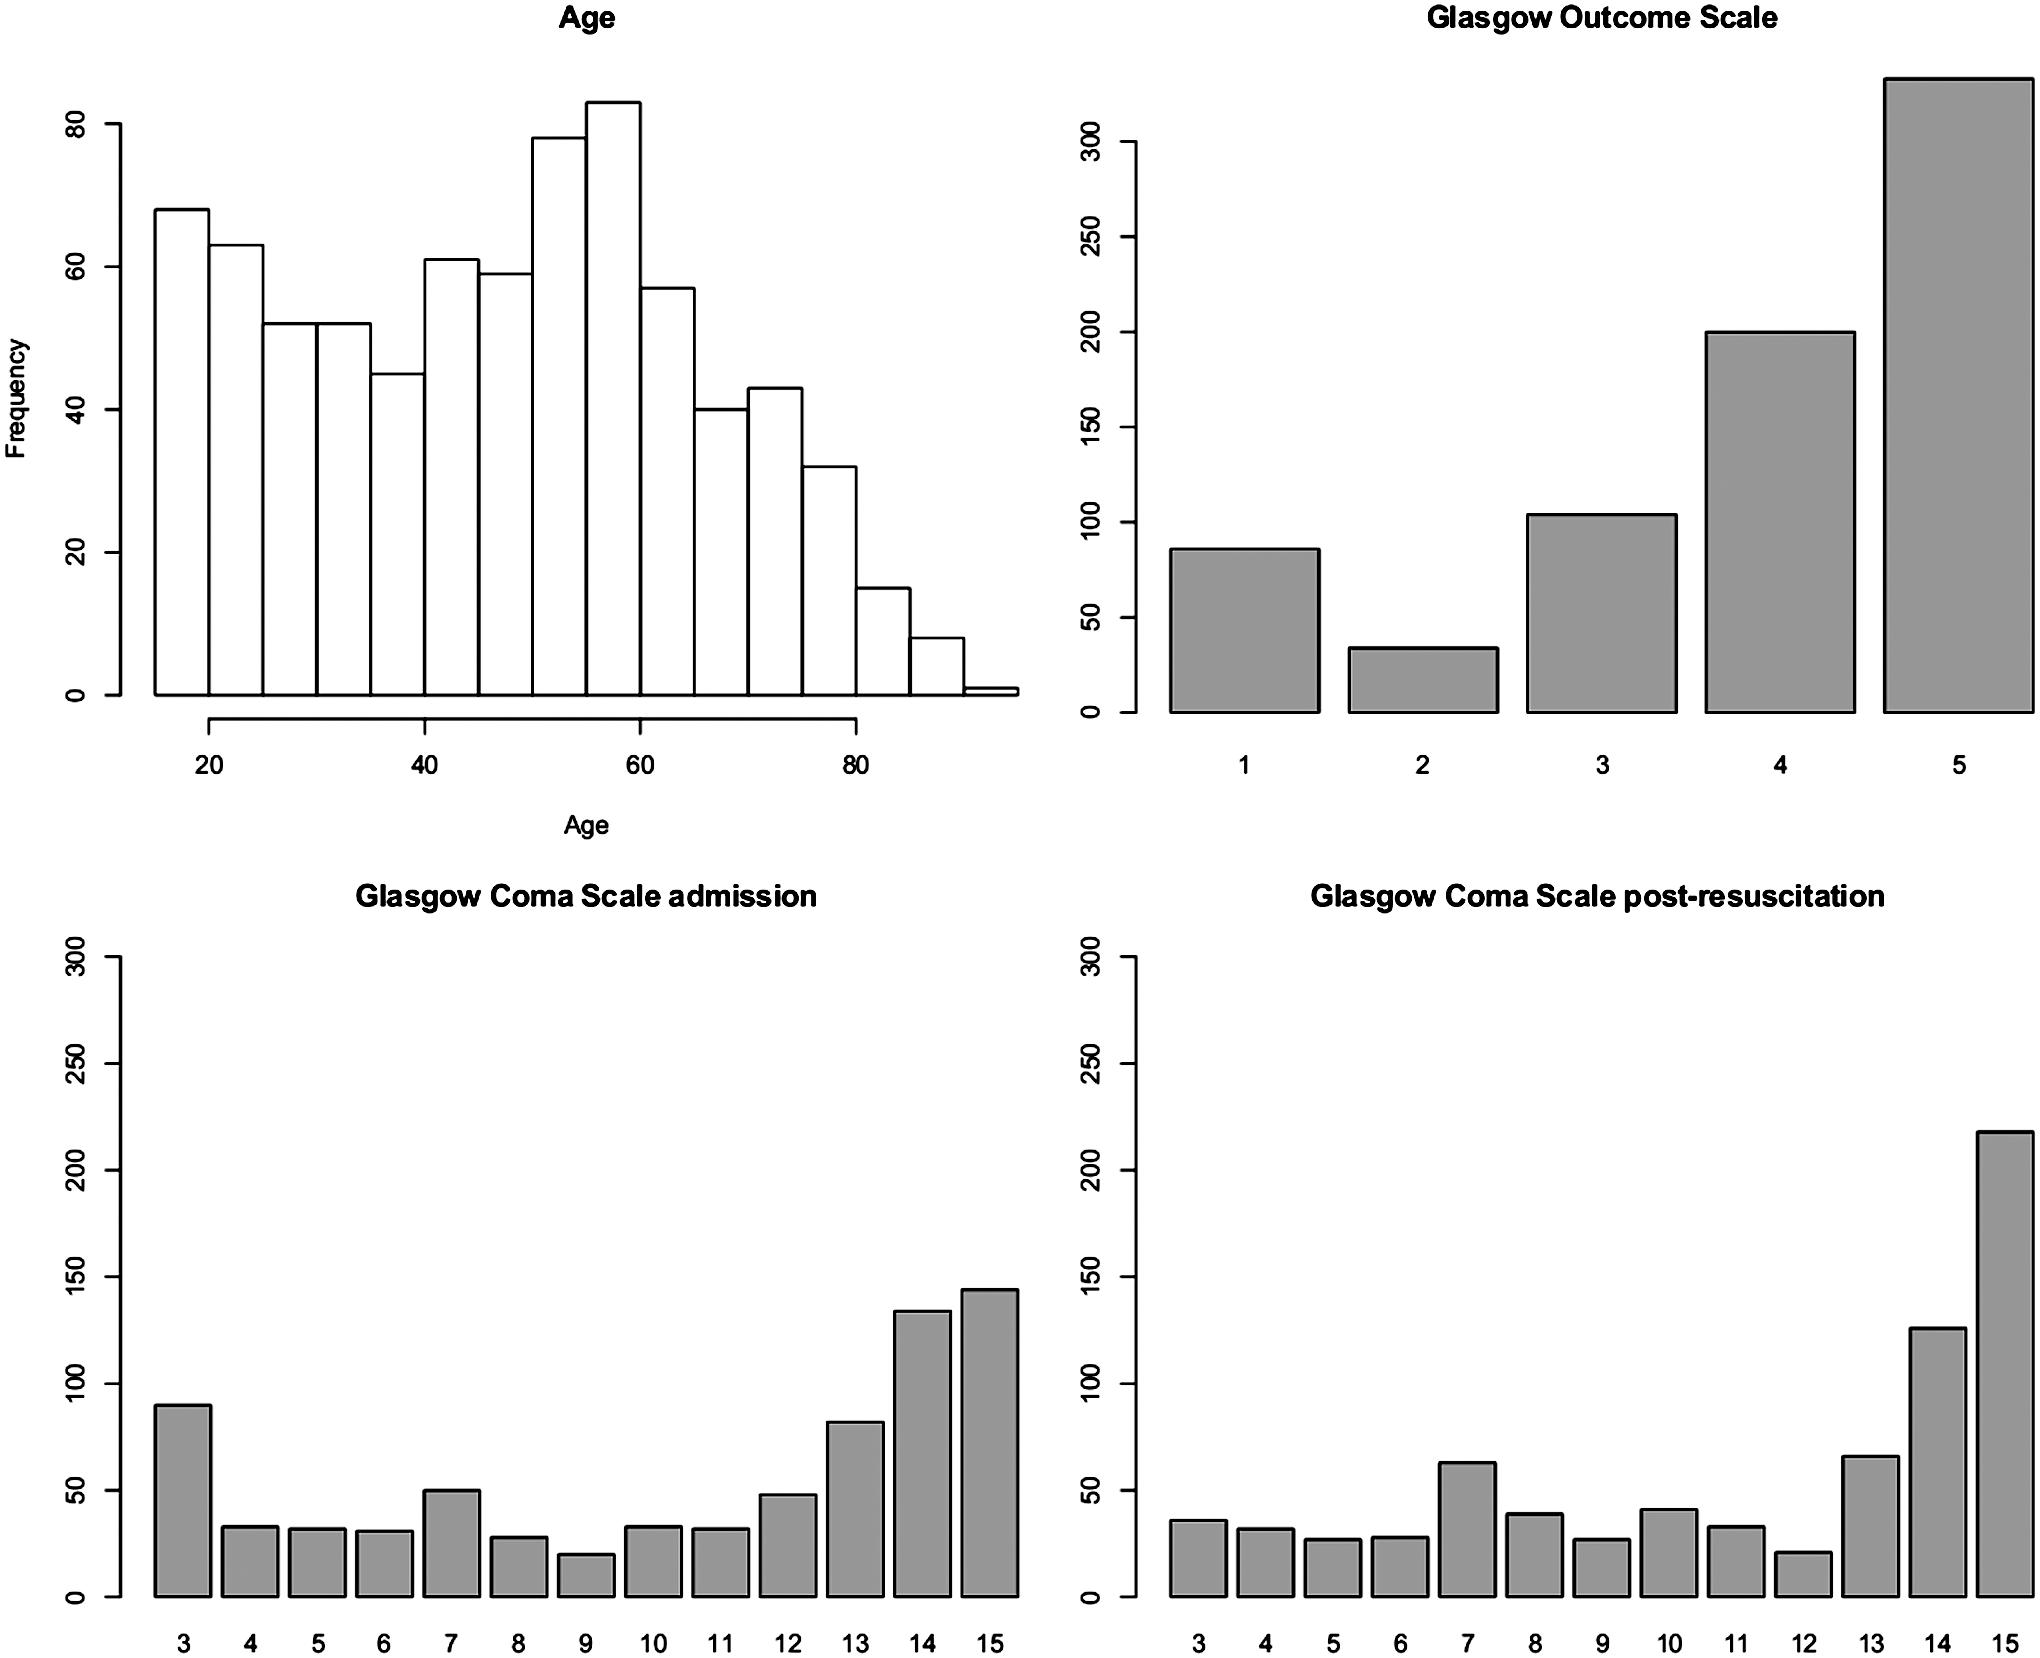
Distributions of age, Glasgow Outcome Scale, admission, and post-resuscitation Glasgow Coma Scale of the full study population (n=757).
Reference variables
GCSadm and GCSresus appear very different variables. GCSadm exhibits, univariately, a R2 of 0.25 towards outcome. GCSresus exhibits a pseudo R2 of 0.44 where motor, verbal, and eye independently exhibit 0.41, 0.36, and 0.33, respectively. The additive explanatory effect of reference variables and adverse events towards outcome are shown in Figure 3, indicating that the contribution of these variables greatly depends on which GCS is used. GCSresus is thus identified as a substantially stronger predictor variable. Marked differences are seen between GCSadm and GCSresus (Fig. 4), where most notably, less than one third of admission GCS 3s remain so post-resuscitation. The direction of GCS change from admission to post-resuscitation is shown (Fig. 4). As a GCS decrease after admission is thought to be highly related to outcome, the exhibited pseudo-R2 of 0.02 between GCS and dichotomized GOS, although significant, is unexpectedly weak.

Incremental addition of known predictors of traumatic brain injury. Accuracy of outcome predictions from logistic regressions are assessed with Nagelkerke's pseudo R2, estimating explained variance for a binary outcome (favorable=GOS 4–5, unfavorable=GOS 1–3). Addition of age, pupil response (Pup), CT score, and adverse events (Adv ev) are shown for Glasgow Coma Scale (GCS), from admission (GCSadm) and post-resuscitation (GCSresus) separately.

Differences in admission and post-resuscitation Glasgow Coma Scale (GCS) are shown with a mosaic plot and histogram. The area of a square on the mosaic plot will be proportional to the occurrence of the corresponding values. Notably, less than one third of the patients with GCS 3 at admission are seen unchanged after resuscitation.
Univariate and reference adjusted analysis of single laboratory variables
Laboratory variables may be significantly related to outcome when viewed separately, but in effect are merely associated with other strong known predictor variables. Univariate and reference adjusted analyses of individual laboratory values towards favorable/unfavorable outcome are shown in Table 1. As each variable has different missing values, each analysis comes from a different subpopulation. These subpopulations are clearly related to TBI severity as the subpopulation size is related to percent favorable outcome. Data can thus not be assumed randomly missing, which has implications on handling of missing values. Most laboratory variables are found significant in univariate analyses but few are left significant when adjusting for reference variables. Increasing values of glucose, creatinine, osmolarity, and alanine transaminase (ALT) and decreasing values of albumin appear as the only independent predictors of unfavorable outcome when GCSresus is included as a reference variable. Several additional parameters are found significant when using GCSadm instead of GCSresus.
Visual inspection of variables
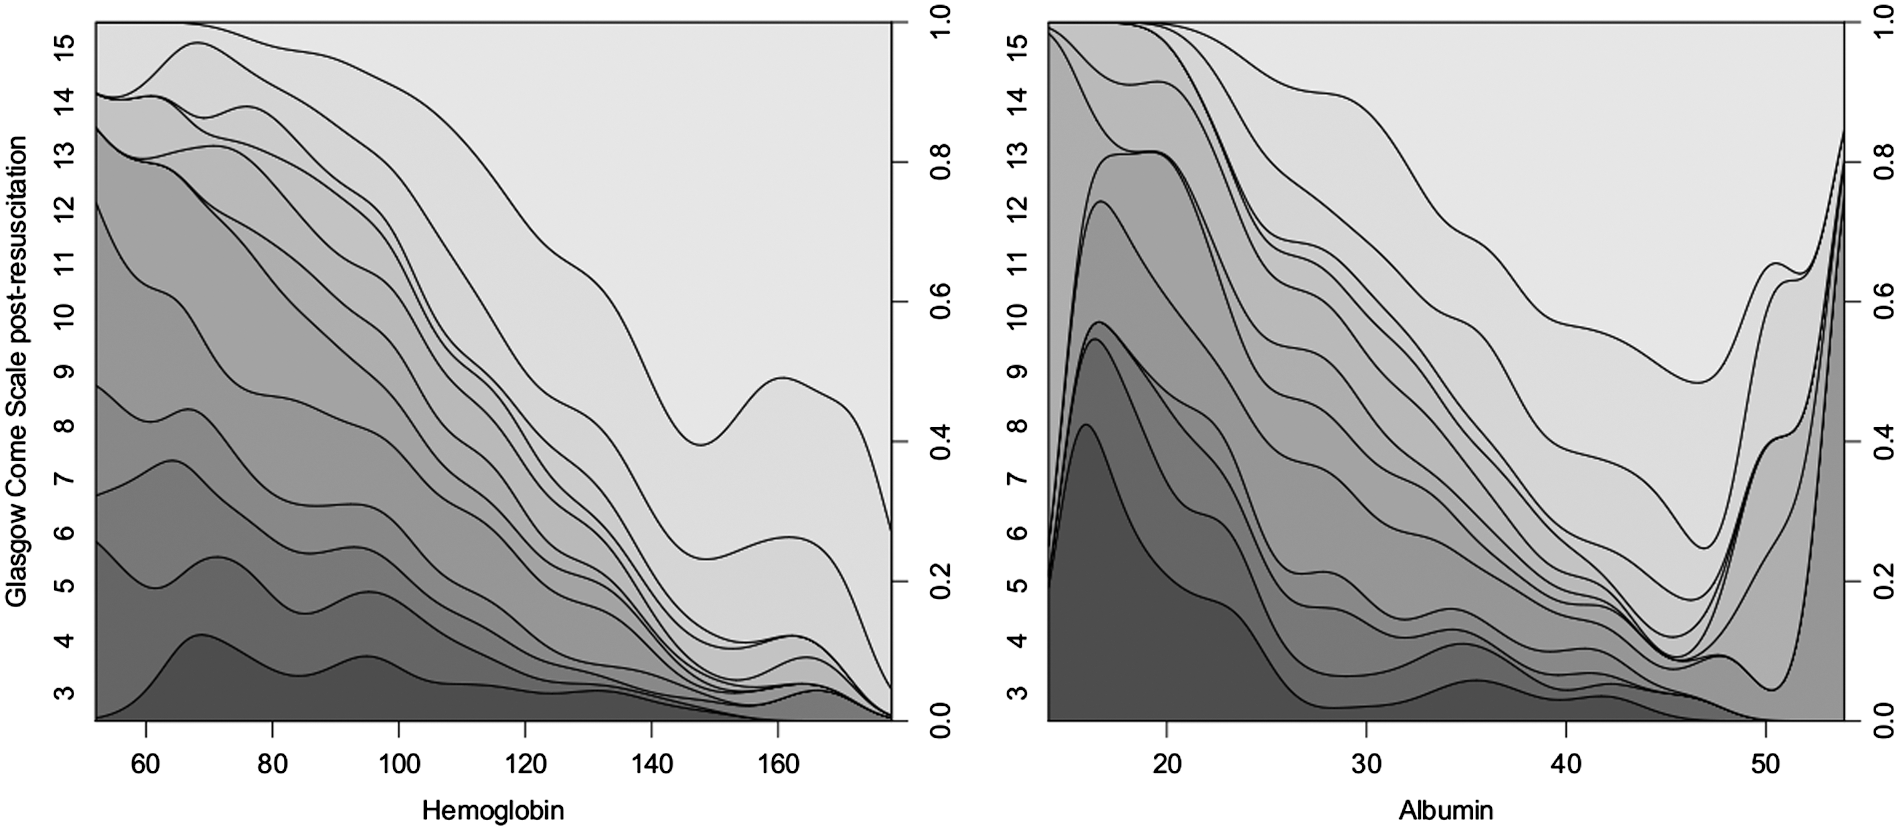
Variables from Table 1 are inspected visually with conditional density (CD) plots (Figs. 5 –7). The CD plot shadings shows the relative frequencies of GOS levels (left y-axis) for given lab values (x) all summing up to 1 (right y-axis). The conditional probability distribution of the underlying data is shown as an overlay (no relation to axes but area under curve will sum to one) so that the relative amount of data at any given x value can be ascertained. These plots portray potentially interesting relationships in the data showing complex non-linearity that may not translate to significance in regression analyses. Regions with smooth curves reflect consistent relations in the data and regions with distorted curves a variable relation. Variable relations are more likely in regions with limited data. Thus, a smooth relation over a region with limited data has little variance, implying a strong relationship. As suggested in univariate analyses, most variables show a relationship to outcome when viewed in this manner. Hemoglobin (Fig. 5), the strongest predictor in univariate analyses, shows a smooth and convincing relation to outcome over a wide range. Strong interdependencies between hemoglobin, albumin, and GCSresus (Fig. 8) exemplify cause for variables to be found non-significant after adjustment. In addition, there are associations between laboratory variables, the strongest correlation being between hemoglobin and albumin (R2=0.39, data not shown).
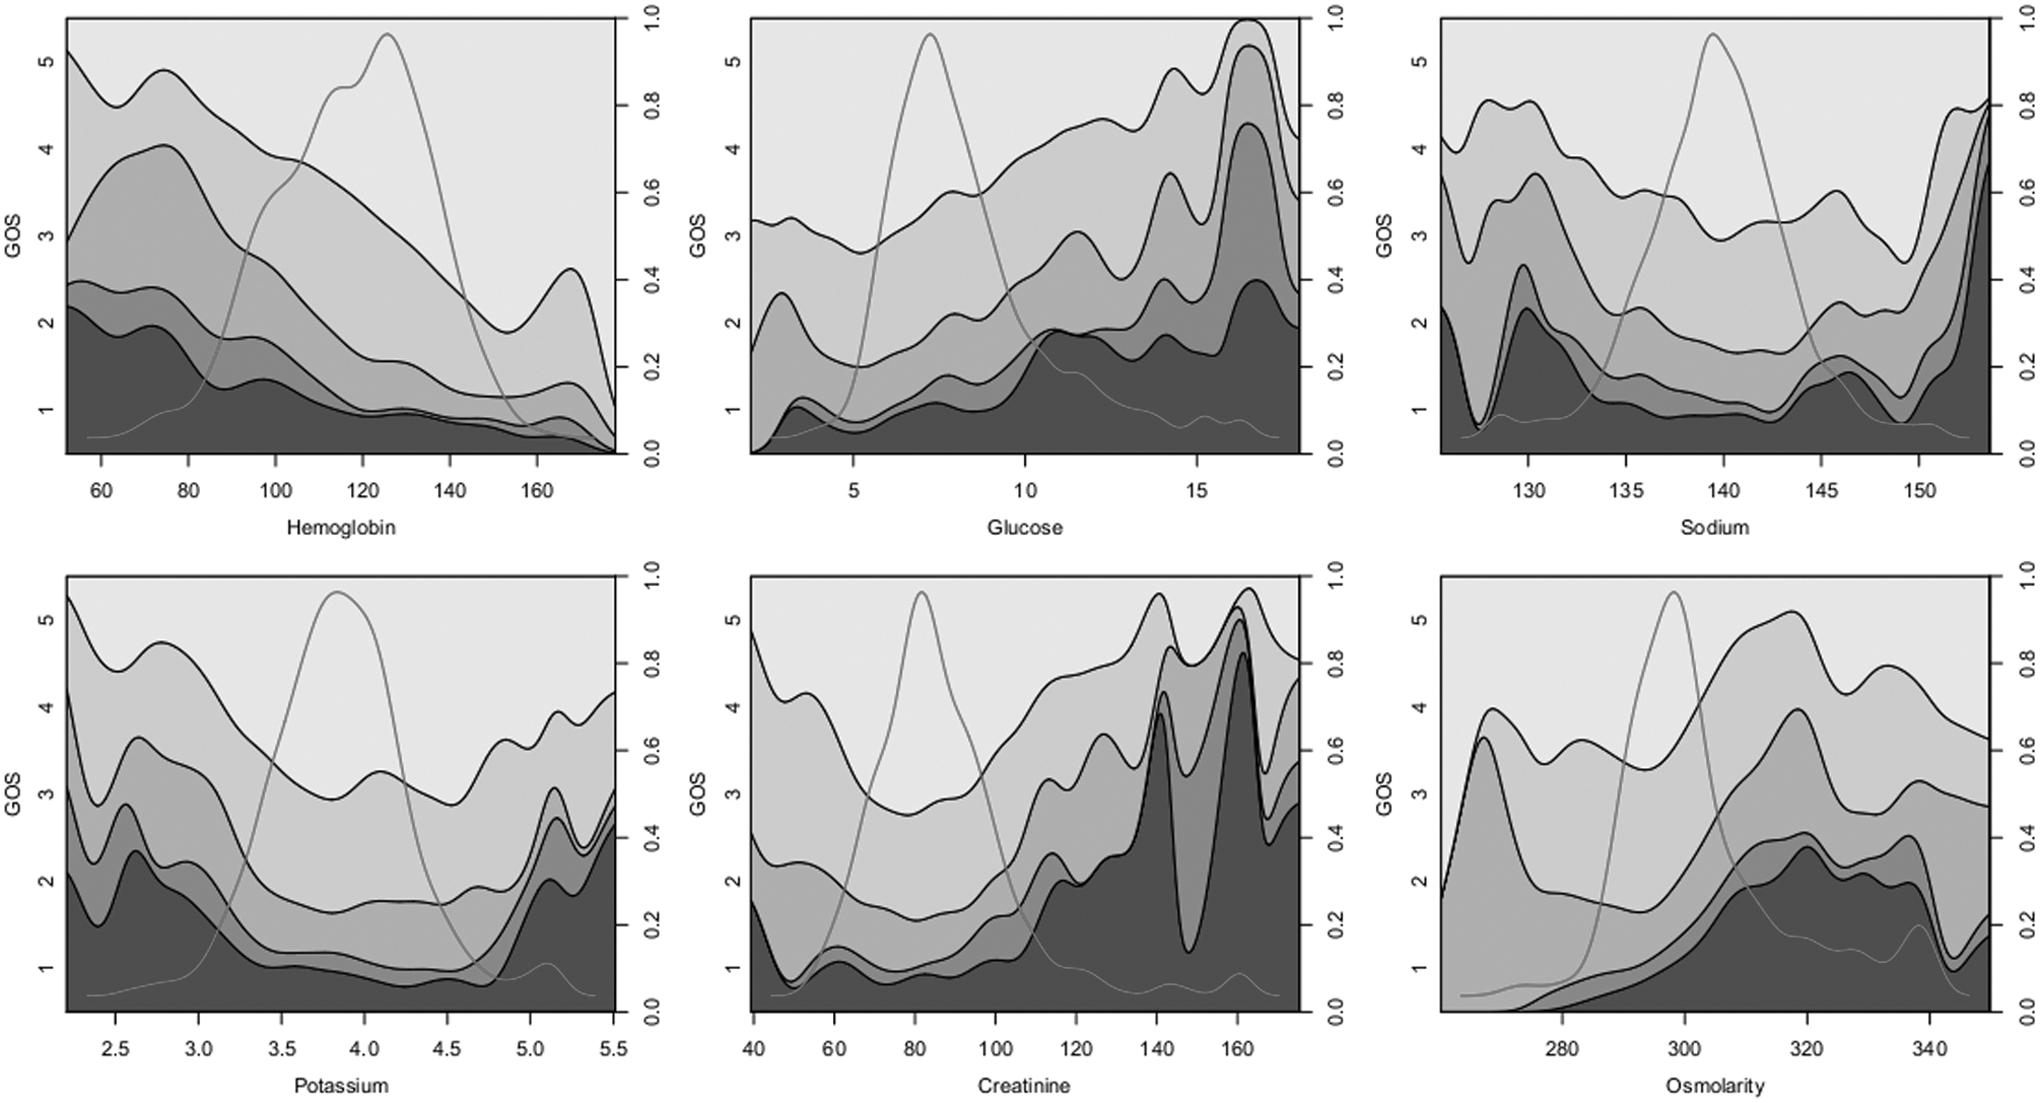
Conditional density (CD) plots for various laboratory values showing the proportional distributions of GOS as shadings (left y-axis) for varying levels of laboratory parameters (x-axis) with units as in Table 1. The levels of GOS will sum to one for any x value (right y-axis). The distribution density (similar to a histogram) of the variables are also shown as overlays to show data distribution along the x-axis. Their area-under-the-curve will sum to one; their heights bear thus no relevance to the y-axes. It is the line between GOS 3 and 4 (unfavorable vs. favorable outcome) that is tested for significance in Table 1. A limiter is set for variables at +/− 3 standard deviations.

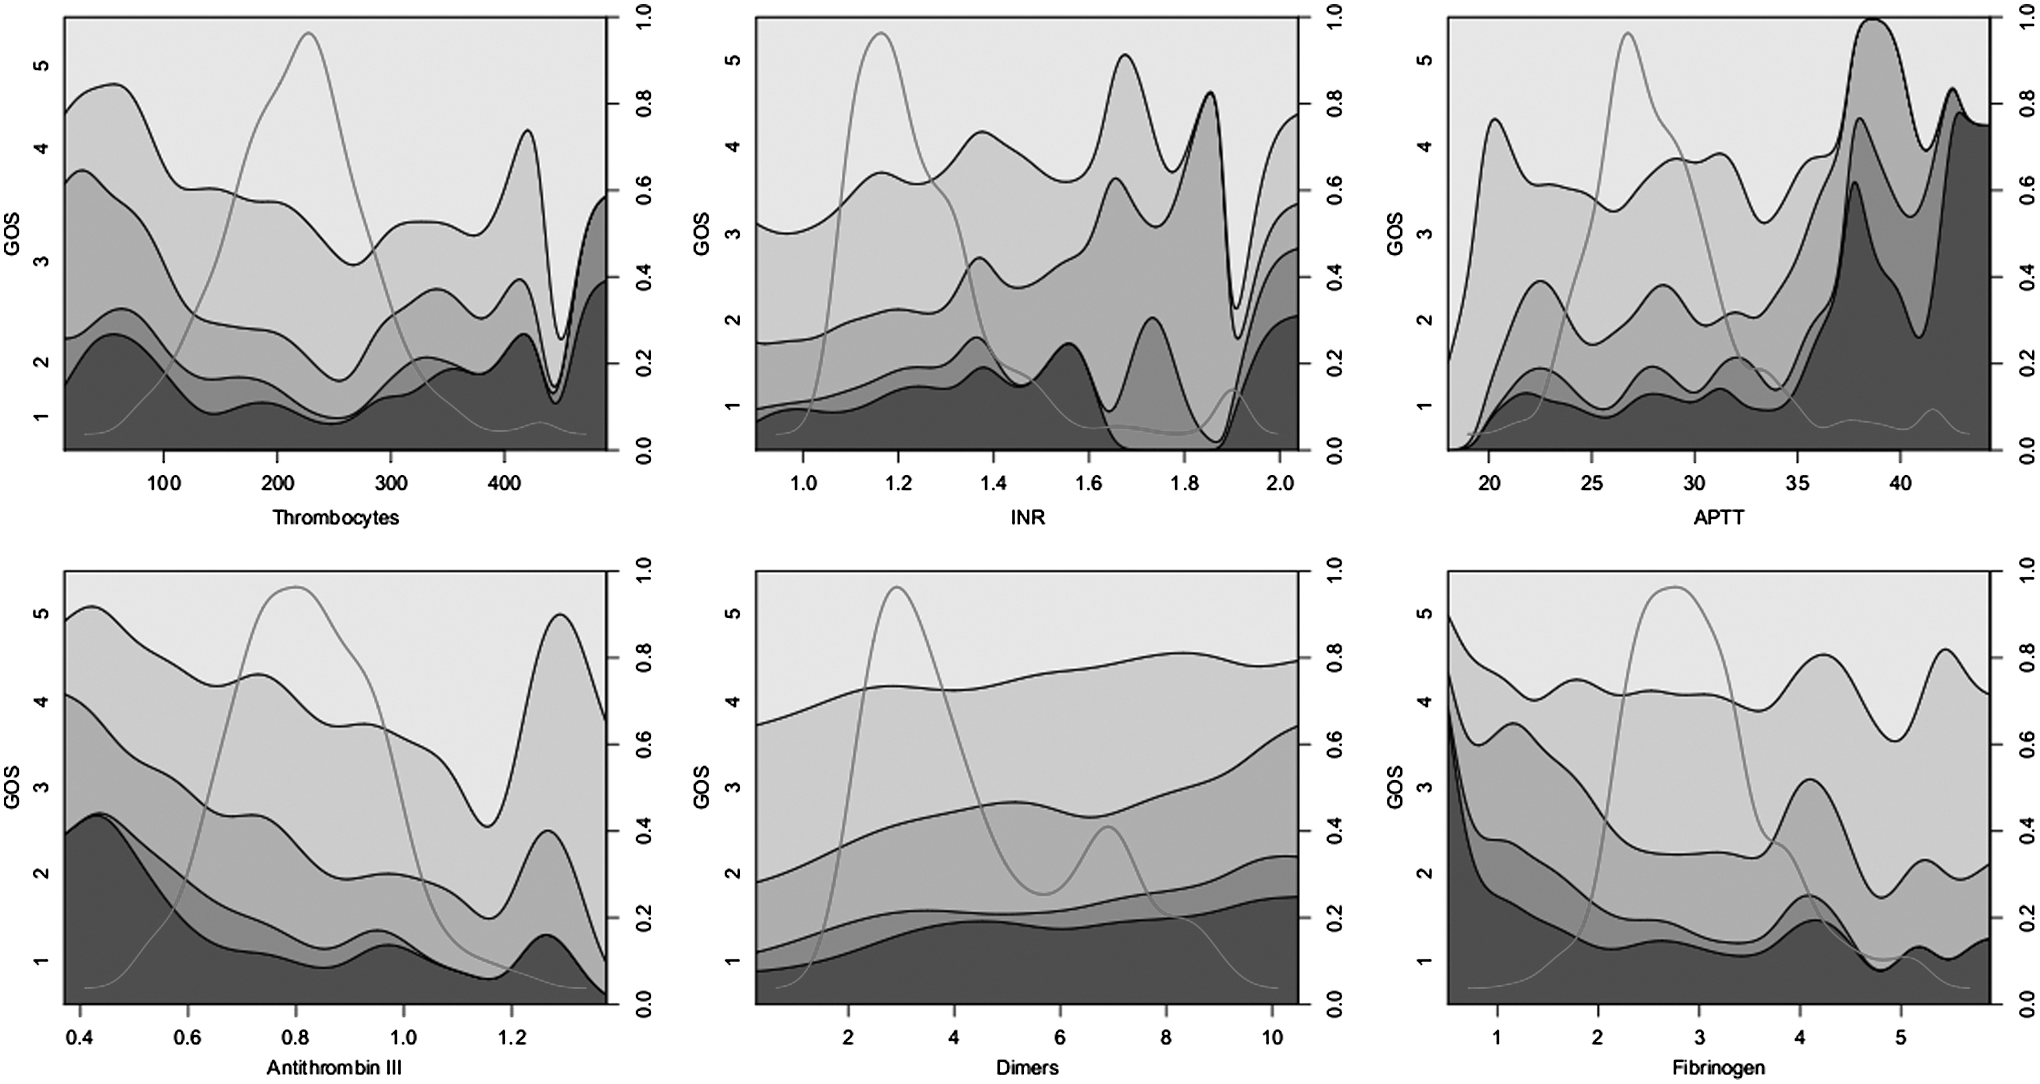
Conditional density (CD) plots for various laboratory values showing the proportional distributions of GOS as shadings (left y-axis) for varying levels of laboratory parameters (x-axis) with units as in Table 1. The levels of GOS will sum to one for any x value (right y-axis). The distribution density (similar to a histogram) of the variables are also shown as overlays to show data distribution along the x-axis. Their area-under-the-curve will sum to one; their heights bear thus no relevance to the y-axes. It is the line between GOS 3 and 4 (unfavorable vs. favorable outcome) that is tested for significance in Table 1. A limiter is set for variables at +/− 3 standard deviations.
Conditional density (CD) plots for various laboratory values showing the proportional distributions of GOS as shadings (left y-axis) for varying levels of laboratory parameters (x-axis) with units as in Table 1. The levels of GOS will sum to one for any x value (right y-axis). The distribution density (similar to a histogram) of the variables are also shown as overlays to show data distribution along the x-axis. Their area-under-the-curve will sum to one; their heights bear thus no relevance to the y-axes. It is the line between GOS 3 and 4 (unfavorable vs. favorable outcome) that is tested for significance in Table 1. A limiter is set for variables at +/− 3 standard deviations.
Relations of hemoglobin and albumin to Glasgow Coma Scale (GCS) are shown with conditional density plots.
Glucose (Fig. 5) also exhibits smoothness over a wide range, without any readily identifiable high or low safe cut-offs. In contrast to hemoglobin, increased glucose remains, in Table 1, an independent predictor of unfavorable outcome after adjusting for reference variables. The relation to other variables is complex and there is a significant interaction between glucose and age.
Several other variables deserve inspection. Variables such as sodium and potassium (Fig. 5) exhibit u-shaped relations to outcome with reasonable smoothness at the edges of distribution, strengthening the argument that this relationship is meaningful. However, the limited amount of data in these regions restricts their possible contribution to explained variance. In addition, the u-shapes may need non-linear adaption in regression analyses. Osmolarity (Fig. 5) is found to be a predictor of outcome independently of our reference variables. Curiously, increasing osmolarity predicts worsening outcome starting at levels even in the normal range (Table 1). ALT (Fig. 6) was also found to be an independent predictor of outcome but here the CD plot appears highly variable, suggesting that this finding may be incidental and significance a spurious effect of multiple testing. Several coagulation parameters (Fig. 7) show interesting properties and thrombocytes may exhibit a cut-off level around 100*109/L. Antithrombin III exhibits a convincing relation on the CD plot in ranges with much data. However, it is not related to outcome when adjusted and is correlated to both albumin and hemoglobin levels (R2=0.19 and R2=0.15, respectively, data not shown). No single coagulation parameter was found significant towards outcome when reference adjusted with GCSresus.
Mulitvariate analysis
Handling missing data with multiple imputation incorporates the uncertainty of data imputation itself in analyses. Those variables having less than 25% missing data (Table 1; hemoglobin, sodium, potassium, albumin, glucose, creatinine, thrombocytes, and INR) were considered for analysis with multiple imputation of missing data and logistic regression. These analyses identified glucose, creatinine, and albumin as significant (p<0.05) predictors of unfavorable outcome after adjusting for reference variables including GCSresus. Again, hemoglobin was additionally significant when instead GCSadm was used among the reference variables.
Results of multivariate analyses, sequentially adding reference parameters, are shown in Table 2. RVMs were performed with all available laboratory variables. In logistic regression, the laboratory variables considered suitable for multiple imputation (as above) were used with a step-down variable selection. The laboratory parameters in this study are in aggregate found to contribute an additional 1.3–1.8% estimated explained variance in excess of the reference variables. The best R2 corresponded to an AUC of 0.92. The non-linear capabilities of RVMs and the extra variables appear to capture some additional information, but logistic regression results are comparable, thus not identifying important non-linear components of the data as imperative in predictions. It can be noted, though, that the addition of estimated explained variance from the non-linear component of age and GCS alone is on par with the contribution of laboratory parameters. The choice of GCS is again seen to affect R2 more than the addition of CT, pupil reaction, and laboratory values as predictors.
Shown for logistic regression and relevance vector machine (RVM) analyses. Results are given as estimated explained variance of models with Nagelkerke's pseudo R2. Admission GCS (GCSadm) vs. post-resuscitation GCS (GCSresus) are shown separately. The motivation for using RVMs is to capture non-linear properties possibly enhancing prediction and to use an alternative method for handling missing data. The objective is to assess the maximum added information from lab variables in the presence of known important predictors of TBI (n=757).
Prognostic targeting
Two variables will suffice to confidently predict two large regions of the data: young patients with high GCS and old patients with low GCS. The non-linear prediction surface of a RVM, using only age and GCSresus as explanatory variables, is shown in Figure 9, along with prediction error. Inherently, prediction error is greater in regions where predictions are uncertain. This region of uncertainty is where a need for better understanding of TBI predictors is necessary, and may need to be sought. An important observation is that this region extends to patients with GCS ≥12 already at ages above 50, a common exclusion criterion in TBI research. In the subgroup of 233 patients, selected by prognostic targeting as suggested by Roozenbeek and colleagues, 3 excluding all patients with predicted probabilities of favorable outcome >80% or <20% increased uncertainty, reflected in the fact that the estimated explained variance was now reduced and at most 20% in multivariate analysis. Additional predictors, other than GCS and age, will now consequently contribute proportionately more. In this smaller group, only osmolarity and creatinine were found significant after reference adjustment, but with lab values now adding 4.4% composite estimated explained variance.

Predications of outcome from a relevance vector machine using age and post-resuscitation Glasgow Coma Scale (GCS) as sole predictors. (
Discussion
Many laboratory variables have been related to TBI outcome or are commonly followed in TBI patients. This article explores relations towards outcome prediction for 18 common laboratory variables from 757 patients. Although most variables were found significant towards outcome in univariate analysis, and many showed convincing relations to outcome visually on CD plots, few remained so when controlled for the known strong predictors, age, GCS, pupil response, and CT score. Adjusted analyses found laboratory parameters added 1.3–4.4% extra explained variance to predictions, depending on subpopulations related to TBI severity. Creatinine was identified as a significantly independent predictor in all analyses, but we interpret this predictor mainly as a marker of pre-morbidity. In addition, glucose, albumin, and osmolarity were variably significant, depending on analysis method. Notably, hemoglobin levels, found highly significant in univariate analysis, were not significant when adjusted for reference variables including a post-resuscitation GCS.
Of the above four laboratory variables (creatinine, glucose, albumin, and osmolarity) that appear most convincingly associated to outcome in our study, osmolarity has unanticipated properties. Unexpectedly, increasing osmolarity (n=375) appears related to both death and unfavorable outcome already at levels considered normal (Fig. 5). This level could in part be an effect of recording the lowest osmolarity found, thus shifting the curve, as 99 patients had more than one value available. Additionally, the observation that increasing osmolarity is associated with worse outcome could itself be linked to TBI severity, coupled to a potential use of osmotherapy. Although mild hypernatremia, the major component of serum osmolarity, has been related to unfavorable outcome, 26 a worse outcome is seen in our study at a sodium cut-off of around 150 mmol/L, a level found in few patients (Fig. 5) and thus not greatly affecting multivariate accuracy. Likewise, the co-relationship between osmolarity and outcome may simply reflect a relationship between glucose and outcome (Fig. 5), glucose also being a contributor to serum osmolarity. Therefore we cannot establish if this observation is an additive effect of the individual components affecting serum osmolarity (including possible alcohol content and mannitol) or a compound effect of osmolarity itself. As osmotherapy is central to treatment of intra-cranial hypertension, and in light of the increasing use of hypertonic sodium solution (although our data was collected prior to the widespread use of hypertonic solution), the relation of osmolarity and outcome in our study may warrant further investigation.
Laboratory variables are found to have multiple interdependencies, reducing their combined role as predictors in TBI. A recent study has highlighted such complex inter-relationships of laboratory variables in TBI. 43 Notably we identified strong relations between hemoglobin and albumin (R2=0.39). In addition, laboratory variables are highly related to reference variables. Specifically hemoglobin and albumin were shown to be strongly associated to GCS (Fig. 8). As hemoglobin levels are unlikely to directly affect GCS over such a wide range (Fig. 5) and TBI rarely alone causes major bleeding, it is reasonable to assume that both are related to other unaccounted potential confounders, such as a general trauma severity grade, resuscitation therapy, or co-morbidity. This may also apply for several other variables in this study that are also known general predictors of ICU outcome, as in the APACHE II score. In agreeement with the IMPACT study, 14 most of our laboratory variables are found significant in univariate analysis, but unlike the IMPACT study, few remain so when controlled for known strong predictors. This may in part have to do with sample size and our wider population, but is also likely an effect of using a 24 h GCSresus. Arguably the later a GCS is taken, the closer it comes to being an outcome parameter in itself. The inclusion criterion and timing of GCS vary greatly in the studies of the IMPACT data. Although the TCDB data was based on a “worst” GCS within 48 h and the UK4 data has a time window of 72 h, the clinical trials have enrollment time windows ranging from 4 to 24 h, with earlier evaluations dominating. An effect of using a late 24 h GCSresus in our study is that hemoglobin, which shows a convincing relation to outcome on CD plots and with 15% estimated explained variance in univariate analysis, is not found to be an independent parameter of outcome. Interestingly, low hemoglobin would be found a highly significant variable related to unfavorable outcome in a study using only GCSadm (p=0.002), but non-significant in a study using only GCSresus (p=0.49), with our data. The choice of GCS could thus greatly alter conclusions in studies geared to identify safe levels of hemoglobin in TBI. In aggregate, though many laboratory parameters show a relation to TBI outcome, there is a high degree of interdependency among variables and possibly also to general ICU outcome prediction, limiting their additive explanatory effects in TBI outcome prediction.
The CD plot provides an intuitive visualization of laboratory variables. Many of the laboratory variables show interesting and visually convincing relations to outcome that, again, do not represent much added explanatory information towards outcome. This would appear contradictory, but does not necessarily mean that they are without true relation to outcome. Inherently, interesting relations appear when variables are out of normal range. These regions will have little data by nature, and thus also limited effect on added explained variance and significance in regression. However, regions exhibiting smooth relations even in areas of limited data suggest believable correlations. These coincide generally, in our estimation, with clinical cut-offs and beliefs with the possible exception of osmolarity. Combined variable critical values (data not shown) were derived merely summing the number of non-normal (outside of reference) laboratory variables for each patient. This was, not unexpectedly, highly related to outcome (not shown) and complies with the notion that the “state” of trauma may be reflected by the amount of deviations from normality as by the individual levels of markers themselves. The idea that RVMs could aggregate these multiple weak marker contributions, and translate them to additional explained variance, was however not substantiated. Confident of the non-linear capabilities of the RVM methodology, we interpret this such that the non-linear properties of this dataset do not contribute extensively to prediction accuracy. In aggregate, the multiple relations to outcome convincingly seen on CD plots for many variables and, outside of regions with much data, do not seem to render a substantial increase of explained variance despite non-linear analytical methods. We suspect that this is not only a cause of their low incidences, but reflects that many parameter values are the effect of a general trauma response or state in which these variables are non-independent and need not be causal or even solely TBI related.
We identified a structure to missingness in the data where it is partly related to patients with a longer time from trauma to hospital admittance and to GCS. Data are thus not MCAR (missing completely at random). We cannot fully identify the cause of this systematic loss but note that 25% of these patients will also be excluded as not “ acute” TBI, in at least partially limiting this potential bias. In addition, two forgiving properties of the data may partially offset a problem of non-random missingness: (1) missingness is partially modeled in predictors and can be seen related to GCS and time to hospital admittance, and (2) missing data is more likely to be normal when not taken and less laboratory tests are taken in healthier patients. These properties imply that a MAR (missing at random), as opposed to a MNAR (missing not at random), assumption is plausible and multiple imputation valid. In addition, as this is an observational study, geared for hypothesis generation, there is an interest to identify the importance of lab values taken in the clinical context that has motivated them, and for that selected population.
Given the above, we deem that the RVM analyses also can generate a fair estimation of the contribution of variables, including those with less data. The RVMs provide a compelling method to address missing data. In effect predictions are compounded probabilities derived from where data exit, ignoring missing data. Although the need for non-linear methods does not appear imperative here, it should be noted that the non-linear contribution towards predications from age and GCS alone are in par with the total contribution of laboratory parameters (Table 2).
Our GOS strategy, albeit seemingly unorthodox, may offer insights obscured to a conventional 6 month GOS. As this study is performed, not to construct prediction models that need to be general, but to investigate observational relations between TBI outcome and laboratory variables, it is advantageous to have an outcome that is most closely related to the initial course or “structural” TBI damage. A 6 month, GOS is commonly used by convention, but it is well established that many patients improve after 6 month. In addition patients have many possible reasons to deteriorate after discharge that can be unrelated to a progressive “structural” change caused by the initial TBI. We have particularly noted that patients that crossover from favorable to unfavorable outcomes after discharge most commonly die. The few patients only evaluated at discharge will be recorded as missing if not dead or with a good recovery (GOS=5) and are thus highly unlikely to change GOS dichotomies later because of the initial TBI. In aggregate, we postulate (supported also by the fact that this GOS strategy is substantially easier to predict) that a best GOS strategy will provide an outcome that better lends itself to explore relations between early predictors and outcome.
To seek better understanding of factors affecting TBI outcome, studies may benefit from excluding the large group of patients in which outcome predictions can already confidently be made and focusing on areas of uncertainty where outcome is yet unexplained. This may make more efficient use of patient materials but will affect patient recruitment. 44 Stratifying patients 45,46 from prediction models as inclusion criterion has also been suggested and attempts to reach consensus on this subject have been taken. 33 In our study, much of outcome can in large part be predicted with just two variables: age and post-resuscitation GCS. Including patients in studies along this axis of uncertainty, as seen in Figure 9, could help more easily identify unknown factors that can potentially be influenced. Notably, a current common practice of including patients with GCS ≤12 appears to exclude a substantial proportion of patients in this area of uncertainty, already at ages above 50. Two parameters, age and GCSresus, appear in our estimation to contain the dominant information needed to construct simple inclusion/exclusion criterion. In addition, the unreliability of early GCS and the superiority of a 24 h GCSresus, which have been described earlier, 10,47 have to our knowledge not been quantified previously in this manner. Our study indicates that the timing and choice of GCS are crucial, may have a major impact on study conclusions, and will need to be better standardized in TBI studies. A within 24-h stabilization may, however, not be feasible in many study situations, especially interventional.
We admit weaknesses in this study. As discussed, we suspect that much of the variability of laboratory parameters may be part of a general trauma response that may or may not be TBI related. A weakness is that we did not at this time point register any score relevant to extracranial injuries, known to be another important prognostic factor in TBI. 48 Another potential weakness is that this is a single center study. However, this may also have advantages in that it may provide for a more homogeneous database, allowing for closer inspection of the relation between variables and outcome. Our high R2 values may to some extent reflect this, but are mainly caused by the mild TBI study population. An additional point is that we have employed the CT scoring system that was derived on this dataset, which could risk inflate its contributing or diminishing the potential contribution of laboratory parameters. We do not believe this to be the case as it was derived from a cross-validation process, and will have similar impact on adjustment as including the components of CT score.
Conclusion
We conclude that most of the laboratory parameters in this study are significantly correlated to outcome in the univariate setting, but few are so after adjusting for important known predictors of TBI outcome (age, GCS, pupil response, and CT score). Of the 18 common laboratory variables, increased creatinine, glucose, osmolarity, and decreased albumin appear most related to outcome. The observation that worse outcome was related to increasing osmolarity, even within normal range, may warrant further study. Complex dependencies of laboratory parameters limit their composite contribution towards explaining outcome. The choice of GCS and admission, over late post-resuscitation and its timing, are identified as having a major impact on study conclusions and may require future standardization.
Footnotes
Acknowledgments
Funding for this study was provided in part by the Regional Agreement on Medical Training and Clinical Research (ALF) between Stockholm County Council and the Karolinska Institutet, funds from the Karolinska Institutet, The Swedish Research Council, and The Swedish Cancer and Traffic Injury Fund (CTRF).
Author Disclosure Statement
No competing financial interests exist.