
Abstract
Advanced magnetic resonance imaging (MRI) methods were shown to be able to detect the subtle structural consequences of mild traumatic brain injury (mTBI). The objective of this study was to investigate the acute structural alterations and recovery after mTBI, using diffusion tensor imaging (DTI) to reveal axonal pathology, volumetric analysis, and susceptibility weighted imaging (SWI) to detect microhemorrhage. Fourteen patients with mTBI who had computed tomography with negative results underwent MRI within 3 days and 1 month after injury. High resolution T1-weighted imaging, DTI, and SWI, were performed at both time points. A control group of 14 matched volunteers were also examined following the same imaging protocol and time interval. Tract-Based Spatial Statistics (TBSS) were performed on DTI data to reveal group differences. T1-weighted images were fed into Freesurfer volumetric analysis. TBSS showed fractional anisotropy (FA) to be significantly (corrected p<0.05) lower, and mean diffusivity (MD) to be higher in the mTBI group in several white matter tracts (FA=40,737; MD=39,078 voxels) compared with controls at 72 hours after injury and still 1month later for FA. Longitudinal analysis revealed significant change (i.e., normalization) of FA and MD over 1 month dominantly in the left hemisphere (FA=3408; MD=7450 voxels). A significant (p<0.05) decrease in cortical volumes (mean 1%) and increase in ventricular volumes (mean 3.4%) appeared at 1 month after injury in the mTBI group. SWI did not reveal microhemorrhage in our patients. Our findings present dynamic micro- and macrostructural changes occurring in the acute to sub-acute phase in mTBI, in very mildly injured patients lacking microhemorrhage detectable by SWI. These results underscore the importance of strictly defined image acquisition time points when performing MRI studies on patients with mTBI.
Introduction
The exact mechanisms after mTBI remain unclear. In most of the cases, results of clinical scans such as computed tomography (CT) and routine magnetic resonance imaging (MRI) are negative, suggesting a microscopic nature of damage, below the sensitivity of routine imaging. 6 At the same time, advanced MRI methods, such as diffusion tensor imaging (DTI), susceptibility weighted imaging (SWI), and volumetric analysis of high-resolution MRI seem to be a potential non-invasive tool in revealing subsequent organic changes caused by TBI. 7 –9
The character of diffusivity in the brain is widely accepted to be associated with fiber tracts—i.e., axons and myelin sheath. 10 DTI indices as fractional anisotropy (FA) and mean diffusivity (MD) were shown to be sensitive markers of microstructural alteration in white matter, thus are possible to detect diffuse axonal injury, an effect of shear-strain deformation of the traumatic brain, regarded to be responsible for symptoms in mTBI. 11,12 Further, the sensitivity to changes of water microcompartments also enables DTI to assess different subtypes of edema. 13
The idea of using DTI as a sensitive and objective method in mTBI attracted a wide range of studies. The findings, however, are somewhat contrary. A large set of studies detected reduced FA and elevated MD in white matter regions of patients with mild trauma at various intervals after injury compared with healthy controls. 11,12,14 Instead, others found increased FA and decreased MD over white matter tracts predominantly in a short period (days) after mTBI. 15,16 Some longitudinal studies revealed partial normalization of DTI indices after 3–6 months, 11,16 –18 while other investigations indicated traumatic microstructural alteration to be permanent. 18,19 Some studies in fields of TBI related injury severity and clinical outcome—i.e., cognitive or psychological complications—to DTI indices, or tractography findings. 20 –22
Non-specific brain tissue loss caused by traumatic injury has been shown on a large TBI population of mixed severity. 23 Earlier studies using manual-visual morphometric techniques presented atrophy of numerous neuroanatomical structures (e.g., hippocampus, fornix, corpus callosum) and liquor space-dilation in patients with trauma. 24 –26
The association of injury severity, outcome, and morphometric data has also been revealed. 27,28 Apart from investigation of distinct well-circumscribed structures, a voxel-based morphometric approach made it possible to perform automatic whole-brain (e.g., cortical volumetric) analysis, which has also pointed to the occurrence of such a post-traumatic degenerative process and was even able to present regional atrophy. 29,30
While the majority of these studies concentrated on late-phase post-traumatic consequences, there is a lack of data concerning acute or semi-acute dynamics of tissue atrophy. Also, only little information has been provided on the significance of mild injuries in the generation of brain volume loss. 8,31
SWI is the most sensitive tool in detecting microhemorrhage that may occur in diffuse axonal injury. 32 The amount and localization of microhemorrhage appearing as low-signal foci after TBI have prognostic value, as has been described in a series of studies. 33 On the other hand, to date the usefulness of SWI in mTBI is not clear.
Overall, these methods are promising in detecting underlying mechanisms and may provide an objective aspect when assessing the outcome of mTBI. Findings of DTI, however, are inconsistent, and little is known regarding the time course of diffusivity changes after mTBI; volumetric analysis and SWI was rarely applied to mTBI patients.
The objective of this study was to investigate acute structural alterations and recovery after mTBI, using DTI, volumetric analysis, and SWI.
Two acquisition time points were assigned to involve acute phase and first month after injury: initial acquisition within the first 3 days after injury, and a second acquisition 1 month later involving the same subjects. A control group of age- and sex-matched healthy volunteers underwent the same imaging process with a similar time frame.
Semi-automated methods investigating whole brain, without the need of pre-specifying regions of interest, were used, keeping clinical adaptability in mind.
Beyond cross-sectional analyses, the comparison of the two time points within the mTBI and control group was also performed to maximize statistical power and thus make it able to better detect potentially subtle alterations.
Methods
Subjects
Fourteen patients (five women) from the outpatient unit of the department of neurosurgery with a history of mTBI participated in this study. Patients fulfilled the criteria of “uncomplicated” mTBI. 34 Patients had a GCS of 15, loss of consciousness for less than 1 min, posttraumatic amnesia for less than 30 min—based on the Galveston Orientation and Amnesia Test 35 —and a normal posttraumatic CT read by a board-certified neuroradiologist (H.K.). Exclusion criteria consisted of history of neurological or psychiatric disease, alcohol abuse, substance dependence, earlier TBI and MRI incompatibility. All patients were right-handed, according to the Edinburg Handedness Inventory. 36 A control group of 14 age- and sex-matched healthy volunteers following the same exclusion criteria were also involved in the study. All subjects gave written informed consent under a protocol approved by the local ethics committee. Demographic characteristics of patient and control groups are shown in Table 1.
Data are mean±standard deviation; numbers in parentheses are the ranges
Image acquisition
Initial MRI data of patients were acquired within 72 hours after injury (mean ∼2 days, ranging from 12 h to 72 h, referred to as 72 h). The second acquisition was performed approximately 1 month later (mean 35 days ranging from 28 days to 43 days after injury, referred to as 1 month). The control group also underwent the two time point acquisition with a similar time frame (average 30 days difference ranging from 27 to 36).
MRI was performed on a Magnetom® TIM Trio™ 3 Tesla scanner (Siemens, Enlargen, Germany) with a 12 channel standard head coil. The sequences consisted of high-resolution T1-weighted scan (MP-RAGE) for volumetric analysis, T2-weighted scan, DTI, and SWI, which were applied on all subjects and controls. After the localizer scanning for proper orientation, shimming was carried out to maximize field homogeneity.
T1-weighted high-resolution images were obtained using a three-dimensional (3D) MP-RAGE sequence (TR/TI/TE=1900/900/3.41ms; flip angle=9 degrees; 160 axial slices; slice thickness=0.94 mm; no interslice gap; field of view [FOV]=210×240 mm2; matrix size=224×256; receiver bandwidth=180 Hz/pixel).
T2-weighted images were acquired using a turbo spin echo sequence (TR/TE=6000/93ms; flip angle=120 degrees; 30 sagittal slices; slice thickness=4 mm; no interslice gap; FOV=193×220 mm2; matrix size=280×320; receiver bandwidth=220 Hz/pixel.
DTI was performed using a two dimensional single-shot diffusion-weighted, spin-echo, echo-planar imaging (EPI) sequence. DTI was achieved using 20 optimum non-collinear encoding directions with a diffusion weighting of b=700 s/mm2, and a single volume was collected with no diffusion gradients applied (TR/TE=8500/90ms; 60 axial slices, slice thickness=2 mm; FOV=208×256 mm2; matrix size=208×256; receiver bandwidth=1563 Hz/pixel; 4 averages. The total acquisition time was 12 min).
Advanced shimming was performed before the DTI acquisition to optimize the homogeneity of the magnetic field across the brain and to minimize EPI distortions.
The 3D gradient echo SWI sequence was run with the following parameters: (TR/TE=27/20 ms; 72 axial slices; slice thickness=1.5 mm; flip angle=15; matrix size=182×256; FOV=173×230 mm2; receiver bandwidth=120 Hz/pixel).
Subjects were positioned supine in the scanner. Foam cushioning was used to immobilize the head within the coil to minimize motion degradation.
Data processing
Diffusion tensor imaging and Tract-Based Spatial Statistics (TBSS)
Initial diffusion image processing was performed to generate TBSS input data using the FDT (FMRIB's Diffusion Toolbox) tool. 37 The steps included eddy current correction and motion correction using a 12-parameter affine registration to a reference volume (i.e., non-diffusion weighted data, b=0 s/mm2), averaging of the four sets of 20 diffusion directions, and automated brain extraction with brain extraction tool, 38 which was manually supervised to avoid incorrect brain extraction. Diffusion data were then fed into DTIFit 37 to calculate the diffusion tensor model for each brain voxel and subsequently compute FA and MD values from the tensor's three eigenvalues. 39
Voxelwise statistical analysis of the FA data was performed using TBSS, 40 part of FMRIB's Software Library (FSL). 37 TBSS projects all subjects' FA data onto a mean FA tract skeleton in standard space, before applying voxelwise cross-timepoint or cross-group statistics. We run TBSS to other diffusion-derived data; MD as well. The voxelwise statistics were performed on skeletonized data using the permutation-based non-parametric randomize analysis, involved in FSL. 41 The two time point FA and MD data from both mTBI and control groups were compared by non-parametric paired t test to maximize statistical power. We compared the mTBI with the control group by non-parametric unpaired t test, in both first and second time points. Results were considered significant for p<0.05, corrected for multiple comparisons using “threshold-free cluster enhancement,” which avoids making an arbitrary choice of the cluster-forming threshold, while preserving the sensitivity benefits of clusterwise correction.
Volumetric analysis
T1-weighted high-resolution images were fed into volumetric segmentation that was performed with the FreeSurfer image analysis suite (Athinoula A. Martinos Center for Biomedical Imaging, Charlestown, MA 2005). Details of the procedures are described in previous publications. 42 –48 Briefly, this processing includes the removal of non-brain tissue using a hybrid watershed/surface deformation procedure, 48 automated Talairach transformation, segmentation of the subcortical white matter and deep gray matter volumetric structures, 44,49 intensity normalization 50 tessellation of the gray matter-white matter boundary, automated topology correction, 51,52 and surface deformation following intensity gradients to optimally place the gray/white and gray/cerebrospinal fluid (CSF) borders at the location where the greatest shift in intensity defines the transition to the other tissue class. 42,43,53
We checked each dataset within the processing stream. We checked the Talairach transform, the accuracy of the skull strip, the accuracy of the white matter, and pial surface segmentation. Corrections were performed when necessary. The output volumes of cortex, white matter, corpus callosum, ventricles, extracerebral CSF, hippocampus, amygdala, pallidum, nucleus caudatus, thalamus nucleus proprius, and nucleus accumbens were statistically compared between first and second time point by simple paired t test, both in traumatic and control groups. Analysis between patients and control group was performed using unpaired t test on volumes normalized to intracranial volume.
Longitudinal brain volume change calculation and illustration were performed on MP-RAGE images using FSL 37 SIENA. 38 First, percentage brain volume changes between two time points were estimated. Next, for each subject, the edge displacement image (encoding, at brain/non-brain edge points, the outward or inward edge change between the two time points) was dilated, transformed into MNI152 space, and masked by a standard MNI152-space brain edge image. In this way, the edge displacement values were warped onto the standard brain edge. 54 Next, the resulting images from all subjects were fed into voxelwise statistical analysis using the randomize tool 41 to test brain volume change in the traumatic and control group between the 72 h and 1 month measurements.
SWI
Susceptibility weighted images were searched for hemorrhagic lesions by a board-certified neuroradiologist.
Results
Structural images
T1- and T2-weighted structural images were read by a board-certified neuroradiologist (H.K.) and found to be free of trauma-related pathology. No low-signal foci referring to microhemorrhages were apparent on susceptibility weighted images in the traumatic or in the control group.
TBSS
Longitudinal analysis
TBSS analysis between 72 h and 1 month acquisition of traumatic injury patients showed significant difference (corrected p<0.05) in voxels of anterior corpus callosum, right corona radiata, and internal capsule for both FA and MD values. FA was lower, while MD was higher at 72 h than after 1 month (see Fig. 1 and Table 2 for details). No voxels appeared to be significant on the opposite contrasts (72 h >1 month for FA, 1 month >72 h for MD). The two time point comparison of control subjects revealed no statistical difference regarding MD or FA.
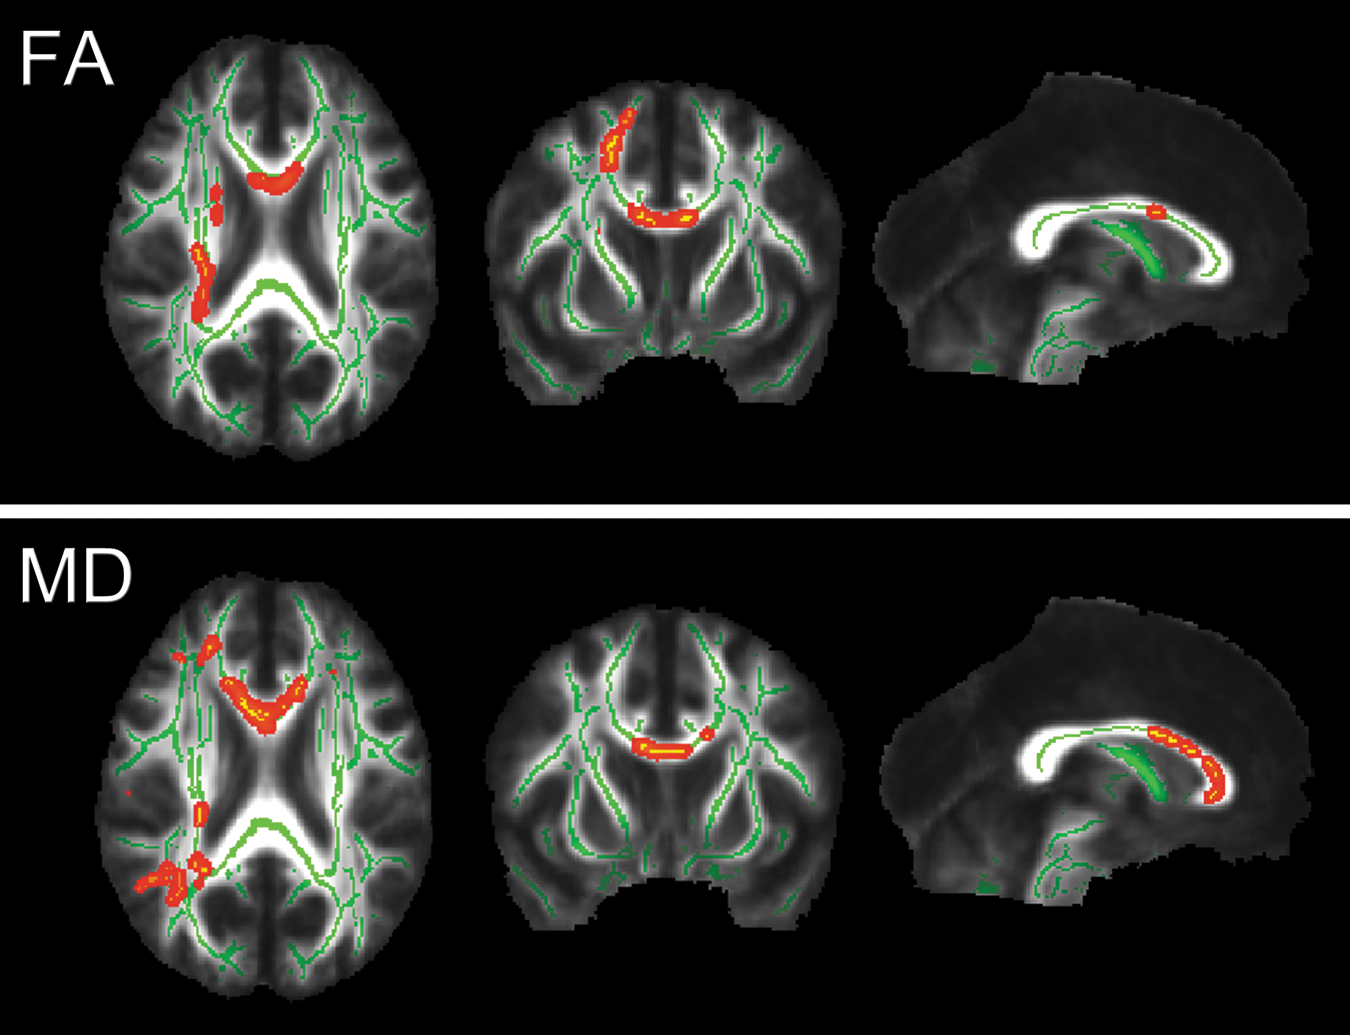
Results of the Tract-Based Spatial Statistics (TBSS) analysis of the 72 h and 1 month data of the mild traumatic brain injury group. The red-yellow voxels represent significantly (corrected p<0.05) decreased fractional anisotropy (FA) and increased mean diffusivity (MD) values in the 72 h data compared with the 1 month data. Significant voxels are thickened into local tracts and overlaid on the group mean white matter skeleton (green) and the group mean fractional anisotropy (FA) image (grayscale). Images are shown in radiological convention (right=subject's left). Slice coordinates (MNI 152 aligned anatomical): x=0 mm, y=10 mm, z=22 mm.
Average values of subjects' white matter “skeleton” voxels that were yielded significantly different in given contrast.
p value for voxel with highest statistical difference.
10−4 mm2/sec.
FA, fractional anisotropy; mTBI, mild traumatic brain injury; MD, mean diffusivity.
Cross-sectional analysis: imaging within 72 h after injury
Comparison between the mTBI group's 72 h imaging and the control group's first time point imaging showed FA to be significantly decreased (corrected p<0.05) and MD to be significantly increased (corrected p<0.05) in the traumatic injury group diffusely in several white matter tracts of both hemisphere (see Fig. 2 and Table 2 for details). The contrast of control group MD minus mTBI group MD, or mTBI group FA minus control group FA yielded no significant voxels.
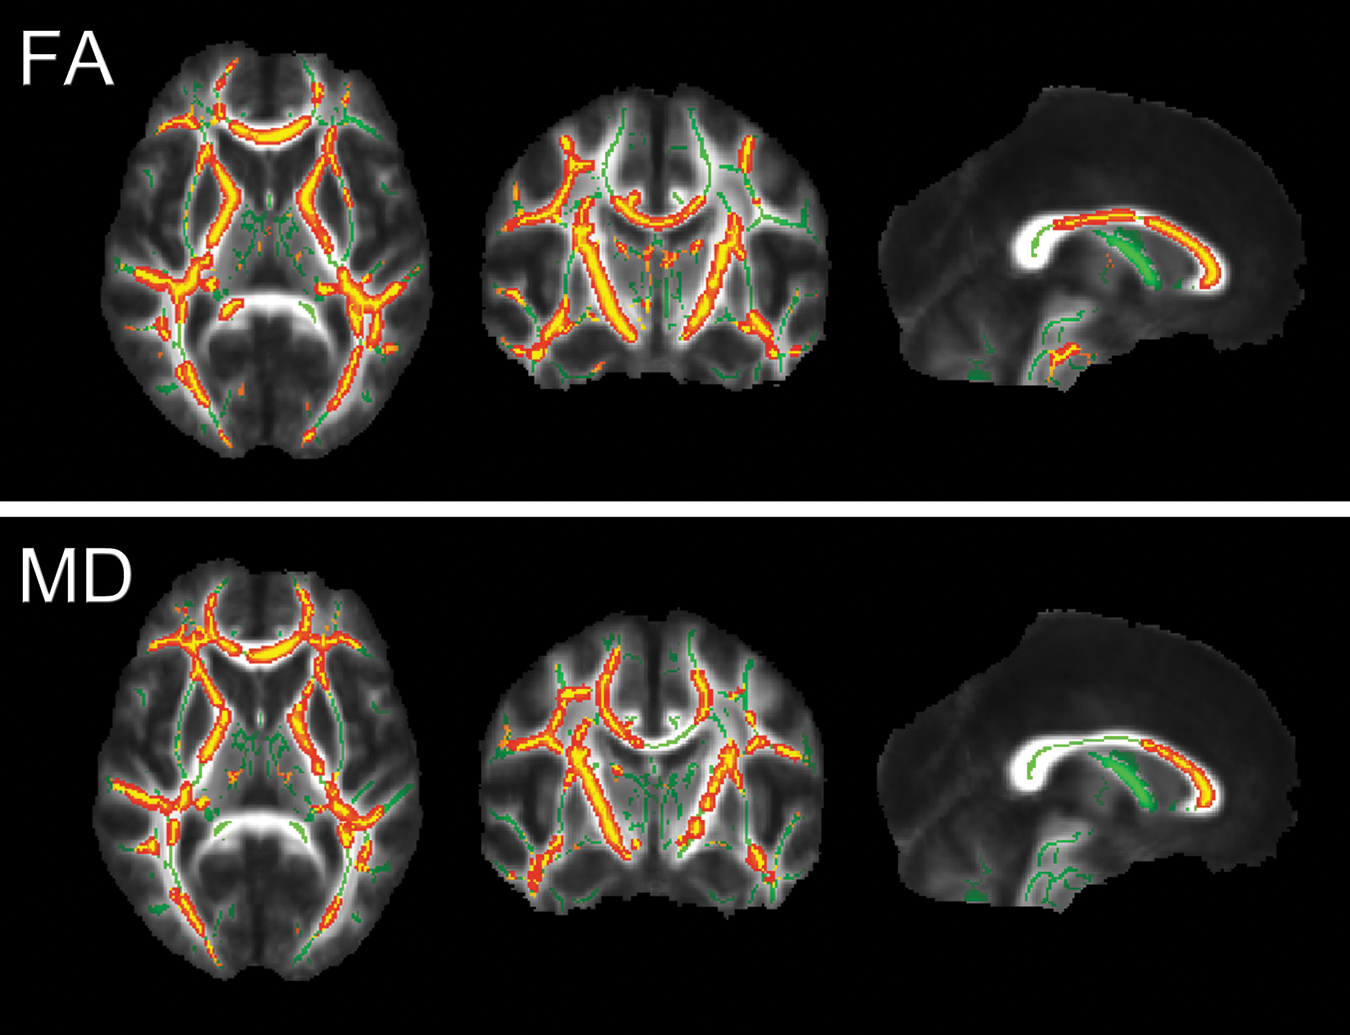
Results of the Tract-Based Spatial Statistics analysis of the control and mild traumatic brain injury (mTBI) group at 72 h. The red-yellow voxels represent significantly (corrected p<0.05) decreased fractional anisotropy (FA) and increased mean diffusivity (MD) in the mTBI group compared with the control group. Significant voxels are thickened into local tracts and overlaid on the group mean white matter skeleton (green), and the group mean fractional anisotropy (FA) image (grayscale). Images are shown in radiological convention (right=subject's left). Slice coordinates (MNI 152 aligned anatomical): x=0 mm, y=-10 mm, z=7 mm.
Cross-sectional analysis: imaging at 1 month
The comparison of mTBI group data at 1 month with control group data at the second time point also highlighted significantly (corrected p<0.05) reduced FA in the mTBI group, but only in the right hemispherium, to a much smaller extent (see Fig. 3 and Table 2 for details). The opposite contrast did not reveal any significant results. MD values showed changes in the opposite direction as FA values, but without reaching statistical significance.

Results of the Tract-Based Spatial Statistics analysis of the control group and mild traumatic brain injury group at 1 month. The red-yellow voxels represent significantly (corrected p<0.05) decreased fractional anisotropy (FA) in the mTBI group compared with the control group. Significant voxels are thickened into local tracts and overlaid on the group mean white matter skeleton (green), and the group mean fractional anisotropy (FA) image (grayscale). Images are shown in radiological convention (right=subject's left). Slice coordinates (MNI 152 aligned anatomical): x=0 mm, y=-17 mm, z=19 mm. MD, mean diffusivity.
Overall relations of FA and MD values found across sessions and groups are illustrated in Figure 4.
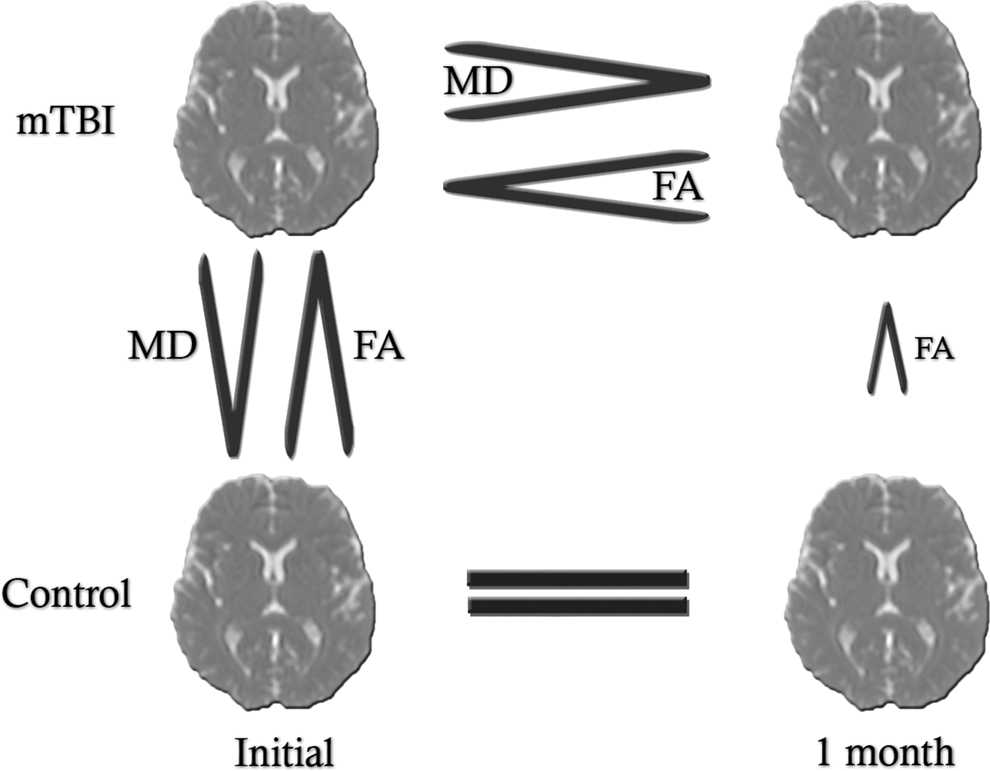
Relations of fractional anisotropy (FA) and mean diffusivity (MD) values found across sessions and groups. mTBI, mild traumatic brain injury.
Volumetric analysis
FreeSurfer volumetric segmentation
Significant differences (p<0.05) were detected between the 72 h and 1 month volumes of the cortex, ventricles, and extracerebral CSF in the mTBI group. Cortical grey matter volume at 72 h was larger than at 1 month. Ventricular (more pronouncedly lateral ventricle) and extracerebral CSF volume was lower at 72 h. No significant volume change over time was found in other investigated structures such as white matter, hippocampus, amygdala, pallidum, nucleus caudatus, nucleus accumbens, thalamus nucleus proprius. The average loss of cortical volume over 1 month was 1.02%. Gain of average ventricular volume over time was 3.4%. Volume changes in the control group were not significant. Table 3 shows details of longitudinal brain structure volume comparison in the mTBI and control groups. Cross-sectional comparison of any normalized (to intracranial volume) brain structure volumes revealed no significant difference between control and traumatic group either at 72 h or 1 month (Table 4).
Paired t test.
mTBI, mild traumatic brain injury; SD, standard deviation; GM, grey matter;
E.C. CSF, extra cerebral cerebrospinal fluid.
Unpaired t test.
mTBI, mildtraumatic brain injury; SD, standard deviation; GM, grey matter; ICV, intracranial volume; E.C. CSF, extracerebral cerebrospinal fluid.
FSL SIENA
Analysis of edge displacement data (edge flow) showed significant outward edge movement in several voxels lining the 3th and lateral ventricles from the 72 h to 1 month imaging in the traumatic group, as it is presented on Fig. 5. Opposite edge displacement (inward) or edge displacements in control group were not significant.
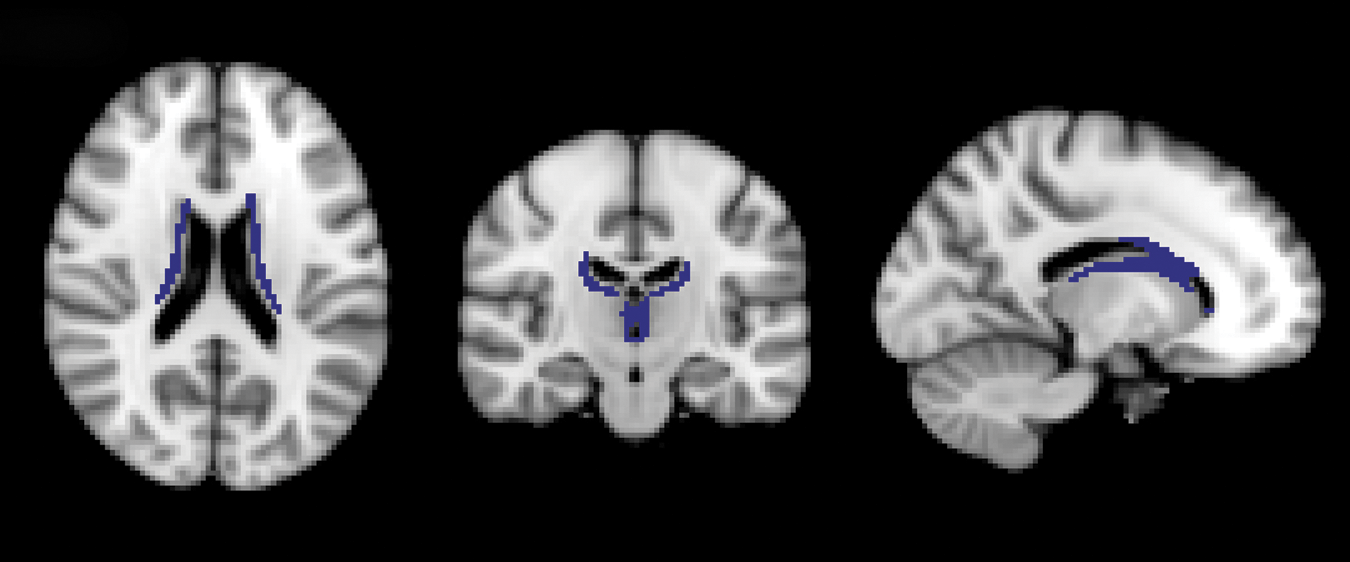
Results of voxel based multi-subject SIENA analyis in the mild traumatic brain injury group. Blue voxels indicate significant (p<0.05) outward edge displacement over time in the traumatic injury group. Slice coordinates in MNI 152 space: x=-14 y=-18 z=20.
Discussion
This study investigated the changes of structural alterations detectable by DTI, volumetric analysis, and SWI in a longitudinal set after mTBI. We found marked differences in microstructure and brain volumes between the acute and sub-acute state by DTI and volumetric analysis. We suppose that these changes over time provide an insight to structural alteration and regeneration after mTBI.
Diffusion tensor imaging
We found DTI parameters FA and MD to substantially differ between the acute phase mTBI patients and control subjects in nearly all white matter tracts. mTBI patients showed decreased FA values and, oppositely, increased MD values compared with healthy subjects. After 1 month, this difference with controls remained significant only in a distinctly smaller extent of voxels—limited to the right hemisphere regarding FA, and became insignificant regarding MD. The DTI values appeared to normalize after 1 month of injury (i.e., significant increase of FA and significant decrease of MD). The DTI parameters remained reliably constant in the control group across the two acquisitions.
Overall, these findings suggest that the DTI-detectable abnormality developing in the acute phase is resolving dynamically in the first month after mild injury.
The exact mechanisms behind the detected changes of DTI indices remain elusive, however. DTI parameters of the brain after TBI are related to a complex setup of dependent and independent factors. Axonal and myelin sheath pathology, ratio of extracellular and intracellular water compartments linked to edema or cell death have together an effect on the diffusion tensor. Many studies explain reduced FA or elevated MD in mTBI patients with reduced integrity; i.e., misalignment of axonal and myelin structures as a consequence of shear-strain forces, including local expansion of axonal cylinder, or axonal disconnection. 11,12,20 On the other hand, some more recent studies observed elevated FA or reduced MD short after mild injury along several white matter regions. 15,16,55 One possible underlying mechanism is cytotoxic edema, because in this condition, the injury-induced altered function of gated ion channels results in intracellular swelling and decrease in extracellular water that causes reduced radial diffusivity. 13,56,57 The output yielded by DTI may be a summarized effect of the two basic mechanisms: microstructural disintegration and cytotoxic edema.
The actual dominance of these substantial mechanisms in the white matter may theoretically depend on temporal, spatial factors, attributes of the patient, and the circumstances of injury. 58
Although a recent study presenting bidirectional changes in FA of mTBI patients raised the possibility of spatial factors contributing to alterations in FA, 59 our data support rather the significance of temporal factors: both FA and MD changed significantly in a relatively short period, and no bidirectional changes were detected. The rapid consolidation of MD hypothetically may be associated with the recovery process from edema, because edema is thought to pass over in a similar pace after mTBI. 60,61 The insignificant difference in MD values yielded by TBSS between 1 month mTBI patients and controls, however, does not necessarily mean normal MD values for the patients at 1 month; further, FA remained significantly reduced at different white matter regions also after 1 month. This is somewhat surprising considering that FA is thought to be more variable among subjects and thus potentially less sensitive in analyses. 62 This type of slower consolidation of FA values, however, may mirror a process of cellular realignment and a cleanup of degenerative residuals by phagocytes.
Volumetric analysis
This study demonstrates significant reduction of gray matter volume accompanied by significant CSF volume gain over 1 month after mTBI. Overall, these changes indicate reduction of brain tissue volume, which may be a consequence of both the recovery from initial subtle edema and the initiation of atrophy. To elucidate the contribution of these two factors, cross-sectional analysis was performed, which, however, yielded no significant differences between the control and the TBI group at any time points.
This is probably the kickback of the high intersubject variability of brain structure volumes and that of the low number of subjects, also observed as an obstacle of a previous volumetric study. 8 Previously, however, Warner and coworkers 30 found lateral ventricle volumes to be e significantly smaller in patients with acute TBI than in control subjects. This supports the theory that acute edema formation (i.e., brain swelling) may take place in patients with TBI.
Both the amount of brain swelling and the subsequent atrophy correlates with clinical severity and outcome as described in previous studies. 8,27,61,63,64 Hence, the rate of brain volume change at the acute to sub-acute stage is likely to have prognostic value, because it represents the effect of impact and the following degeneration. Further, based on the inter-session sensitivity of Freesurfer volumetric segmentation presented here, MRI volumetric analysis may be virtually applied as a non-invasive tool in measuring brain edema retrospectively at an optimal interval after injury. Our data showed lateral ventricles to be the most potential structures for detecting volume change after injury.
Susceptibility weighted imaging
Although compared with other imaging methods, SWI is extremely sensitive to microhemorrhages and reveals a high number of them in severe to moderate TBI, 65 microhemorrhages do not seem to be frequent in mTBI. 66 Thus, the absence of microhemorrhages detectable with SWI is not surprising in the very mildly injured group presented here. SWI may be implemented to subclassify mTBI, declaring microhemorrhage positive or negative cases. This distinction may be helpful—e.g., when interpreting DTI results in mTBI—as in this study, SWI data ensured that DTI data was not modified by hemorrhagic lesions.
The main limitation of the present study was the relatively low number of subjects. This was most disadvantageous during the volumetric cross-sectional analysis that revealed no significant differences, because of great variance in volumes of cerebral structures. The need of a far greater population to perform reliable cross-sectional volumetric analysis was established in previous studies. 67 Thus, the exact direction of volume changes detected in the TBI group remained undetermined.
A weakness of DTI, resulting from its technical nature, is the unpredictable effect of complex fiber architecture such as fiber crossing or merging. 68 The potentially higher vulnerability of these complex fiber sites increases the importance of this problem when performing DTI studies of TBI.
To our knowledge, no previous study showed such prominent changes in FA, MD, and brain tissue volume during the first month after mTBI. Further investigation is needed to better understand the correlations of FA and MD to underlying pathology and to reveal the correlates of acute brain volume alterations and clinical aspects. Volumetric analysis may be a useful clinical tool in the assessment of edema or early degenerative processes in mTBI when performed in short-term follow-up design.
We suggest that combined application of DTI, SWI and volumetric segmentation provides essential information on the structural sequelae of mTBI and helps the differentiation of underlying mechanisms. DTI itself, which proved to be highly sensitive to microstructural alteration, at the same time appears to be less specific concerning the complexity of traumatically induced alterations.
Volumetric analysis and SWI may extend the field of view of DTI by providing separate insights to edematous, degenerative processes and microhemorrhages after trauma.
The automated, whole-brain approach available in DTI and volumetric analyses offer the possibility to perform these methods in routine conditions as well.
The dynamism of microstructural alterations presented in this report highlights the need of strictly standardized image acquisition time points when performing DTI or volumetric analysis after mTBI.
Footnotes
Acknowledgments
This work was supported by Developing Competitiveness of Universities in the South Transdanubian Region (SROP-4.2.1.B-10/2/KONV-2010-0002), J.J., A.S. was supported by the Bolyai Scholarship of the Hungarian Academy of Science. P.B. was supported by OTKA PD 72240. The Institutional Review Board protocol is U. Pécs, Medical Center IRB Project #00003108.
Author Disclosure Statement
No competing financial interests exist.