
Abstract
Post-traumatic hypopituitarism (PTHP) has been linked to disability and decreased quality of life. However, no studies have addressed the long-term consequences of PTHP in adults with severe traumatic brain injury (TBI) only. In this study, we evaluated the relationship between pituitary function, quality of life, and functioning in 51 patients (16–65 years of age) with severe TBI who were admitted to Sahlgrenska University Hospital, Gothenburg from 1999 to 2002. The patients were assessed once, 2–10 years after trauma. Data from the time of injury were collected retrospectively to adjust for injury severity. Outcome measures included hormonal testing, the Short Form-36 Health Survey, the Glasgow Outcome Scale–Extended, and a self-report questionnaire specifically designed for this study and based on the International Classification of Functioning, Disability and Health. Of 51 patients, 14 (27.5%) presented with PTHP, and 11 (21.6%) had isolated growth hormone deficiency. Patients with PTHP were more often overweight at follow-up (p=0.01); the higher body mass index was partially explained by PTHP (R2 change=0.07, p=0.001). Otherwise no significant correlation was found among PTHP, functioning, or patient-reported quality of life. This study—which is unique in the homogeneity of the patients, the long follow-up time, and the use of injury severity as an outcome predictor—did not confirm results from previous studies linking PTHP to a worse outcome. Therefore, screening for PTHP might be restricted to specific subgroups such as overweight patients, indicating growth hormone deficiency.
Introduction
Several studies from the last decade have shown that TBI puts patients at substantial risk of subsequent post-traumatic hypopituitarism (PTHP). 8 –15 Researchers have begun to investigate the effect of PTHP on outcome after TBI, with a particular focus on neuropsychological sequelae. 16 However, such studies have measured outcome in a heterogeneous group of patients with a wide range of TBI severity. 17 –29 Few studies have considered the relative contribution of injury severity to outcome. 16
A worse functional outcome (e.g., greater functional dependency and activity limitation) and worse cognitive functions (e.g., greater deficits in attention, executive functioning, memory, and emotion) has been reported in TBI patients with PTHP, particularly those with growth hormone deficiency (GHD), than in those without PTHP. 20,21,28 A few studies have also reported a worse health-related quality of life (HRQL) in patients with PTHP, particularly those with GHD (e.g., poorer sleep and energy levels and an increased sense of social isolation). 18,23,25,29
All of the studies described evaluated patients up to 2 years after the injury. However, in one study of TBI patients with long-lasting cognitive disorders followed for a mean of 6.5 years after the initial injury, late functional outcomes, activity performance, and cognitive function after TBI were worse in patients with PTHP, especially those with GHD. However, the impact of PTHP on functional outcome, cognitive disorders, and HRQL is controversial. 22 Few studies have shown results that have questioned the current opinion on hypopituitarism after TBI. They reported no evidence for an association between impaired cognitive function and GHD in adult TBI patients, between neuropsychological impairments, HRQL and PTHP, or between TBI, fatigue, and GHD. 19,17,27
Given the discrepancies in the limited data on PTHP and outcome, the clinical importance of PTHP needs to be examined further in a well-defined group of patients with severe brain injury and a long follow-up time. In this study, we retrospectively evaluated the relationship between pituitary function and outcome in a series of patients 2–10 years after severe TBI. The patients underwent hormonal testing and clinical examination and completed self-report questionnaires measuring functioning and HRQL.
Methods
Patient enrollment and retrospective evaluation
The catchment region of the Sahlgrenska University Hospital includes ∼ 1,500,000 inhabitants in the Västra Götaland region in western Sweden, including roughly 500,000 in the city of Gothenburg. Between January 1, 1999, and December 31, 2002, 419 patients with TBI (International Statistical Classification of Diseases and Related Health Problems, 10th revision [ICD 10] diagnostic codes S06.1–S06.9) were admitted to the neonatal intensive care unit at Sahlgrenska University Hospital, Gothenburg, Sweden. We retrospectively reviewed the medical files of these patients to collect data on the level of consciousness upon arrival at the hospital. Consciousness was evaluated with the Reaction Level Scale (RLS), a hierarchically ordered scale with eight categories (“reaction levels”), where higher scores denote worse responsiveness, and a score ≥4 denotes a nonresponsive patient. 30 RLS scores were recoded into Glasgow Coma Scale (GCS) scores, where RLS ≥4 is equivalent GCS ≤8. 31,32
The inclusion criteria were: 1) age 16–65 years; 2) GCS score ≤8, indicating a severe TBI; (3) survival to discharge from the NICU; and (4) residence in the Västra Götaland region at the time of follow-up. The exclusion criteria were a known pituitary insufficiency or recent or ongoing glucocorticoid, growth hormone, or thyroxine replacement therapy at the time of follow-up.
Of the 419 patients, 288 were excluded because they did not meet the criteria for age or severity of TBI, died in the NICU, or lived outside the Västra Götaland region at follow-up. Therefore, 131 patients were eligible to participate in the study. Each patient was sent a letter inviting him or her to participate in the study. Those who did not respond within 1 month received another letter, a phone call, or both. Seventeen patients declined, 37 did not respond to the invitation, 24 had died after discharge from the NICU, and 2 could not be located. Therefore, 51 patients were included in the study (Fig. 1). These patients did not differ in age or gender from the 80 patients lost to follow-up.
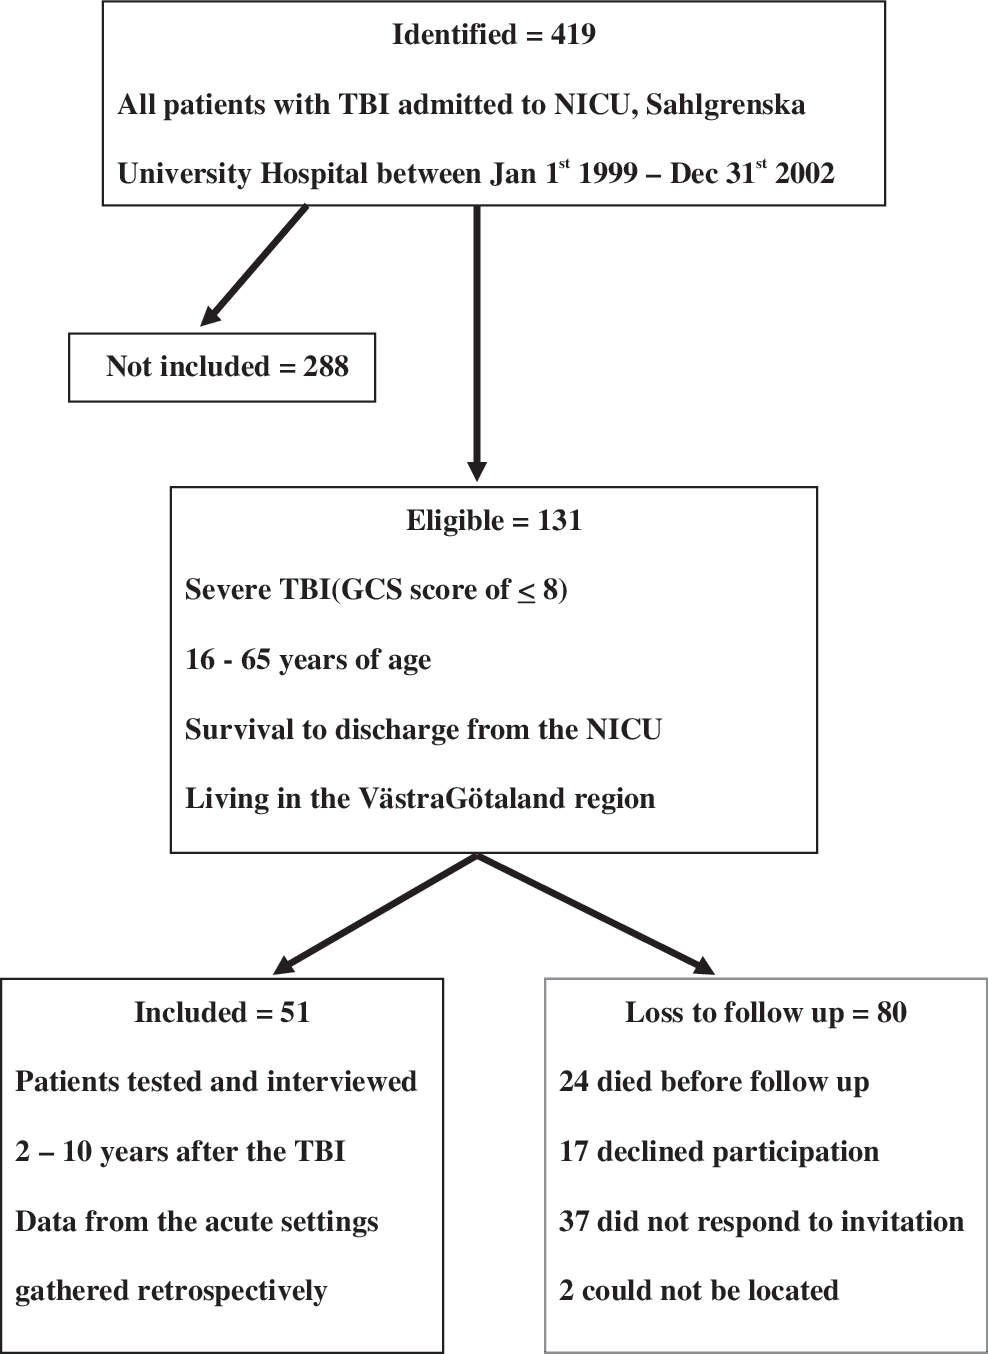
Flow chart of derivation of cohort.
Data collection
All patients were assessed once, between September 2004 and June 2010, 2–10 years after sustaining their TBI. Data from the time of injury were collected retrospectively from medical files. Patients were assessed in the endocrinology department by a doctor and a nurse who did not have knowledge of their hormonal status, in a quiet setting over a 2–3 h period.
Comorbidity and sociodemographic and injury characteristics
Data on comorbidity and sociodemographic characteristics at the time of injury were recorded from the medical files at the time of injury and from the specifically designed questionnaire, the clinical examination, and the medical history at the time of follow-up. The injury characteristics were recorded from the acute care medical files, including age, sex, major extracranial injury, RLS score, and pupillary status after arrival to hospital. The CT findings (recorded from patients' first and second CT scans) were registered as cranial fracture and type, diffuse brain swelling, evacuated/unevacuated hematoma, visible petechiae, midline shift of >5 mm, basal cistern compression, and subarachnoidal hemorrhage.
To provide a valid comparison of the injury characteristics as outcome predictors versus hormonal status, we combined the predictive value of some of the clinical parameters and CT findings into a validated and generalizable prognostic model of TBI called Corticosteroid Randomization after Significant Head Injury (CRASH). 33 For this to be done, RLS scores were recoded into GCS scores.
Measures of functions, activity, participation, and HRQL
The primary outcome measures were assessment of functioning, disability, and HRQL. Body functions, activities, and participation were assessed with a patient-report questionnaire specifically designed for this study, using the framework of the International Classification of Functioning, Disability and Health. The questionnaire consists of 38 “yes–no” questions about physical and psychological functions, 12 questions about personal and instrumental activities of daily living. The questionnaire also gathers sociodemographic information, including household, work, and studies, and the need of support (personal, economical, or technical) and information on comorbidities, medications, smoking, alcohol, and drug abuse.
HRQL was assessed with the Short Form-36 Health Survey (SF-36), a widely used health outcome measure, validated for the TBI population. 34 The 36 questions are designed to measure patient-reported health-related functioning and well-being along eight subscales. The scales range is 0–100 (worst to best). Despite the ordinal nature of the SF-36, it has been recommended that the subscales of the SF-36 be aggregated into summary scores that represent the two main dimensions of health: the physical component summary and the mental component summary, calculated as weighted sums of the subscales scores. 34
Another outcome measure was the eight-point Glasgow Outcome Scale–Extended (GOS-E), in which the specifically designed questionnaire was interpreted in light of the results of the physical examination and medical history, according to the study protocol obtained by a physician specialized in endocrinology or rehabilitation medicine. 35 The physician completed the questionnaires by interviewing the patient, or if that was not possible, a relative or personal assistant of the patient.
Anterior and posterior pituitary hormonal testing
All patients arrived in the morning after fasting since midnight. Fasting blood samples were obtained between 8 and 9 a.m. for tests of anterior pituitary function, including free thyroxine (f-T4), thyroid stimulating hormone (TSH), cortisol, adrenocorticotrophic hormone (ACTH), testosterone (males), estrogen (females), sexual hormone binding globulin (SHBG), luteinizing hormone (LH), follicle-stimulating hormone (FSH), prolactin, insulin-like growth factor-1 (IGF-1) and GH in connection to an arginine-growth hormone-releasing hormone (arginine-GHRH) stimulation test. Urine osmolality and history of increased thirst and/or increased urine volumes were obtained for all patients, and a history of menstrual status was obtained for all females.
Arginine-GHRH stimulation test
A bolus dose of GHRH 1 μg/kg (maximum 100 μg) was given intravenously, followed by an infusion of arginine 0.5 g/kg (maximum dose 30 g). Samples for serum GH were taken at −15, 0, +15, 30, 45, 60, and 90 min. The maximal GH-response was evaluated according to the patient's body mass index (BMI) level and was considered subnormal if the GH maximum level was <11.5 μg /L (BMI<25 kg/m2), <8.5 μg /L (BMI 25–30) and <4.2 μg /L (BMI>30).
Co-syntropin stimulation test
If the initial serum cortisol level was <350 nmol/L, a follow-up co-syntrophin stimulation test with ACTH (0.25 mg sc) was performed at a later occasion. A maximal cortisol response <500 nmol/L at +30 min or +60 min was then considered subnormal.
BMI was calculated at follow-up. If available, BMI at the time of injury was obtained from the medical files.
Biochemical assays
Serum IGF1 concentration, until June 2004, was determined using a hydrochloric acid–ethanol extraction radioimmunoassay (RIA) (Nichols Institute Diagnostics, San Juan Capistrano, CA). Inter- and intra-assay coefficients of variation (CVs) were 5.4 and 6.9% respectively, at a mean serum IGF1 level of 126 μg/L, and 4.6 and 4.7% respectively, at a mean serum IGF1 level of 327 μg/L. From June 2004 to August 2006, serum IGF1 concentration was determined using a chemiluminescence immunoassay (Nichols Advantage; Nichols Institute Diagnostics). From September 2006, serum IGF1 level was determined using an automated chemiluminescent assay system (IMMULITE 2500, Diagnostic Products Corp., Los Angeles, CA). The standard used for calibration of the IGF1 assays was the World Health Organization National Institute for Biological Standards and Control First International Reference Reagent (WHO NIBSC 1st IRR) 87/518 throughout the study period.
Serum GH concentration, until January 2008, was determined using Wallac DELFIA human growth hormone (hGH) Perkin Elmer. Inter- and intra-assay CVs were 14%, 7%, and 5%, respectively, at a mean serum GH level of 0.5 mU/L, 10 mU/L, and 30 mU/L, respectively. From February 2008, serum GH concentration was determined using Access2, Beckman Colulter. The inter-and intra-assay CVs were 10%, 7%, and 6%, respectively, at a mean serum GH level of 0.200 μg/lL, 3.0 μg/L, and 11 μg/L, respectively.
Serum SHBG concentration, until March 2006, was determined using IRMA, Orion Diagnostic. The inter- and intra-assay CVs were 7% and 5%, respectively, at a mean serum SHBG level of 40 nmol/L, and 60 nmol/L, respectively. From April 2006, serum SHBG concentration was determined using Architect, Abbott Scandinavia AB, with the inter-and intra assay CVs being 7%, 7%, and 9%, respectively, at a mean serum SHBG concentration of 20 nmol/L, 40 nmol/L, and 100 nmol/L, respectively.
Serum LH concentration, until November 2004, was determined using IRMA, LH MAIA clone, Serono. The inter- and intra-assay CVs were 11%, 8%, and 7%, respectively, at a mean serum LH level of 2.6 IU/L, 8 IU/L, and 20 IU/L, respectively. From December 2004, the serum LH concentration was determined using Architect, Abbott Scandinavia AB, with the inter-and intra assay CVs being 11%, 8%, and 7%, respectively, at a mean serum LH concentration of 3 IU/L, 20 IU/L, and 60 IU/L, respectively.
Serum FSH concentration, until May 2004, was determined using RIA, DPC, Diagnostic Product Corporation. The inter- and intra-assay CVs were 9%, 6%, and 4%, respectively, at a mean serum FSH level of 9 IU/L, 20 IU/L/L, and 90 IU/L, respectively. From June 2004, the serum FSH concentration was determined using Architect, Abbott Scandinavia AB, with the inter-and intra assay CVs being 9%, 6%, and 6%, respectively, at a mean serum FSH concentration of 5 IU/L, 25 IU/L, and 75 IU/L, respectively.
From 2004, serum prolactin concentration was determined using Architect, Abbott Scandinavia AB. The inter- and intra-assay CVs were 6%, 6%, and 6%, respectively, at a mean serum prolactin level of 200 mIU/L, 400 mIU/L, and 900 mIU/L, respectively. From December 2009 the serum prolactin concentration was determined in μg/L, still using Architect, Abbott Scandinavia AB, with the inter-and intra assay CVs being 6%, 6% and 6%, respectively, at a mean serum prolactin concentration of 10 ug/L, 20 ug/L, and 45 ug/L, respectively.
Serum cortisol concentration from 2004 to August 2008 was determined using Advia Centaur, Abbott Scandinavia AB. The inter- and intra-assay CVs were 11%, 15%, and 13%, respectively, at a mean serum cortisol level of 100 nmol/L, 500 nmol/L, and 800 nmol/L, respectively. From September 2008, the serum cortisol concentration was determined using Molecular and Cobas 6000/8000, Roche Diagnostic Scandinavia, with the inter-and intra assay CVs being 11%, 15%, and 13%, respectively, at a mean serum cortisol concentration of 100 nmol/L, 500nmol/L, and 800 nmol/L, respectively.
From 2004, urine cortisol concentration was determined using RIA, Orion Diagnostica. The inter- and intra-assay CVs were 14%, 9%, and 11%, respectively, at a mean urine cortisol level of 50 nmol/L, 100 nmol/L, and 400 nmol/L, respectively.
Plasma ACTH concentration was determined using ELSA-ACTH, a solid phase two site immunoradiometric assay (Cisbio Bioassays). The inter-assay CVs were 9.5% and 6.8%, respectively, at a mean plasma ACTH level of 2.4 pmol/L and 112 pmol/L, respectively, and the intra-assay CVs were 5.8 % and 3.7% at 2.8 pmol/L and 95 pmol/l, respectively.
Serum free T4 concentration from 2004 to May 2005, was determined using Architect, Abbott Scandinavia AB. The inter- and intra-assay CVs were 10%, 10%, and 9%, respectively, at a mean serum free T4 level of 6 pmol/L, 12 pmol/L, and 28 pmol/L, respectively. From June 2005, the serum free T4 concentration was determined using Molecular and Cobas 6000/8000, Roche Diagnostic Scandinavia, with the inter-and intra assay CVs being 10%, 10%, and 9%, respectively, at a mean serum free T4 concentration of 6 pmol/L ug/L, 12 pmol/L, and 28 pmol/L, respectively.
Serum TSH concentration from 2004 to May 2005, was determined using Architect, Abbott Scandinavia AB. The inter- and intra-assay CVs were 7%, 6%, and 5%, respectively, at a mean serum TSH level of 0,4 mIU/L, 6 mIU/L, and 28 mIU/L, respectively. From June 2005, the serum TSH concentration was determined using Molecular and Cobas 6000/8000, Roche Diagnostic Scandinavia, with the inter-and intra assay CVs being 7%, 6%, and 5%, respectively, at a mean serum TSH concentration of 0.4 mIU/L, 6 mIU/L, and 28 mIU/L, respectively.
Serum testosterone concentration from 2004 to August 2008, was determined using Advia Centaur, Scandinavia AB. The inter- and intra-assay CVs were 10%, 10%, and 10%, respectively, at a mean serum testosterone level of 3 nmol/L, 15 nmol/L, and 25 nmol/L, respectively. From September 2008, the serum testosterone concentration was determined using Access 2, Beckman Coulter, with the inter-and intra assay CVs being 10%, 10%, and 10%, respectively, at a mean serum testosterone concentration of 5 nmol/L, 20 nmol/L, and 40 nmol/L, respectively.
Serum estrogen concentration from 2004 to 2008, was determined using RIA, DiaSorin. The inter- and intra-assay CVs were 16% and 10%, respectively, at a mean serum estrogen level of 0.04 nmol/L and 0.4nmol/L, respectively. From 2009, the serum estrogen concentration was determined using Architect, Abbott Scandinavia AB, with the inter-and intra assay CVs being 16% and 10%, respectively, at a mean serum estrogen concentration of 121 pmol/L and 2047 pmol/L, respectively.
Statistical analysis
Patients were categorized as being deficient or not in one or more hormonal axes, and functioning, disability, and health in the two groups were compared. All statistical analysis was performed with PASW (Chicago, IL), version 18.0. Factor analysis was used to analyze data from the specifically designed questionnaire on functional impairment and activity limitation. Principal components analysis with Varimax rotation based on the correlation matrix was used to make informed decisions on reducing the number of variables, while retaining as many variables as needed to describe performance and dependency. Principal component analysis gives the number of variables (components) needed to capture most of the variance in the original data set. The determination of the specific variables to be extracted is both a statistical and a qualitative decision of the researcher. The correlation matrix was used to determine which variables clustered together in a meaningful way, and may measure aspects of the same underlying dimension (factor). Components were extracted according to Kaiser's criterion; therefore, the variables with loading values >0.6 were extracted from the rotated component matrix. Fisher's exact test and independent samples t test were used to compare groups with and without hormonal deficit. To determine whether hormonal status independently predicted outcome, multivariate analyses were performed; multiple linear regression was used to control for the outcome predictors of injury severity (e.g., clinical status, age, and CT characteristics) and for gender, BMI, epilepsy, alcoholism, and drug abuse
Ethics
The study was approved by the regional ethical review board of the University of Gothenburg. The aim of the study was carefully explained to the patients at the time of their inclusion, and again at the time of the patient assessment. Informed consent was obtained from each patient or the next of kin.
Results
Hormone deficiency
There were 51 patients in the study (13 females and 38 males). A pituitary insufficiency was diagnosed in 14 (1 woman, 27.5%). All hypopituitary patients had isolated deficiencies; 11 (21.6%) had GH deficiency, 2 (both men, 3.9%) had gonadotrophic deficiency, and 1 (a man, 2%) had a thyrotrophic deficiency.
Three patients (one with GH-deficiency and two with a normal pituitary function) had subnormal IGF-1 levels. Two patients had a mildly elevated serum prolactin concentration (491 and 541 mIU/L) with otherwise normal hormone levels. Three patients with low serum cortisol levels underwent a co-syntropin stimulation test with a concomitant normal rise of serum cortisol in all cases.
Comorbidity and sociodemographic and injury characteristics
A pituitary insufficiency was found in one third of the men, but in only 1 of 13 women (Table 1). Patients with GHD at follow-up were older at the time of injury (Table 1). This correlation persisted after we controlled for possible effect of gender, BMI, and injury severity (R2 change=0.12, p=0.015). Patients with GHD were more often overweight and had a higher BMI at the time of injury than those without GHD (Table 1). The most common causes of TBI were traffic accidents (53%), falls (29%), and assault (12%). No differences were found in the causes of TBI between the groups. Patients with hormonal deficiencies at follow-up had a more severe TBI according to the CRASH prognostic model at the time of injury; however, this difference was not significant (Table 1).
The patients are categorized as pituitary deficient or not and GH deficient or not, at follow up, 2 – 10 years after the injury. Data are given as mean (range) or absolute number (%).
95% confidence interval of the difference between the groups/p-value.
A significant difference between the groups.
Retrospectively analyzed, according to the CRASH prognostic model. Unfavorable outcome, Glasgow Outcome Scale–Extended score 1–4.
PTHP, post-traumatic hypopituitarism; GHD, growth hormone deficiency; M, male; F, female; BMI, body mass index; RLS, Reaction Level Scale; SAH, subarachnoidal hemorrhage; CRASH, Corticosteroid Randomization after Significant Head Injury.
Functioning and quality of life
There were no statistical differences in patient-reported quality of life measured by the SF-36 in patients with and those without pituitary deficiency (Table 2). Interestingly, when multivariate analyses were performed with multiple linear regression controlling for other outcome predictors, PTHP and GHD partly explained a better global outcome measured by GOS-E even though the fraction of variance explained was small (Table 3).
Patients are categorized on as pituitary deficient or not, and GH deficient or not, at follow up. Data on follow-up time and age are given as median (range). Data measured by GOS-E and SF-36 are given as mean (range) or absolute number (%).
95% confidence interval of the difference between the groups/p-value.
Significant difference between the groups.
1=dead, 2=vegetative state, 3=lower severe disability, 4=upper severe disability, 5=lower moderate disability, 6=upper moderate disability, 7=lower good recovery, 8=upper good recovery.
Higher scores indicate a better health-related quality of life.
PTHP, post-traumatic hypopituitarism; GHD, growth hormone deficiency; GOS-E, Glasgow Outcome Scale -Extended; SF-36; Short Form Health Survey-36.
The results show how pituitary and somatotroph axis function explains the outcome measures when adjusted for gender, injury severity, age, epilepsy,, alcoholism and drug abuse. For BMI at follow-up we additionally adjusted for BMI at the time of injury.
Pituitary function partly explains a high BMI.
BMI, body mass index; ADL, activities of daily living; SF-36, Short Form Health Survey-36; GOS-E, Glasgow Outcome Scale –Extended.
Patients with or without hypopituitarism showed no statistically significant differences in perceived problems with cognitive, emotional, or physical functions, dependence in activities, and participation in work (Tables 4 and 5). PTHP and BMI were significantly associated at follow-up but not at the time of injury (Table 5). Patients with PTHP and within that group, patients with GHD, were more often overweight at the time of follow-up. The groups did not differ in weight gain after trauma. When multivariate analyses were performed, PTHP partly explained a higher BMI, although the fraction of variance explained is small (Table 3). TBI patients with PTHP, and especially those with GHD, more often had cardiovascular disease or diabetes mellitus (Table 5). No association was found between PTHP and smoking, alcoholism, drug abuse, epilepsy, or use of antiepileptic drugs (Table 5).
Data are given as mean (range) or absolute number (%). Patients are categorized as pituitary deficient or not, and GH deficient or not, at follow-up.
Questionnaire specifically designed for the study, using the framework of International Classification of Functioning, Disability, and Health; clinical examination. Higher scores denote more impairment or limitation.
95% confidence interval of the difference between the groups/p-value.
Not a significant difference between the groups.
PTHP, post-traumatic hypopituitarism; GHD, growth hormone deficiency; P-ADL, personal activities of daily living; I-ADL, instrumental activities of daily living.
Data are given as mean (range) or absolute number (%).The patients are categorized as pituitary deficient or not and GH deficient or not, at follow-up.
Questionnaire specifically designed for the study, using the framework of ICF; clinical examination.
95% confidence interval of the difference between the groups/p-value.
A significant difference between the groups.
Alcoholism and drug abuse.
Gaining weight, reduced libido, impotence, and irregular menstrual cycles.
PTHP, post-traumatic hypopituitarism; GHD, growth hormone deficiency; BMI, body mass index; M, male; F, female.
Discussion
In contrast to most previous studies of PTHP and outcome, our findings in this study do not support the hypothesis that PTHP causes disability and decreased quality of life in patients with severe TBI. 18,20 –26,28,29 Our TBI patients with hypopituitarism did not report worse psychological, cognitive, or motor functions, all of which are important predictors of activity level and participation. In our study approximately 25% of the patients had PTHP, most commonly deficiencies of GH and gonadotrophins, which is in accordance with the prevalence published in previous studies. 14,16
All of our patients had a severe TBI and received similar acute care in a modern NICU at a university hospital, where all severe TBI patients are admitted within the Västra Götaland region. For this relatively homogenous group of patients, we were able to provide a valid comparison of injury characteristics as outcome predictors versus hormonal status by combining the predictive value of some of the clinical parameters and CT findings into the validated and generalizable CRASH prognostic model of TBI. Predictors of patient injury severity, including age, were controlled for, as were gender, substance abuse, epilepsy, and BMI, allowing an estimation of hormonal status as an independent outcome predictor.
The results showed no significant correlation between hypopituitarism and patient-reported quality of life and functioning in the severe TBI patients.
Changes in outcome can continue for many years after TBI, and many factors, possibly including pituitary function, may influence the global outcome in patients with TBI. 3,4,6,36 The time from injury to follow-up in this study is much longer than in most studies linking PTHP to disability and decreased quality of life (2–10 years versus 6 months to 2 years) and might partially explain the difference in outcome. However, in a recent study of TBI patients with persistent cognitive and/or behavioral disorders who underwent cognitive testing and were followed as long as our patients, cognitive function and activity performance were worse in patients with PTHP. 22
There are discrepancies in the limited data on PTHP and outcome. Several studies have described worse outcomes in patients with hypopituitarism, but these findings were not confirmed in others. 17,19,27 Although associations are interesting, they do not prove causality, and there may well be common risk factors for both PTHP and impaired well-being.
Few studies used a similar approach to ours, examining the relative contribution of the injury severity and PTHP to outcome. One of them, relating neuropsychological complaints to pituitary function and to CT scan findings at the time of injury, showed no significant difference in neuropsychological complaints and HRQL between the groups, measured with patient-reported questionnaires. 17 The other studies described worse global and functional outcome and HRQL in patients with PTHP than in those with normal pituitary function. 22,26,29
GHD is associated with a reduced HRQL 37 –39 However, it is unclear whether pituitary dysfunction influences HRQL in TBI patients. A few studies have reported a worse HRQL in patients with PTHP, with poorer sleep and energy levels and an increased sense of social isolation. 18,23 Both prospective studies and cross-sectional studies have described poorer HRQL in TBI patients with GHD. 18,23,25,29 All of these studies evaluated patients up to 1 year after the injury.
Studies have now related PTHP to cognition and functional outcome in TBI patients tested within 1 year or up to 2 years after injury. 20,21,28
TBI patients with GHD have been reported to experience greater deficits in attention, executive functioning, memory, and emotion than GH-sufficient TBI patients. 21,22,28
Hypopituitarism is associated with an unfavorable body composition and lipid profile, features that tend to improve when relevant insufficiencies are treated. 40 –43
Our study confirms the findings of previous studies that the mean BMI was greater for the hormonally deficient patients than for those without hormonal deficiency at the time of follow-up. Studies of body composition reported that BMI, total abdominal fat mass, and LDL cholesterol and triglycerides were higher in TBI patients with PTHP. 20,23,29,44
Our findings suggest that pituitary function partially explains a high BMI in this group of patients even though the fraction of variance explained is small. Furthermore, the patients with PTHP in our study were more often overweight at the time of follow-up.
Many factors may act as confounders and contribute to these findings, including physical activity, appetite and food intake, medications, and common comorbidities of TBI such as epilepsy, alcoholism, and drug abuse, partly controlled for in the current study. In addition, it has been established that spontaneous and stimulated secretion of GH is lower in obese than in normal weight individuals, and even though specific BMI-related cutoff limits were assumed in our study, the patients with a high BMI might have a higher risk of a false- positive test for PTHP caused by metabolic changes. 45 –47
The fact that most of the patients with PTHP were overweight suggests that BMI in TBI patients should be monitored more closely, and that greater effort should be made to help them lose weight. GH replacement therapy could be an important supplement to other interventions to reduce weight (e.g., lifestyle changes, a healthier diet, and increased physical training).
The TBI patients with GHD in our study were older than those with normal GH secretions. This is an interesting finding, which indicates a possible predisposing factor for the development of GHD after TBI. Discrepancies in published data on the association between age and PTHP suggest that this issue needs to be studied more extensively. 23,29 Hypopituitarism increases the risk of premature death, mainly because of an increased prevalence of cardiovascular disease. 48,49 GHD is the most likely explanation for this finding. 50 –52 An important finding in our study was that the TBI patients with PTHP, and especially those with GHD, more often had cardiovascular disease and/or diabetes mellitus. These findings linking PTHP to important health issues that might cause functional impairments and premature death suggest that even though the study did not support its effects on functional outcome and quality of life as measured here, a longer follow-up time would be needed to measure the effects of these health issues.
Limitations
A limitation of the study was the relatively small sample size. The patients who were excluded or lost to follow-up might have differed from the study population in regard to injury severity, comorbidity, psychosocial status, and, possibly, even hormonal status. Therefore, our findings cannot be generalized to all patients with severe TBI. However, multivariate analyses gave no indication of a worse functional outcome in our PTHP patients. Another limitation of the study is that only a patient-report instrument was used to measure functioning; therefore, the results are not as reliable as if both patient-reports and functional tests had been used. Finally, the assessment of global outcome in our study included functions, activities, participation, and HRQL. As hormonal status was evaluated 2–10 years after the injury, we have not been able to predict whether important determinants of global outcome, premature death, substance abuse, and serious illness that would hinder participation in our study, might be more common in patients with PTHP.
Conclusion
Despite the homogeneous patient population, long follow-up time, and consideration of injury severity as an outcome predictor, this study did not confirm results from previous studies linking PTHP to disability and decreased quality of life. Our study does suggest that screening for PTHP might be restricted to specific subgroups such as overweight patients. The finding that patients with PTHP are often overweight needs to be studied more extensively.
Footnotes
Acknowledgments
This study was based on data from the Sahlgrenska University Hospital. The authors acknowledge research support from ALF Göteborg, AFA Insurance, Sten A Olsson Foundation for Research and Culture, the Swedish Cancer & Traffic Injury Society Fund, and the Länsförsäkringar Alliance. The authors gratefully acknowledge the participants and their next of kin for their participation in the study. They also thank Ingrid Morberg at the Rehabilitation Medicine, Olof Ehn and Olof Strandberg at the Department of Endocrinology, and Heléne Seeman-Lodding at the NICU, the Sahlgrenska University Hospital, for their support and practical assistance, as well as Anna Ekmans for statistical advice.
Author Disclosure Statement
Thord Rosén has received honoraria for lecturing for the pharmaceutical companies Pfizer, Novo Nordisk, and Bayer Schering Pharma. He has received a grant from Pfizer and the insurance company Länsförsäkringar Alliance. No competing financial interests exist for Trandur Ulfarsson, Gudni Arnar Gudnason, Christian Blomstrand, Katharina Stibrant Sunnerhagen, Åsa Lundgren-Nilsson, and Michael Nilsson.