
Abstract
The pathophysiological changes in the pericontusional region after traumatic brain injury (TBI) have classically been considered to be ischemic. Using [F-18]fluorodeoxyglucose (FDG) and triple-oxygen PET studies, we examined the pericontusional “penumbra” to assess for increased oxygen extraction fraction (OEF), anaerobic metabolism, and tissue viability. Acute (≤4 days) CT, MRI, and PET studies were performed in eight patients with TBI who had contusions. Four regions-of-interest (ROI) containing the contusion core, pericontusional hypodense gray matter (GM), pericontusional normal-appearing GM, and remote normal-appearing GM, were defined using a semi-automatic method. The correlations of cerebral blood flow (CBF) with OEF, cerebral metabolic rate of oxygen (CMRO2), and cerebral metabolic rate of glucose (CMRglc) were examined. The oxygen-glucose ratio (OGR) in each brain region was evaluated for anaerobic metabolism. The results show that pericontusional tissue had progressively diminishing OEF, CBF, CMRO2, or CMRglc approaching the contusion core. In general, there was a preserved ratio of CBF to CMRO2 in pericontusional hypodense GM. The OGR of the pericontusional hypodense GM was low (<4.0) and was inversely correlated (r=−0.68) with time after injury. A large proportion (%area: 22–76%) of pericontusional hypodense GM tissue had CMRO2 values less than 35 μmol/100 g/min, with this percentage increased with time after injury.
Introduction
C
Conventionally, ischemia has been considered a major pathophysiological component of traumatic brain injury (TBI), 3,4 an assumption that began with the classic post-mortem studies of Graham and Adams 6,7 in which post-traumatic histopathological changes appear similar to those seen after classic ischemia. Subsequent in vivo studies, using global CBF and arteriovenous (AV) differences of oxygen concentration measurements, largely failed to detect appreciable ischemia. 8 It was suggested that the “elusive” ischemic event likely occurred immediately after the traumatic event, before timing of most clinical studies. 9
An alternative hypothesis was that ischemia was a focal phenomenon and therefore not detectable by global AV difference studies. It is generally agreed that ischemia cannot be solely defined by blood flow values, but rather requires the concomitant measurement of regional oxygen utilization in the same region. 10 –12 Using multitracer O-15 positron emission tomography (PET) imaging, Coles and associates 13 inferred the existence of ischemia based on a statistical voxel-based analysis but were unable to demonstrate focal discrete areas of ischemia. Our multitracer PET studies, however, did not find noticeable ischemia in cortical gray matter or white matter remote from hemorrhagic lesions. 14
Convincing evidence of demonstrable ischemia surrounding cerebral contusions has been similarly elusive. Cunningham and colleagues, 15 using PET imaging, demonstrated that contused regions had significantly lower CBF, oxygen extraction fraction (OEF), and cerebral metabolic rate of oxygen (CMRO2) values compared with non-lesion regions. The authors could not find a single absolute threshold of these physiological variables that could accurately differentiate damaged brain tissue.
Along with an elevated OEF associated with a low CBF, ischemia has traditionally been equated with anaerobic glycolysis. Microdialysis studies of patients with TBI have shown an increase of the lactate/pyruvate (L/P) ratio. 16,17 The temporal dynamics of these findings suggested that these physiological variables varied over time after injury. An increased L/P ratio, presumably from a build-up of lactate, could be interpreted as indirect evidence of anaerobic metabolism. Our previous studies of TBI patients with [F-18]fluorodeoxyglucose (FDG) and triple-oxygen PET studies, measuring regional cerebral metabolic rate of glucose (CMRglc), CMRO2, CBF, and OEF, 14,18 found an intermix of regional and global hyperglycolysis, although most patients exhibited various degrees of decreased CMRglc. Similarly, most patients exhibited depressed CBF values, but evidence of ischemia based on elevated OEF was not encountered. 17 The analysis, however, excluded pericontusional areas.
Here, we have focused on re-analysis of our FDG and triple-oxygen PET studies to study physiological changes within the contusional complex, including the contusion core and the pericontusional hypodense gray matter (GM) regions, plus the normal-appearing GM immediately surrounding the contusional complex after TBI. In particular, we examined whether an “ischemic penumbra” and anaerobic metabolism occurs within and/or adjacent to contusions. We implemented a semi-automatic method of defining regions of interest (ROIs) based on conformal anatomical information in CT/MR images together with cluster analysis, 19 restricting the regions of analysis to surrounding cortical GM. We excluded white matter (WM) from the analysis because of its lower basal perfusion and metabolic rates compared with GM, both in health and disease. 20 We sought to help explain the etiology of expansion of contusions and to determine whether the concept of a potentially salvageable penumbra applied.
Methods
Human subjects
The inclusion and exclusion criteria for the patients in current work have been described in detail in a previous publication. 14 In brief, 28 patients with TBI and 24 normal volunteers underwent PET studies at the Medical Center of the University of California at Los Angeles from April 1, 2000, through June 20, 2002. (Because of various logistic issues, no additional triple-oxygen studies were performed at our center in the past 10 years.) Among the subjects recruited, five TBI patients and eight volunteers had incomplete PET studies because of technical problems. For the remaining 23 TBI patients, 8 male patients had cerebral contusions and complete sets of CT, MRI, and PET studies needed by the current studies. The age of a contusion was defined as the number of hours after the injury when the PET scan was performed. The general demographics and physiological data of the eight patients are summarized in Table 1. The study was approved by the UCLA Institutional Review Board.
MVA, motor vehicle accident; Ped vs. auto, pedestrian involved in a car accident (¶: a bicyclist); blunt, hit by unknown hard object, found down at bottom of stairs.
Rt, right; Lt, left; F, frontal lobe; P, parietal lobe; T, temporal lobe
AVDO2 was calculated as the difference in oxygen contents between arterial and jugular venous samples.
CMRO2 is the product of AVDO2 and Xe-CBF.
GCS, Glasgow Coma Scale; PET, positron emission tomography; AVDO2, arterio-jugular differences of oxygen; CMRO2, cerebral metabolic rate of oxygen.
Image acquisition and analysis protocols
The initial CT scan was performed on arrival to the Emergency Department. Patients harboring cerebral contusions routinely received a second CT within 4 h, and subsequently one or more CT scans depending on clinical circumstances. Each subject also underwent a MRI (General Electric Lx/5x 1.5 Tesla) scan with T2, 3D-SPGR (TR=24 msec; TE=3 msec), 2D-FLASH (T2*), and FLAIR (TR=10,000 msec; TE=157 msec, TI=2200 msec, 256×256 transaxial-view matrix with 5-mm plane thickness/2.5-mm interslice gap) study within 48 h of admission.
PET scans were performed within 4 days after injury. The acquisitions of PET data and blood samples were described in detail previously. 14,18 In brief, an ECAT EXACT HR+ PET scanner (CTI/Siemens, Knoxville, TN) with an axial field of view of 15.5 cm and a full-width-at-half-maximum (FWHM) of 4.3 mm at the center of field of view was used. All studies used three-dimensional (3D) acquisition. FDG and [15O]H2O studies used intravenous bolus injection; the [15O]CO and 15O-O studies used single-breath inhalation. All TBI patients were intubated and mechanically ventilated during the PET studies. The total oxygen contents in artery and jugular bulb were measured by taking two blood samples at the end of the 15O-O study. Generation of the parametric images of CMRglc (μmol/100 g/min), CBF (unit: mL/100 g/min), OEF (%), and CMRO2 (unit: μmol/100 g/min) has also been described in detail before. 14 The oxygen-glucose ratio (OGR) was calculated.
The CT scan obtained nearest in time to the MRI study was used to co-align the PET, MRI, and CT images using a six-parameter rigid-body transformation program. 21 Image alignment was inspected visually using programs with image-fusion and edge-alignment features.
ROI analysis using cluster analysis algorithm
To date, very different physiological values within and around the contusions of traumatic injured brains have been reported in the literature. There have been inconsistencies of region definitions, many of which have been hand drawn, that confound the interpretation of the results. A common shortcoming was lumping together both WM and GM regions in the analysis, despite the fact that WM is known to have markedly lower metabolic and blood flow requirements.
Previously, we had demonstrated the usefulness of using cluster analysis to define regions without the need of ROI drawing. 22 In this study, we used conformal anatomical information derived from both CT and MR images and cluster analysis algorithms to define ROI regions restricted to GM. The goal here was to generate ROIs in semi-automated manner based on objective, reproducible methodology. The clustering method (multiple image planes, 3D regions) were compared and validated (Fig. 1) using the traditional method (single image plane, two dimensional [2D] regions) in which ROIs were manually defined on CT image.

Comparison of the regional cerebral blood flow (CBF) values obtained from the clustering and the traditional regions of interest method, respectively. Plot A shows the individual patient (n=8) data of the four regions in different colors: Region 1, remote normal-appearing GM (purple dots); region 2, pericontusional normal-appearing gray matter (GM) (green dots); region 3, pericontusional hypodense GM (red dots); region 4, contusion core (blue dots). Plot B shows the mean values (±1 standard deviation) of the eight patients from each type of region.
Our ROI methodology operationally defined four distinct regions (see Fig. 2):
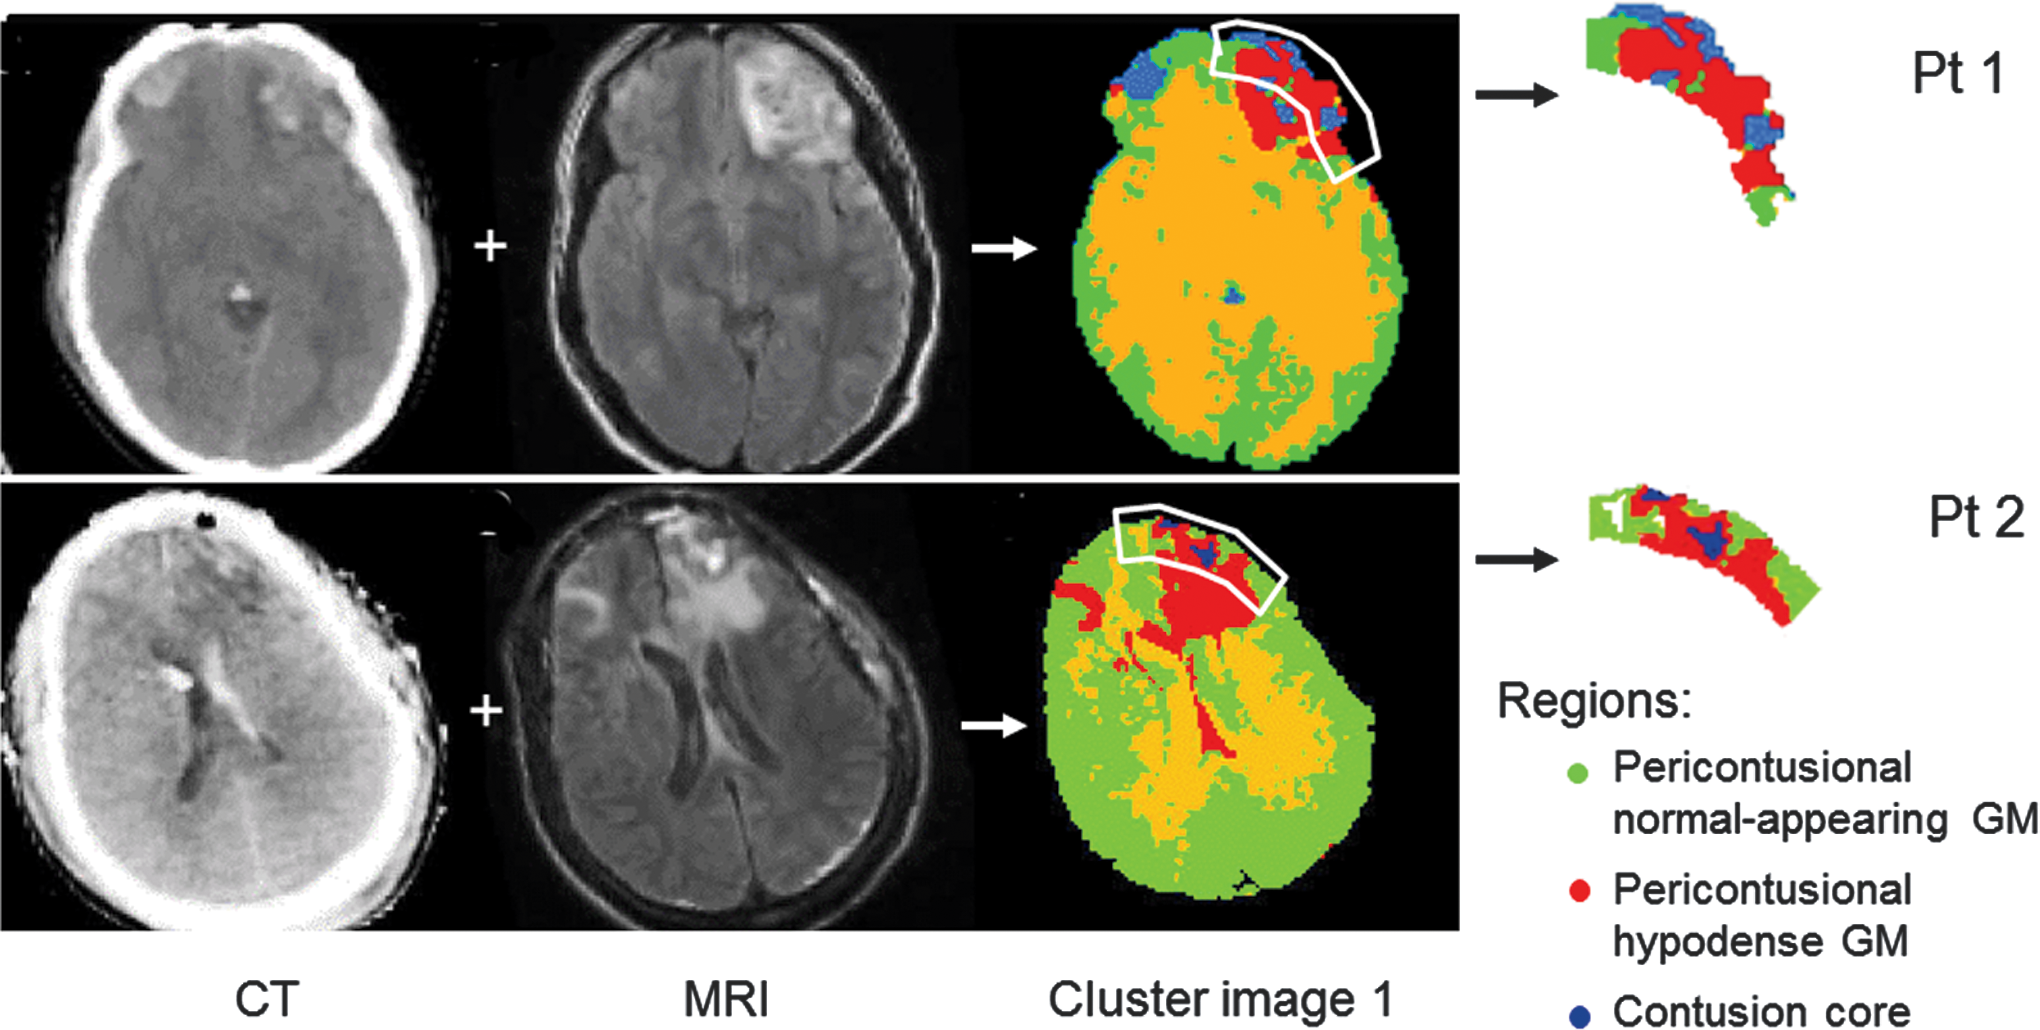
CT, FLAIR MRI, and initial cluster image corresponding to the patients shown in Figure 2. The cluster images were first generated from CT and MR images by the computer program. Subsequently, the program used the regions of interest (outlined in white; manually drawn earlier) to confine the data analysis to the four centrifugal pericontusional regions—contusional core (blue), pericontusional hypodense GM (red), and pericontusional normal-appearing GM (green).
Contusion core
This was primarily defined as CT-hyperdense tissue representing frank hemorrhage. The CT-derived Hounsfield unit (HU) was used for thresholding purposes.
Pericontusional hypodense GM
GM regions immediately adjacent to the contusion core were identified by cluster analysis based on CT-hypodense tissue in an area of abnormal MRI findings (relative to normal-appearing brain). In clinical realms, this region might be denoted as “edematous,” although it is acknowledged that other explanations could apply.
Pericontusional normal-appearing GM
This GM tissue immediately surrounded the MRI-defined contusion complex (including the contusion core and pericontusional hypodense GM). Both CT and MRI characteristics were equivalent to cortical brain regions remote from the contusion.
Remote normal-appearing GM
Cortical brain tissue manually identified at least 3 cm from any contusion core. For unilateral contusions, the mirror contralateral regions were selected.
The separation of the contusion core and pericontusional hypodense GM regions, the latter of which was denoted in previous studies as “edema,” was performed for analytical purposes albeit with the acknowledgment that physicians might lump both within a clinically-defined “contusion complex.”
For each patient, multiple image planes covering one cerebral contusion volume were analyzed. If more than one contusion was present, the one with the largest affected volume was used. To standardize and objectify the analysis as much as possible, cluster analysis (k=4; 2D clustering 19 ) was used incorporating the co-registered CT and MRI (FLAIR) data sets. The automated cluster analysis program efficiently (<10 sec) differentiated the contusion core, pericontusional hypodense regions, and normal-appearing brain. To separate normal-appearing WM from GM, a second cluster image was generated based on SPGR MRI. 18 ROIs (e.g., ROIs outlined in white in Fig. 2) were then manually drawn to (1) include a ∼1 cm thick halo of normal-appearing GM (pericontusional normal-appearing gray matter) and (2) exclude most WM by including only the outward ∼1 cm of tissue within the contusion complex. The mask of the remote normal-appearing GM was generated from the second cluster images by extracting the GM voxels contralateral to the contusion.
Regional CMRO2 data were used as an indicator of tissue viability using a threshold value of 35 μmol/100 g/min based on published TBI and ischemia literature. 11,15,23,24 The % area of irreversibly damaged tissue in each region was calculated by dividing the number of nonviable (i.e., < 35 μmol/100 g/min) voxels by the total voxel number of the region.
Statistical analysis
All regional data are presented as mean±1 standard deviation. The CBF, OEF, CMRO2, and CMRglc obtained from the above four defined regions were compared using repeated measures analysis of variance (ANOVA). Post hoc comparisons were made using the Scheffé test. A p value smaller than 0.05 was considered statistically different. Correlations were evaluated by computing the Pearson product moment correlation coefficients (r).
Results
Figure 3 shows the parametric images of CMRglc, CBF, OEF, and CMRO2 from Patients 1 and 2 in Table 1 that are representative of all the subjects. These subjects were selected as examples to further illustrate evolution of changes because the PET study was obtained at different times (40 vs. 84 h) after the injury. Figure 2 shows the co-aligned CT, MRI, and initial cluster images of the same two patients, demonstrating that the anatomical images visually corresponded to physiological parameters measured by PET shown in Figure 3. A good separation of contusional core and pericontusional hypodense GM from normal-appearing brain tissue was consistently obtained using the clustering method. Validation of the clustering method was demonstrated in Figure 1. The CBF values of the eight patients obtained from the clustering method were comparable (p>0.5; repeated measures ANOVA; two-factor study) to those obtained from the traditional method using manually drawn ROIs. Regardless of which of the two methods was used, there were significant (p<0.05; single factor study) differences among the CBF of remote normal-appearing, pericontusional normal-appearing, and pericontusional hypodense GM.

Parametric images of cerebral metabolic rate of glucose (CMRglc), cerebral blood flow (CBF), oxygen extraction faction (OEF), and cerebral metabolic rate of oxygen (CMRO2) for Patients 1 and 2 corresponding to Table 1.
Using the clustering method, the mean OEF, CBF, CMRO2, and CMRglc, values calculated from the four regions for each of the eight subjects are shown in Figure 4. Although absolute values differed across subjects, a similar pattern of change was found with OEF, CBF, CMRO2 and CMRglc values, being highest in remote normal-appearing GM (region 1), then diminishing in order of adjacent pericontusional normal-appearing GM (region 2), pericontusional hypodense GM (region 3), and finally contusion core (region 4) being the lowest. Repeated measures ANOVA revealed significant (p<0.001; Table 2) differences in OEF, CBF, CMRO2, and CMRglc among the four regions. Post-hoc analyses of remote normal-appearing GM versus pericontusional hypodense GM were significantly different (p<0.05). Of note, OEF values of pericontusional hypodense GM were low in all subjects.

Mean values of (
GM, gray matter; ANOVA, analysis of variance; OEF, oxygen extraction fraction; CBF, cerebral blood flow; CMRO2, cerebral metabolic rate of oxygen; CMRglc, cerebral metabolic rate of glucose.
Figure 5 shows the scatter plots of CBF, OEF, CMRO2, and CMRglc in the four ROI of Patient 1 and Patient 2. Unlike the CBF/OEF changes found in ischemic penumbra of stroke patients, where reduced CBF is associated with elevated OEF, a pattern of gradual diminishment of both CBF and OEF toward the contusional core was seen. Similarly, a gradually diminishing CMRO2 toward the contusional core was shown. In general, a linear relationship between the CBF and the CMRO2 was maintained in voxels within the four regions. The correlation coefficients of the four clusters are all > 0.62 and > 0.54 for Patient 1 and Patient 2, respectively. The scatter plots of CBF and CMRglc of the two patients are shown in the bottom row of Figure 5. In general, there were higher CMRglc/CBF ratios in the pericontusional hypodense GM than in the remote normal-appearing GM.
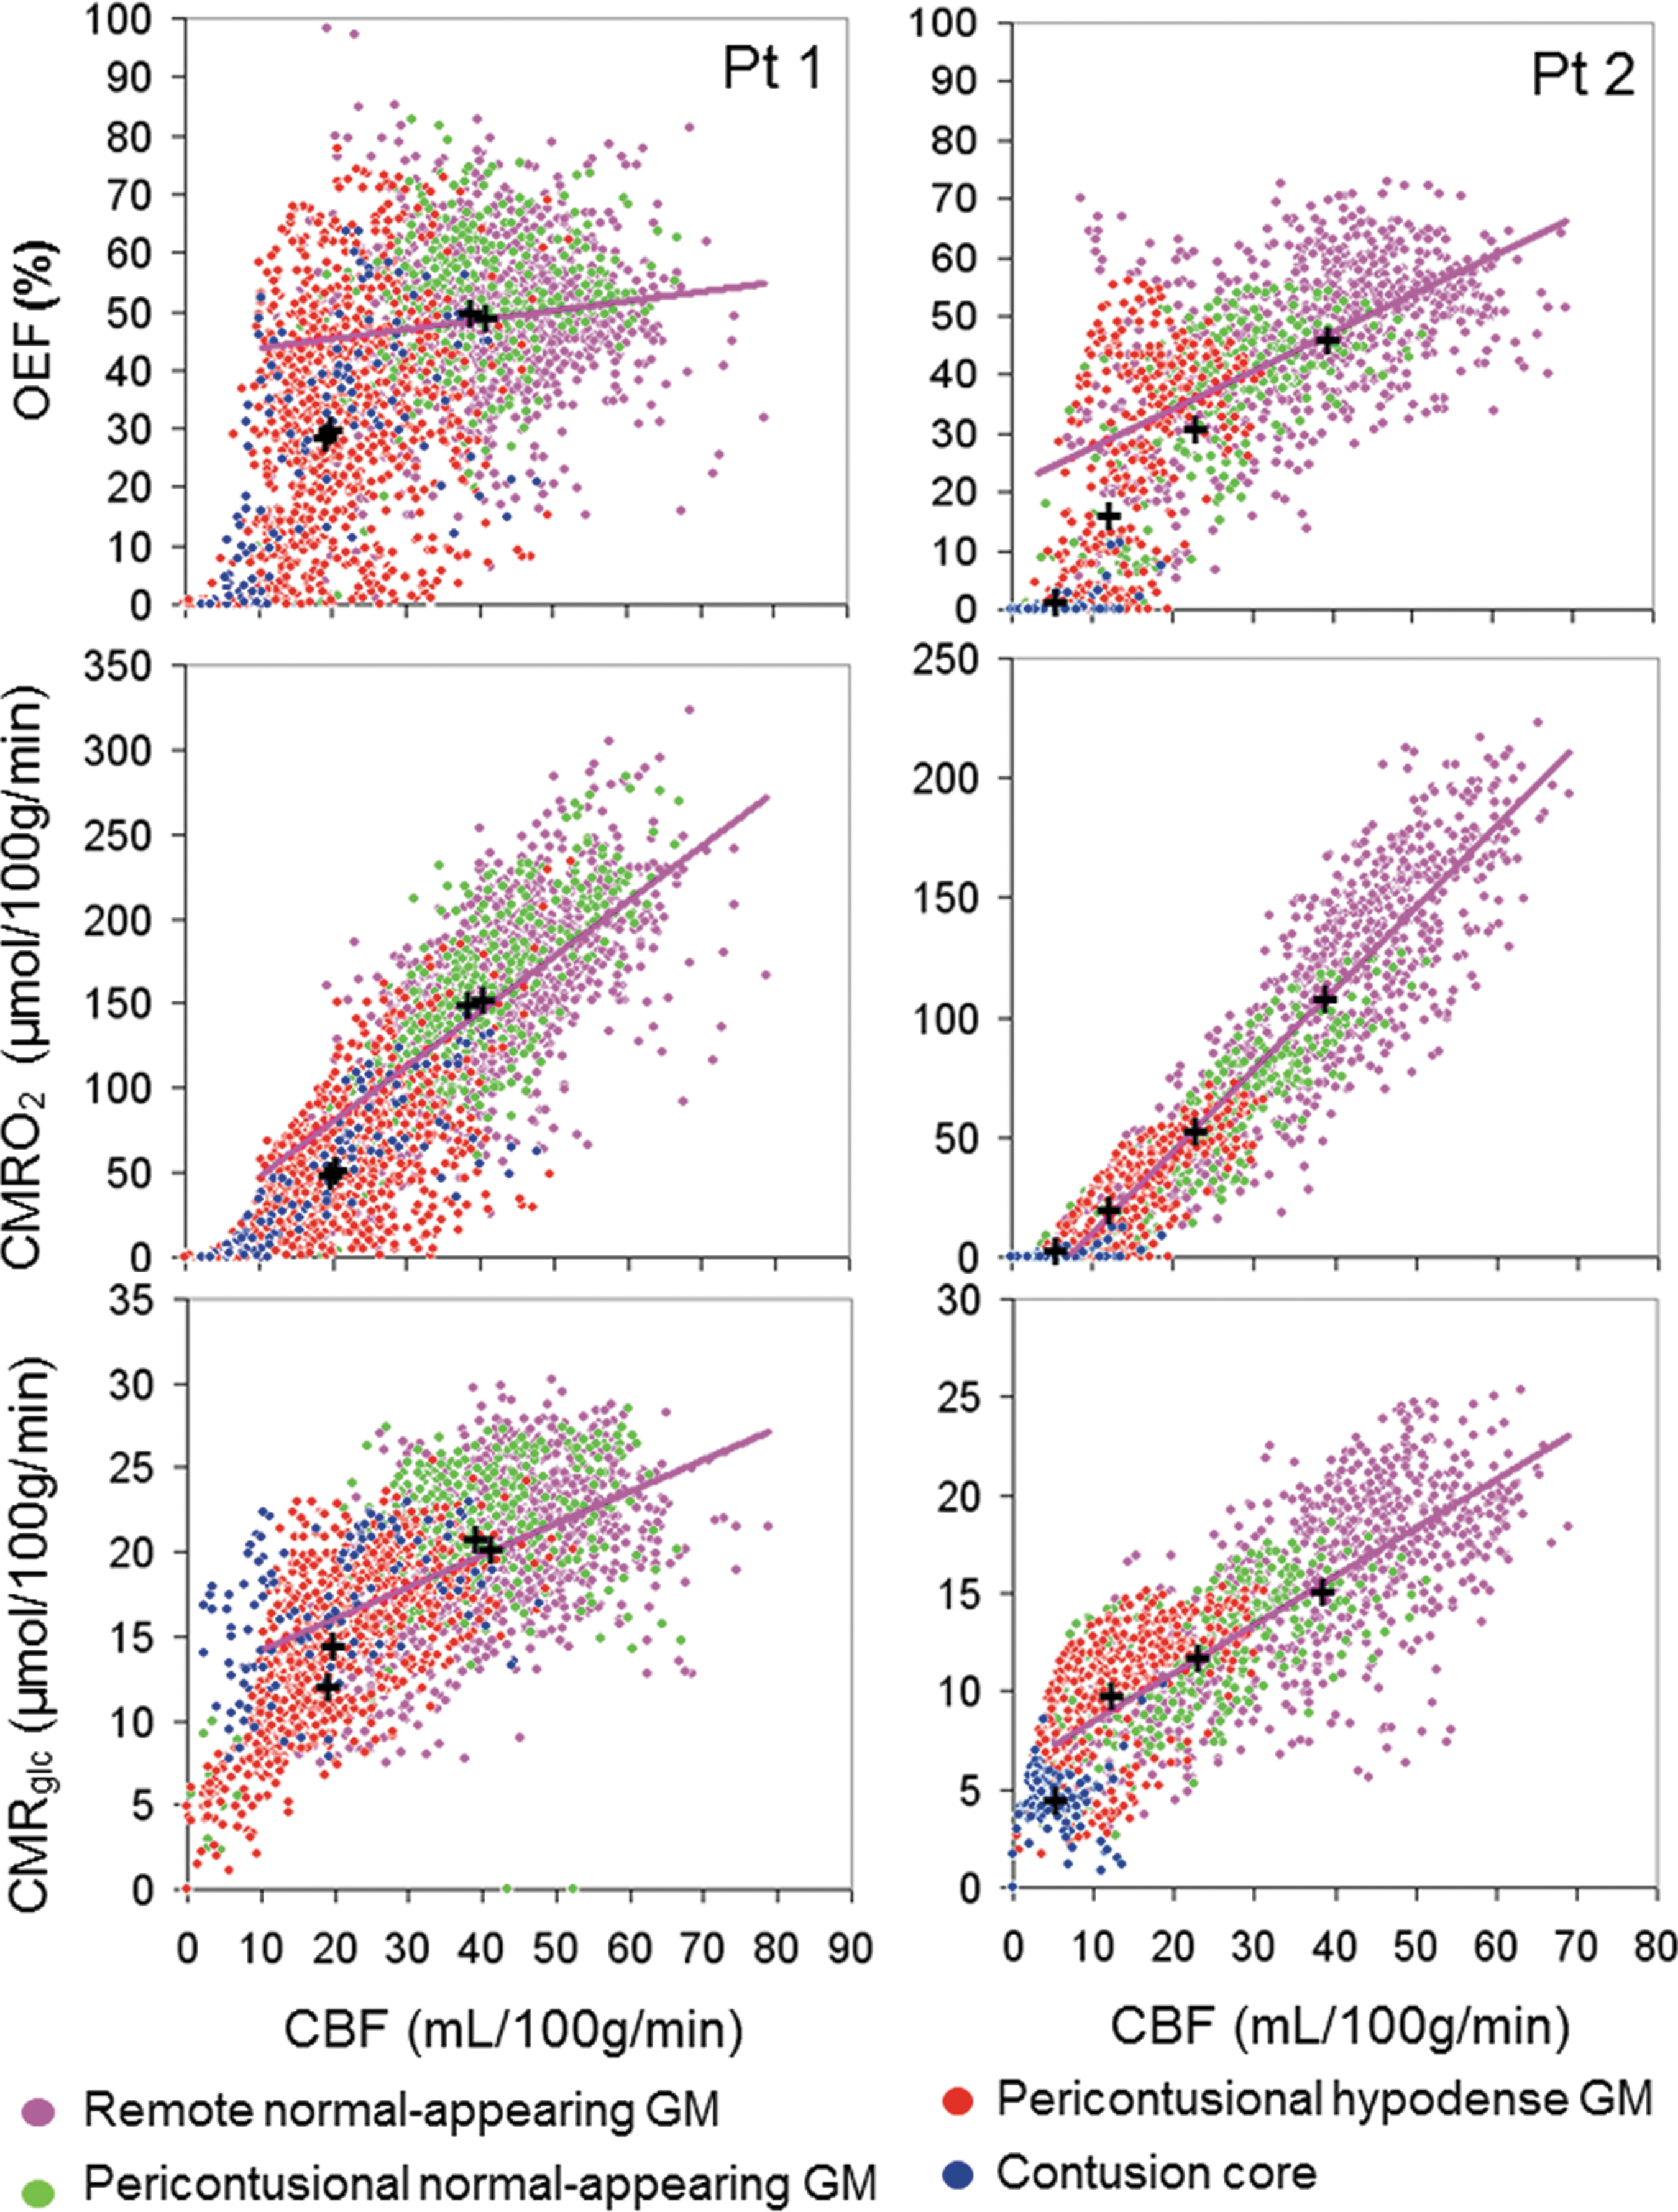
Scatter plots (left: Patient 1; right: Patient 2) showing concurrent changes of cerebral blood flow (CBF) and oxygen extraction fraction (OEF) (upper row), CBF and cerebral metabolic rate of oxygen (CMRO2) (middle row), and CBF and cerebral metabolic rate of glucose (CMRglc) (lower row) voxels of the contusional core (blue), the pericontusional hypodense GM (red), the pericontusional normal-appearing GM (green), and the remote normal-appearing GM (purple). Regression lines for the voxels in remote normal-appearing GM are shown in purple. The “+” labels mean values of the four regions.
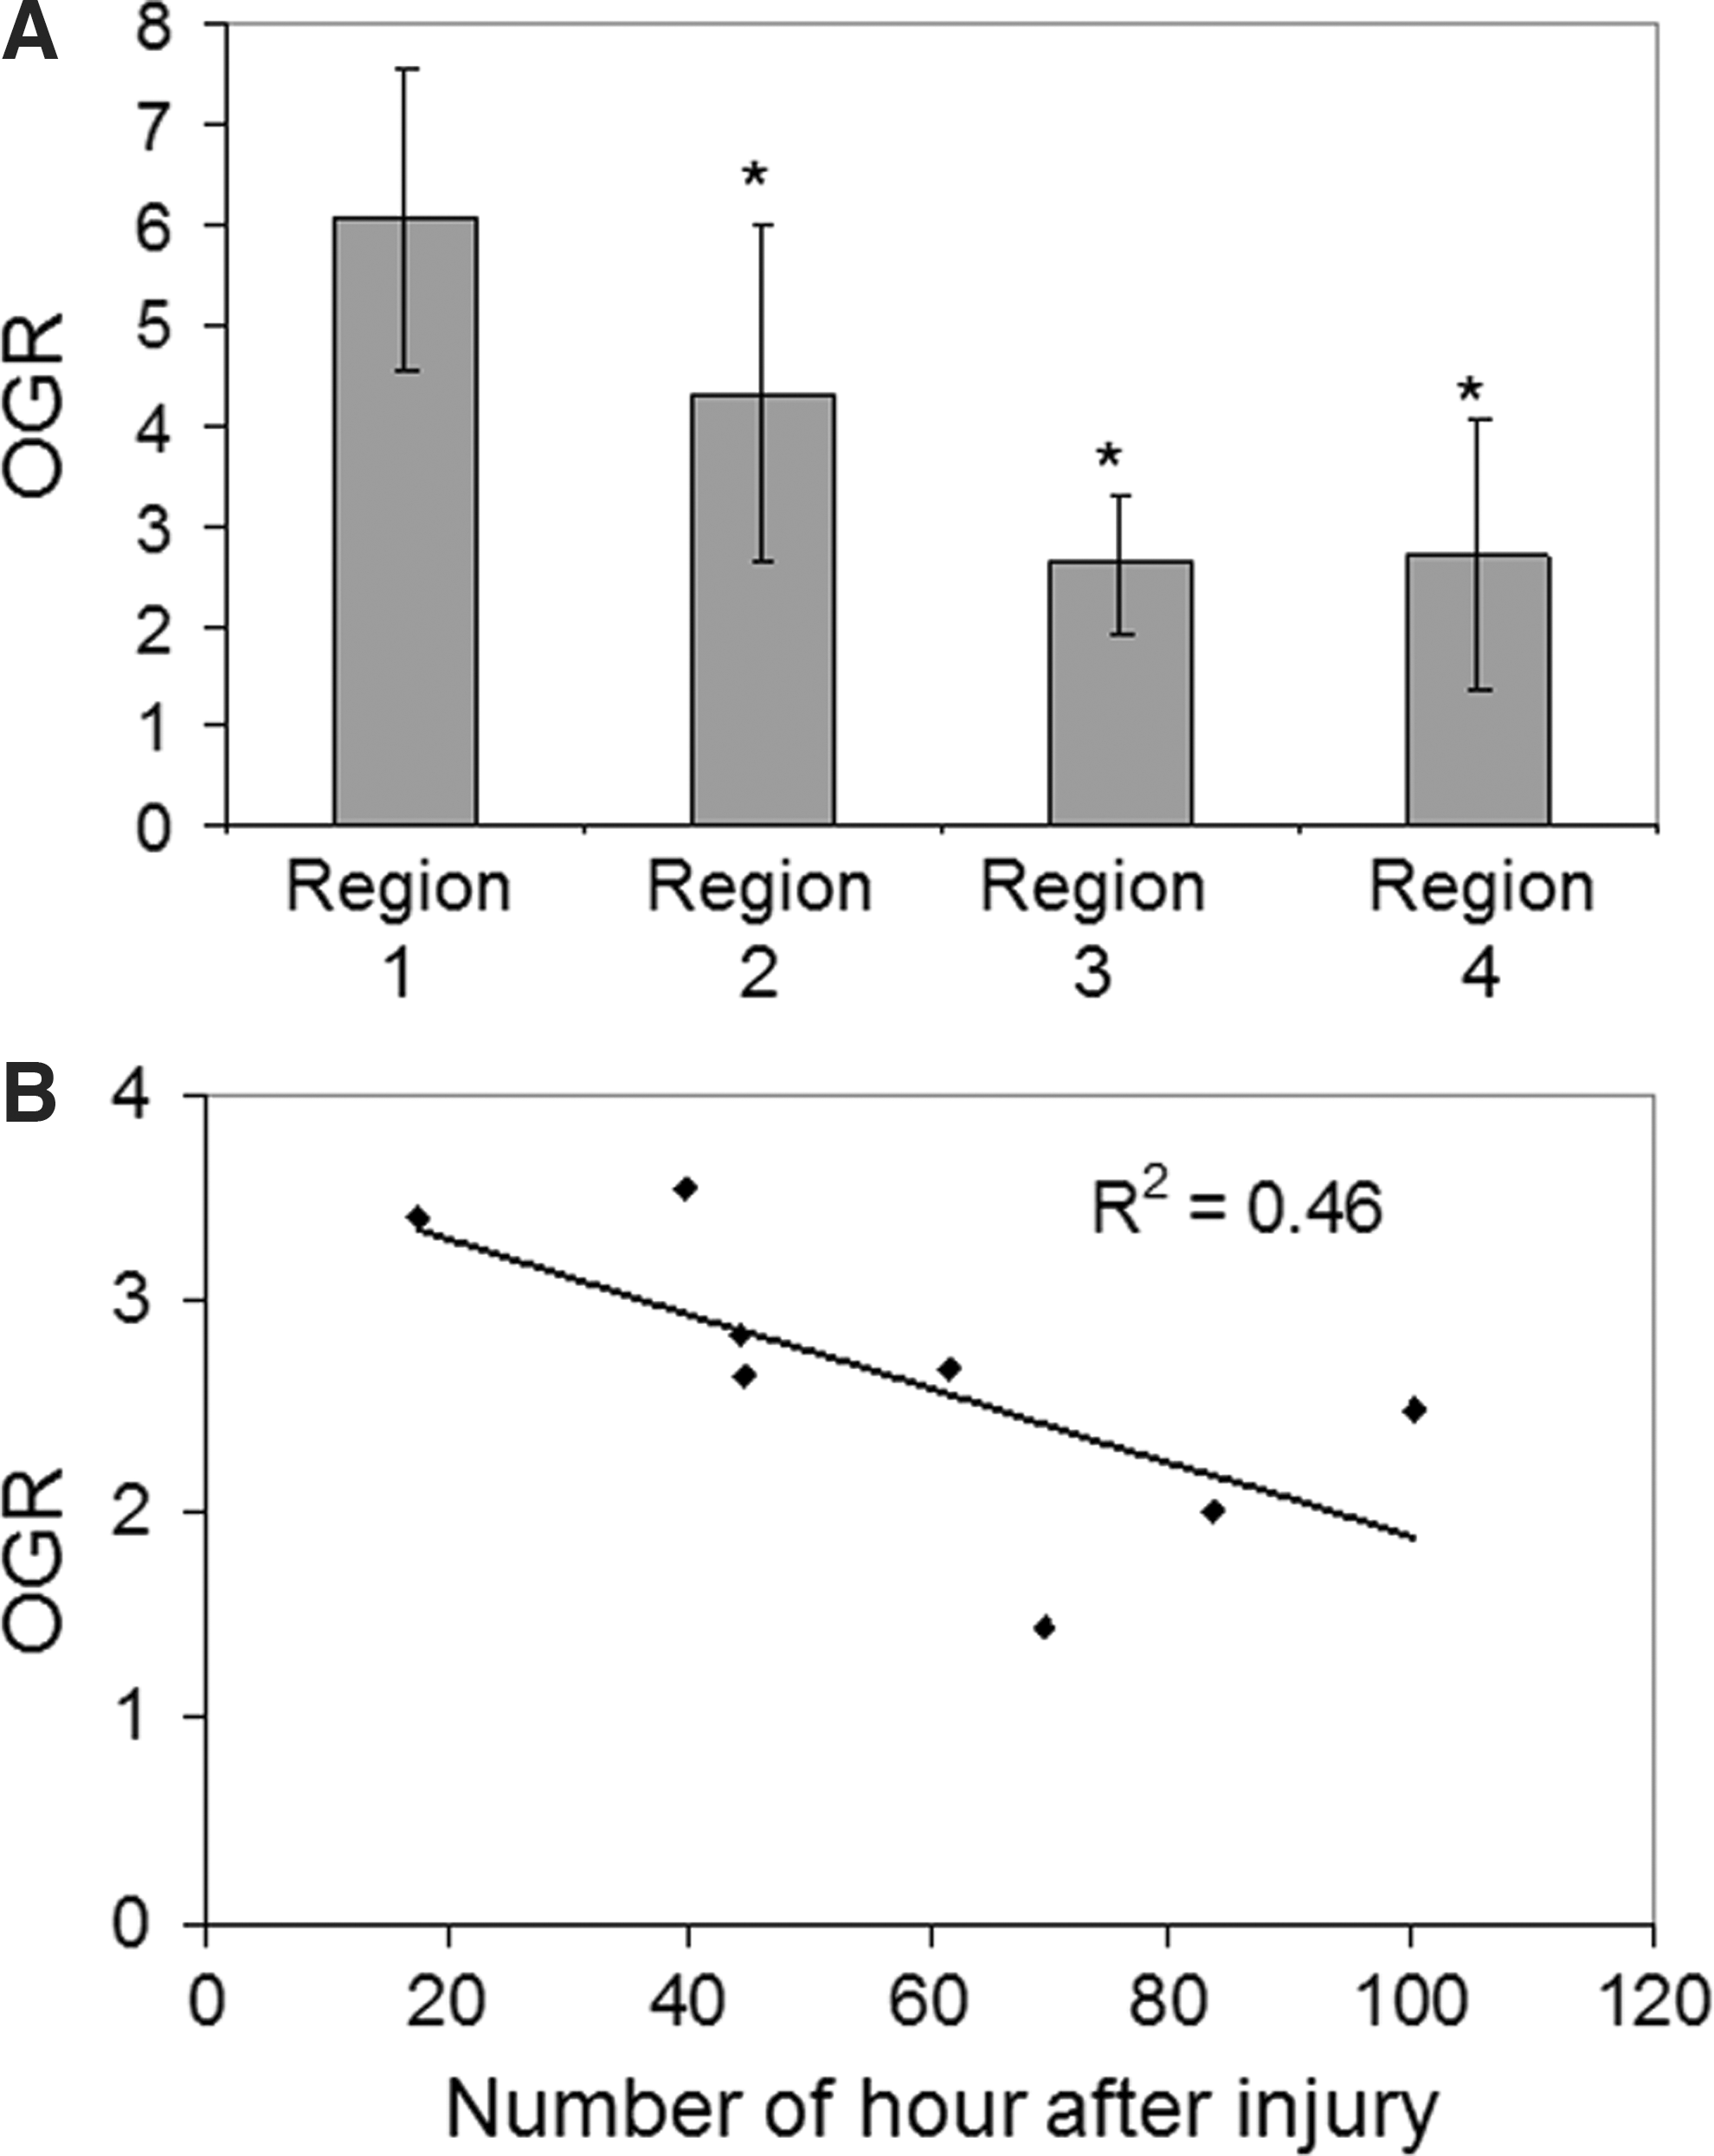
Figure 6A shows the mean OGR in the four regions of the eight subjects. Repeated measures ANOVA showed significant (F=22.50, p<0.001) difference among the four regions. Post-hoc analysis revealed a significant difference (p<0.05) between remote normal-appearing GM and pericontusional hypodense GM. There was no difference between pericontusional hypodense GM and contusional core. Figure 6B shows that the OGR of the pericontusional hypodense region was inversely correlated (r=−0.68) to the age of the contusion. This finding was in distinction of the temporal pattern of the remote normal-appearing GM in which essentially there was no difference in OGR between early and late studies (r=−0.02).
(
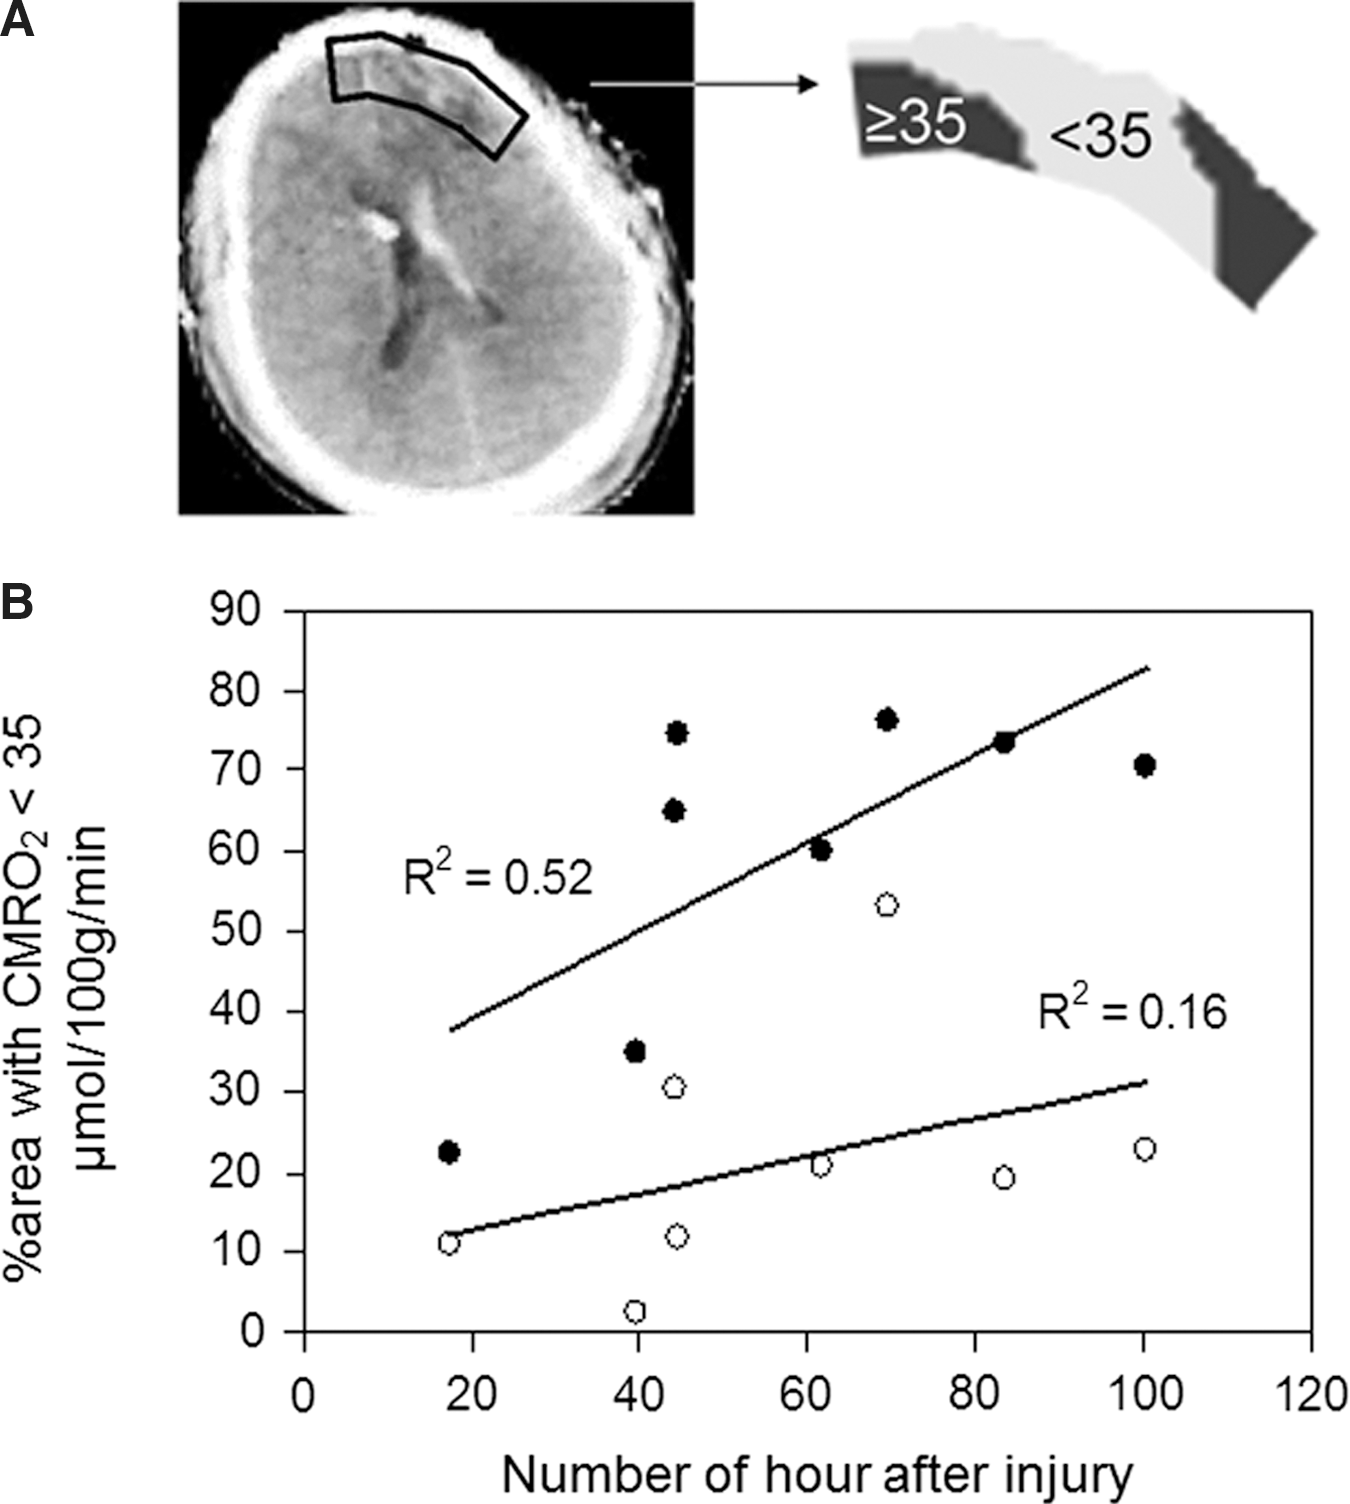
When the voxels within the pericontusional hypodense GM were partitioned using a CMRO2 threshold of 35 μmol/100 g/min, 22–76% of the voxels had CMRO2 values less than this threshold value. In general, voxels more adjacent to the contusional core had lower CMRO2 values. Absolute values of CMRO2 levels of less than 35 μmol/100 g/min represented 21±14% and 60±19% of the ROI voxels analyzed in pericontusional normal-appearing GM and pericontusional hypodense GM, respectively. A typical example is shown in Figure 7A. There was a good correlation (r=0.72 for pericontusional hypodense GM) between the %area of subthreshold CMRO2 and the age of the contusion among the eight subjects (Fig, 7B).
(
Discussion
Lack of evidence of a contusion-related ischemic penumbra
Our findings demonstrate that pathologically elevated OEF, as defined in the penumbral tissue in stroke, 23,25 was not detected within the contusion complex or pericontusional normal-appearing GM. Although GM pericontusional is oligemic in concordance with previous studies, 2 –5 our findings agree with those of Cunningham and colleagues 15 in which concomitant low OEF values were encountered. The finding of hypoperfusion without ischemia in patients with TBI was similar to those found in patients with nontraumatic, supratentorial intracerebral hemorrhages. 20
Radial diminution of parallel metabolic perturbations
There was a concurrent reduction of perfusion and both oxygen and glucose metabolism around contusions, the degree of reduction of which was greatest immediately adjacent to the contusion core. One explanation might be that components extravascular blood products diffuse outward. Thrombin, heme oxygenase, complement, microglia activation, and leukocyte infiltration are all actively upregulated in intracerebral hemorrhage 26 and are thought to each contribute to perihemorrhagic edema.
With the exception of the contusion core, there was an excellent correlation between CMRO2 and CBF (Fig. 5), implying retained metabolic coupling. A simple explanation could be that there is a lower concentration of functioning (or viable) cells closer to the contusion core. The nature of our studies, however, could not determine whether dynamic coupling was retained.
The pericontusional regions exhibit relative hyperglycolysis
As shown in Figure 4, CMRglc followed the same general pattern as CBF and CMRO2 with decreasing values as one approached the contusion core. An absolute elevation in CMRglc was not seen in the pericontusional region in this study group, although a previous study did reveal this finding. 27
With regard to the stochiometric relationship between oxidative to glucose metabolism, a lower than normal OGR was consistently seen in the pericontusional region suggesting the presence of anaerobic metabolism. As a reference, the mean OGR measured in the remote normal-appearing GM (distanced from the contusion) was nearly identical to the mean value of 5.92 measuring using identical PET protocols in a group of normal volunteers. 14 The pericontusional hypodense GM regions exhibited an OGR roughly half of this value (Fig. 6).
Among other explanations commonly suggested for increased glucose utilization, the invasion of inflammatory cells and the proliferation of reactive astrocytes have been proposed. Inflammatory leukocytic recruitment has been found in regions experiencing concomitant blood brain barrier damage and neuronal degeneration. 28 Within a few hours of virtually any type of brain injury, surviving astrocytes in the affected region begin to exhibit hypertrophy and proliferation. 29 The spatial (e.g., around and within the contusions) and temporal (e.g., a gradual decrease of OGR after TBI) characteristics of anaerobic metabolism, occurring in the pericontusional region, could therefore partially be explained by the metabolic footprint of reactive astrocytes. 30,31 It is possible that the increased anaerobic metabolism was because of the increased glucose consumption by infiltrating inflammatory cells and the increased glycogen synthesis by reactive astrocytes.32 –34
Pathological evolution within and around contusions
The measurement of regional CMRO2 suggests a grim fate of pericontusional hypodense GM tissue and, to some extent, the pericontusional normal-appearing GM. More recent studies in stroke have reported CMRO2 thresholds of between 35 and 40 μmol/min/g for irreversible tissue damage. 11,23,24 A similar threshold of 36.7 μmol/100 g/min for irreversible tissue damage was determined from the brain contusions of patients with TBI. 15 Applying this threshold value to our data, an average of 60% of pericontusional hypodense GM (by volume) appears to be nonviable. Adjacent pericontusional normal-appearing GM has a lower %volume of 21%, corresponding to radial diminution of CBF, OEF, and CMRO2 values.
It is discouraging that the percentage of viable tissue within pericontusional hypodense GM appears to decrease over time based on the correlation (r=0.72) between the age of contusion and %area of irreversibly damaged edematous tissue (Fig. 7B). This suggests that many cells, particularly within the pericontusional hypodense GM region, were most likely progressing to necrosis within the week studied. Although longitudinal studies of the same subject were not performed, our pooled data suggest that the perfusion and metabolic changes evolve over a 4-day period with greater reduction in values. Further, there was a negative correlation between the age of contusion and OGR (r=−0.68; Fig. 6B). Whether they are the cause or an epiphenomena, it would be logical to speculate that CT-evolution of contusions 1 is a manifestation of progressive necrosis and resultant hemorrhage.
Study limitations
There were potential methodological concerns that could affect physiological values measured in this study. First, the parametric images were generated from the corresponding dynamic images on voxel-basis. The low counting density of dynamic images, especially in the voxels of contusions, might introduce artifacts (e.g., underestimation of the parameter) in parametric images. Second, the positron emitters (i.e., 15O or 18F) of different tracers could produce PET images with different spatial resolutions and affected the OGR values. To account for the potential technical concerns, we smoothed the CMRglc and the CMRO2 images to similar spatial resolution before OGR images were generated. In addition to the voxel analysis, we also analyzed two brains using the raw (dynamic) images and the conventional ROI methods. Comparable results were obtained from the two methods.
Limitations inherent to our study design preclude a definitive statement eliminating ischemia as a possible pathophysiological candidate. In many cases, the acquisition of complicated and time-consuming PET studies during the initial “resuscitation” phase of management was not possible because it would interfere with patient care. Patients had to be considered “stabilized” with regard to blood pressure and ventilatory management and any necessary procedure (craniotomy, ventriculostomy, etc.) performed.
Obtaining surrogate informed consent from a family member sometimes delayed the PET studies while the family was given adequate time to discuss the matter. These issues limited most of our studies to 1 or more days after the injury. In addition, patients with significantly elevated ICP for which lowering the head-of-bed elevation below 30 degrees was considered potentially harmful were not studied at that time. This consideration excluded acute studies of the most severely injured patients (initial GCS 3 and 4). Also, the PET did not provide a continuous measurement. The temporal findings were inferred from multiple subjects studied at different times post-traumatic injury.
Conclusion
The low CBF, OEF, and CMRO2 values in the pericontusional hypodense GM regions suggest that these areas were most likely progressing toward necrosis after TBI. Although the pericontusional region acutely appears unaffected on MRI and CT imaging, the metabolic information at the time studied by PET reveals that this region shows evidence of progressive, centrifugal compromise. The pathophysiology of this metabolic deterioration, however, is not ischemic in nature based on a lack of elevated OEF at the time of the PET scans and in a somewhat limited number of patients. There are probably multiple etiologies responsible for the spatial and dynamic metabolic/flow derangements, but hematoma-induced complement and inflammatory activation may be contributory. A lower than normal OGR within and adjacent to contusions may be because of either adoption of alternative metabolic pathways and/or activation of inflammatory mechanisms.
Footnotes
Acknowledgments
We wish to acknowledge the contributions of Maria Etchepare, R.N., Jill Hutchinson, R.N., and Larry Pang for technical assistance. This work was supported by NIH grants P01-NS058489 and R21-NS059610, DOE grants DE-FC02-02ER63420 and DE-FG02-06ER64249, and the UCLA Brain Injury Research Center.
Author Disclosure Statement
No competing financial interests exist.