
Abstract
Brains undergo significant remodeling after traumatic brain injury (TBI). The Rho guanine triphosphate (GTP)ase pathways control brain remodeling during development and under pathological conditions. How the Rho GTPase pathways are regulated in the brain after TBI remains largely unknown, however. This study used the rat fluid percussion injury model to investigate changes in the Rho GTPase pathways after TBI. The results showed that TBI leads to activation and translocation of RhoA and Rac1 proteins from cytosolic fraction to the membrane fraction after injury. Consistently, the Rho guanine nucleotide exchange factors GEF-H1 and Cool-2/αPix are significantly activated by dephosphorylation and accumulation in the cytosolic fractions during the post-TBI phase. Because the Rho GTPase pathways are key regulators of brain remodeling, these results depict regulatory mechanisms of the Rho GTPase pathways after TBI, and pave the way for the study of therapeutic agents targeting the Rho GTPase pathways for functional recovery after TBI.
Introduction
The Rho GTPase family members Rac1 and RhoA function as molecular switches exchanging between an active GTP- and an inactive GDP-bound states, and regulate actin dynamics during synaptic formation or brain remodeling. In many circumstances, the RhoA pathway directly opposes Rac1 signaling. For example, activation of RhoA leads to retraction of axonal growth cones by formation of actin stress fibers, whereas activation of Rac1 leads to axonal growth and synapse formation. 1,8 Several studies show that the Rho-GTPase pathways play a key role in the neuronal processes movement for synaptic remodeling. 1,9 –16
The rat fluid percussion traumatic brain injury (TBI) model has been widely used to study TBI, because the injury produces a transient compression of the dura without penetration and is mechanically similar to closed head injury in humans. 17 –21 The primary mechanical insult damages axons as well as cell bodies at multiple foci and is followed by a time-dependent cortical and hippocampal neuronal loss that can progress for months to years after injury. 22,23
The objective of this study is to investigate changes in the Rho-GTPase pathways after TBI. This study shows that the Rho-GTPase pathways are dynamically and significantly upregulated after TBI, which may be responsible for brain remodeling and plasticity during the post-TBI recovery phase.
Methods
TBI model
Experiments were performed with male Sprague-Dawley rats weighing 270 to 320 g (Charles River Laboratories, Raleigh, NC). All experimental procedures were performed in compliance with the National Institutes of Health Guide for the Care and Use of Laboratory Animals and approved by the University of Miami Animal Care and Use Committee. All feasible measures were taken to reduce animal suffering and the numbers of animals used for these experiments. The basic surgical preparation for brain injury was performed according to previously described methods. 17,24
Briefly, animals were maintained for at least 7 days before the experiment in a temperature-regulated room (23–25°C) on a 12 h light/dark cycle. The rats were fasted, but allowed free access to water overnight before surgery. TBI was produced with fluid-percussion pressure levels of 2.0±0.2 atmospheres (atm). Rats were anesthetized with 3.0% halothane in a gas mixture of 70% N2O and 30% O2. The femoral artery was cannulated to deliver pancuronium bromide (0.5 mg/kg, intravenously) every 1 h during the surgical procedure. An endotracheal tube was inserted, and rats were mechanically ventilated with 70% N2O, 0.5 - 1.5% halothane, and a balance of O2. The animals were then placed in a stereotaxic frame, and a 4.8 mm craniotomy was made over the right parietal cortex (3.8 mm posterior to bregma, 2.5 mm lateral to the midline). A plastic injury tube (18 gauge modified PrecisionGlide needle hub, Becton Dickinson, Franklin Lakes, NJ), was placed over the exposed dura and fixed with dental acrylic.
Before and after TBI, blood gases and mean arterial blood pressure were monitored and maintained at physiological levels. Brain temperature was monitored with a thermistor probe placed in the left temporalis muscle, and core temperature was determined with a rectal thermometer. Brain temperature was maintained at 37°C with self-adjusting feedback heating lamps. Blood gases, blood glucose, and hematocrit values were monitored 15 min before TBI, 15 min after TBI, and then once every hour for up to 4 h after TBI. All animals were maintained within physiological ranges for mean arterial pressure (MAP) (120–140 mm Hg), pO2 (105–170 mm Hg), pCO2 (35–45 mm Hg), and blood pH (7.38–7.41). Sham-operated rats were subjected to identical surgical procedures, but without the fluid-percussion injury pulse. After TBI, anesthesia was discontinued, and the animals were returned to their cages.
For biochemical studies, brains were frozen in situ with liquid nitrogen at 2 and 24 h, and 3 days after TBI according to the methods of Ponten and associates. 25 Briefly, animals were anesthetized, tracheotomized, and artificially ventilated with 70% N2O, 0.5–1.5% halothane, and a balance of O2. The femoral artery catheter was recannulated for monitoring the MAP. The animal's respiration was maintained with the ventilator while the brain was frozen in situ with a 50 mL centrifuge tube (open bottom) on the top of the head filled with liquid nitrogen. When the MBP dropped below 10 mm Hg, animals were decapitated. 25 Animals had few complications during and after the surgery, and thus no animals were excluded from this study.
Preparation of subcellular fractions
Liquid nitrogen-frozen rat brains were removed from the liquid nitrogen-frozen heads with a saw, a hammer, and a chisel. 25 The neocortical tissues were dissected and chopped into small pieces in a −15°C glove box freezer. 26 Subcellular fractions were prepared for analyzing protein subcellular redistribution. Briefly, rat cortex tissue was homogenized on ice with a Dounce homogenizer (100 strokes) in 10 volumes of homogenization buffer containing 15 mmol/L Tris, pH 7.6, 0.25 mol/L sucrose, 1 mmol/LMgCl2, 2.5 mmol/L ethylenediaminetetraacetic acid (EDTA), 1 mmol/L EGTA [ethylene glycol-bis (β-amino ethyl ether) tetraacetic acid], 1 mmol/L dithiothreitol, 1.25 μg/mL pepstatin A, 10 μg/mL leupeptin, 2.5 μg/mL aprotinin, 0.5 mmol/L phenylmethylsulfonyl fluoride, 0.1 mmol/L Na3VO4, 50 mmol/L NaF, and 2 mmol/L Na4P2O7. Homogenates were centrifuged at 800 g at 4°C for 10 min to obtain P1 pellets (containing the heaviest cellular components, including the nuclei and secondary lysosomes) and supernatants (S1). The S1 was further centrifuged at 100,000 g at 4°C for 1 h to obtain the cytosol S3 and a pellet membrane fraction named P3. This P3 fraction containing synaptic, cellular, and intracellular membranes is a combination of the “P2” and “P3” fractions previously described in our studies. 27 All pellet fractions were suspended in homogenization buffer containing 0.1% Triton X-100. Each subcellular fraction was assayed for total protein concentration using the DC (detergent compatible) protein assay kit (Bio-Rad Laboratories, Hercules, CA).
Western blot analysis
Equal protein amounts from each subcellular fraction were electrophoresed on 10% sodium dodecyl sulfate-polyacrylamide gels (SDS-PAGE) and then transferred to Immobilon-P membranes (Millipore, Billerica, MA). The membranes were blocked with 3% bovine serum albumin in TBS for 1 h and then incubated overnight at 4°C with the primary antibodies. Primary antibodies against RhoA (Cell Signaling, #2117), Rac1 (Millipore, #05-389), GEF-H1 (Cell Signaling, #4076), Cool2/αPix (Cell Signaling, #4573), and phospho-GEF-H1 (Ser885) (Abcam, #ab94348) were used according to instructions. The membranes were then incubated with horseradish peroxidase-conjugated secondary antibodies for 60 min at room temperature (Bio-Rad, #170-6515). In addition to the loading of the same protein amounts on SDS-PAGE, β-actin (Cell Signaling, #4970) levels on immunoblots were used as a sample loading control. All Western blot data were normalized to β-actin and expressed as the ratio between protein of interest and β-actin protein levels. The blots were developed using enhanced chemiluminescence (Pierce) and developed on Kodak X-omat LS film (Eastman Kodak Company, New Haven, CT). Densitometry was performed with Kodak ID image analyses software (Eastman Kodak Company).
Dephosphorylation study
Dephosphorylation studies were performed with protein homogenates prepared without phosphatase inhibitors. Sham cortical tissues were homogenized with homogenization buffer and cleared by centrifugation for 5 min at 13,000 xg at 4°C. Tissue homogenates were treated with Calf Intestinal Alkaline Phosphatase (CIP) (New England Biolabs, MA) for 1 h at 37°C in the presence or absence of 50 mM EDTA, inhibitor of Calf Intestinal Alkaline Phosphatase. The protein concentrations in the homogenates were determined as described above, and then equalized among the samples. Equal amounts of proteins in the samples (25 μg/25 μL) were subjected to Western blot analysis described above with GEF-H1 antibody or phospho-GEF-H1 (Ser885).
Confocal microscopy
Double-labeled fluorescence immunocytochemistry was performed on coronal brain sections (50 μm) from sham-operated controls and animals subjected to TBI followed by 24 h of recovery. The sections were transferred into a 24-well microtiter plate filled halfway with 0.01 M citric acid– sodium citrate buffer, pH 6.0, heated for 10 min in a 95°C water bath. The sections were washed twice with 0.1% TX100–TBS for 10 min. Nonspecific binding sites were blocked with 3% bovine serum albumin (BSA) in Tris buffered saline (TBS) – 0.1% TX100 for 1 h and incubated with GEF-H1 or phospho-GEF-H1 antibodies, each at a dilution of 1:100 in TBS containing 0.1% TX100 overnight at 4°C. The sections were washed three times for 10 min each in TBS containing 0.1% TX100 at room temperature and incubated in a mixture of fluorescein-labeled anti-rabbit IgG (Thermo Scientific, Rockford, IL) at a dilution of 1:400 and 0.5 μg/mL propidium iodide for 1 h at room temperature. The sections were washed three times in TBS – 0.1% TX100, mounted on glass slides, and coverslipped using Gelvatol. The slides were analyzed on a Leica laser-scanning confocal microscope.
Pull-down assay
The frozen cortical tissues of sham-operated rats and rats subjected to TBI followed by 24 h of recovery were homogenized in a lysis buffer (25 mM HEPES, pH 7.5, 150 mM NaCl, 1% Igepal CA-630, 10 mM MgCl2, 1 mM EDTA, 10% glycerol, 1 mM sodium, vanadate, 25 mM NaF, 10 μg/mL aprotinin, 10 μg/mL leupeptin). The homogenates were cleared by 10-min centrifugation at 13,000 g at 4°C. The supernatants were incubated either with Rho assay reagent or Rac1 assay reagent (Cat# 14-382 for RhoA and Cat# 17-238 for Rac1, Millipore, Billerica, MA) for 1 h at 4°C on a benchtop shaker. The Rac1 or RhoA binding protein-conjugated beads were collected by centrifugation and then washed three times with the lysis buffer. After boiling in sample buffer, the bead-bound complexes and homogenates aliquots were subjected to Western blot analysis to determine the amount of the GTP form of RhoA or Rac1, as well as the total RhoA or Rac1.
Statistical analysis
Data are expressed as mean±standard deviation (SD) (n=3). One-way analysis of variance followed by Dunnett tests were used for statistical analysis. *denotes p<0.05 between sham and TBI animals.
Results
Levels and redistributions of RhoA and Rac1 proteins after TBI
The RhoA and Rac1 protein levels and redistribution among subcellular fractions were studied in the TBI model. The TBI-injured cortical tissues were obtained from sham-operated control rats and rats subjected to TBI followed by 2, 24, and 72 h of recovery. Three separate samples derived from three different rats in each experimental group were analyzed. The homogenate, and P1, P3, and S3 subcellular fractions were prepared and subjected to Western blot analyses of RhoA and Rac1 proteins with antibodies (Fig. 1, A,D). The RhoA protein level was not altered in the homogenate and P1 fraction (Fig. 1, A,B), but significantly reduced in cytosol and concomitantly increased in P3 fraction, suggesting redistribution from cytosol to cell membrane at 72 h of recovery after TBI (Fig. 1, A,B). The Rac1 protein level was also not altered before 24 h of recovery, but was significantly redistributed from S3 fractions to P3 fraction at 24 h of recovery after TBI (Fig. 1, D,E). Furthermore, the Rac1 protein level was also significantly increased at 72 h of recovery in the homogenate after TBI. All Western blot data were normalized to β-actin as described in Methods (Fig. 1, C,F).

Western blot analysis of RhoA and Rac1 proteins in the rat cortex after traumatic brain injury (TBI). Cortical tissues were obtained from the neocortical injury regions of sham-operated control rats and rats subjected to TBI followed by 2, 24, and 72 h recovery. Three separate samples derived from three different rats in each experimental group are shown. Equal amounts of proteins in homogenate (H) and subcellular P1, P3, and S3 fractions were subjected to sodium dodecyl sulfate polyacrylamide gel electrophoresis and immunoblotted with antibody against RhoA and Rac1, respectively. (
Activation of GEFs after TBI
The RhoA and Rac1 redistribution may be attributable to their Rho GEFs. We next sought to determine the changes in GEF-H1 and Cool2/αPix after TBI using the same set of brain samples as shown in Figure 1. GEF-H1 normally localizes in the membrane fraction or binds with microtubules under physiological conditions (the P3 fraction). Western blot analysis showed that GEF-H1 protein bands on Western blots were significantly shifted to the lower molecular weights in P1 and the P3 fractions at 2 h and all fractions at 24 h after TBI (Fig. 2A). We performed densitometric measurements of both upper and lower bands either together for the total level or separately for the individual level.
Quantitative analysis of the total of GEF-H1 protein level showed significant redistribution of GEF-H1 from P3 fraction to cytosol at 24 h after TBI (Table 1). The upper bands density was significantly decreased (because of dephosphorylation) in the P3 fraction at 24 h after TBI. In general, the GEF-H1 upper bands (phospho-GEF-H1, see below) density tended to decrease (Fig. 2B), whereas the lower bands were significantly increased in P1 fraction at 2 h and in all fractions at 24 h after TBI (Fig. 2E,C). The shifting of GEF-H1 to lower molecular weight variants may be due to dephosphorylation and activation as noted in previous studies. 28 This is confirmed by Western blot analysis with antibody against phospho-GEF-H1 (Ser885), which showed that TBI dramatically decreased phospho-GEF-H1 (Ser885) at 24 h in all fractions (Fig. 2, D,E).
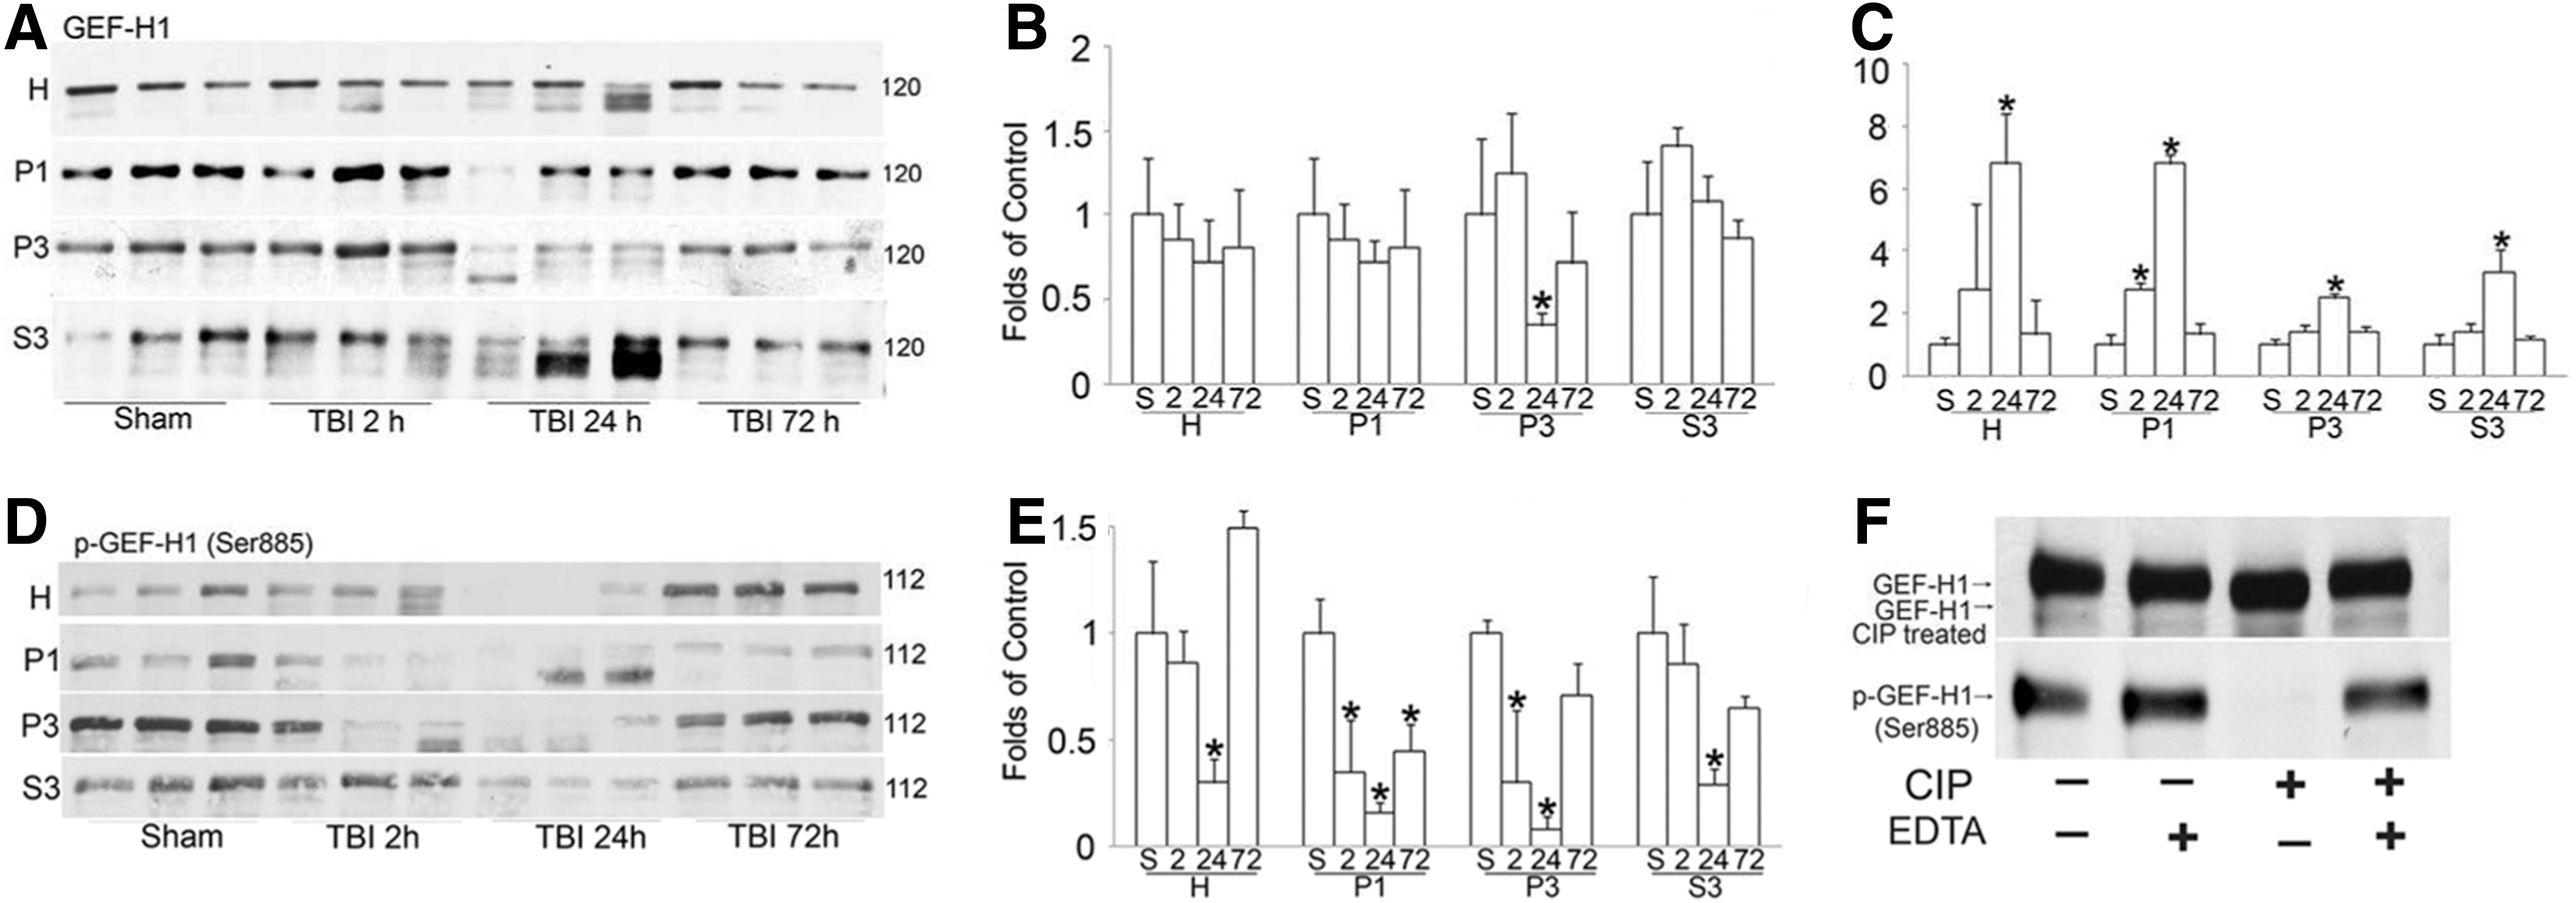
Western blot analysis of guanine nucleotide exchange factor (GEF)-H1. The same sets of tissue samples as in Figure 1 were used in this study. (
Homogenate (H) and subcellular P1, P3, and S3 fractions were analyzed. The total protein level in the cortical tissues of sham-operated control rats and rats subjected to TBI followed by 2, 24, and 72 h of recovery. The protein level was calculated by guanine nucleotide exchange factor-H1/β-actin ratios of the optical density of the protein band on Western blot film using three different individual rat samples. * p<0.05 between control and experimental conditions.
TBI, traumatic brain injury.
To support our results, we treated sham cortical tissue homogenate samples prepared with CIP in the absence or presence of 50 mM EDTA (the phosphatase inhibitor) (Fig. 2F). The results showed a similar shift of GEF-H1 bands on Western blot to those seen after TBI (Fig. 2F, top). Further, CIP treatment abolished phospho-GEF-H1 antibody labeling of GEF-H1 band on immunoblot, whereas addition of 50 mM EDTA phosphatase inhibitor prevented this effect (Fig. 2F, bottom). These results clearly indicate that GEF-H1 is dephosphorylated after TBI, and this dephosphorylation increases GEF-H1 activity. 28
Cool2/αPix (cloned out of library) is a GEF for Rac1 and Cdc42 GTPases. 29 Western blot analysis showed that the Cool2/αPix protein level was significantly increased in the cytosol at 2, 24, and 72 h of recovery after TBI, although it was not significantly altered in homogenate, P1, and P3 fractions (Fig. 3, A,B). This may be because of a larger pool of this protein in the pellets. Therefore, release of a certain amount of this protein from the pellet fractions to cytosol did not change this protein level in the pellet fractions on Western blots.

Western blot analysis of Cool2/αPix. The same sets of tissue samples as in Figure 1 were used this study. (
Immunocytochemistry of GEF-H1 and phospho-GEF-H1 after TBI
To study the regional and cellular distribution of GEF-H1 and phospho-GEF-H1 after TBI, we used confocal microscopy to image sham-operated control, as well as the ipsilateral and contralateral hippocampal and parietal cortical regions at 24 h after TBI. Sections were probed with GEH-H1 and phospho-GEF-H1 antibody (Fig. 4). Both total GEF-H1 and phospho-GEF-H1 were localized to the cytoplasm, dendrites, as well as neuropil areas as dots. Relative to sham-operated control, the total GEF-H1 was unchanged, whereas phospho-GEF-H1 was markedly decreased in immunoreactivity in the parietal ipsilateral cortical area and the CA1 and CA3 subregions of the ipsilateral hippocampus, but the changes seemed not obvious in the ipsilateral DG granule cells (Fig. 4).

Confocal microscopic images of neocortical, hippocampal CA1, CA3, and DG regions double-labeled with anti-guanine nucleotide exchange factor (GEF)-H1 antibody (left panel) or phospho-GEF-H1 (right panel). Brain sections were from sham-operated control rats and rats subjected to traumatic brain injury (TBI) followed by 24 h of recovery. Arrows indicate the TBI-damaged neurons that are devoid of GEF-H1 and phospho-GEF-H1 immunostaining.
This change was reproducible from three different control rats and three different TBI rats. Both GEF-H1 and phospho-GEF-H1 are not altered in the contralateral hemisphere relative to sham-operated control, and the negative controls were performed by omitting the primary antibodies and showed negative immunostaining (data not shown). We noticed that a few neurons were devoid of GEF-H1 and phospho-GEF-H1 immunostaining, most likely because they were damaged and their contents were released after TBI (Fig. 4, arrows).
Changes in RhoA and Rac1 activities after TBI
To determine RhoA and Rac1 GTPase activities after TBI, we performed the pull-down assays of GTP-bound active forms (GTP-RhoA or GTP-Rac1, hereafter) in the cortical tissue homogenates prepared from sham-operated control rats and rats subjected to TBI followed by 24 h of recovery (Fig. 5A). The levels of both GTP-RhoA and GTP-Rac1 in sham-operated control samples were low and undetectable. TBI dramatically increased the levels of both GTP-RhoA and GTP-Rac1 in the cortical samples (Fig. 5, B,C).
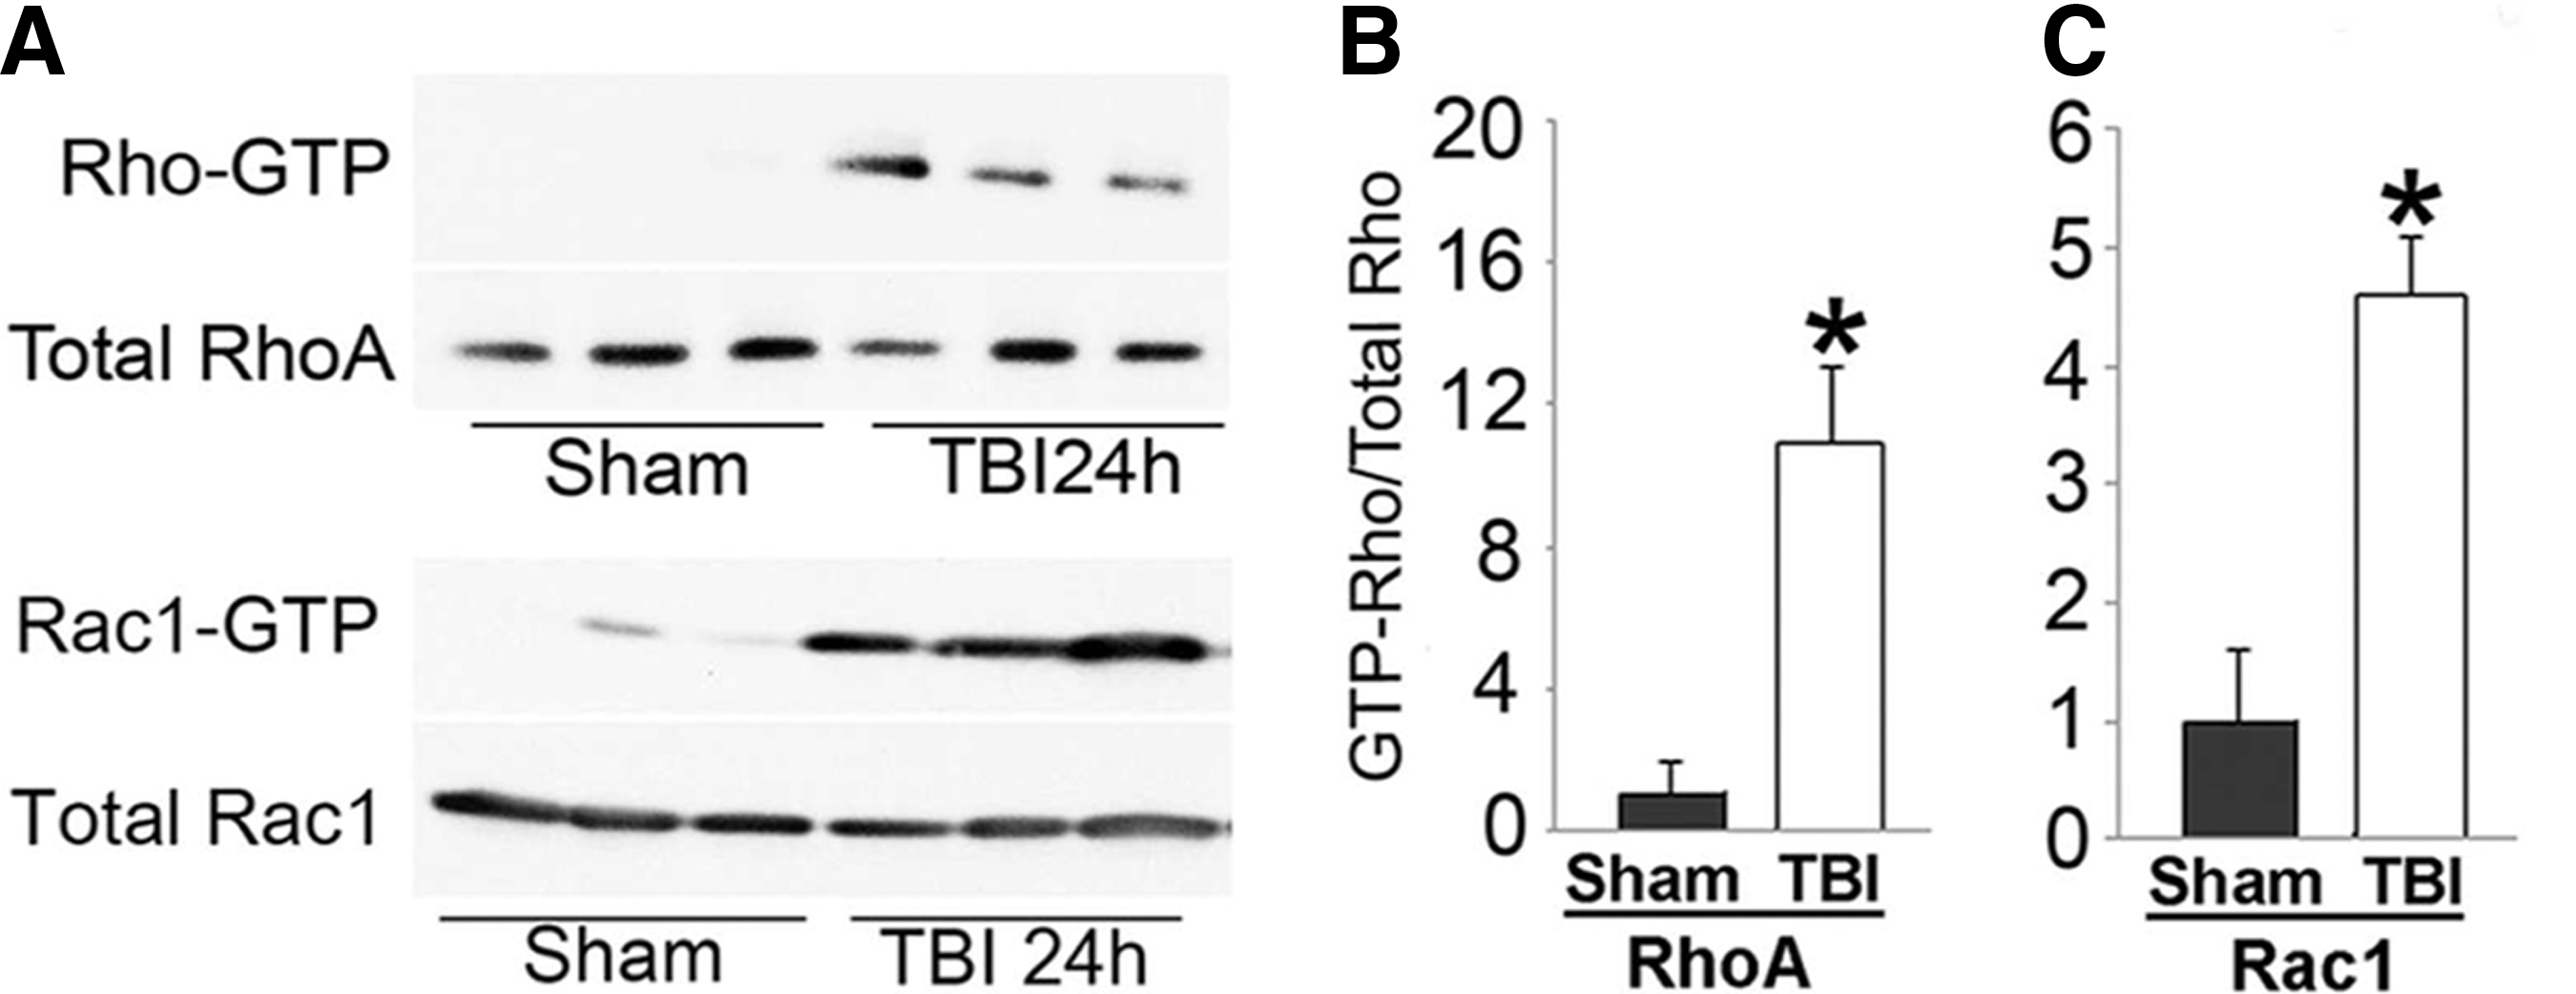
RhoA and Rac1 activity after TBI. Cortical tissues were obtained from the neocortical injury regions of sham-operated control rats and rats subjected to TBI followed by 24 h of recovery. RhoA and Rac1 activity was examined by the pull-down assay (see Methods). (
Discussion
This study used the rat fluid percussion injury model to systematically investigate changes in the key players in the Rho-GTPase pathways after TBI. The results showed that two key Rho GEFs, GEF-H1 and Cool2/αPix, were significantly activated after TBI. Correspondingly, GEF-H1 substrates GTP-RhoA and GTP-Rac1, the active forms of Rho GTPases, were also significantly activated and redistributed among subcellular compartments after TBI. The present study demonstrates the regulatory changes in the major components of the Rho GTPase pathways including GEF-H1, Cool2/αPix, RhoA, and Rac1. The results provide important information about the regulatory mechanisms of the Rho GTPase pathways after TBI.
Translocation of Rac1 and RhoA after TBI
Rho GTPases Rac1 and RhoA are prenylated for association with cell membranes, but 90–95% are found in the cytosol. 30 This is mainly because Rho GTPases bind to Rho-specific GDI proteins in cytosol to maintain themselves in a stable and inactive cytosolic pool for rapid translocation to cell membrane in response to specific stimuli. 31 During the translocation, Rho GTPases are switched from GDP to the GTP forms catalyzed by Rho GEFs. 30,32,33
This study is consistent with previous studies showing that significant translocation of Rac1 and RhoA from cytosol to the membranes is accompanied with marked activation of GEH-H1 and Cool2/α-Pix. 28,34,35 Interestingly, relative to Rac1, the basic level of RhoA activity was very low (Fig. 5). The pull-down assay further showed that the same amount binding protein-conjugated resin seemed pull-down of more Rac1 than that of RhoA at 24 h after TBI (Fig. 5A). This might be because RhoA activation peaked at 72 h after TBI, 36 whereas Rac1 activation reached plateau earlier at 24 h after TBI (Fig. 5). This might explain why translocation of RhoA occurred at 72 h, whereas translocation of Rac1 at 24 h after TBI (Fig. 1).
Unlike an in vitro study in which the same condition may be controlled, in vivo biochemical changes after TBI in animal models vary among different individuals (Fig. 1 –3). That was the reason why data were presented from multiple animals in each experimental group and analyzed by the statistical method, rather than presented from the best ideal changes.
Previous studies also showed that Rac1 activation leads to its nuclear accumulation. 37 This may not be the case, however, after TBI because neither Rac1 nor RhoA are increased, rather than decreased in the nuclear P1 fraction after TBI (Fig. 1). This may suggest that activation of the Rho GTPase pathways may occur mainly in cell processes for remodeling existing axons and dendrites after TBI.
Pull-down assay
Rho-GTPases activities can be determined by a pull-down assay. This pull-down method uses a Rho-GTPase effector protein as a bait to capture the GTP-active forms of the cognate GTPase. The pull-down GTPase can then be quantified individually by Western blot analysis. By using this assay, we confirmed that both Rac1 and RhoA activities are dramatically upregulated after TBI. The data are consistent with a recent study showing that the RhoA activity is increased after TBI. 36
Activation, redistribution and dephosphorylation of GEFs
According to our confocal microscopic data, most of brain cells are intact, although a few cells in the cortical and CA3 area are damaged at 24 h after TBI. This is consistent with the fact that the total proteins of RhoA, Rac1, and GEFs presented in this study are not significantly altered, but they are either dephosphorylated or redistributed after TBI. The dephosphorylation and redistribution of GEF and Rho proteins are consistent with active regulation of the Rho-GTPase pathways in living cells reported previously. 38 –41
Depolymerization of microtubules leads to dephosphorylation-dependent activation of GEF-H1 and a subsequent RhoA GTPase-dependent reorganization of the actin cytoskeletal structures. 28,42,43 This is consistent with TBI-induced microtubule depolymerization, 44 potentially resulting in the significant release of GEF-H1 from microtubule fraction (P3 fraction) into cytosol (S3 fraction) as shown in this study (Fig. 2). This study also shows that GEF-H1 protein band is shifted to lower molecular sizes that are highly accumulated in the cytosolic, light membrane and cytoskeletal P3 fraction after TBI. This may be because of GEF-H1 dephosphorylation after TBI. This speculation is supported by the phosphatase treatment study (Fig. 2F) and Western blot with antibody against phospho-GEF-H1 (see Figures 2, D and E).
Confocal microscopic study further showed that both GEF-H1 and phospho-GEF-H1 were located in neurons. Phospho-GEF-H1 was significantly reduced after TBI (Fig. 4). Because dephosphorylation of GEF-H1 at serine 885 reflects its activation, 28,43 together with redistribution of GEF-H1, the results strongly support a mechanism of dephosphorylation-dependent GEF-H1 activation, followed by release from microtubules to the cytosol after TBI.
Another GEF is the cloned-out of library-2 (Cool-2)/PAK-interactive exchange factor (α-Pix), which is encoded by the ARHGEF6 gene. 45 The mutation of this gene in humans leads to Cool2/αPix deficiency, impairment of spine formation, and mental retardation. 6,46 Further, it was reported that Cool-2/αPix acts as the Rac1-specific GEF. 47 Similar to GEF-H1, Cool2/αPix is significantly accumulated in the cytosol, indicating its activation after TBI (Fig. 3). This may be responsible for Rac1 translocation from cytosol to the membrane and cytoskeletal P3 fraction as shown in Figure 1, D,E after TBI. These results suggest that TBI leads to activation of both the GEF-H1 and Cool2/αPix mediated RhoA and Rac1 GTPase pathways. As discussed below, however, activation of RhoA and Rac1 may have different functional consequences after TBI.
Role of the Rho GTPase pathways after TBI
The best-known function of the Rho-GTPase pathways is to change cell morphology via regulating cytoskeletal complex movement and composition. The most common observations have been that Rac1 promotes axon growth and synaptic formation, whereas RhoA activation inhibits neurite outgrowth. 1,8,38 –41,48 In primary neuronal cultures, for example, the Rac1 mutants inhibit neurite outgrowth. 49,50 Blockade of the Rho-ROCK pathway promotes axonal regeneration in vivo. 51
Consistently, overexpression of GEF-H1 in cultured hippocampal neurons reduces spine length and size, whereas blocking GEF-H1 function with dominant-negative mutants or RNAi results in an increase in spine size and density. 16,52 These studies suggest that activation of GEF-H1 after TBI may lead to inhibition of synaptic formation. Therefore, GEF-H1 may be potential therapeutic targets for promoting axonal regeneration after TBI.
Footnotes
Acknowledgments
This work was supported by National Institutes of Health grants NS040407 and NS030291. The authors thank Mrs. Ofelia F. Alonso for her assistance in producing the TBI model.
Author Disclosure Statement
No competing financial interests exist.