




Abstract
“Breachers” are a unique military and law enforcement population because they are routinely exposed to low-level blast (LLB) during training and operations. This repeated exposure has been associated with symptoms similar to that of sports concussion. This study examined effects of repeated exposure to LLB during an explosive entry course. Twenty-one members of the New Zealand Defence Force volunteered for this study. Serum samples, neurocognitive performance, and self-reported symptoms were periodically measured before, during, and after a 2-week course. Serum concentrations of three biomarkers, ubiquitin C-terminal hydrolase-L1, αII-spectrin breakdown product, and glial fibrillary acidic protein, were determined with sandwich enzyme-linked immunosorbent assays, and rank scores were derived using the area under the curve (relative to baseline) for each subject. Neurocognitive performance was measured with a computer-based test battery, and symptoms were assessed by paper-based inventory. There was a significant relationship (p<0.05) between composite biomarker and neurocognitive performance and between neurocognitive performance and symptoms. The individuals with the five highest (Top 5) and lowest (Bottom 5) composite biomarker scores were identified and compared using Wilcoxon's rank-sum test. The Top 5 had significantly longer reaction times and lower percent correct on neurocognitive performance and an increase in symptom reporting. The difference between individuals expressing the highest biomarker load during breacher training (Top 5) and those with the lowest biomarker load (Bottom 5) is reflected in neurocognitive performance deficits and self-reported symptoms. This suggests a measureable degree of brain perturbation linked to LLB exposure. Follow-up studies are underway to expand upon these results.
Introduction

Explosive breaching charge vs breacher position.
In a wider context, TBI has been identified as the signature injury of the Iraq and Afghanistan wars 2 with significant prevalence suggested by a RAND Corporation study, 3,4 reporting that 19.5% of soldiers had suffered some form of TBI. Hoge and colleagues 5 reported that nearly 15% of soldiers reported an injury on deployment that involved an altered level of consciousness, a defining clinical sign of TBI. Though this reported prevalence includes several mechanisms of brain injury, a large percentage of service personnel exposed to multiple blasts without visible physical injury (blunt or penetrating trauma) report symptoms such as sleep disturbances and concentration problems reflective of mTBI. 6 They themselves fail to recognize these symptoms as a medical problem and consequently do not seek medical attention. Operational blast exposure, such as that from improvised explosive devices, exposes service personnel to multiple mechanisms of injury, including primary overpressure exposure, secondary penetrating fragmentation injury, tertiary blunt force trauma, and quaternary “miscellaneous” injury. Though secondary penetrating and tertiary blunt mechanisms mimic known head injury complexes, no one fully understands what, if anything, the blast overpressure exposure is contributing to disruption of normal brain physiology.
Diagnosing mTBI from any mechanism is problematic, and clinical examinations have been shown to be equivocal, particularly during the first hours and days after injury when the window for therapeutic intervention is most likely to be effective. 7 –9 Whereas conventional diagnosis of TBI is based on subjective symptom reporting and clinical neurological deficits, correlated with computed tomography (CT) scanning and magnetic resonance imaging (MRI), 10 –12 these imaging techniques have not been validated as effective tools for the identification of mTBI or, further, subclinical perturbations such as those reported in breachers. In a recent study of blast-exposed military personnel with a clinical diagnosis of uncomplicated mTBI, MacDonald and colleagues 13 used diffusion tensor imaging (DTI) to identify traumatic axonal injury. They reported a presence of axonal abnormalities on DTI in 18 of 63 injured subjects, but no patients showed detectable intracranial injury on CT. Currently, the diagnosis of mTBI relies on subjective symptom reporting as the primary clinical tool.
MacDonald and colleagues 13 were able to demonstrate some neurophysiological insult associated with mTBI; however, they were unable to determine the contribution of primary blast injury (i.e., blast overpressure exposure), as compared with other blast mechanisms of injury (i.e., blunt trauma in those with axonal abnormalities). The military has a critical need for an objective means to diagnose and triage blast-exposed personnel on the battlefield to identify mTBI or subclinical perturbations. Even mild brain perturbations can impair performance, and the potential sequelae of multiple exposures require further attention. 14 It is critical that service personnel who have suffered any level of brain injury are properly diagnosed near the time of injury so they can receive appropriate care as early as possible, and so that critical return-to-duty decisions (which include the possibility of further blast exposure events) can be made with appropriate medical guidance.
The pathology of brain injury is complex and includes several simultaneous processes of acute and delayed neuronal and axonal pathology. Consequently, research has focused on the identification and measurement of brain protein biomarkers of TBI with the diagnostic ability to evaluate postconcussion intracranial pathology. Such protein-based diagnostic capability would improve patient management and facilitate therapeutic evaluation. 15 Recent studies have reported that several of the brain biomarkers under evaluation may have clinical utility for the diagnosis of TBI. Pineda and colleagues 16 and Mondello and colleagues 17 described axonal injury markers—αII-spectrin breakdown products (SBDPs) SBDP150, SBDP145, and SBDP120—in cerebral spinal fluid (CSF) as elevated after severe TBI (sTBI). In a similar study, Papa and colleagues 18 evaluated ubiquitin C-terminal hydrolase-L1 (UCH-L1) as a novel biomarker of TBI in CSF of 41 patients with sTBI. They reported that patients diagnosed with TBI had significantly higher CSF levels of UCH-L1 at each time point tested (6–168 h postinjury), compared to uninjured controls. UCH-L1 has been identified as a sensitive marker for brain injury in a number of additional investigations. 19 –23 Glial-specific protein, glial fibrillary acidic protein (GFAP), has also been shown to be a biofluid-based biomarker of severe and moderate TBI. 24 –26 Papa and colleagues 27,28 described that a GFAP and its breakdown products, as well as UCH-L1, are a strong indication of the presence of mild and moderate TBI. Interestingly, Svetlov and colleagues 29 reported the accumulation of GFAP and UCH-L1 in both the CSF and blood after head-directed, blast-like, overpressure-wave exposure in a rat model.
Studying LLB exposure during breacher training isolates air-pressure changes as the primary mechanism of injury because any contributing blunt or penetrating impact is unlikely. In a seminal study of repeated blast exposure in breachers at the U.S. Marine Corps' Quantico explosive entry training facility, researchers evaluated the neurocognitive and -physiologic effects of repeated exposure to LLB in Marines. Though they reported no significant changes in the blast-naïve cohort, a change in functional neuroimaging signal (fMRI blood oxygen dependent) during a memory task was identified in the cohort with more chronic exposure. 30 This signal was mirrored by a reduction in accuracy on computerized neurocognitive tests, again only in tasks with memory demand and only in the chronically exposed cohort. 30 It is important to note that these blast-related changes were identified in individuals with no other reported physical injuries and who were not clinically diagnosed with any injuries related to the blast exposure. These results provided the first scientific evidence to support the existence of breachers brain and its association with repetitive exposure to blast within this occupation. However, though the Quantico study evaluated multiple data streams, it did not include the measurement of brain injury biomarkers.
This study was developed specifically to exam the effects of LLB on serum brain injury biomarkers in conjunction with neurocognitive performance and self-reported symptoms. The three brain injury biomarkers selected for evaluation were UCH-L1 (neural cell body injury), SBDP150 (axonal injury and neural necrosis), and GFAP (astrocyte/glial cell injury and gliosis). To allow for direct comparisons with the Quantico study, the same computer-based neurocognitive test was used (Automated Neurocognitive Assessment Metrics [ANAM] TBI battery 31 ). The primary aims were (1) to determine the effects of repetitive LLB exposure on brain biomarker response and (2) changes in neurocognitive performance and (3) to correlate these objective measures with subjective symptom reporting. This pilot study provided researchers with a unique opportunity to examine the effects of repetitive LLB exposure, in a blast-naïve military trainee population of the New Zealand Defence Force (NZDF), under well-characterized and rigidly controlled blast exposure paradigms.
Methods
Participants
Data collection for this study was carried out under a research protocol approved by the New Zealand Northern X Regional Ethics Committee (institutional review board). Subsequent analysis of the serum samples as well as the ANAM performance data and self-reported symptom inventory data were carried out under a human use protocol approved by the Department of Human Subjects protection of the Walter Reed Army Institute of Research (Silver Springs, MD).
Twenty-one healthy male members of the NZDF volunteered to participate in this study. Two of the 21 subjects did not have sufficient data for analysis and were excluded from the data set. Participants ranged in age from 21 to 43 years (mean, 28.9), and individual education ranged from 11 to 16 years (median, 13) years. Ethnicity and race varied minimally in this sample, including New Zealand (NZ) European, NZ Maori, or Pacific Islander. All subjects were proficient in English. Before the course, each individual completed medical and blast history questionnaires with an emphasis on previous head injury (including impact-induced mild to severe brain injuries or concussions). Self-reported concussion ranged from 0 to 5 events (average, 1.2). Self-reported previous exposure to blast was minimal, with blast history ranging from 0 to 1 event.
Subjects were part of a breacher training team that completed a 2-week explosive entry course. The course included 3 classroom days and 9 days of practical training, held in morning, afternoon, and evening sessions. Blast exposure occurred on 5 of those course days, with multiple (1–20) exposures to subjects over the course of the day. Individual exposure dose for each subject likely varied in any given blast day as a result of the characteristics of the small group training iterations, surrounding structural environment, type, strength, or number of explosive charges, and their position relative to the initiation. The protocol was conducted in conjunction with the course and included blood and neurocognitive performance testing before, during, and after course days.
Serum sample collection procedure
Blood samples were drawn at the desired time points, and serum was processed as described by Papa and colleagues. 27,28 Serum samples were then analyzed for concentration levels (ng/mL) of UCH-L1, SBDP150, and GFAP. A total of 7 control blood samples were obtained per participant in the 10 days preceding their first blast exposure to determine each individual's baseline biomarker concentration. Among these 7 samples, 4 were collected 10, 7, 3, and 1 days before the explosive entry training course began, 2 (morning and afternoon) were obtained on the first day of the course when no blast exposure occurred, and the last baseline sample was collected on the morning of the second course day, before to the first blast exposure. A total of 14 blood samples were obtained from each individual, across the course days, and also at 7 and 14 days post-training. The first exposure sample was collected in the afternoon subsequent to completion of the first day of blast exposure. The second and third exposure samples were collected on the following morning and upon completion of explosive entry training for that day. The sampling schedule for that morning and evening was implemented during each of the remaining training days. The final single samples were collected 7 and 14 days after completion of the course.
UCH-L1, SBDP150, and GFAP sandwich enzyme-linked immunosorbent assay
UCH-L1 levels in serum were measured using a UCH-L1 sandwich enzyme-linked immunosorbent assay (ELISA) version 1b modified from a protocol previously reported on. 18,32 Both mouse monoclonal antibody (capture antibody; CAb) and rabbit polyclonal antibody (detection Ab) were made in-house at Banyan Biomarkers (Alachua, FL) against recombinant human UCH-L1 full-length protein and partial protein (respectively). Both are affinity purified using a target-protein–based affinity column. Their specificity to only target protein (UCH-L1) was confirmed by immunoblotting. Reaction wells were coated with CAb (purified mouse monoclonal anti-human UCH-L1) in 0.05 M of sodium bicarbonate (pH 9.6) and incubated overnight at 4°C. Plates were then washed with blocking buffer (Tris buffer saline with 0.02% Tween-20 [v/v]; TBST) and incubated for 30 min at ambient temperature with gentle shaking. Antigen standard (UCH-L1 standard curve, 0, 0.06–15 ng/mL), unknown samples (20 μL of serum), or assay internal control samples were incubated with detection Ab (rabbit polyclonal anti-human UCH-L1, 100 μL total volume) overnight. After, the CAb-coated plate was incubated with detection Ab/sample mixture for 1.5 h at room temperature; it was washed using an automatic plate washer (each well rinsed with 350 μL with wash buffer [TBST]). Secondary anti-rabbit/immunoglobulin G/horseradish peroxidase (HRP; GE Health Sciences, Pittsburgh, PA) in blocking buffer was then added to wells (100 μL), and plates were further incubated at room temperature for 1 h. Finally, wells were developed with substrate solution: Ultra-TMB ELISA 100 μL/well (catalog no.: 34028; Pierce, Rockford, IL) with incubation for 10 min per plate read at 450 nm with a 96-well spectrophotometer (Spectramax 190; Molecular Devices, Sunnyvale, CA). Interassay coefficient of variation (CV) was 2.1–7.9%, whereas interassay CV was 0.9–10.6% within the assay dynamic range. Limit of detection (LOD) was determined to be 0.030 ng/mL. For samples with undetectable (ND) levels, they were assigned 50% of the LOD (i.e., 0.015 ng/mL). If a sample yielded a signal over the quantification range, then the sample was diluted and reassayed.
The SBDP150 sandwich ELISA (version 2) was constructed similarly to that described previously for other SBDPs. 17,32 Briefly, a 96-well plate was coated with 100 μL/well CAb (500 ng/well purified goat polyclonal anti-SBDP150 fragment-specific antibody) 33 overnight at 4°C. After the blocking buffer (Startingblock T20-TBS) step, antigen standard (a known amount of purified rat brain αII-spectrin cleaved with calpain-2 (1:50 ratio) was used to establish a standard curve. 34 Stock solution of prepared SBDP150 protein was diluted with sample diluent to a final incubation volume of 100 μL/well. Thus, the standard curve range was 0.35–90 ng/mL in the wells. For rat CSF samples, 10 μL was typically used per well, and 34 μL of serum was used, and both were diluted with diluent to a final incubation volume of 100 μL/well. After washing, plates with TBST were incubated with detection Ab (mouse monoclonal anti-αII-spectrin [C-terminal] antibody). If amplification was needed, biotinyl-tyramide solution (PerkinElmer Elast Amplification Kit; PerkinElmer, Boston, MA) was added for 15 min at room temperature, washed, and followed by 100 μL/well of streptavidin-HRP (1:500) in phosphate-buffered saline with 0.02% Tween-20 and 1% bovine serum albumin for 30 min, followed by washing. Last, the wells were developed with 100 μL/well chemiluminescent substrate solution (SuperSignal ELISA Femto, catalog no. 37075; Pierce) for 1 min. Signals were read with a 96-well chemiluminescence microplate reader (GloRunner DXL Luminometer; Turner BioSystems, Inc., Sunnyvale, CA). Interassay and interassay CVs were <3–14% within the assay dynamic range. LOD was determined to be 0.182 ng/mL. For samples with ND levels, they were assigned 50% of the LOD (i.e., 0.091 ng/mL). If a sample yielded a signal over the quantification range, the sample was then diluted and reassayed.
The GFAP-ELISA was performed in a manner similar to that previously described, 27 where 20–50 μL of serum was used for quantitative determination of one assay. Serum samples were incubated with a rabbit polyclonal anti-total human GFAP Ab coated in microtiter wells. After 2-h incubation and a washing, biotin-labeled monoclonal anti-human GFAP-specific antibody was added. Antigen used was either sodium dodecyl sulfate–denatured recombinant GFAP detected by the GFAP-specific Ab. After a thorough wash, streptavidin-HRP conjugate was added. After 1-h incubation and the last washing step, the remaining conjugate was allowed to react with the substrate H2O2-tetramethylbenzidine. The reaction was stopped by addition of acidic solution, and absorbance of the resulting yellow product was measured at 450 nm. Absorbance was proportional to the concentration of GFAP. A standard curve (0.100–20 ng/mL) was constructed by plotting absorbance values versus GFAP concentrations of calibrators, and concentrations of unknown samples were determined using this standard curve. Interassay and interassay CVs within the assay dynamic range were <12%. LOD was determined to be 0.05 ng/mL. For samples with ND levels, they were assigned 50% of the LOD (i.e., 0.025 ng/mL). If a sample yielded a signal over the quantification range, it was then diluted and reassayed.
Neurocognitive testing with ANAM
The computer-based neurocognitive performance test used in this study was a modified version of the U.S. Department of Defense (DoD)-endorsed ANAM TBI battery. 35,36 The differences between the DoD standard battery and the version used in this protocol were minimal. The version used in this protocol did not present the term “brain injury” to subjects or questions regarding brain injury. It consisted of seven subtests: CDS, Code Substitution; CDD, CDS Delayed; MTH, Mathematical Processing; M2S, Matching to Sample; SRT, Simple Reaction Time; SR2, Second administration of SRT; and PRO, Procedural Reaction Time. The seven testing sessions preceding the initiation of the course yielded sufficient practice, and subjects demonstrated a static baseline performance. 31 Subsequently, the test battery was administered at the end of each training day (9 samples) and at 7 and 14 days after completion of the course. Missing values in ANAM subtest performance were replaced by interpolation using the mean of exposure sessions for each subject. This replacement strategy was employed for one time point each for 3 different subjects because of subject nonavailability for specific test sessions. In this study, the dependent variables, percent correct, and reaction time were evaluated separately because the often-used composite score, throughput (1/reaction time* percent correct), may camouflage changes in one of these variables.
Self-reported symptoms
A symptoms inventory that included sports concussion screening questions was completed daily, in conjunction with the computer-based neurocognitive assessments, to evaluate the presence of 32 symptoms consistent with mTBI (headaches, dizziness, nausea, long think, short think, and so on) as well as the degree to which subjects considered these symptoms problematic. This inventory was administered a total of 14 times: three in conjunction with ANAM sessions preceding blast exposure, to obtain baseline; on each of the 9 practical days; and at 7 and 14 days after completion of the course. Symptoms were reported on a scale of 0–4 and required a reported score of at least 2 by at least 20% of the volunteers (4 of 19) for inclusion in the analyses reported here.
Statistical analysis
One-way repeated measures analysis of variance (ANOVA), using the SAS general linear models procedure (SAS Institute Inc., Cary, NC), was used to evaluate the main effect of time, or group change over time, in biomarker concentrations and neurocognitive performance test reaction time and percent correct. Huynh-Feldt's (H-F's) correction was used when the assumption of sphericity was violated. Baseline for each biomarker was established for each individual by averaging the 7 control samples collected before blast exposure. Baseline for neurocognitive function was performance at the last preexposure time point. Data transformations and post-hoc analyses were performed as appropriate.
Because each of the two dependent measures (biomarker concentration and neurocognitive performance) was comprised of collective subparts, composite scores were used to generalize observations. To reflect serial monitoring of the changes to brain biomarker expression over the training period, concentration levels of each of the three biomarkers were plotted across time points for each individual subject. Pretraining baseline values of each marker for each individual were plotted with biomarker load assessed as biomarker level above baseline over time. The positive incremental area under the curve (AUC) above baseline was calculated.
37
Each subject's biomarker AUC was sorted in descending order for each assay and assigned 5, 4, 3, 2, and 1, respectively, to the five highest AUC values for each biomarker across subjects; all other AUC values were assigned 0. Biomarker AUC ranks were summed to obtain a composite biomarker score for each subject; a larger biomarker score represented a greater overall biomarker presence (see Supplementary Table 1; see online supplementary material at
Similar to biomarker rank score, a composite neurocognitive decrement score was calculated by summing the calculated change scores for mean reaction time from correct responses (above the 95% confidence interval of baseline) across time points for each subtest for each subject. A higher score corresponds to a greater decrement in neurocognitive performance. Subjects were then ranked in a fashion parallel to that used for the biomarker data.
Symptom reporting was compressed by summing the average responses on the symptom inventory for the 16 symptoms that had response rates sufficient to be included in analyses; a higher symptom score corresponds to an increase in symptom prevalence and severity. The 16 symptoms included in initial analyses were headaches, dizziness, loss of balance, fatigue, sleep disturbances, slow think, long think, poor concentration, forgetfulness, ringing ears, fullness in ears, anger, frustration, loss of appetite, lightheadedness, and restlessness. Symptoms composite score for Top 5/Bottom 5 comparison included only average of headache and long-think symptoms.
The composite scores for biomarker and performance data were used to identify two types of subgroups. The 5 subjects with the highest composite biomarker scores, (indicating brain disruption) were assigned as the “Biomarker Top 5” group, and for the purposes of having balanced groups for statistical analysis, the 5 subjects with the lowest composite biomarker scores were assigned as the “Biomarker Bottom 5” group (see Supplementary Table 1; see online supplementary material at
Results
Figures 2, 3, 4, 5, and 6 illustrate the different data sets collected during the course. In each of these figures, data points are identified as pre-exposure baseline (B), exposure (E), and recovery (R) time points. Exposure includes all data points after the first blast exposure and before the recovery period. In the figures containing biomarker data (i.e., Figs. 2 and 6), there are twice as many data points representing twice-daily serum collection, compared to once-daily neurocognitive and symptom administrations. The vertical dotted lines in the figures represent the 5 blast exposure days.
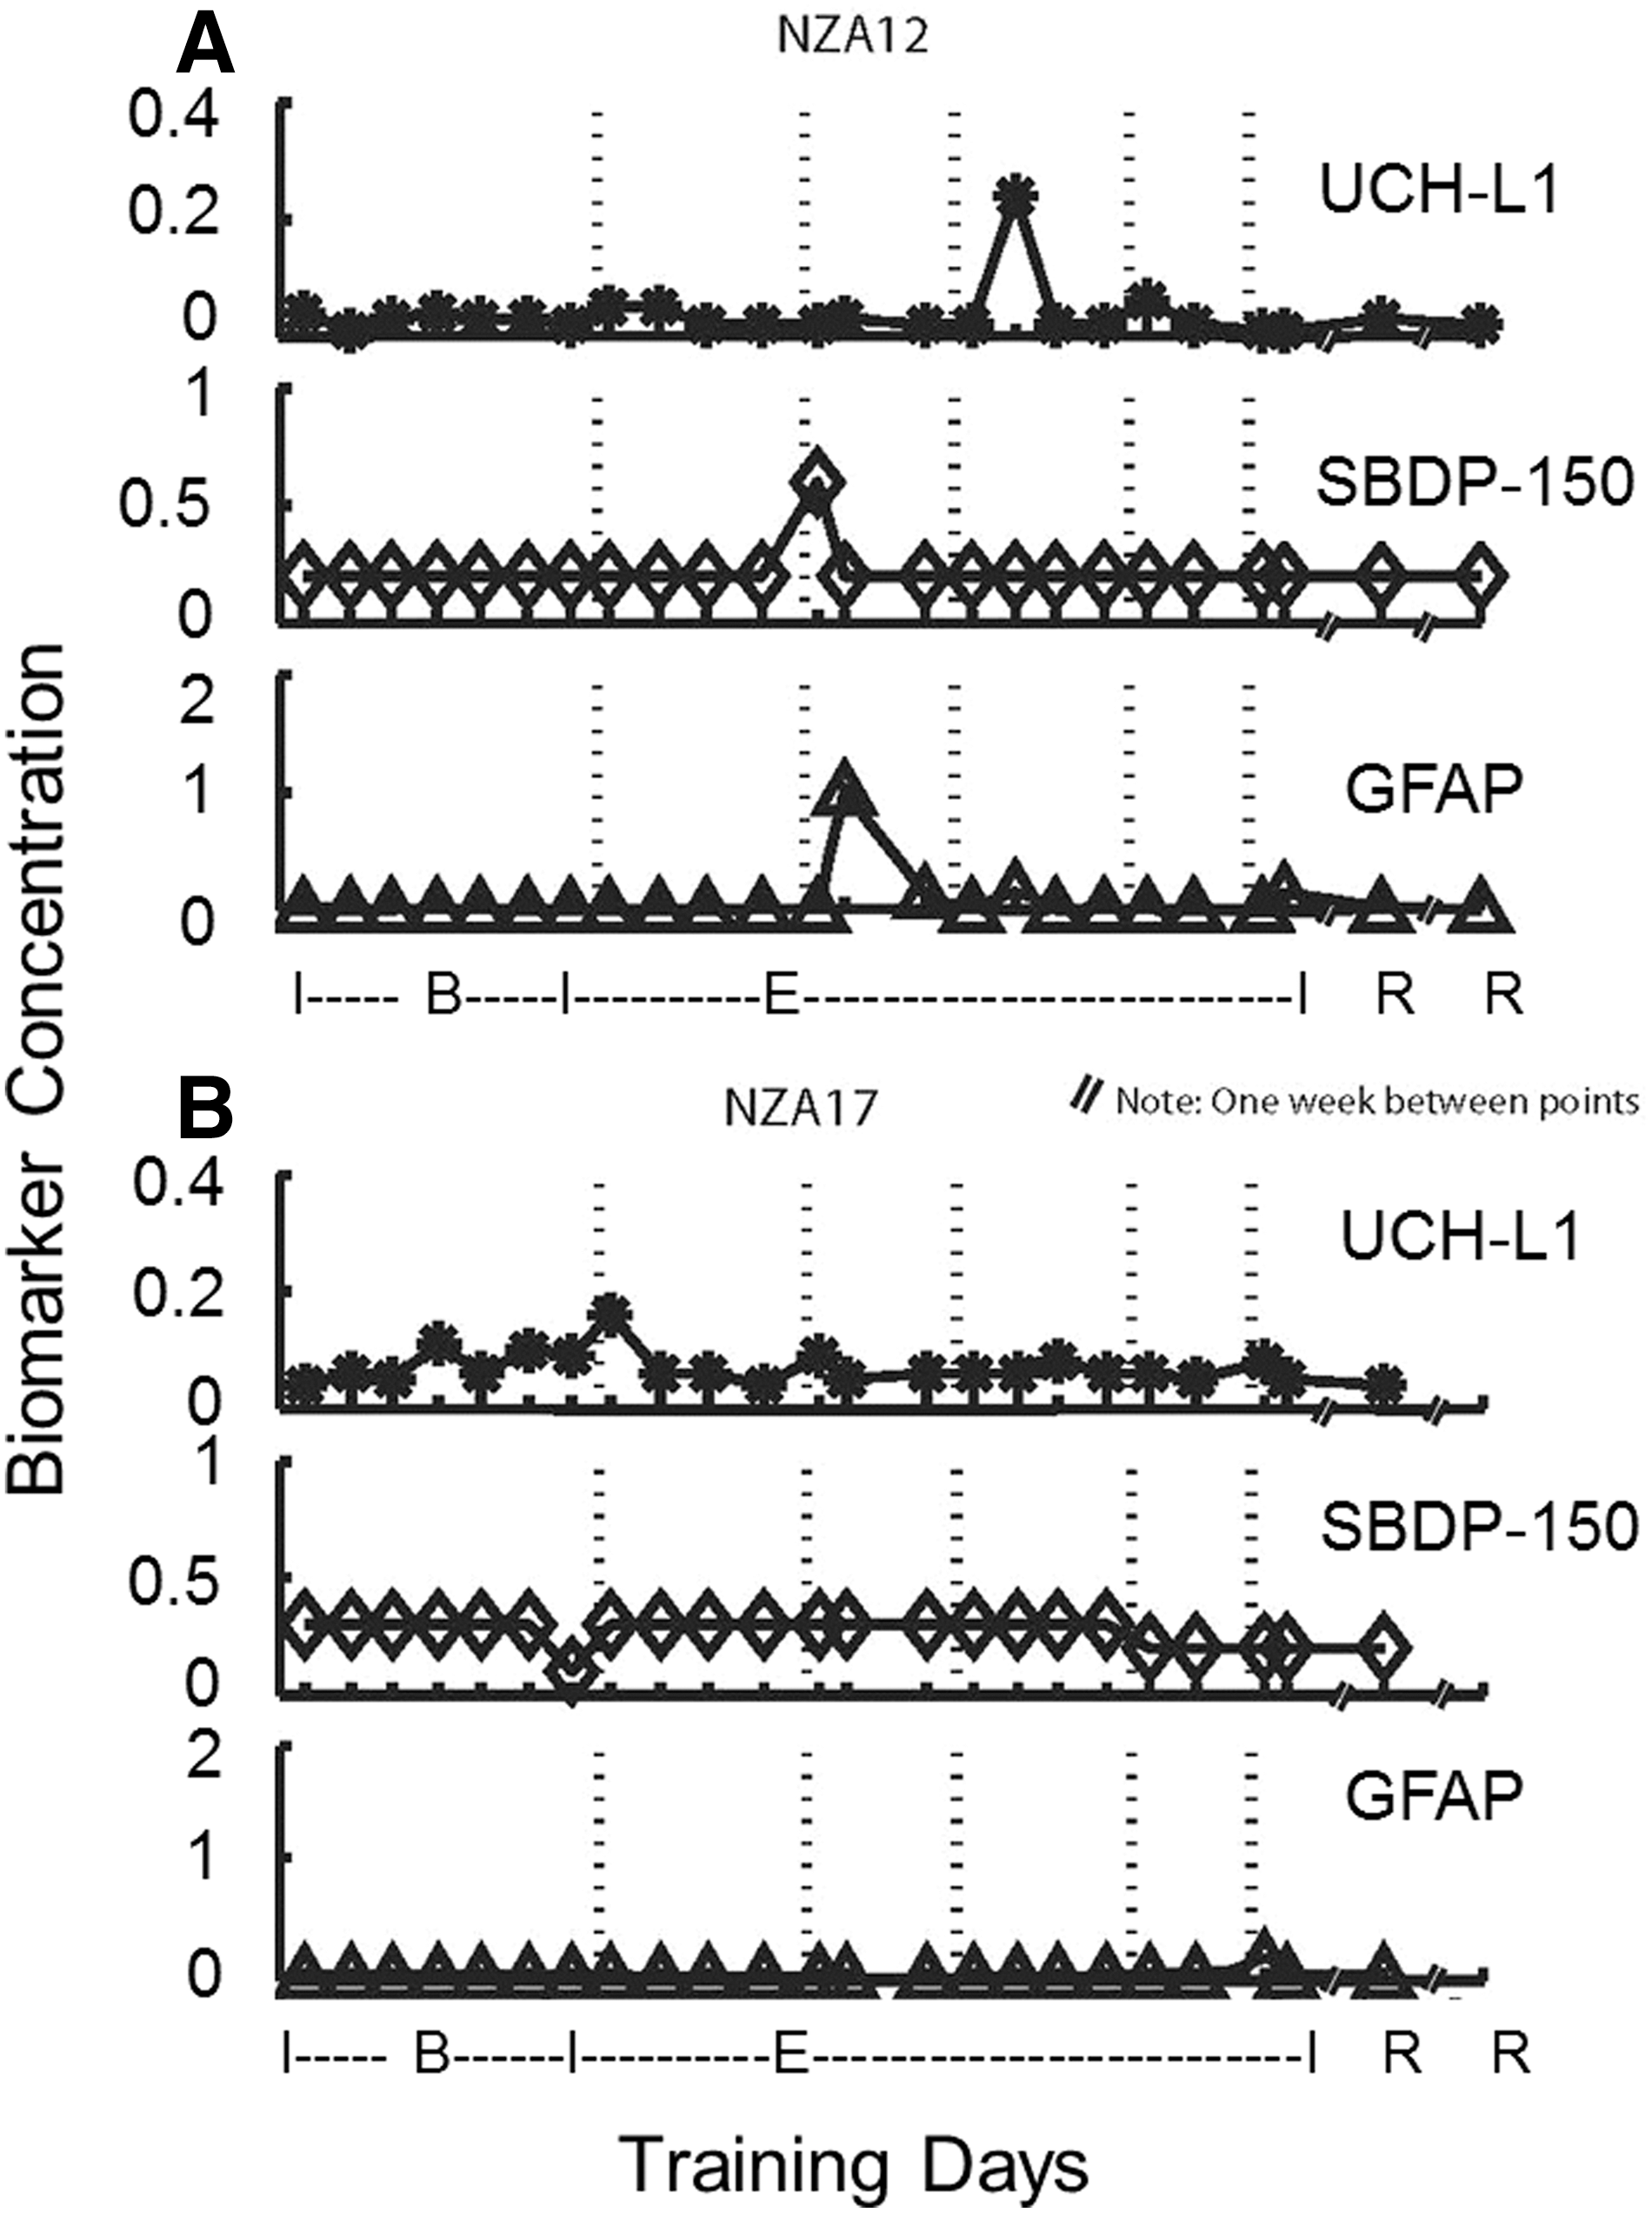
Composite biomarker scores for subjects NZA12 and NZA17. Examples of biomarker profile over time course before, during, and after breacher explosive entry training. Serum biomarker concentrations (in ng/mL) were plotted against pretraining (B or baseline), explosive entry training (E), and post-training days (R or recovery). As examples here, 1 subject (NZA12, left) with biomarker spikes and 1 (NZA17, right) with little or no biomarker increase over the training period are shown. UCH-L1, ubiquitin C-terminal hydrolase-L1; SBDP, αII-spectrin breakdown product; GFAP, glial fibrillary acidic protein.

Neurocognitive ANAM mean reaction time analysis: comparison among Biomarker Top 5, Biomarker Bottom 5, and overall mean. Top 5 and Bottom 5 reaction time values are the overall mean, mean of top 5, or mean of bottom 5 at each time point, respectively. PRO, MTH, and SR2 showed significant differences for mean reaction time at the 0.10 level (Z=0.0423, t=0.0582; Z=0.0774, t=0.0953; Z=0.0341, t=0.0491; respectively (r=0.503; p=0.028). ANAM, Automated Neurocognitive Assessment Metrics; CDS, Code Substitution; CDD, CDS Delayed; MTH, Mathematical Processing; M2S, Matching to Sample; SRT, Simple Reaction Time; SR2, Second administration of SRT; PRO, Procedural Reaction Time.
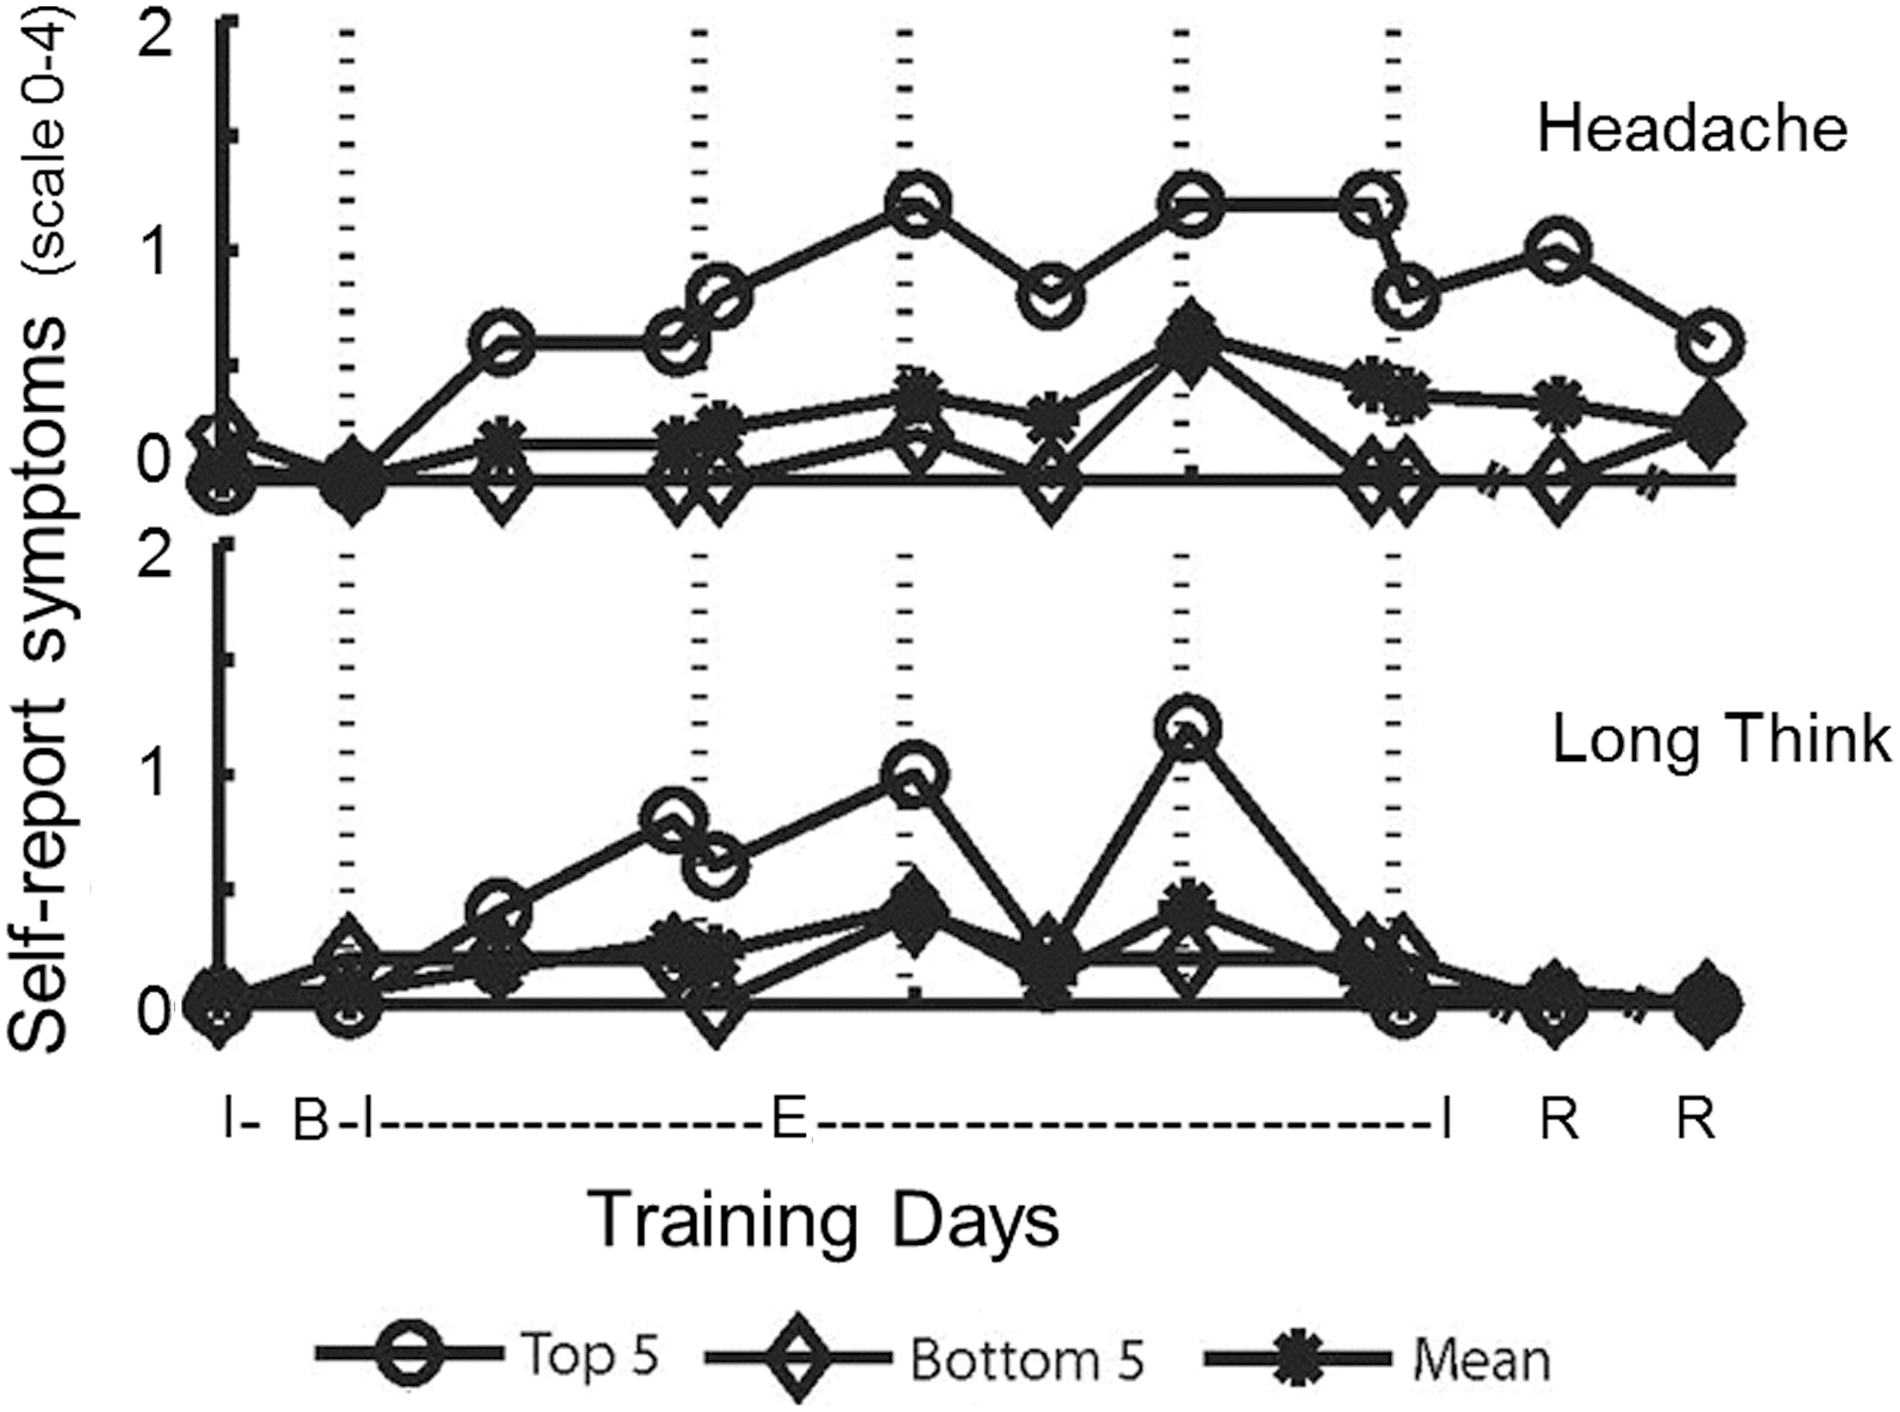
Self-reported symptoms (headache and long think): comparison among Biomarker Top 5, Biomarker Bottom 5, and overall mean. Wilcoxon's rank-sum test identified a significant increase in reporting headache in the Biomarker Top 5 versu Biomarker Bottom 5 (p=0.0006). Long think did not result in a significant difference (p=0.1757).

Scatter plot showing relationship between biomarker load and ANAM neurocognitive performance. All 19 subjects are shown here. *Indicates that the four of the top five individuals with the highest composite biomarker score also had the highest ANAM score decrements. Pearson's correlation coefficient 0.5033 (p=0.028). ANAM, Automated Neurocognitive Assessment Metrics; AUC, area under the curve. Color image is available online at

Comprehensive response profile over the training course period for 1 subject (NZA-11) with highest biomarker load. (
Brain protein biomarker levels
One-way repeated measures ANOVA of each of the seven pre-exposure biomarker concentrations did not identify a time effect during the control period for any of the three biomarkers evaluated, confirming a stable baseline. The one-way repeated measures ANOVA using baseline and blast exposures did show a time effect in GFAP (F=1.83; p=0.011). There was, however, no time effect for UCH-L1 or SBDP150.
Serum biomarker concentrations (in ng/mL) for each subject were plotted from pretraining baseline to post-training recovery for examination of biomarker “spikes” reflecting an individual's biological response to “brain insults” during the training period. For an example, Figure 2 shows 1 subject's (NZA12) biomarker profile with a biomarker spike response for each of the biomarkers examined, whereas another subject (NZA17) shows little or no biomarker increase. Also note that the multiple pretraining baseline samples show a consistent concentration.
In systematic analysis, biomarker mean level, maximum level, and baseline-subtracted biomarker load as AUC during explosive entry training for each subject and each biomarker was evaluated. The composite biomarker rank score for each subject based on AUC identified the Top 5 subjects as NZA-11, NZA-12, NZA-01, NZA-02, and NZA-07, whereas the Bottom 5 subjects were identified as NZA-13, NZA-14, NZA-16, NZA-17, and NZA-21.
Neurocognitive performance scores
One-way repeated measures ANOVA of mean reaction time (for correct responses) resulted in a time effect in two subtests, M2S and SR2 (F=2.25, H-F, p=0.029; F=3.44, H-F, p=0.019; respectively), and, for percent correct, a time effect in two subtests, M2S and CDD (F=3.58, p<0.001; F=2.72, H-F, p=0.004; respectively). Post-hoc comparisons, with Bonferroni's correction, to identify specific time points that differed from baseline showed differences on the second (M2S RT, p=0.036; CDD PC, p=0.012) and the fifth days of blast exposure (SR2 RT, p<0.001; M2S PC, p=0.027).
Wilcoxon's rank-sum test identified differences between the Top 5 and Bottom 5 groups, as determined from serum biomarker load, which were reflected in neurocognitive performance. Although mean reaction times for PRO, MTH, and SR2 were not significant at the p=0.05 level they were significant at the 0.10 level (Z=0.042, t=0.058; Z=0.077, t=0.095; Z=0.034, t=0.049; respectively [r=0.503; p=0.028]; see Fig. 3). The Top 5 also had lower percent correct on CDS and M2S (p=0.011 and 0.046, respectively) during exposure days. (Correction for multiple comparisons was not applied, given that the ANAM TBI battery subtests were selected to assess different cognitive functions.)
Self-reported symptoms
Military population is a notoriously underreporting population for health symptoms. 38 Nonetheless, half of the queried symptoms (16 of 32) met criterion of being reported at a level of 2 (of 4) by at least 2 members of the samples. Fatigue was the most frequently reported symptom (18 of 19); however, long think and headache were identified as important, because these two symptoms differentiate in their association with fatigue; long think shows positive correlation with fatigue, whereas headache generally is independent of fatigue. 39 As in analysis of neurocognitive performance, differences between the Top 5 and Bottom 5 groups, determined from serum biomarker load, were reflected in symptom reporting. As illustrated in Figure 4, Wilcoxon's rank-sum test identified an increase in symptom reporting for headache among the Top 5, as compared to the Bottom 5 (p<0.001), whereas long think showed a similar trend but did not reach statistical criterion.
Correlation between composite biomarker load, composite ANAM performance score, and self-reported symptoms
Similarly to composite biomarker rank score analysis, subjects were ranked based on their composite ANAM performance rank score. The 5 subjects with highest composite ANAM scores (deficits), were assigned to the “ANAM Top 5” group—they include NZA-01, NZA-02, NZA-04, NZA-11, and NZA-12. Pearson's correlation between composite biomarker rank score and composite ANAM rank score identified a relation between biomarker load and ANAM performance (r=0.503; p=0.028). Figure 5 shows all subjects and demonstrates the association between higher composite biomarker concentrations with poorer composite neurocognitive performance. Four of the Top 5 subjects with the highest composite biomarker scores were also among the Top 5 composite ANAM scores (i.e. NZA-01, NZA-02, NZA-11, and NZA-12). There was also a correlation between the composite ANAM score and the composite symptom score (r=0.649; p<0.003), with poorer performance corresponding to greater degree of reported symptoms. There was a moderate correlation between biomarker score and symptom score (r=0.434; p=0.064) that did not reach statistical criterion.
Figure 6 shows a response profile across variables for a single subject with the biggest deficit in performance as well as the highest biomarker loading. Figure 6 shows high biomarker load for UCH-L1 and SBDP150. The increase for SBDP150 occurred approximately 1.5 days after the third day of blast exposure, and for UCH-L1 approximately 0.5 day after blast day 4. This subject also expressed a neurocognitive deficit in performance subtests after blast days 4 and 5. This profile illustrates an increase in symptom reporting subsequent to exposure to blast, an increase that persisted through the end of the training course before returning to baseline.
Discussion
The primary aims in this study were to determine the effects of repetitive LLB exposure on brain biomarker response and changes in neurocognitive performance and to correlate these objective measures with subjective symptom reporting. These aims were met in that LLB exposure was associated with both brain biomarker response and changes in neurocognitive performance and each was reflected in symptoms reporting. This presentation of that association, although limited because of the small effect size expected in an undiagnosed population, is evidence for deleterious effects from repetitive LLB exposure and an ability to measure such effects. The contribution of primary blast injury (overpressure) as a mechanism of injury is supported in that subjects did not sustain any direct impact or penetrating force and the only physical insult to the head was blast overpressure.
To date, no commercially available single blood marker can reliably detect or exclude occurrences of mTBI. The discovery of biomarkers in biological fluids remains an enormous challenge, particularly the discovery of novel biomarkers for brain damage that can be assayed in peripheral serum. The identification of multiple biomarkers, which reflects key reactions in central nervous system (CNS) tissue after brain disruption may be more reliable in detecting a brain injury. A method to classify or differentiate patients with mTBI from patients without mTBI using peripheral serum alone, such as multiple biomarker readings, would be a significant enhancement in objective assessment, treatment, and triage of these patients.
In this study, after blast exposure, some subjects reached mean UCH-L1 levels of 0.1392 ng/mL (NZA-01), SBDP150 of 2.376 ng/mL (NZA-02), and GFAP of 0.1024 ng/mL (NZA-012) during the training period. Individual time-point maximal biomarker concentrations were higher still (e.g., UCH-L1 of 1.071 ng/mL [NZA-01], SBDP150 of 3.851 ng/mL [NZA-02], and GFAP of 1.010 ng/mL [NZA-12]; Figure 2). These maximal values appear to be in the same range of those observed in TBI subjects. For example, UCH-L1 levels were at approximately 5.32 ng/mL at 6 h postinjury for sTBI (Glasgow Coma Scale [GCS],<9), 17 2.2 ng/mL for moderate TBI (GCS, 9–12), and 0.6–1.6 ng/mL for mTBI (GCS, 13–15). 28 GFAP levels were at 3.1 ng/mL within 4 h postinjury for moderate TBI and 0.5–1.1 ng/mL for mTBI. 27 SBDP150 levels can reach 16 ng/mL within the first 6 h postinjury for sTBI and in the range of 3–5 ng/mL 4 h within injury for moderate and mTBI (Wang et al., unpublished). Thus, it is apparent that mean levels of these markers during breacher training are generally below mTBI levels, but individual peak values can be in the same range of those found in patients with diagnosed mTBI. In terms of the origin of serum GFAP, it is conceivable that it could come, in part, from a source other than the CNS, for example, injured Schwann cells in the peripheral nervous system (PNS). 40,41 However, based on the differential biomass between PNS and CNS (much larger volume), it is likely that the peripheral contribution plays only a minor role in the serum GFAP levels we observed.
Although this is the first human blast study to report significant changes in biomarker levels in humans after blast exposure, Blennow and colleagues 42 have previously reported the effects of repeated exposure to blast from explosives or the firing of heavy weapons. They evaluated three groups: The first group was located in the shooter position and fired either artillery (three rounds) or bazooka (six rounds), whereas the second group fired the Carl-Gustaf bazooka (shooter's position, 10 rounds). Exposure for these two groups occurred on a single day, whereas the third group was exposed to the detonation of multiple explosive charges (100) over 10 days. They reported no change in the level of glial cell injury markers (GFAP and S-100b) in any of the three test groups (artillery firing, Carl-Gustaf bazooka, or explosive charges) as well as no change in CSF biomarkers for neuronal or axonal damage, blood–brain barrier (BBB) damage, or hemorrhage. Unfortunately, the individual blast-pressure exposure for each individual is unknown because it was calculated from audiometric measures, which may not accurately reflect individual blast-pressure wave exposure, and these measures are also unable to quantify the impulse energy resulting from the blast wave. This is especially true in the shooter's position, because, in that position, they are always located behind and/or below the firing tube, which is the point of lowest exposure as the blast/wave exits the tube and wraps backward, to a lesser degree, then out and away. Consequently, the lack of any significant change in biomarkers may be the result of a lower level of individual blast exposure in their study. In addition, the lack of any biomarker changes could be a result of sample timing, because Blennow and colleagues only collected a single blood sample 4–15 days postexposure and may have missed a spike, which was captured by the twice-daily blood sampling herein.
In this study, the markers (especially UCH-L1 and GFAP) were observed as a peak at single time points (e.g., after blast day training; see Figs. 2 and 6), as opposed to sustained levels throughout the training session or even sustained across multiple days. This pattern may reflect a transient injury perturbation event of the brain associated with a vulnerable individual's specific blast exposure, leading to biomarker release into circulation. To date, it is unclear whether the release of these markers into the blood requires the opening of the BBB or may be transiting by an alternate, and as yet unidentified, route. Such an alternative explanation is that previous blast events may have triggered biomarker release into the CSF and extracellular fluid within the brain, and a subsequent acute LLB exposure increased the permeability of the BBB, allowing these accumulated biomarkers to be released into the blood compartment. Additionally, the biomarker peak single time points of the responding subjects did not occur at the same time (i.e., after a specific day's blast exposure). As identified previously, each subject's exposure time/dose effect varied according to their activities within training subgroups. This variance in the time course of biomarker expression highlights the need to characterize the biomarker “spikes” in relation to an individual's blast exposure profile in future studies.
With respect to neurocognitive performance, Figure 3 illustrates the variance in reaction-time performance between groups (Top 5 vs. Bottom 5) as a function of each ANAM subtest. The difference identified in the performance of each task is a reflection of the complexity of the task and its focus (e.g., simple reaction time vs. mathematical processing vs. memory) with respect to blast exposure. Because performance for each of these tasks can be linked to specific brain regions, this may provide some direction for additional investigations. Significant groups changing over time was evident in SR2 and in the reaction-time component of M2S. Wilcoxon's rank-sum identified differences between Top 5 and Bottom 5 for reaction time across the subtests, PRO, MTH, and SR2 (Fig. 3). This is consistent with impaired reaction time as a common neurocognitive deficit in mTBI irrespective of the mechanism of injury. 43 The CDD subtest showed the most prominent performance decrements and is also the subtest that has the largest memory demand. Such delayed memory tests are hallmarks of neuropsychological evaluations of brain injury. In this study, the performance decrement was evident in both percent correct and mean reaction time. This pattern of deficit resolved with termination of blast exposure, because accuracy on CDD returned to baseline at the postexposure time points. It is relevant that this blast-exposure–related deficit pattern in tests with memory demand was also reported for the precursor study in Quantico, in both behavioral assessment and neuroimaging assessment modalities. 30
The results of Wilcoxon's rank-sum test support the observed outcome measures between the Top 5 and Bottom 5 biomarker load subjects. Symptom reporting for headache and long think showed that the Top 5 report these symptoms more frequently and in greater severity than the Bottom 5. This difference is only statistically significant for headache (Fig. 4), supporting an association with brain perturbation, whereas taking longer to think may overlap with other conditions such as fatigue. 39 Additionally, as reflected in Figure 4, the Top 5 reported early increase in headache, which persisted throughout exposure. This may be an indication that they received higher exposures or that those individuals who reported headaches may be more vulnerable to the effects of blast.
The symptom scores in this protocol were limited by the narrow range of the symptom reporting scale (0–4). We noted that a response of 4 (“severe problem”) was never reported. A response of 3 was reported 1.8% of the time for headache and not at all for long think. The response of 0 (“not experienced at all”) was reported 83.5% of the time for headache and 85% of the time for long think. The trend in reporting may be attributed to the resilient nature of this subject sample or their tendency to underreport.
Training standard for breachers historically sets a “safe” single-exposure level based on tympanic membrane tolerance to pressure change. Alternatively, acoustic thresholds can determine the safe exposure thresholds for military weapons. Blennow and colleagues 42 found no evidence of neurochemical changes or symptom reporting in military personnel in the “approved” firing position on heavy weapon systems. Estimating exposure from the acoustic units presented in that study makes it consistent with the accepted tolerance level in breaching activities. The breacher population, however, reported symptoms after exposure to LLB. Stand-off distances for breaching are a product of empirical equations extrapolated from free-field “scaled distance” pressure decay models. In reality, urban breaching is conducted in a dynamic environment where it is unlikely that the pressure profile behaves as expected. The breacher's occupational environment therefore likely results in a variable exposure “dose” for each individual in proximity to each blast (Fig. 1). The historical symptom reporting and, currently, the correlation with biomarker expression and neurocognitive performance indicate that a factor of that exposure (single event and/or multiple exposures exceeding safe pressure thresholds) is producing a response in some exposed individuals. Further studies should aim to quantify individual pressure exposures in relation to the outcome measures. Additionally, clinical response to a given insult is known to be individually variable. Hence, there is an expectation that biological activity and clinical expression in response to blast exposure may be more evident in some individuals than others after the same exposure event. Figure 6 shows the correlation of all data streams, the variability in timing and biomarker expression, and the clear resolution of all deficits at 2 weeks postcourse. Note that although this is a profile of a single subject, different profiles were observed in other subjects, clearly demonstrating that factors such as level of individual blast exposure and sensitivity to blast require further research. In addition, further efforts need to focus on the kinetic dynamic relationship between these factors and outcome measures such as self-reported symptoms, biomarker spikes, and neurocognitive deficits.
To validate effective objective measures of mTBI, which is a functional impairment, it is necessary to identify connections between biological activity and measures, such as neurocognitive performance or symptomology. A clear limitation of this study is the low number of subjects. This reflects the inherent difficulties in accessing this unique population in their occupational environment. The predominantly blast-naïve nature of these subject students assists in reducing premorbid confounders of initial observations. Additionally, their attachment to a single unit facilitates follow-up data collection. Given the stratified population and observed variance in individual clinical response to exposure, future studies should aim to increase the sample size and include closer scrutiny of individual results (including individual blast exposure monitoring) and the various components that may contribute to their observed response.
In both training and operations, breachers are repeatedly exposed to blast events in the course of carrying out their duties. There is growing concern that repeated blast exposures may cause health problems and anecdotal complaints by breachers, including sleep pattern disruption, chronic headaches, and memory difficulties, symptoms that mirror those reported by service personnel exposed to blast in Afghanistan and Iraq. 44 From the results reported here, it can be suggested that biomarker level spikes and load might represent physical brain perturbation as a result of blast overpressure exposure leading to brain cell injury or at least a change in cell membrane permeability (thus releasing these brain cell markers into the circulation). The breachers were not “injured” during the 2 weeks of training, their expression of subjective complaints were all subclinical, and, along with the biological measures, returned to baseline by 14 days after the last exposure. The signal noted during exposure, however, may be an index of subclinical brain injury that may have a more significant impact in later life or could be compounded by multiple exposures, such as was suggested in the Quantico study. 30 This may also mirror recent reports of the sequelae of repetitive brain injuries in professional athletes many years after the end of their careers. As discussed herein, additional investigations need to focus on the following variables: (1) evaluate the contribution of individual characteristics to vulnerability to blast; (2) quantification of blast exposure data collected from individuals that can be related to concurrent data streams; (3) the kinetic dynamic relationship between blast exposure and the onset of biological and clinical affects; and (4) evaluation into the effects of repetitive training iterations over time (years) to determine potential long-term sequelae.
Conclusion
In this pilot study, we studied changes in serum brain biomarker levels, neurocognitive performance, and self-reported symptoms in 19 soldiers subjected to repeated LLB during a 2-week explosive entry-training course. Converging evidence of parallel data streams (i.e., biomarkers, neurocognitive performance, and symptoms) suggests that there are cognitive impairments, changes in biomarker loading, as well as changes in symptomology resulting from exposure to blast. This effect is measurable in individuals even at the theoretically LLB exposure defined in breaching activities. Data from this pilot study and as well as the composite data analysis methodologies we developed here can be used toward a more refined, expanded study of primary blast head injury. This should include individual and cumulative blast overpressure pressure monitoring and brain imaging, in addition to brain biomarkers, neurocognitive testing, symptom inventories, and medical histories.
Footnotes
Acknowledgments
This work was funded by the NZDF, a grant from the Congressionally Directed Medical Research Program (award no.: W81XWH-09-2-0055 of), and RAD III of the U.S. Army Medical Research and Materiel Command. The authors thank Christina R. LaValle for her statistical support, the contributing New Zealand military unit medical staff, and the staff of the Walter Reed Army Institute of Research and Naval Medical Research Center for their assistance in the completion of this study and the preparation of the manuscript for this article. The opinions and assertions contained herein are the private views of the authors and are not to be construed as official or as reflecting the views of the NZDF, the U.S. Army, the U.S. Navy, or of the U.S. DoD.
Author Disclosure Statement
R.L.H. is officer of Banyan Biomarkers Inc. and K.K.W.W. and R.L.H. own stock of Banyan Biomarkers Inc.
References
Supplementary Material
Please find the following supplemental material available below.
For Open Access articles published under a Creative Commons License, all supplemental material carries the same license as the article it is associated with.
For non-Open Access articles published, all supplemental material carries a non-exclusive license, and permission requests for re-use of supplemental material or any part of supplemental material shall be sent directly to the copyright owner as specified in the copyright notice associated with the article.
