
Abstract
Severe blast exposures are frequently complicated with fatal intracranial hemorrhages. However, many more sustain low level blasts without tissue damage detectable by brain imaging. To investigate effects of nonlethal blast on thrombin-related biomarkers, rats were subjected to two different types of head-directed blast: 1) moderate “composite” blast with strong head acceleration or 2) moderate primary blast, without head acceleration. Thrombin generation (TG) ex vivo after blast was studied by calibrated automated thrombography (CAT). In the same blood samples, we assessed maximal concentration of TG (TGmax), start time, peak time, mean time, and concentrations of protein markers for vascular/hemostatic dysfunctions: integrin α/β, soluble endothelial selectin (sE-selectin), soluble intercellular cell adhesion molecule-1 (sICAM-1), and matrix metalloproteinases (MMP)-2, MMP-8, and MMP-13. Blast remarkably affected all TG indices. In animals exposed to “composite” blast, TGmax peaked at 6 h (∼4.5-fold vs. control), sustained at day 1 (∼3.8-fold increase), and declined to a 2-fold increase over control at day 7 post-blast. After primary blast, TGmax also rose to ∼4.2-fold of control at 6 h, dropped to ∼1.7-fold of control at day 1, and then exhibited a slight secondary increase at 2-fold of control at day 7. Other TG indices did not differ significantly between two types of blast exposure. The changes were also observed in other microvascular/inflammatory/hemostatic biomarkers. Integrin α/β and sICAM-1 levels were elevated after both “composite” and primary blast at 6 h, 1 day, and 7 days. sE-selectin exhibited near normal levels after “composite” blast, but increased significantly at 7 days after primary blast; MMP-2, MMP-8, and MMP-13 slightly rose after “composite” blast and significantly increased (∼2-4-fold) after primary blast. In summary, CAT may have a clinical diagnostic utility in combination with selected set of microvascular/inflammatory biomarkers in patients subjected to low/moderate level blast exposures.
Introduction
B
Thrombin, or activated factor II, is a protease in the bloodstream that plays a key role in the modulation of hemostasis in general, but specifically in the activation of the coagulation cascade. Thrombin is produced by enzymatic cleavage of prothrombin by activated factor X, and is required to convert soluble protein fibrinogen into insoluble fibrin, promoting formation of a clot. 9,10 In addition, thrombin is believed to affect other biological activities in various cell types, including endothelial cells 11 and platelets. 12 Being a potent vasoconstrictor and mitogen, thrombin is recognized as a contributor to both acute and prolonged vasospasm, playing an important role in the pathogenesis of stroke by promoting cerebral ischemia, and/or enhancing risks for intracranial hemorrhage. 13 Several studies identified thrombin as an important contributor to the pathological developments following various injury types. 14,15
Therefore, assessing thrombin activity represents an attractive, and potentially clinically useful, diagnostic tool for blast-related injury triage.
However, considering fast cleavage and aggressive binding patterns, measurement of thrombin activity is challenging. The most reliable among presently available tests is serial assessment of thrombin in plasma as a function of time, by comparing the fluorescent signal from a thrombin-generating sample using the calibrated automated thrombography (CAT) method, developed by Hemker and colleagues. 16,17 Applying the CAT system, we determined the blast wave-induced effects on multiple indices of thrombin generation (TG) potential and compared them with concomitant changes of several other markers of coagulation/inflammation vessel wall crosstalk. Using these proteins as a supplementary biomarkers panel for TBI diagnostics can validate and support otherwise injury type-nonspecific CAT data.
Methods
Blast generator design and setup
The compressed air-driven shock tube, capable of generating a wide range of controlled blast waves, has been described in detail previously. 18 The tube consists of two sections: high-pressure (driver) and low-pressure (driven) separated by a diaphragm. Peak overpressure (OP), composition, and duration of the generated high pressure shockwaves are determined by the shock tube configuration, including thickness, type of diaphragm material, driver/driven length ratio, and the initial driver pressure at the moment of diaphragm rupture. In the presented series of experiments, we employed different spatial setups as will be described subsequently. The blast pressure data were acquired using PCB Piezoelectric blast pressure transducers and LabView 8.2 software. A National Instruments 1.25 M samples/sec data acquisition card was used to acquire data from multiple channels. The rat head images during the blast event were captured at 40,000 frames/sec using a high speed video camera (Phantom V310, Vision Research, Wayne, NJ).
Animal exposure to a controlled blast wave
Modeling of the primary blast and the “composite” OP load was achieved by variable positioning of the target versus the blast generator. All rats were anesthetized with isoflurane inhalations, described previously in detail. After reaching a deep plane of anesthesia, they were placed into a holder exposing only their heads (body-armored setup) at a distance 5 cm below the exit nozzle of the shock tube. Rats were positioned either directly on the shock tube axis (n=5) to expose them to the “composite” blast including the compressed air jet (Fig.1 A, B) or at the 45 degree angle to it (n=6) for exposure only to the primary blast wave (Fig.1 D, E). Animals were then subjected to a single blast with a mean peak OP of 230–380 kPa at the target. The exact static and dynamic overpressure values depending upon the angle and distance of rat head from the nozzle of shock tube were established during the prior calibration tests. The control group of animals (n=4) underwent the same treatment (anesthesia, handling, recovery), except they were not exposed to a blast.
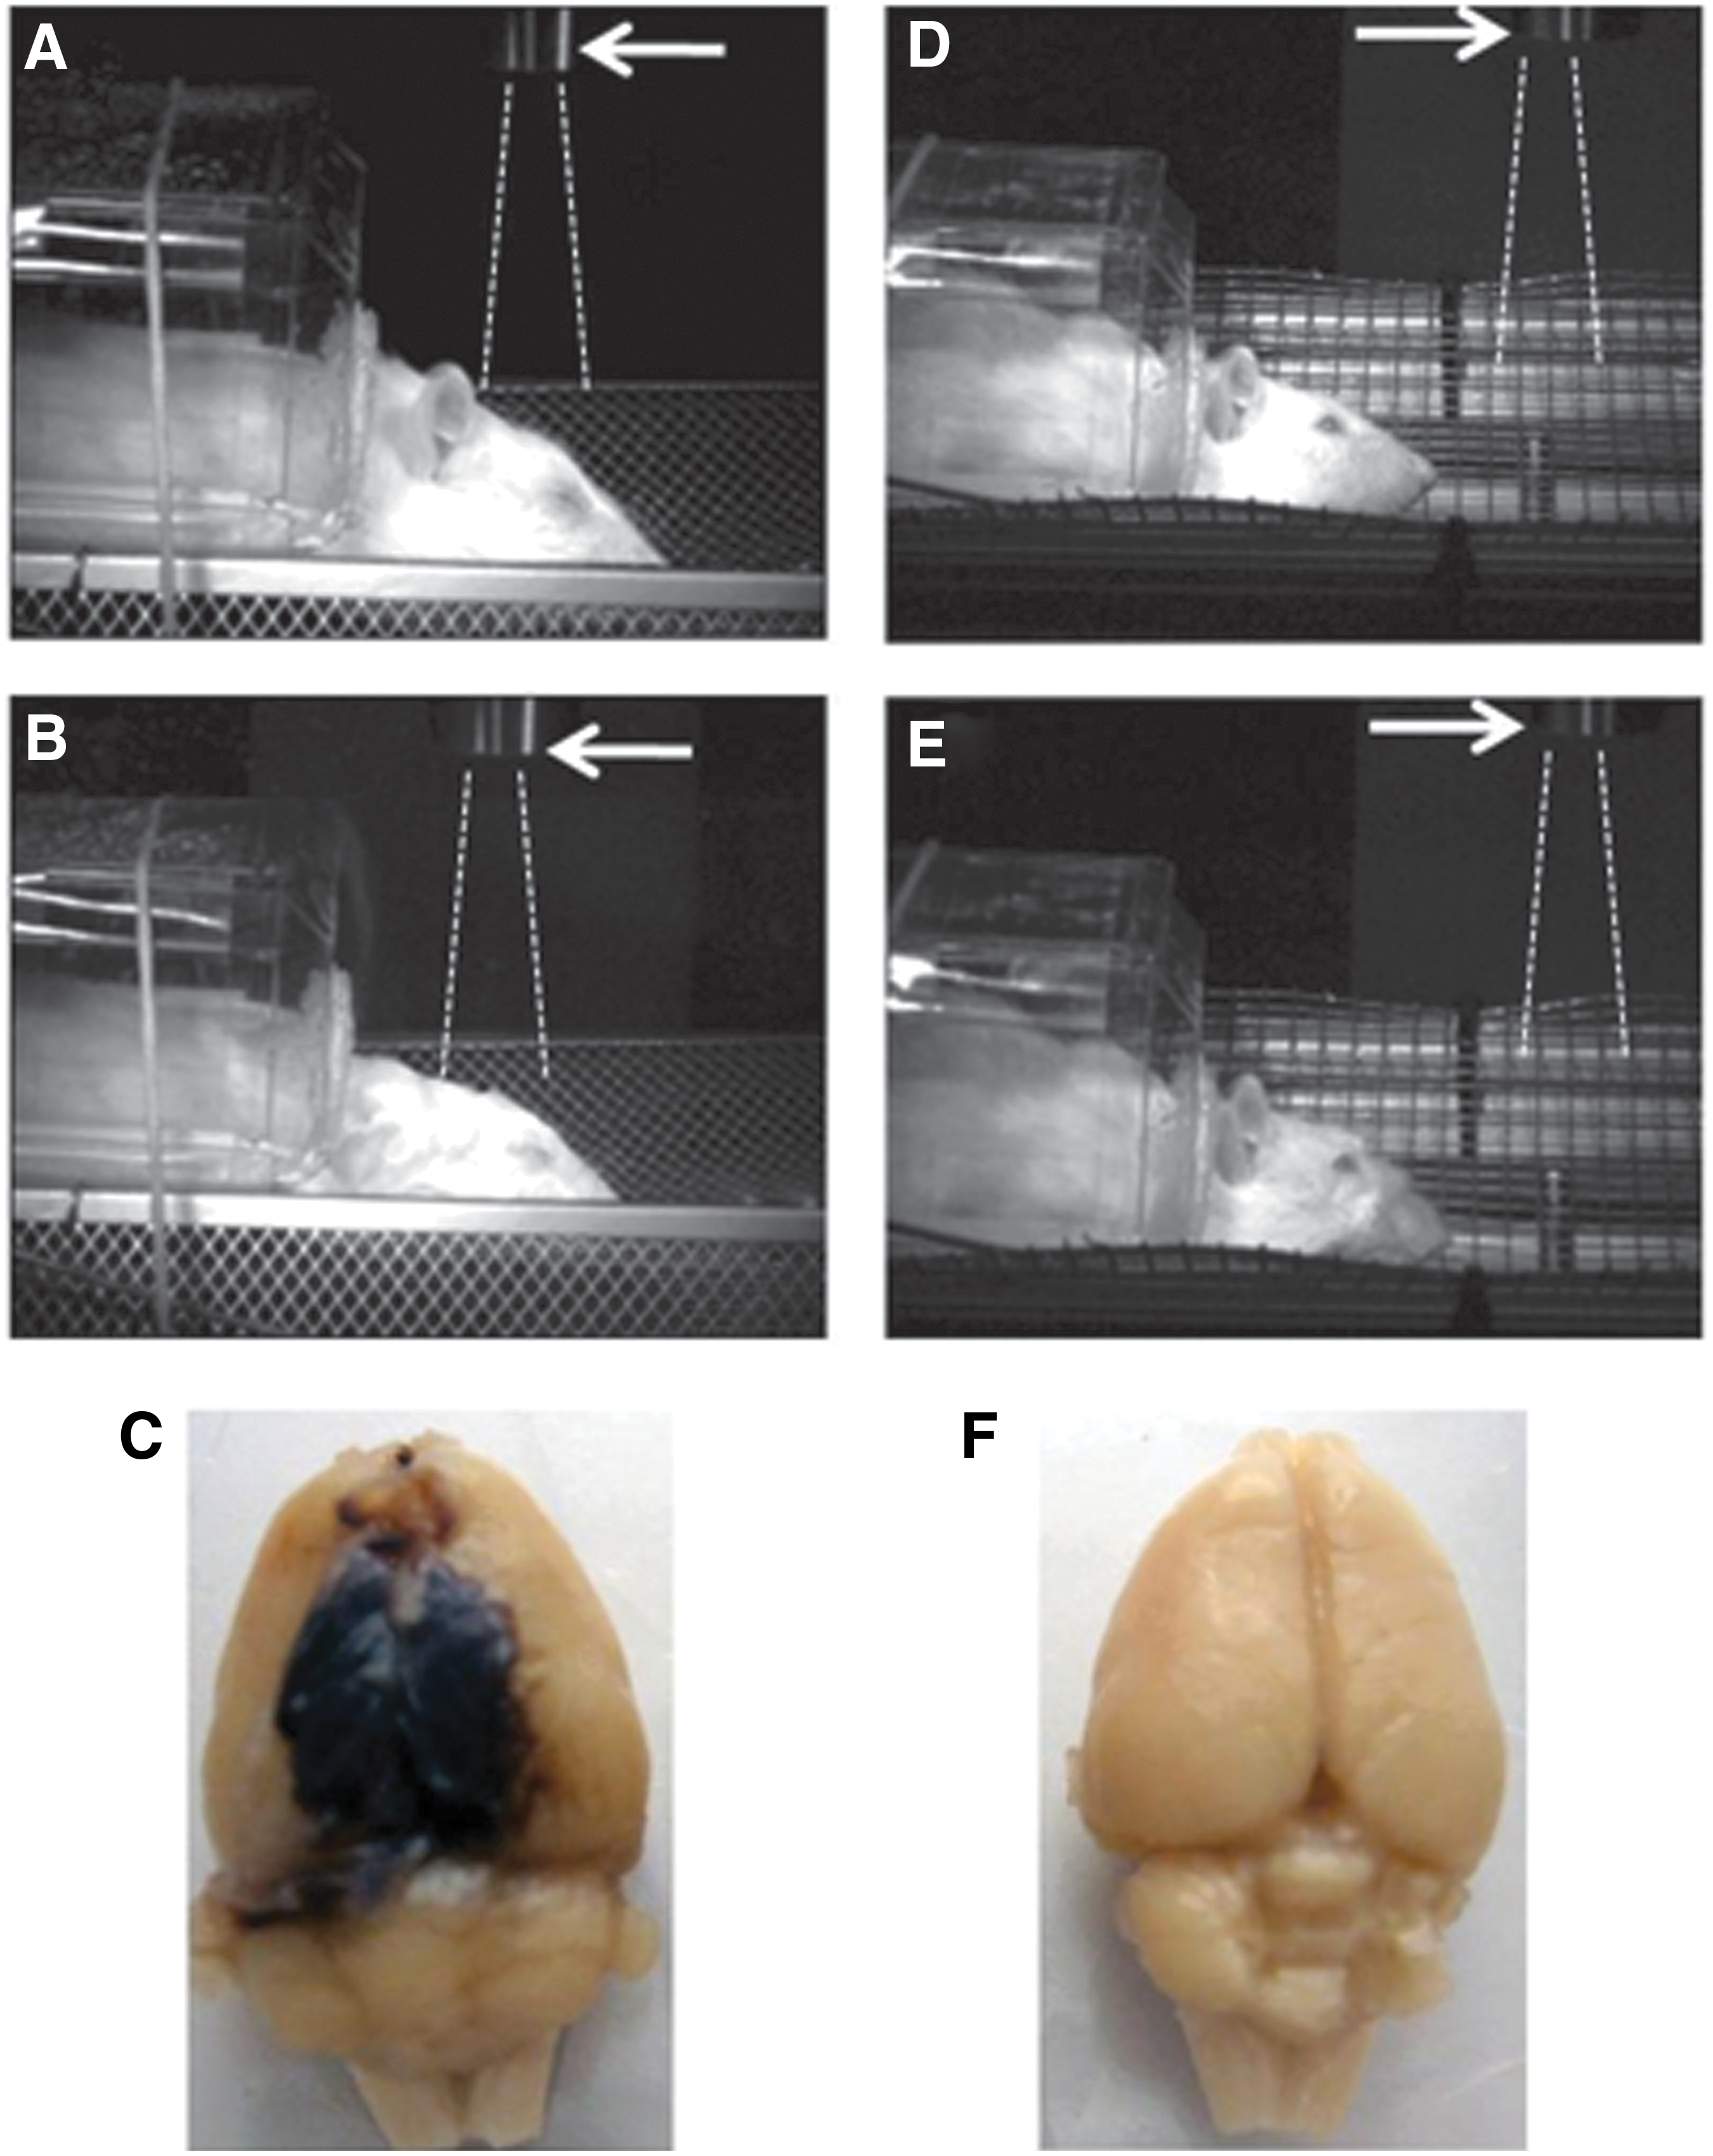
Rat models of brain injury with “composite” or primary blast overpressure. High speed video images recorded before
Blood collection
At the required time points following blast exposure, animals were euthanized according to guidelines approved by the Institutional Animal Care and Use Committee (IACUC) of the University of Florida. With the animal under isoflurane anesthesia, blood was withdrawn directly from the heart with an 18 gauge needle, and processed to obtain plasma and serum. One half of collected blood aliquot was drawn into 0.5 mL Capiject EDTA (K2) tubes (Terumo, Elkton, MD) at room temperature. The Capiject tube was gently inverted three to five times to ensure complete mixing of the anticoagulant. Platelet poor plasma (PPP) was centrifuged at 6000g for 15 min at room temperature, and frozen at −80°C until analysis. Another half of the blood aliquot was drawn into Multivette 600 tubes with clotting activator (Sarstedt, Nümbrecht, Germany) and was allowed to clot at room temperature for 40 min. Serum was separated by centrifugation at 10,000g for 5 min and frozen at −80°C until analysis. All samples were labeled with a coded number and analyzed by blinded technicians.
Antibody-based assays
Custom Biotin Label-based (L-series) RatAntibody arrays (Ray Biotech, Norcross, GA) were used to assess relative levels of integrin α/β, soluble endothelial selectin (sE-selectin), and matrix metalloproteinases (MMP)-2, MMP-8 and MMP-13 in rat serum following blast exposure. Commercially available Sandwich ELISA kits for soluble intercellular adhesion molecule-1 (soluble intercellular cell adhesion molecule-1 [sICAM-1]; CUSABIO Biotech) were used according to the manufacturer's instructions.
CAT reagents
Fluobuffer containing 20 mM HEPES and 60 mg/mL bovine serum albumin (Sigma, St. Louis, MO) were prepared ex tempore on the day of the experiment. Working buffer consisted of 140 mM NaCl, 20 mM HEPES, and 5 mg/mL human serum albumin. The fluorogenic substrate Z-Gly-Gly-Arg-amino-methyl-coumarin (Bachem, Bubendorf, Switzerland) was solubilized in pure dimethylsulfoxide (DMSO, Sigma, St. Louis, MO). The PPP reagent with a content of 5 pM tissue factor, and the thrombin calibrator (Thrombinoscope BV, Maastricht, Netherlands), was provided by Diagnostica Stago (Parsipanny, NJ).
CAT
Measurement of TG potential was performed using the CAT system. The validation details of the method are described elsewhere. 16,17,19 Briefly, for each experiment, a fresh mixture of fluobuffer and CaCl2 solution was prepared and incubated for 5 min at 37°C. After 5 min, 75 μL of the Fluo-DMSO-solution were added, mixed and incubated for a further 5 min. The resulting clear solution was referred to as FluCa. PPP reagent was solubilized with 2 mL deionized water. Twenty microliters of this trigger solution were put into each sample well of a 96 well round-bottom microtiter plate made of polypropylene (Nunc, Roskilde, Denmark). After reconstitution with 1 mL sterile water, the thrombin calibrator was used in each experiment to compare the simultaneously measured thrombin activity in the sample with that from a known and stable concentration in the calibrator well. Finally, 80 μL of plasma were put into each well. The 96 well plate was then placed in the fluorometer (Fluoroskan Ascent, Thermolabsystems OY, Helsinki, Finland) with an excitation filter at 390 nm and an emission filter at 460 nm. The automated dispensing of 20 μL FluCa indicated the onset of measurement of thrombin indices. Each well was measured every 20 sec for the duration of 40 min. Each experiment was performed fourfold. We used Analysis Software from Diagnostica Stago, Inc. (Parsippany, NJ) to assess four indices, namely TGmax (max concentration of TG), start time (t-start) peak time (t-peak), and mean time (t-mean).
Statistical analysis
The Mann–Whitney U test was used to analyze nonparametric data. Normally distributed data were expressed as mean±SD, and skewed data as median (range). All p values were two sided, with the significance level set at 0.05. Statistical analyses were performed using GraphPad Prism (GraphPad Software, La Jolla, CA).
Results
Blast-induced gross pathology
The high speed video recordings shown in Figure 1 present different biomechanics of target movement on the load of the “composite” or primary blast. Significant head acceleration and deformation after “composite” blast exposure (Fig. 1 A, B) were accompanied by typical focal and massive intracranial hematomas and brain swelling. The hemorrhages and hematomas developed within hours after impact and appeared visibly through the undamaged skull at 24–48 h after blast exposure (data not shown). The size of hematomas varied significantly in different rats and formed a capsule at 5 days post-blast, as shown in one of the most damaged rat brains after in situ perfusion (Fig. 1 C). The intracranial blood accumulation partially resolved at day 14 in a majority of rats observed (data not shown). On the other hand, primary blast exposure in the described model did not lead to noticeable hematomas.
Thrombin biomarkers
The combined data on TG potential at different time points and blast setups are presented in the Table 1.
p value<0.05 versus naïve samples.
CAT, calibrated automated thrombography.
All indices of TG were remarkably affected in all blast-exposed rats compared with naïve animals. However, in “composite” blast-exposed animals, TGmax peaked at 6 h (∼4.5-fold vs. control), sustained at 1 day (∼3.8-fold increase), and declined to a 2-fold increase over control levels at day 7 post-blast. In rats subjected to primary blast, TGmax also rose to ∼4.2-fold of control values at 6 h, dropped to ∼1.7-fold of control levels at 1 day post-blast, and then exhibited a secondary increase to 2-fold of control values at day 7 post-blast (Fig. 2A).
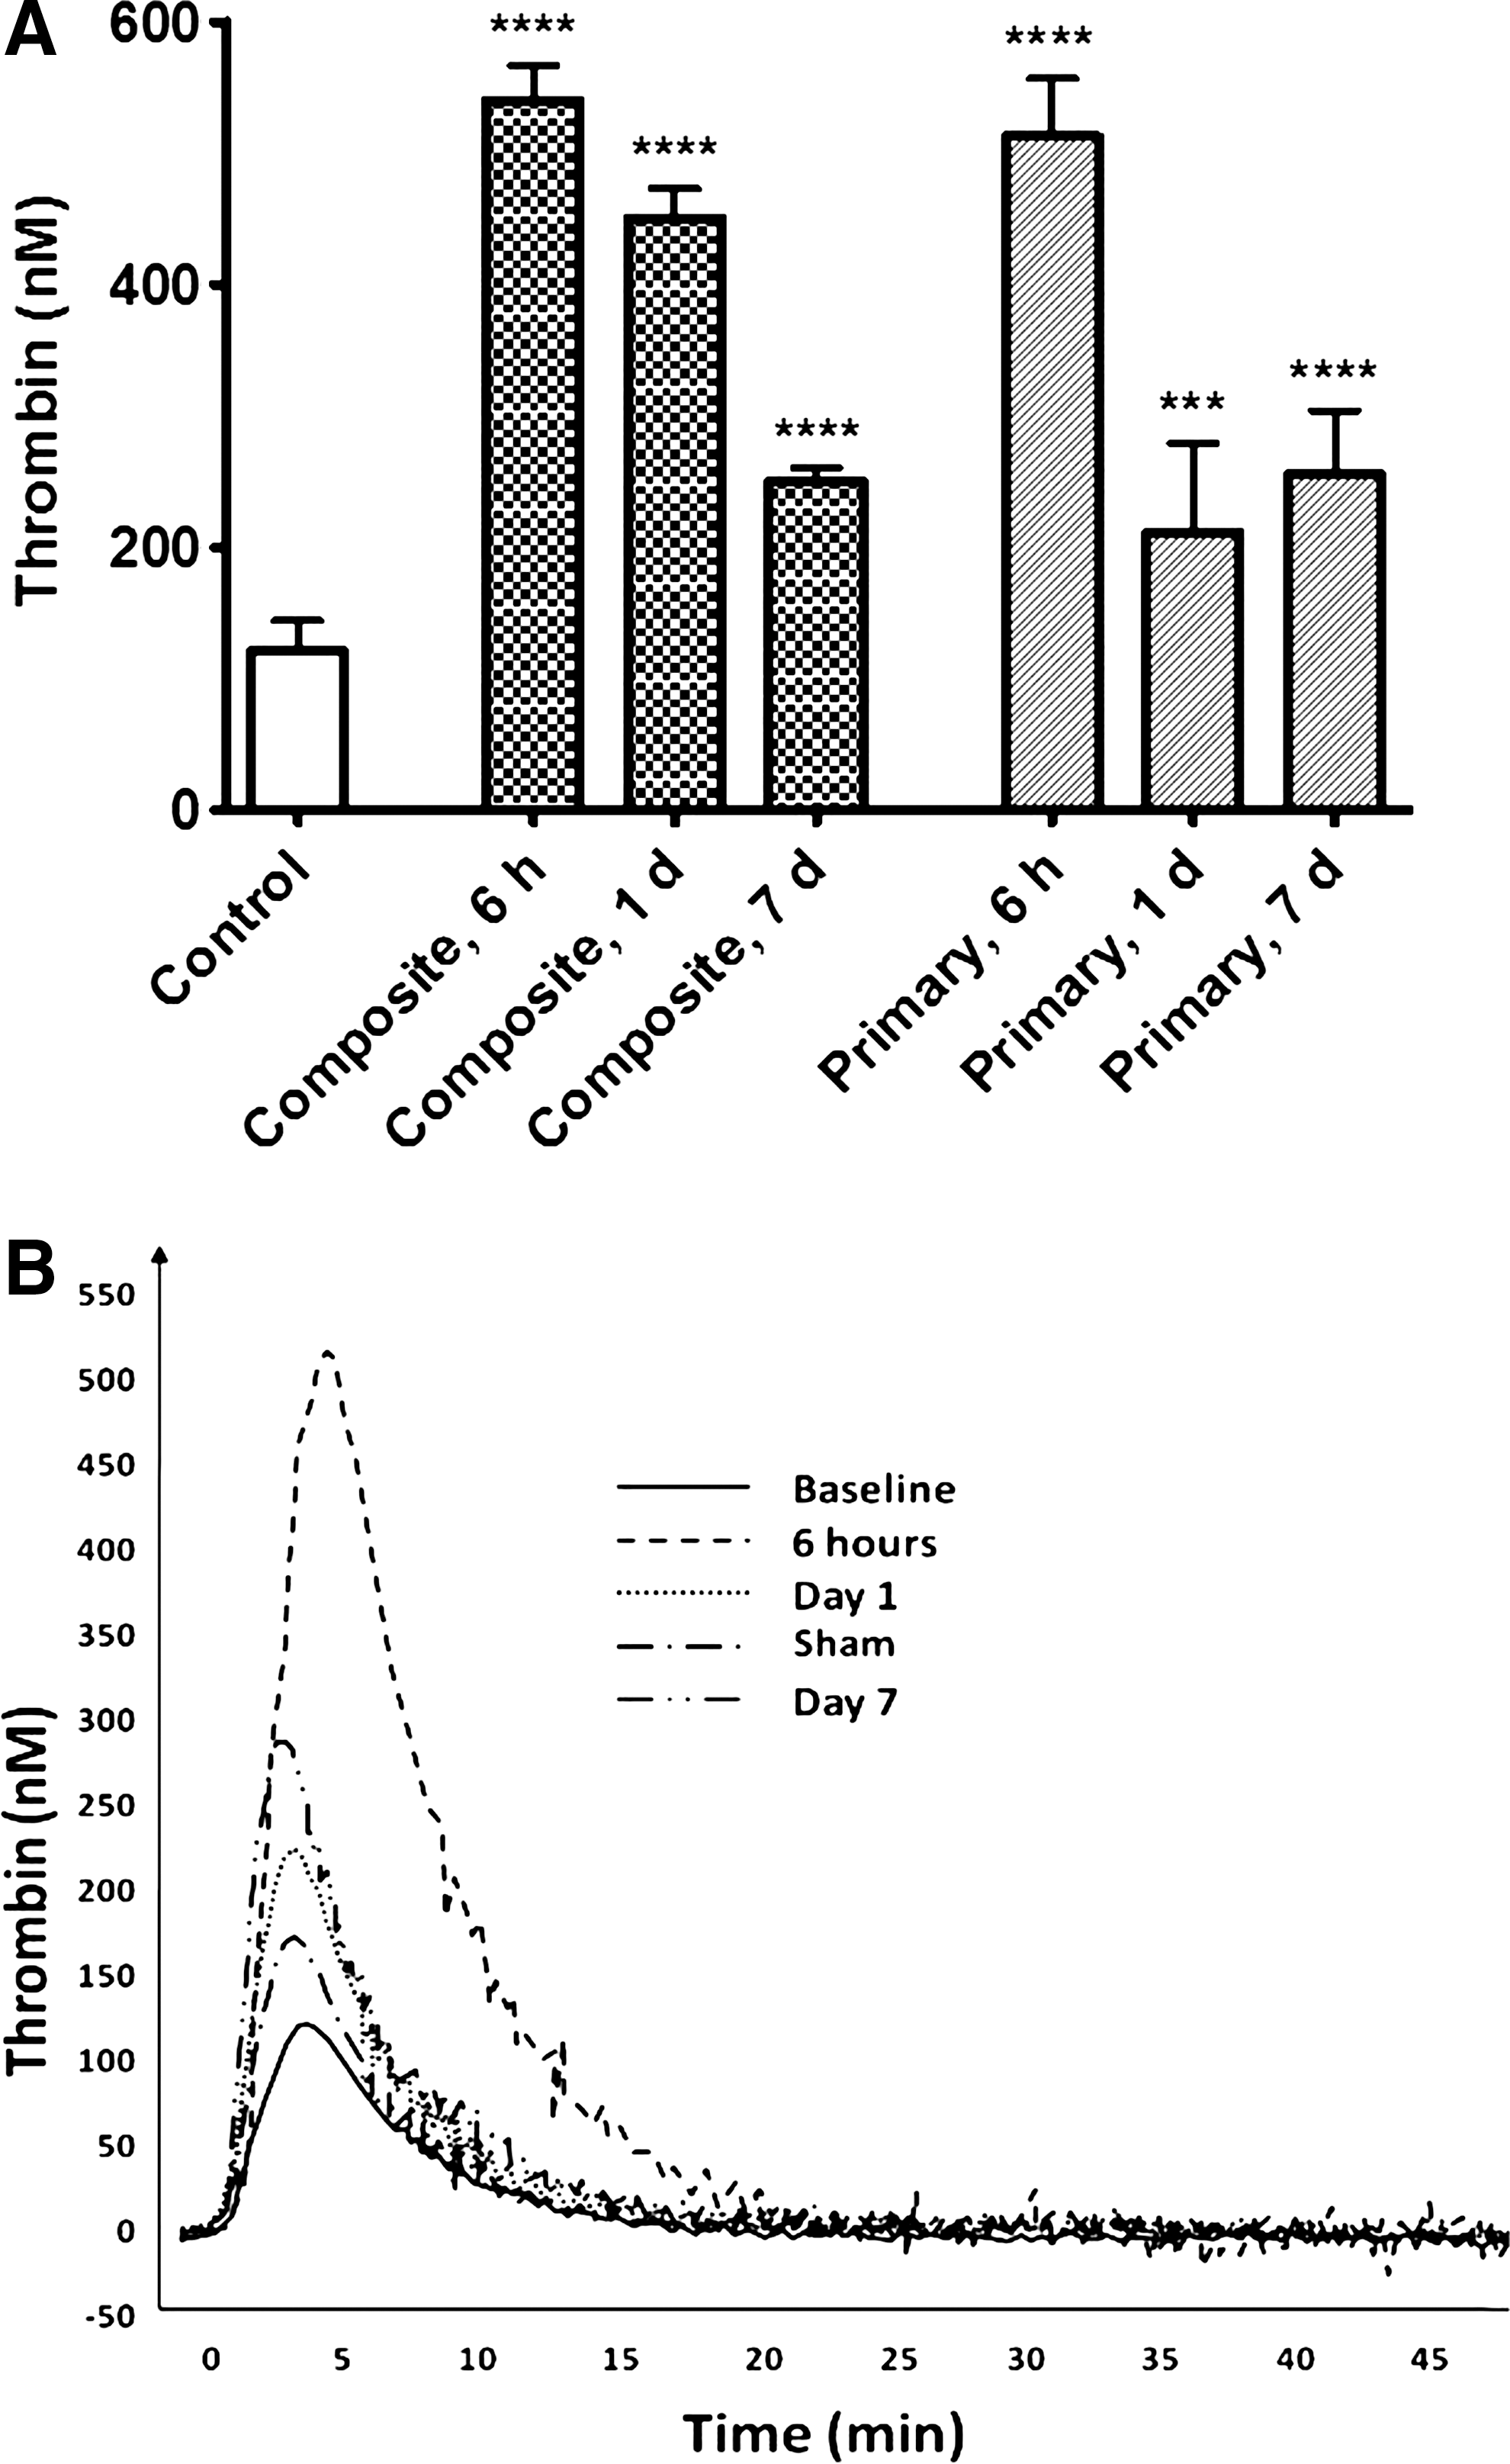
Plasma levels of thrombin after blast. Thrombin generation potential was assessed in rat plasma by calibrated automated thrombography (CAT) technology
Other TG indices did not differ significantly between two types of blast exposure. After either “composite” or primary blast loads, the t-peak times significantly increased compared with control values, whereas corresponding t-mean values decreased at both blast setups. The representative overlapped TG tracings after a primary blast wave load are illustrated in Figure 2 B.
The cumulative analysis of the data suggests strong time-dependent stimulation of overall TG potential by blast exposure.
Blast-induced expression induction of hemostasis-related proteins
Integrin α/β levels in serum were raised at both blast setups, indicating that overpressure wave load is triggering microcirculatory disorders whether it produces head hyperacceleration or not (Fig. 3A). After blast, the integrin α/β levels stayed elevated at both assayed time points: 1 day and 7 days. Soluble E-selectin displayed stable serum levels after “composite” blast, but increased significantly at 7 days after primary blast (Fig. 3 B). Soluble ICAM-1 levels were elevated in serum at both blast setups from 6 h to 7 days post-blast, most significantly (approximately fourfold of control) at 6 h after “composite” and 7 days after primary blast (Fig. 3 C). MMP-2, MMP-8, and MMP-13 displayed similar post-blast responses: slight elevation of relative serum concentrations after “composite” blast and significant increase (∼2-4-fold) after primary blast (Fig. 3 D–F).

Serum levels of hemostasis-related proteins after blast. Concentrations of integrin α/β
Discussion
Our previous studies 18,20 suggested that blast wave composition should be taken into account in the explosive blast modeling with compressed gas-driven shock tubes. Here we explored the impact on hemostasis of two different types of blast: 1) moderate composite (head on-axis) blast with strong head acceleration, and 2) moderate primary off-axis blast load on the frontal part of rat skull without head acceleration. There have been multiple studies 20 –23 showing that angular and linear head accelerations (“bobblehead effect”) have much more severe impact than primary blast wave passing through the brain tissue. Moreover, some studies suggest that angular accelerations generate more powerful pressures in the brain than do linear accelerations. 24,25 Also, because of the presence of compressed air jet in the “composite” blast wave, the target experienced much higher OP impact resulting in intracranial hematomas (the typical post-blast gross pathology represented in Fig. 1 C).
In mammals, hemostasis is achieved through primary platelet activation-aggregation and secondary coagulation cascade. TBI induces loss of equilibrium in tightly regulated hemostatic systems, which can lead to either hypercoagulable states with microthrombosis and ischemia, or hypocoagulable states with possible progression of hemorrhagic legions. 26 In our studies, only the animal's head was exposed to blast waves, because of a rigid protective shield covering the rest of the body. Nevertheless, hemostasis-related indices were strongly affected in the peripheral blood. TG, the key process in the secondary hemostasis, was strongly affected by blast exposure. Usually thrombin levels are difficult to measure, and TG is commonly assessed indirectly through either enzyme-inhibitor complexes or prothrombin cleavage fragments. In our studies, we employed a novel method, CAT, which has been used recently for analysis of hemostasis in stroke patients. 27 As the data presented in Table 1 and further illustrated by Figure 2 show, all indices of TG were remarkably affected in all blast-exposed rats compared with control animals. An early more than fivefold spike of TG gradually decreased over 7 days post-blast, but still significantly exceeded the control values, suggesting it as a potential candidate for a clinical biomarker.
Following the blast, we observed coincident changes in the other important coagulation and inflammation factors in the hemostasis cascade, which exhibited trends in agreement with TG upregulation. However, contrary to the initial expectations, serum levels of the biomarkers studied after “composite” blast with strong head acceleration did not in general exceed corresponding levels after primary blast. In this respect, coagulation/inflammation biomarker data oppose our blast-induced gross pathology findings (Fig. 1A–C), and the existing hypothesis that head acceleration-deceleration resulting from blast forces exerted on the skull (“bobblehead effect”) would be the prevailing cause of persistent brain injury. 23 As shown in Figure 3, serum integrin α/β concentrations were raised after either primary or composite blast exposures and remained significantly elevated up to 7 days post-blast. It is known that the integrins, a large family of cell surface receptors, play pivotal roles in platelet adhesion and aggregation, white cell/endothelium interactions, and platelet-mediated thrombin generation. 28 Our findings are in line with the available data, which indicate that vascular injury is a stimulus for expression of α/β integrins by vascular cells. 29 Concomitant rise of thrombin and integrin α/β reflects important interplay between thrombin and β3-integrins in hemostasis. Thrombin, by binding to G protein coupled, protease-activated receptors, is a potent activator of integrins. Conversely, outside-in signaling through integrins amplifies events initiated by thrombin, and is necessary for full platelet spreading, platelet aggregation, and the formation of a stable platelet thrombus. 30
As was shown in animal models of TBI, an influx of peripheral blood cells through disrupted blood-brain barrier (BBB) begins within hours after injury. 31 Multiple TBI-related animal studies 32,33 and clinical data 34,35 in agreement with our findings (Fig. 3 B, C) also demonstrate significant elevation in serum of inflammatory cell adhesion molecules, such as sICAM-1 and sE-selectin, which bind to circulating leukocytes and facilitate their migration into the injured brain regions. Endothelial pro-inflammatory processes are potently induced by thrombin. 36 –38 Adverse effects of inflammatory response to injury are reflected by highly significant relationship between serum sICAM-1 and poor neurological outcome. 35,39
Another group of molecules deeply involved in the neuroinflammation processes, MMPs, are known to be rapidly upregulated in patients with TBI, 40 and contribute to BBB breakdown 41 by degrading tight-junction proteins. 42 The consequent increase in blood vessel permeability 43,44 facilitates the development of edema. Our observations that MMP-2, MMP-8, and MMP-13 increase following primary blast wave exposure (Fig. 3 D–F) support the current vision of the diverse mechanisms of MMPs' involvement in brain injury either directly through degradation of brain matrix-substrates or indirectly through interaction with other bioactive molecules, 45 including thrombin 46,47 and integrin. 48 At this point, we do not have sufficient explanation as to why MMPs' levels after primary blast significantly exceed their levels after “composite” blast with strong head acceleration. If confirmed by independent studies, this effect may have a special advantage for the detection of mild blast-induced vascular abnormalities in the absence of the “boblehead effect” accompanied by severe hematomas.
Only recently has the development of compressed gas-driven blast wave generators with controlled OP enabled quantitative assessment of closed head blast TBI in vivo. 18,23,49,50 Analysis of the details of blast wave interaction with the target in the animal models have set it apart both from the civilian accidental TBI cases and from the penetrating brain injuries. 20 Notably, blast-induced closed head injuries are rarely as gruesome as their open counterparts, even though they can be just as damaging. Because these injuries neither puncture the dura mater nor necessarily breach the skull or scalp, they tend to be very hard to detect in the field or even in the hospital, as conventional imaging techniques such as MRI, functional MRI (fMRI), and CT can only detect gross internal deformities. Especially difficult is the objective assessment of mild blast trauma severity when the apparent trauma signs are benign or hidden. 1,3 As discussed previously, 51,52 vasospasm and rapidly developing diffuse cerebral edema leading to intracranial hypertension have been identified among the unique hallmarks of blast-induced closed head injuries encountered in military and civilian settings, which underlines the need for adequate diagnostic tools for hemodynamic and hemostatic abnormalities. Because thrombin, a central molecule in coagulation, is also involved in inflammation, 53 it positions TG among potential biomarkers for predicting neurological outcome after blast-induced TBI. Further human studies would be required to evaluate its clinical applications. Assessing TG potential, in combination with a carefully selected panel of blood biomarkers related to the cerebral hemostasis disruption, may be an attractive and reliable diagnostic tool for mild blast-related injury triage.
Footnotes
Acknowledgments
The authors thank Danny Johnson for his expert technical assistance. This work was supported by grants W81XWH-8-1-0376 and W81XWH-07-01-0701 from the Department of Defense.
Author Disclosure Statement
No competing financial interests exist.