




Abstract
Mild traumatic brain injury (mTBI) may cause diffuse damage to the brain, especially to the frontal areas, that may lead to persistent symptoms. We studied participants with past mTBI by means of navigated transcranial magnetic stimulation (nTMS) combined with electroencephalography (EEG). Eleven symptomatic and 8 recovered participants with a history of single mTBI and 9 healthy controls participated. Average time from injury to testing was 5 years. The participants did not have abnormalities or signs of injury on brain magnetic resonance imaging, and they did not use any centrally acting medication. Left primary motor cortex (M1) and dorsolateral prefrontal cortex (DLPFC) were stimulated with nTMS and evoked potentials measured from the corresponding areas of both hemispheres. Delayed ipsilateral P30 and contralateral N45 peak latencies to left DLPFC nTMS were found in the symptomatic group, along with higher DLPFC N100 amplitudes compared with the control or recovered group. The recovered group had shorter P200 latencies in left DLPFC nTMS compared with the other groups. Both mTBI groups had higher motor thresholds compared with the control group. In left M1 nTMS, the mTBI groups showed less P30 amplitude increase, and the symptomatic group showed longer P60 interhemispheric latency difference with higher stimulation intensities. The results suggest altered brain reactivity and connectivity in mTBI. Some of the observed differences may be related to compensatory mechanisms of recovery. nTMS-EEG is a potentially useful tool for studying the effects of mTBI.
Introduction
In transcranial magnetic stimulation (TMS), a magnetic pulse is used to induce an electric field in the brain, 12 triggering action potentials predominantly in the cortex. 13 Navigated TMS (nTMS) allows precise stimulation of the cortex, based on individual anatomy. 14 nTMS resting motor threshold (rMT) is the minimum intensity needed to elicit a motor response under certain conditions (see definition in Methods). rMT is dependent on cortical excitability and conduction along the motor tracts. 12,15 Higher rMT has previously been associated with TBI of varying severity, 16 –18 possibly also correlating with recovery, at least in mild injuries. 17
nTMS-evoked electroencephalographic responses (nTMS-EEG) can be used to study cortical excitability and connectivity. In nTMS-EEG, certain individually highly reproducible deflections are found, including P30, N45, P60, N100, and P200. 19,20 Besides activation of the tissue immediately under the stimulation coil, TMS-evoked deflections also reflect the spread of activation to more distant brain areas. This, in turn, is affected by corticocortical, thalamocortical, and interhemispheric connections. 21 –24 Thus, nTMS-EEG is potentially sensitive to pathological changes in cortical excitability and connectivity.
Using TMS-EEG, cortical reactivity can be assessed based on the amplitudes of the evoked potentials. 20 Various conditions can alter cortical excitability, with effects on different parts of the TMS-evoked EEG waveform. A TMS-induced artifact can mask the early EEG deflections, 25 for which reason P30 has often been the earliest reliably measured peak. P30 seems to have a diffuse origin and is thought to be related to early spread of activation to more distant and contralateral areas, 21,25,26 In clinical experiments, preliminary evidence of altered P30 amplitudes has been found in Alzheimer's disease, with significantly decreased amplitudes at the 30–50 msec time range. 27
TMS-evoked N45 is generated by a dipole close to the stimulation site, when stimulating M1. 25,28 N45 possibly reflects local cortical oscillation phase-resetting. 25 Because of its localization and timing, N45 has been suggested to be related to structures generating the net motor output of M1. This is even more feasible considering the observations that N45 amplitudes are correlated with motor evoked potential amplitudes. 29 Ethanol reduces 30–270 msec global mean field amplitudes, especially evident at N45, reflecting decreased TMS-induced activity. 30,31 Slow repetitive TMS also reduces cortical excitability, which on TMS-EEG is reflected in reduced N45 amplitudes. 23 Paired pulse stimulation with a relatively facilitatory stimulation paradigm with 11–12 msec interstimulus intervals, however, also causes weaker N45 responses, compared with single pulse stimulation. 25,29
The N100 response is thought to reflect a TMS-evoked GABA-B mediated inhibitory response (for discussion, see 32,33 ). The N100-P200 deflection probably also contains contamination from auditory and tactile stimulation by the TMS coil. Converging evidence from several studies, however, shows that direct effects of TMS to the N100-P200 are substantial, probably more important than sensory stimulation. 19,25,26,33,34 The N100 is sensitive to certain clinical conditions, including ADHD 35 and mild cognitive impairment, 27 where reduced N100 amplitudes have been found.
The balance of cortical inhibitory and facilitatory circuits in paired-pulse TMS-EEG is also reflected in latencies. Facilitatory paired-pulse stimulation has been shown to elicit shorter P30 25,29 and N45, P60, and P200 latencies 29 compared with single pulse and inhibitory paired-pulse stimulation. Also, there is evidence that ca. 200 msec TMS-evoked event-related potential (ERP) latencies are longer during deeper sleep stages. 36 These studies seem to suggest an inverse relation between the mentioned peak latencies and excitability on M1. It is important to note, however, that all TMS-evoked deflections are probably affected by both excitatory and inhibitory circuits. 29
In the majority of TMS-EEG studies, stimulation has been targeted on M1, allowing also motor responses to be measured by electromyography (EMG). In TMS of DLPFC, the same major ERPs can be identified. Based on ERP amplitudes, however, DLPFC has lower excitability than M1 19,31 and a distinct global mean field amplitude waveform. 20 It is also plausible that clinical conditions such as mTBI may differentially affect responses to nTMS of motor and prefrontal areas.
In this study, we measured nTMS-EEG deflections in groups of fully recovered and persistently symptomatic participants with mTBI and compared them with healthy controls. None of the participants had any injury visible in conventional MRI. In accordance with previous DTI, functional MRI, and positron emission tomography studies, 5 –11 we expected to see mTBI related changes in nTMS-EEG responses of the frontal areas, especially with nTMS of the DLPFC. We also expected to find more pronounced changes in the symptomatic participants compared with those who had recovered.
Methods
Participants
In the mTBI groups, participants had sustained an injury primarily classified as mTBI according to the Glasgow coma scale (GCS, 13–15 points). Average time from injury was 5 years. The duration of post-traumatic amnesia (PTA) varied from none to 2.5 weeks, with five participants having more than 24 h, and therefore would not be classified as mild based on PTA 37 (Table 1).
The differences in age and sex distributions between the groups were statistically non-significant (t tests and Kruskal-Wallis test, respectively; p>0.05).
SD, standard deviation.
After the mTBI, all participants had a variety of typical consequences including fatigue, attention deficit, poor memory, and loss of initiation. The recovered participants were clinically asymptomatic at the time of testing. Recovery was secured either with a detailed interview with the relatives, neuropsychological examination, or both. Participants in the symptomatic group received a diagnosis of chronic consequences of mTBI (postconcussional syndrome) based on (1) American Congress of Rehabilitation Medicine diagnostic criteria for TBI, (2) careful evaluation (using also other than the participant's subjective report) of pre-injury health and function, (3) extensive neuropsychological examination, (4) structural brain MRI, (5) careful evaluation of the injury mechanism and the clinical stage and symptoms during the acute phase, and (6) exclusion of other likely explanations for the participant's symptoms. These were performed by a neurologist who was very experienced in TBI evaluation. Cases with any diagnostic uncertainty were excluded.
Three-dimensional T1 weighted MRIs of all participants, and also T2 and fluid attenuated inversion recovery of all mTBI participants were available. No abnormalities or signs of injury were found in any of the MRIs, as evaluated by a neuroradiologist. All mTBI participants were recruited through the Department of Neurology of the Turku University Hospital, from the outpatients with TBI who were treated or assessed during the previous decade. Healthy volunteers were recruited as controls. None used centrally acting medication.
The study was approved by the Ethical Committee of the Hospital District of Southwest Finland. All participants gave their written informed consent before participation.
Navigated TMS
Magstim 200 stimulator (The Magstim Company Ltd., Whitland, UK) with a 70 mm figure-of-eight coil (P/N9925) was used with eXimia NBS navigation system (Nexstim Ltd., Helsinki, Finland). rMT was determined as the minimum intensity evoking a ≥50 μV EMG response from the right abductor pollicis brevis muscle, at least 5 times out of 10 stimuli. 38 During the experiment, the participants were comfortably seated in a chair with head against the headrest, keeping their eyes open and fixated. Earplugs were used to minimize the auditory effect of the coil click.
Left DLPFC and left M1 were stimulated. For DLPFC, the coil was placed perpendicular to the middle frontal gyrus using the navigation system. For M1, the same positioning as for rMT determination was used. One hundred single pulses were delivered at 90%, 100%, and 110% of rMT to both stimulation sites, resulting in six stimulation runs, presented in randomized order. Interstimulus interval was 3.3 sec. During stimulation, the coil was fixed on a coil holder.
EEG acquisition
EEG was recorded with a 60 channel eXimia EEG system (Nexstim Ltd., Helsinki, Finland). Reference electrode was on the right mastoid process, and ground on the right zygomatic bone. During TMS pulses, the amplifier was gated by sample-and-hold circuit for 2 msec to remove most of the TMS-induced artifact. 39
EEG analysis
BrainVision Analyzer 2 (Brain Products GmbH, Gilching, Germany) was used. Epochs with artifacts from eye movements, muscle activity, or mechanical disturbances were removed from the raw data. A 45 Hz low-pass filter was applied. Data segments (−100 to +500 msec of the TMS pulse) were averaged. Baseline correction was applied based on −100 to −20 msec prestimulus interval. Electrodes were pooled to form four regions of interest (ROI; Fig. 1,2).
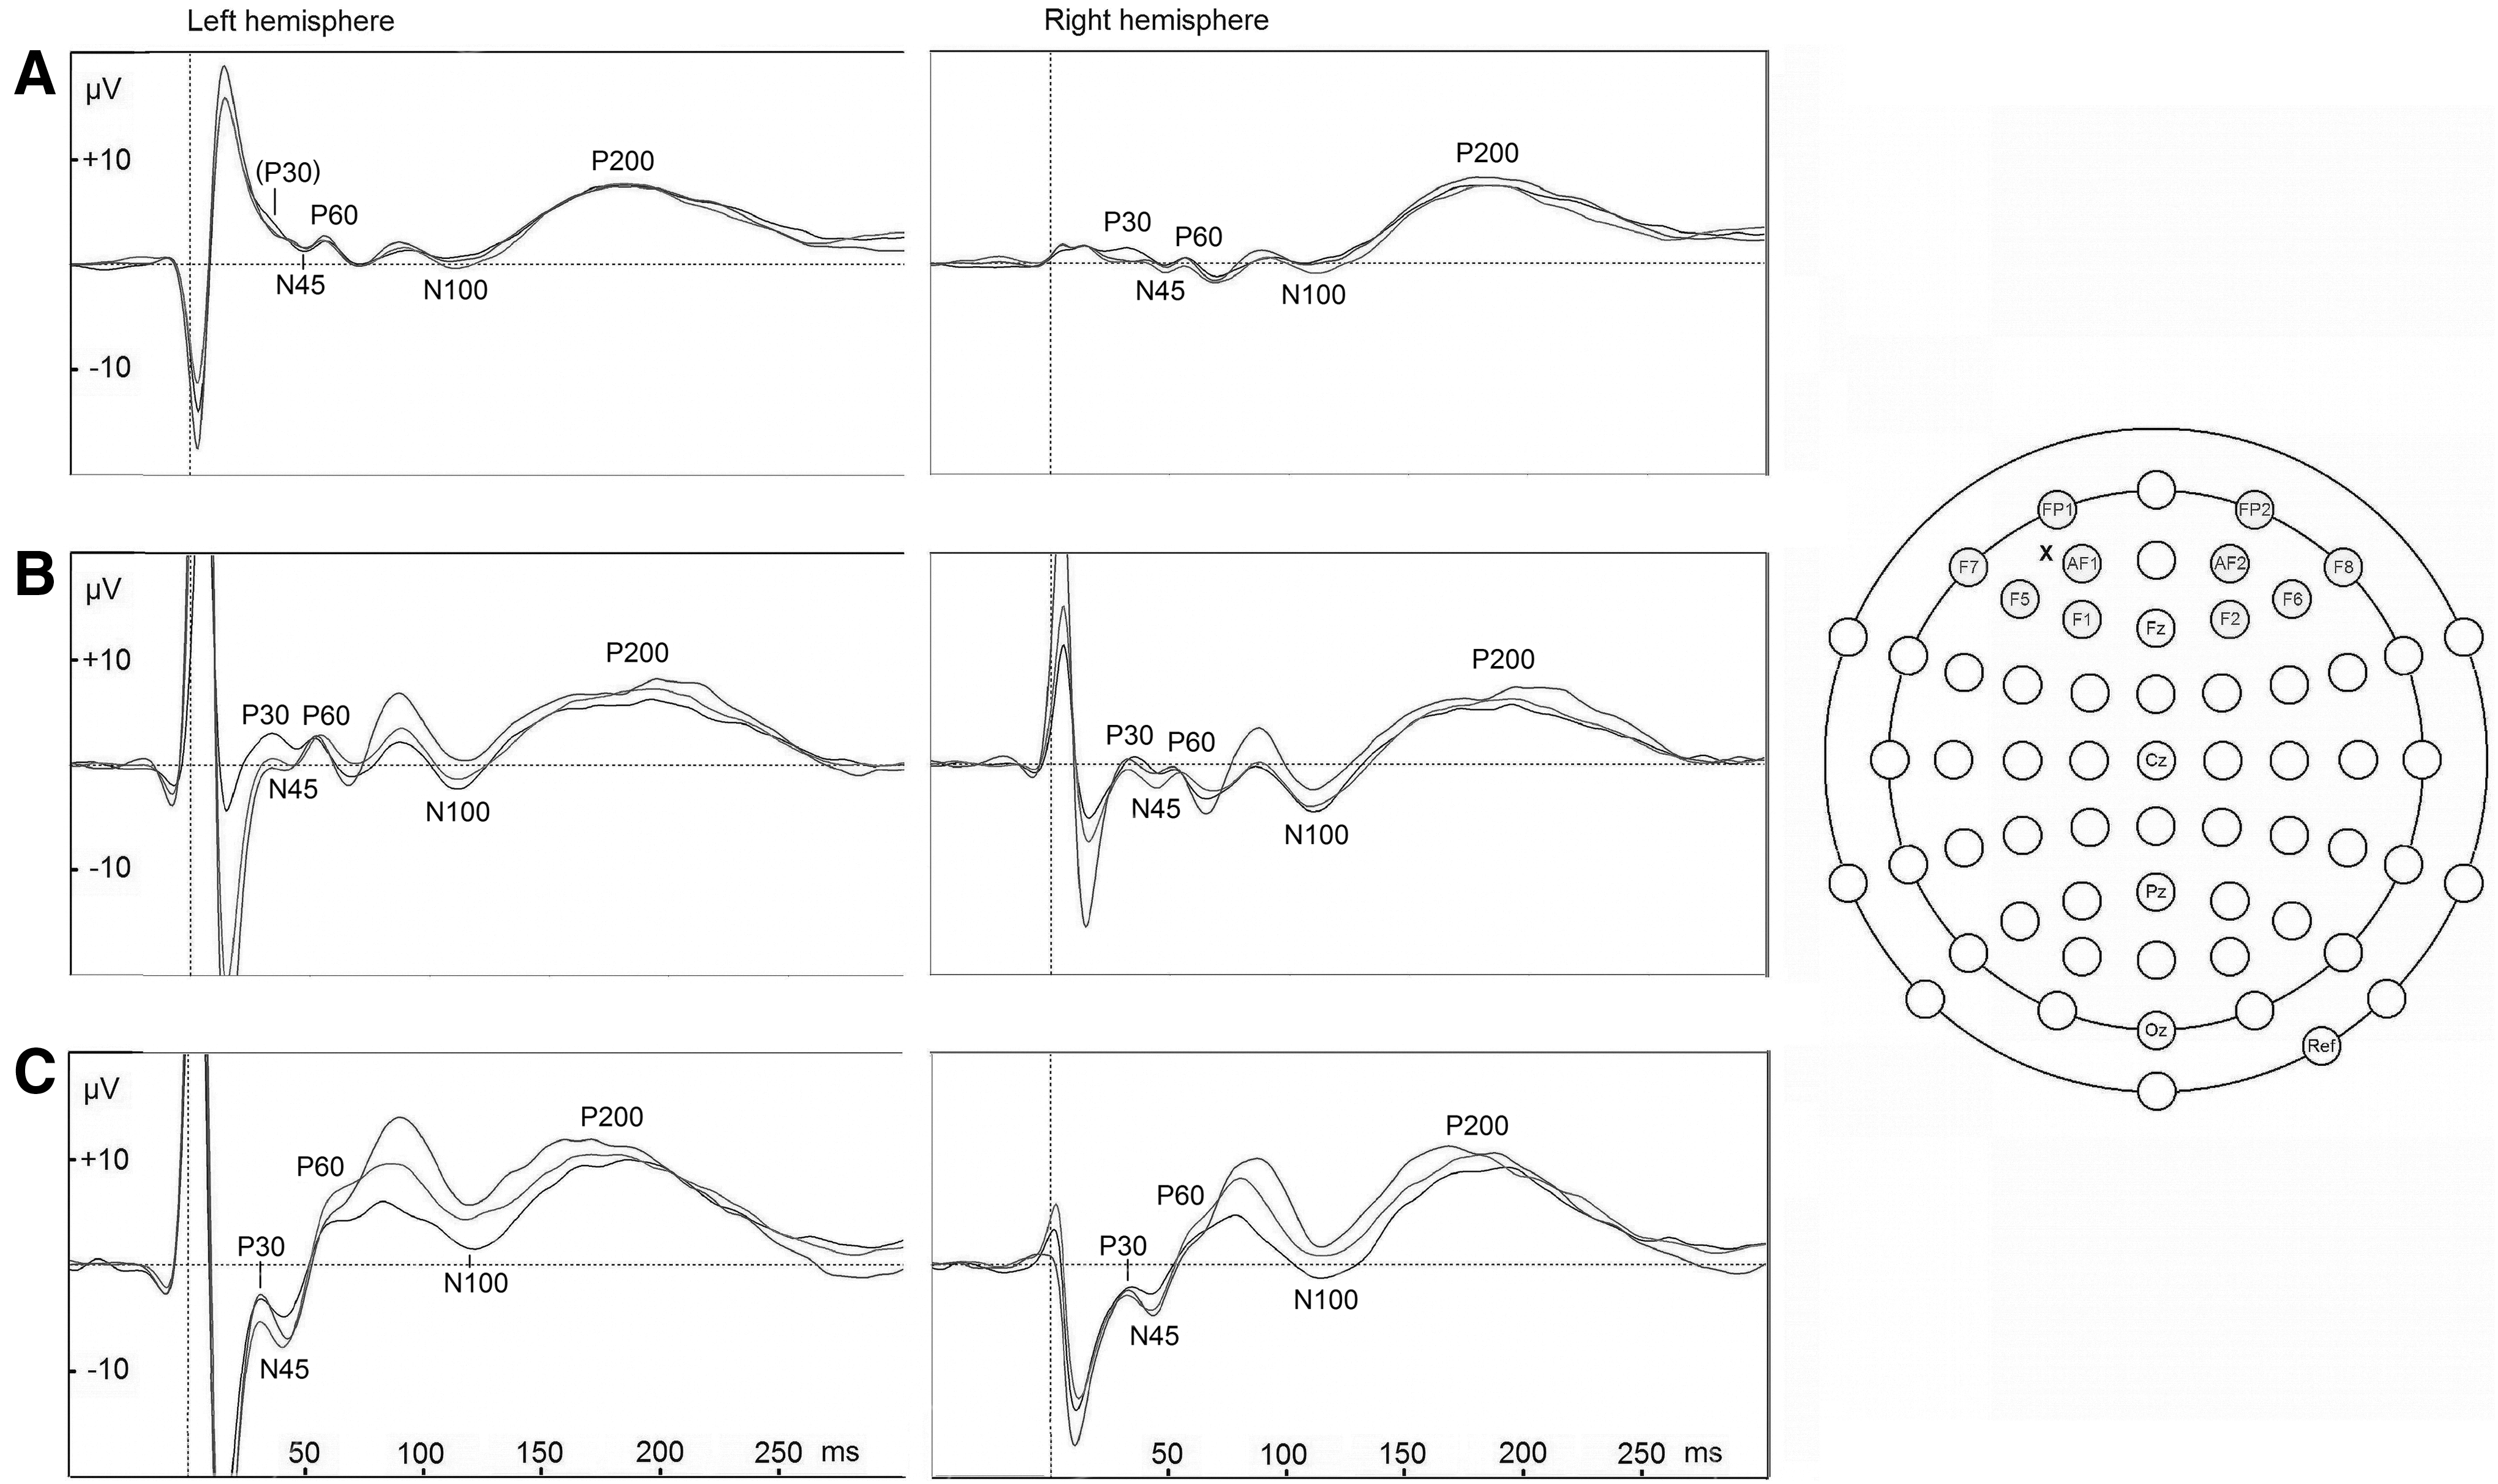
Dorsolateral prefrontal cortex stimulation evoked potentials. Results of the control (
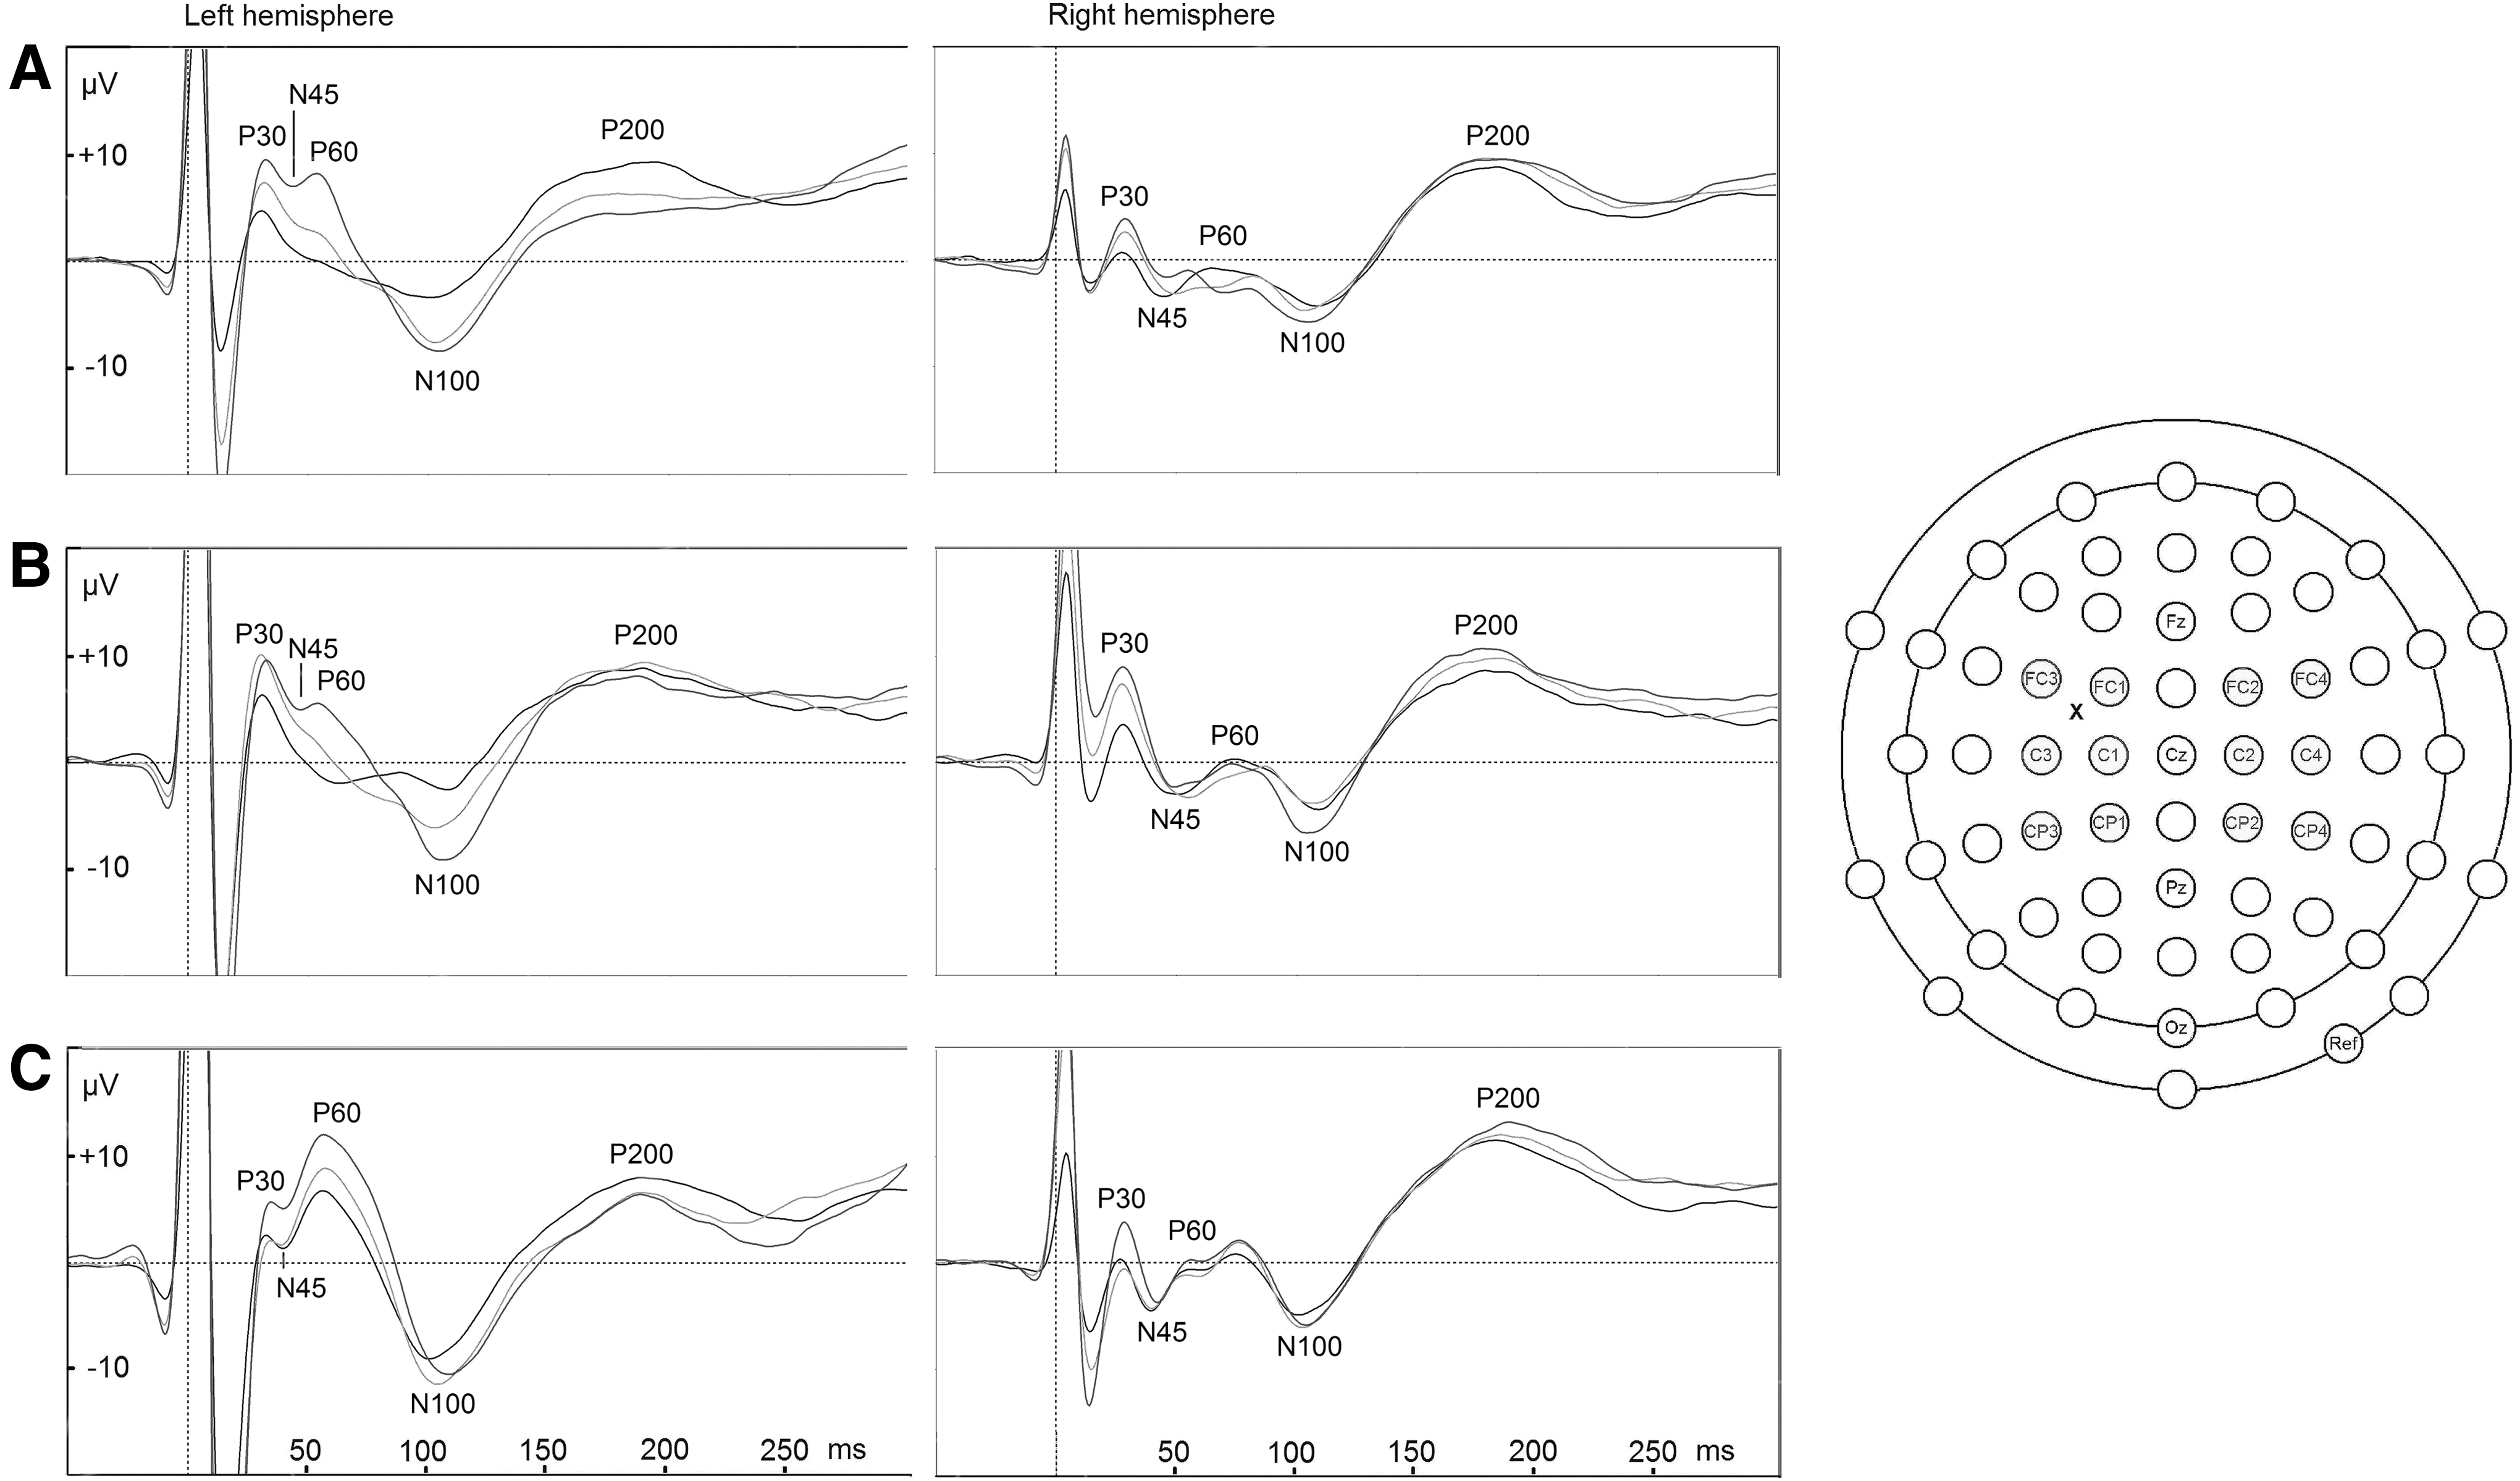
M1 stimulation evoked potentials. Results of the control (
Deflections were measured from the stimulated ROI and the homologous ROI in the contralateral hemisphere. Four peaks (local maxima; P30, N45, P60, N100, P200) were semi-automatically identified in all participants' data.
Statistical analysis
One-way analysis of variance and independent samples t-tests were used to compare rMTs. The EEG data were analyzed with repeated measures analysis of covariances (ANCOVAs) with stimulation intensity (90/100/110% rMT)×hemisphere (left/right) design, with participant group (symptomatic/recovered/control) as a between subjects factor, and rMT as a covariate. The analysis was focused on effects involving the factor participant group. Separate ANCOVAs were computed for amplitude and latency data of each peak and stimulation site. Partial η2 estimates of effect size (η2 p) were calculated. For post-hoc comparisons, t tests were used. Greenhouse-Geisser and Bonferroni corrections were applied when appropriate.
Stepwise linear discriminant analysis (LDA) with Wilks' Λ method and criteria F=2.5 to enter or remove a variable were used to find a subset of variables that best distinguished between the groups. In LDA the variables were included where statistically significant differences were found between the participant groups in the main analysis. All analyses were performed with IBM SPSS 19 (IBM, Armonk, NY).
Results
Motor thresholds
rMTs differed among the groups (F2,25=4.89, p=0.016, η2 p=.28). The control groups mean rMT±standard deviation (SD) was 43.0±0.8% of maximum stimulator output, which was lower than in the symptomatic (52.5±3.1%, p=0.036) or the recovered (54.6±3.4%, p=0.033) group. The symptomatic and recovered groups' difference was non-significant. These results have been elaborated elsewhere. 40
Evoked potentials: DLPFC (Fig. 1)
For P30 latencies, an intensity×hemisphere×participant group interaction was found (F4,48=2.65, p=0.044, η2 p=.18). Follow-up ANCOVAs separately for each hemisphere showed an intensity×participant group interaction only on the ipsilateral (left) hemisphere (F4,48=2.72, p=0.0040, η2 p=.19), where on further examination, a statistically significant difference between the groups was found only at 90% stimulation intensity (F2,24=4.55, p=0.021, η2 p=.28), because of longer ipsilateral P30 latencies in the symptomatic group (39±11 msec), compared with the control group (26±11 msec, p=0.028). No significant difference between the groups was found at 100% or 110% stimulation intensities.
For N45 latencies, a hemisphere×participant group interaction was found (F2,24=3.68, p=0.040, η2 p=.24). On follow-up ANCOVAs separately for each hemisphere, the groups differed statistically significantly only on the contralateral (right) hemisphere latencies (F2,24=4.06, p=0.030, η2 p=.25), because of longer latencies in the symptomatic group (54±9 msec), compared with the recovered group (44±8 msec; t=2.66, df=17, p=0.05). Control groups' latencies were intermediate (49±6 msec), not differing statistically significantly from the other groups. Ipsilateral hemisphere latencies (control: 50±7 msec; symptomatic: 51±9 msec; recovered: 45±9 msec) did not differ statistically significantly between the groups.
No statistically significant differences were found for P60.
For N100 amplitudes, a main effect of the participant group was found (F2,24=3.57, p=0.044, η2 p=.23), because of higher N100 amplitudes in the symptomatic group (−4.6±4.4 μV), compared with the recovered group (1.1±4.2 μV; t=−2.85, df=17, p=0.033). The control group's amplitudes (−2.7±4.6 μV) were intermediate, not differing statistically significantly from the other groups.
For P200 latencies, a main effect of the participant group was also found (F2,24=3.59, p=0.043, η2 p=.23). This is because of shorter latencies in the recovered group (167±14 msec) compared with either the control group (183±11 msec, p=0.028, uncorrected), or the symptomatic group (183±18 msec, p=0.027, uncorrected), although the differences were not statistically significant after significance level correction.
Evoked potentials: M1 (Fig. 2)
For P30 amplitudes, an intensity×participant group interaction was found (F4,48=2.60, p=0.048, η2 p=.18). Post-hoc tests showed a progressive P30 amplitude increase with increasing stimulation intensity in the control group (90/100%: t=3.33, df=8, p=0.060; 100/110%: t=3.80, df=8, p=0.030), while in the recovered (90/100%: t=2.82, df=7, p=.156; 100/110%: t=0.24, df=7, p=1.00) and symptomatic (90/100%: t=−0.08, df=10, p=1.00; 100/110%: t=2.51, df=10, p=0.186) group, the relation of stimulation intensity and P30 amplitude was weaker, with no statistically significant effects being found in these groups (Table 2).
Mean±standard deviation.
rMT, resting motor threshold.
For N45 amplitudes, an intensity×participant group interaction was also found (F4,48=3.13, p=0.023, η2 p=.21). In post-hoc comparisons, however, no effects remained statistically significant. Closest to significance came the control group's decrease in N45 amplitude while stimulation intensity increased from 100% to 110% (t=2.97, df=8, p=0.108). No similar relation between stimulation intensity and N45 amplitude was found in the other groups, probably explaining the interaction.
For P60 latencies, an intensity×hemisphere×group interaction was found (F4,48=3.00, p=0.027, η2 p=.20). Post-hoc tests showed that in the symptomatic group, the interhemispheric latency difference increased with increasing stimulation intensity (90% non-significant, 100% p=0.072, 110% p=0.009; Table 3). No statistically significant interhemispheric latency differences were found in the other groups after significance level correction. On P60 amplitudes, a hemisphere×group interaction was found (F2,24=4.00, p=0.032, η2 p=.25). All groups had higher amplitudes on the ipsilateral side. Descriptive statistics and post-hoc tests suggest that the amplitude difference was smaller in the symptomatic group compared with recovered, although the difference was non-significant after significance level correction (p=0.054).
Mean±standard deviation.
rMT, resting motor threshold.
Predicting group membership with LDA
The candidate variables for LDA, selected on the basis of the group effects found in the previous analysis and fulfillment of normal distribution assumption (Shapiro-Wilk-test p>0.05), were rMT, DLPFC N100 amplitude, DLPFC P200 latency, M1 P30 amplitude difference from 90% to 110% stimulation intensity, M1 N45 amplitude difference from 100% to 110% stimulation intensity, M1 P60 interhemispheric latency difference change from 90% to 110% stimulation intensity, and M1 P60 interhemispheric amplitude difference. The LDA criteria used resulted in inclusion of two variables (rMT and M1 P60 interhemispheric latency difference change from 90% to 110% stimulation intensity). In leave-one-out cross-validation, this model classified correctly 55% of symptomatic, 75% of recovered, and 56% of control group participants, with total cross-validated accuracy of 61% (Fig. 3).
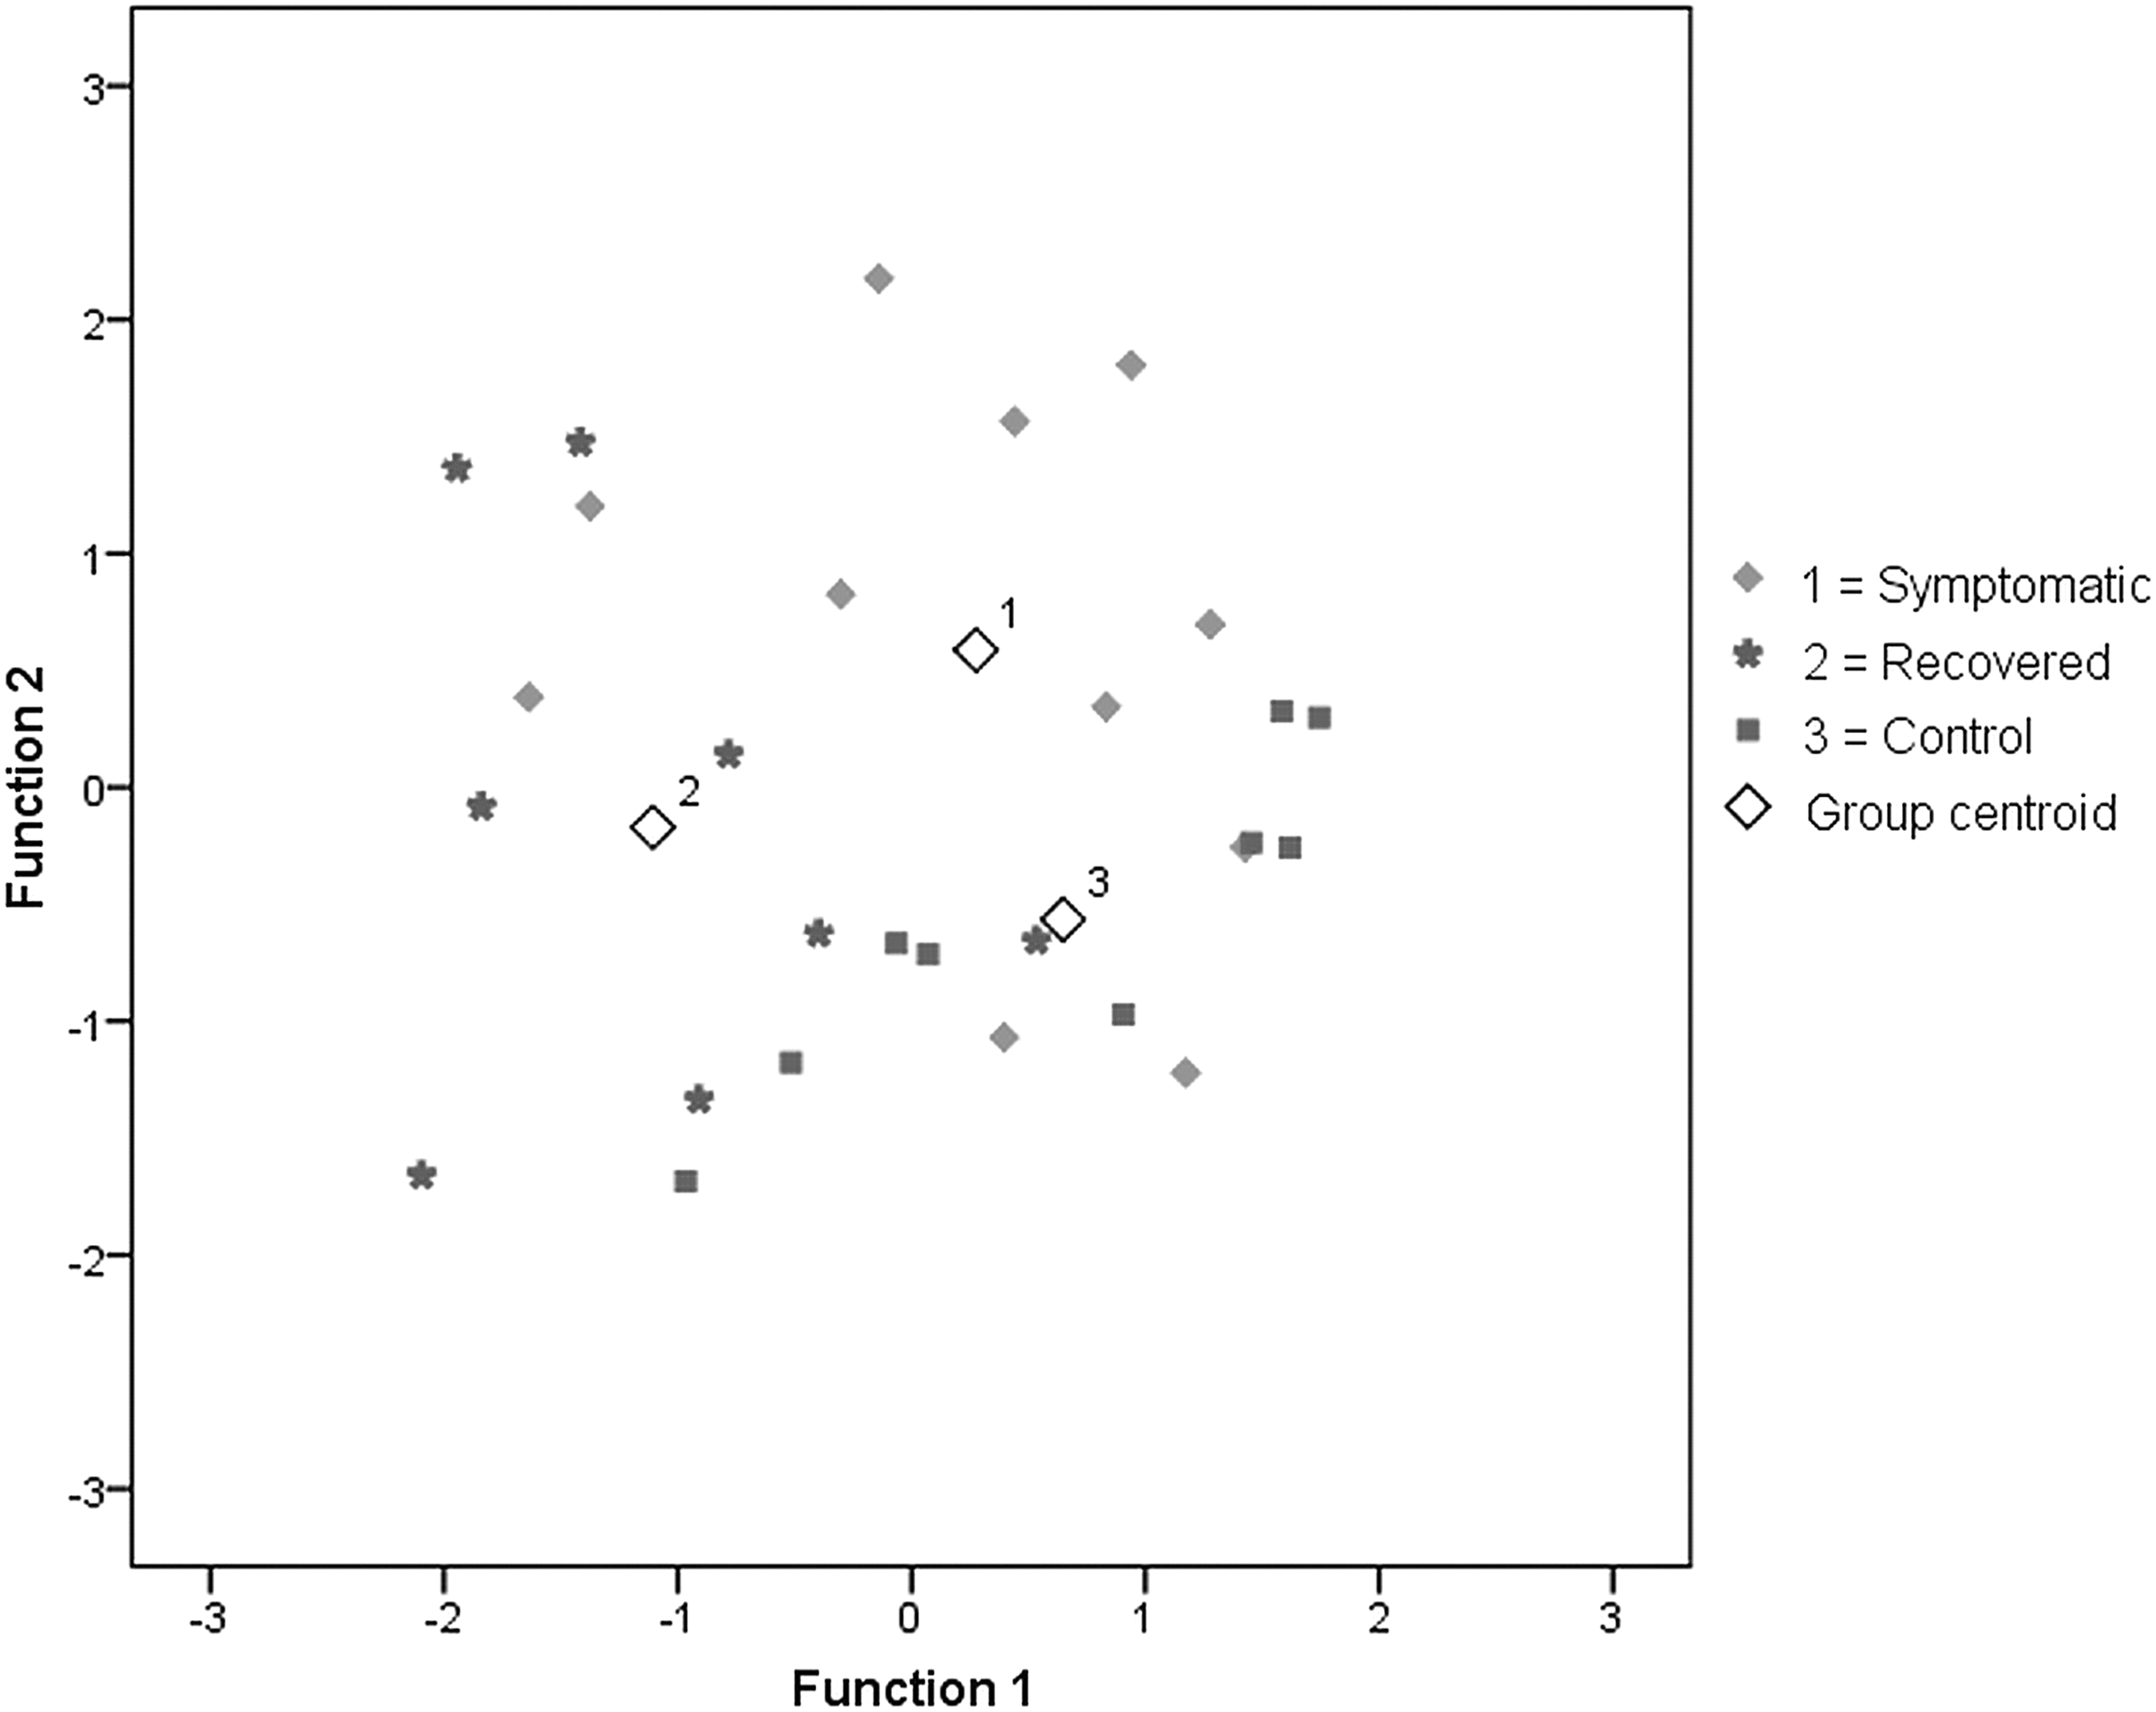
Grouping of participants based on linear discriminant analysis. Standardized coefficients of each variable for functions 1 and 2 respectively are: resting motor threshold (−.575, .820) and M1 P60 interhemispheric latency difference change from 90% to 110% stimulation intensity (.786, .620).
Influence of participants with PTA≥24 h
All analyses were repeated without the participants with PTA≥24 h. The results are not reported in detail, but a summary of the main differences is presented in Table 4. The main results were similar to the analysis of the whole sample, but all statistically significant effects of the main analysis did not reach significance in the reduced sample. In addition, correlations of PTA with the variables included in LDA were tested, and no statistically significant correlations were found.
DLPFC, dorsolateral prefrontal cortex.
Discussion
Despite normal conventional MRIs and GCS 13–15 on admission, mTBI groups had significant differences in nTMS-EEG responses compared with healthy volunteers and with each other. Notable differences were also found between the groups of functionally recovered and persistently symptomatic mTBI participants. Our main finding is that by means of nTMS-EEG, functional differences can be found between mTBI participants and healthy controls even years after the initial insult. Possible interpretations for the results will be discussed, but these must be considered preliminary, because more studies on the effects of different physiological conditions on nTMS-EEG are needed.
In nTMS of the DLPFC, the symptomatic group had delayed ipsilateral P30 (compared with controls) and contralateral N45 (compared with recovered participants) deflections. This could suggest both impaired functional connectivity and a balance of inhibitory and facilitatory circuits shifted toward lesser excitability. While this hypothesis is based on studies in M1 nTMS (see Introduction), similar relation with peak latency and balance of inhibition-facilitation could be expected on DLPFC. Our findings would also be compatible with previous TMS studies in mTBI, where acutely decreased M1 excitability 17,18 and a persistently prolonged cortical silent period have been found, 41 suggesting lowered excitability and a stronger inhibitory response.
During M1 nTMS, increasing stimulation intensity increased P30 amplitudes in the control group, while a comparable effect could not be detected in the mTBI groups. A similar pattern, with less statistical significance, was observed in the M1 N45. With higher intensity, more synchronous brain activity 42 could thus be induced in the control group in the time frame of P30, but this increase was less significant in the mTBI groups. This could also indicate loss of connectivity between neurons and less effective recruitment of the neural network generating the 30, or decreased excitability. 20
On M1 P60, the symptomatic group displayed increasing interhemispheric latency difference (contralateral latencies were generally longer) with increasing stimulation intensity, which the other groups did not show. The symptomatic group also seemed to have smaller interhemispheric P60 amplitude difference (ipsilateral amplitudes were generally higher in all groups), but post-hoc tests for this were non-significant. These findings might be related to altered interhemispheric connectivity in the symptomatic group. Reduced resting state interhemispheric DLPFC connectivity 43 and metabolic markers of neuronal injury in the corpus callosum 44 have been shown in sub-acute mTBI.
The recovered group had relatively short P200 (compared with both other groups) and contralateral DLPFC N45 (compared with symptomatic participants) latencies. Based on observations of facilitatory M1 stimulation generating shorter N45 and P200 latencies, 29 this might reflect a balance of inhibitory/facilitatory mechanisms shifted toward increased excitability in the recovered group. Similar data from nTMS of the DLPFC are, however, not available.
The mTBI groups showed contrasting results on DLPFC N100 amplitudes, with higher amplitudes in the symptomatic and lower in the recovered group. Although neither mTBI group was significantly different from the controls, the difference between these two groups seems to suggest a weaker inhibitory response 32,33 in the recovered participants, compared with the relatively stronger inhibitory response in the symptomatic participants. This would be in accord with the suggested explanations for the P30, N45, and P200 latency differences.
On the other hand, elevated rMTs were found in both mTBI groups. rMT is a measure of cortical excitability and conduction along the corticospinal tract. 12 Elevated rMT thus fits with the symptomatic groups ERP data, but would seem to contradict with our interpretation of the recovered group's data. Because TMS-evoked activity related to pyramidal neuron discharge and generation of a descending corticospinal volley occurs in approximately 5 msec, 45 but the EEG phenomena considered here are later (45-200 ms), the increased rMT and decreased DLPFC ERP latencies, interpreted as increased excitability, are not necessarily incompatible. The timing of the neural processes concerned is different. It should also be noted that the increased rMT and the decreased 45–200 msec latencies were observed when stimulating different brain areas (M1 and DLPFC).
A methodological problem in this study is related to determining the stimulation intensities based on rMTs. Because the mTBI groups had higher rMTs than the controls, their stimulation intensities were also higher. This could confound especially the amplitude data in this study. Correlations between stimulation intensity and TMS-evoked deflections' amplitudes have been reported. 20,25,31 We did not find, however, the rMT to be correlated with any of the deflections where significant group effects were found. We also used ANCOVA methodology to minimize the confounding effect of rMT. Another factor making it unlikely that rMT as a confounding variable would explain a large part of our results is that the stimulation intensities in the symptomatic and recovered groups did not differ significantly, but their EEG responses were still substantially different.
Another problem concerning the interpretation of the results is the laterality of some of the effects. Although TBI is a highly individual injury, there are well-known selective vulnerabilities based on brain anatomy. 46 Common patterns of vulnerability are also seen in brain connectivity in studies with DTI. 47 This could be the explanation for the lateralized effects found, but given only unilateral stimulation in this study, lateralized effects arising from altered interhemispheric connectivity cannot be with certainty differentiated from effects arising from injury primarily to either hemisphere. This could be overcome by stimulating both hemispheres. Conclusions are also limited by the small sample size. A stronger causal link between mTBI and our findings could be established by a prospective follow-up study.
We hypothesized that nTMS-evoked EEG responses might be sensitive to diffuse structural damage, which has previously been investigated in mTBI using DTI. 5 –9 This study shows that mTBI is associated with measurable, long-lasting functional changes in the brain that correlate to some extent with clinical recovery. We also show that nTMS-EEG can be used to classify the participants based on their injuries fairly accurately, although a new sample would be needed to test the validity of this method. Differences found between the recovered and symptomatic mTBI participants could reflect either a more serious initial insult in the symptomatic group (despite no difference in GCS or PTA), or different degrees of recovery by functional reorganization based on brain plasticity in the two groups. The view that recovery might be at least partly achieved by such compensatory mechanisms, rather than full return to baseline condition 48 is supported by several reports suggesting cumulative effects of repeated concussions. 49 –52
Footnotes
Acknowledgments
Pantelis Lioumis was supported by Helsinki University Central Hospital (EVO-funding) and the SalWe Research Program for Mind and Body (Tekes - the Finnish Funding Agency for Technology and Innovation grant 1104/10).
Heikki Hämäläinen was supported by the University of Turku (professorship) and Tekes - the Finnish Funding Agency for Technology and Innovation.
Author Disclosure Statement
No competing financial interests exist.