
Abstract
The goal of this project was to determine whether biochemical markers of brain damage can be used to diagnose and assess the severity of injury in a rat model of penetrating ballistic-like brain injury (PBBI). To determine the relationship between injury magnitude and biomarker levels, rats underwent three discrete PBBI severity levels defined by the magnitude of the ballistic component of the injury, calibrated to equal 5%, 10%, or 12.5% of total rat brain volume. Cortex, cerebrospinal fluid (CSF), and blood were collected at multiple time points. Levels of three biomarkers (αII-spectrin breakdown product [SBDP150], glial fibrillary acidic protein [GFAP], and ubiquitin C-terminal hydrolase-L1 [UCH-L1]), were measured using quantitative immunoblotting and/or enzyme-linked immunosorbent assays. In injured cortex, SBDP150 and GFAP levels were increased significantly over controls. Cortical SBDP150 was elevated at 1 day but not 7 days, and GFAP at 7 days but not 1 day. At their respective time points, mean levels of SBDP150 and GFAP biomarkers in the cortex rose stepwise as injury magnitude increased. In the CSF, increasing severity of PBBI was associated with increasing concentrations of both neuronal and glial biomarkers acutely at 1 day after injury, but no trends were observed at 7 days. In plasma, SBDP150 was elevated at 5 min after 10% PBBI and at 6 h after 12.5% PBBI. UCH-L1 levels in plasma were elevated acutely at 5 min post-injury reflecting injury severity and rapidly decreased within 2 h. Overall, our results support the conclusion that biomarkers are effective indicators of brain damage after PBBI and may also aid in the assessment of injury magnitude.
Introduction
T
Currently, clinicians have no simple, rapid, objective test to diagnose the presence or severity of any type of TBI. 4 At present, TBI diagnosis relies on clinical judgment based on neurological examinations and on neuroimaging tests such as CT scans and MRI. Without reliable, standardized, quantitative diagnostic assays, the effort to develop therapeutic drugs for TBI is hampered, and tracking patient progress over time is difficult.
At the time of TBI, brain proteins and their fragments (breakdown products) are released into biofluids such as cerebrospinal fluid (CSF) and blood. These proteins and breakdown products (i.e., biochemical markers or biomarkers) provide a window into the injury process, and quantitative enzyme-linked immunosorbent assays (ELISA) have been designed to measure them in humans and animal models. 5 –15 Ideally, biomarkers should use readily accessible biological material such as blood, be released in a time-locked sequence after injury, predict the magnitude of injury, and possess high sensitivity and specificity for the injury. 4
The present study used a well-characterized rat model of penetrating ballistic-like brain injury (PBBI) 3,16 –18 to determine whether biomarkers could be used to track injury severity, and represents one of the first applications of TBI-associated biomarkers to rat PBBI. In this model, rats were injured unilaterally in the frontal cortex at three severity levels with a rapidly inflating/deflating balloon probe that simulates the temporary cavity created by the energy dissipation of a projectile. 3 Injury severity was defined by the volume of balloon expansion relative to total brain volume, expressed as a percentage (moderate 5%, severe 10%, or delayed lethal 12.5%). 3,19
In this study, three biomarkers, including the αII-spectrin breakdown product SBDP150, glial fibrillary acidic protein (GFAP), and ubiquitin C-terminal hydrolase-L1 (UCH-L1), were measured in brain and/or biofluids (CSF, plasma) from rats with PBBI at each severity level using quantitative immunoblotting and/or ELISA methods. As a breakdown product of the structural protein non-erythroid αII-spectrin, the designation SBDP150 reflects its molecular weight of 150 kDa. 20 AlphaII-spectrin is abundant in neurons; however, it is also present at lower levels in glia and other cell types. 8,20 AlphaII-spectrin breakdown products are produced in dying cells because of specific cleavages by the cell death proteases calpains (necrosis) and caspases (apoptosis). 20,21
Two distinct but similarly sized 150 kDa isoforms of spectrin are produced by both calpains and caspases (SBDP150 and SBDP150i, respectively). 20 The ELISA assay used here is designed to detect the calpain-specific SBDP150, because there is strong evidence for robust calpain activation after TBI in rats and humans. 8,12,16,22,23 In addition, there are two more spectrin breakdown products resulting from calpain and caspase cleavage, respectively—SBDP145 and SBDP120. 20 In patients with severe TBI, SBDPs in the CSF have been found to be associated with injury severity and outcome, 12,14,15 supporting their utility as TBI biomarkers.
UCH-L1 is a deubiquitinating enzyme that is abundantly expressed in the neuronal cell body and is associated with neurodegenerative diseases 24 as well as TBI. 9 Elevated levels of UCH-L1 in the CSF and serum of patients with severe TBI are correlated with death, and serum levels are associated with clinical severity. 7,11,13,25 GFAP is an abundant intermediate filament protein in mature astrocytes in the brain and spinal cord. 26 Both UCH-L1 and GFAP have demonstrated utility as biomarkers in patients with mild/moderate and severe TBI, with serum levels being associated with injury severity. 10,27 –30
Methods
Animal use
PBBI injuries were produced in male Sprague-Dawley rats (250–300 g; Charles River Labs, Raleigh, NC). All procedures were approved by the Walter Reed Army Institute of Research Animal Care and Use Committee. Research was conducted in compliance with the Animal Welfare Act and other federal statutes and regulations relating to animals and experiments involving animals, and adheres to principles stated in the Guide for the Care and Use of Laboratory Animals. Animals were housed individually under a 12-h light/dark cycle in a facility accredited by the Association for Assessment and Accreditation of Laboratory Animal Care International. All surgical procedures were performed on anesthetized animals. Anesthesia was induced and maintained with 2–5% isoflurane delivered in oxygen. Body temperature was maintained normothermically (37±1°C) throughout all surgical procedures by means of a homeothermic heating system (Harvard Apparatus, South Natick, MA). After the procedure, animals were placed in a warm chamber maintained by a circulating water-bath heating system (Gaymar Indust., Orchard Park, NY) until recovery from anesthesia. Food and water were provided ad libitum post-operatively.
Unilateral frontal PBBI injury
For these studies, sets of rat cortex, CSF, and plasma were generated from five different groups of rats (naïve control, sham control, 5% PBBI, 10% PBBI, and 12.5% PBBI), with five rats per group. One milliliter of blood for plasma was collected from each of five animals per group at six time points (5 min, 2 h, 6 h, 1 day, 3 days, 7 days), and cortex and CSF were collected at two time points (1 day, 7 days). Fifty rats total were used in this study; 25 for CSF and cortex at 1 day post-injury and 25 for the plasma time course and then CSF/cortex at 7 days.
A PBBI apparatus (MITRE Corp., McClean, VA) was used to simulate a ballistic injury of a high-velocity 7.62 mm NATO round to the rat frontal cortex. 3,19 Briefly, rats were anesthetized and positioned in a stereotaxic frame for probe insertion. The scalp was incised along the midline and a cranial window (4 mm in diameter) was created to expose the right frontal pole of the brain. The PBBI probe was made of a 20-gauge stainless steel tube with fixed perforations along one end and sealed by a 1 cm piece of elastic tubing. The probe was secured on the probe holder attached to the stereotaxic frame at an angle of 50 degrees from the vertical axis and 25 degrees counterclockwise from the midline. The probe was advanced manually along this axis through the cranial window into the brain. One end of the probe was connected to a hydraulic pressure generator. On activation by a computer, the generator rapidly (<40 ms) inflated and deflated the elastic tubing on the probe to an elliptical-shaped water-filled balloon. The magnitude of PBBI was controlled by inflating/deflating the PBBI balloon to a diameter equal to 0.48 cm, 0.63 cm, or 0.70 cm, which represents 5, 10 or 12.5% of total rat brain volume, therefore defining three PBBI severity levels. Immediately following deflation, the probe was gently retracted from the brain, the cranial opening sealed with sterile bone wax, and the incision closed with 4-0 nylon suture, followed by administration of a topical antibiotic. Sham animals were not subjected to probe insertion but otherwise received all surgical manipulations.
CSF and cortex were collected as described. 31 Serial blood samples were collected via an indwelling right jugular vein catheter. Plasma was generated using the following method: One milliliter of blood was collected into 1.5 mL lithium-heparin coated Eppendorf tubes (Fisher Scientific # 05-407-13C) and immediately stored on ice. Blood was centrifuged at 1200×g for 10 min at 4°C to pellet intact blood cells. The resulting supernatant plasma was then transferred to fresh standard Eppendorf tubes and stored −80°C until analysis.
Quantitative immunoblotting analysis
Sodium dodecyl sulfate polyacrylamide gel electrophoresis and immunoblotting were performed as described previously. 8 Semi-quantitative evaluation of protein and BDP levels was performed via computer-assisted densitometric scanning (Epson XL3500 high resolution flatbed scanner) followed by image analysis with Image-J software. Full length and 45 kDa GFAP bands were counted individually and then summed to yield the total amount of GFAP protein. The quantitation of each biomarker is displayed in arbitrary densitometric units (au). Primary antibodies used were mouse anti-αII-spectrin (a.k.a. α-fodrin, Enzo), UCH-L1 (Banyan), GFAP (Abcam), β-actin (Sigma), and cyclophillin A (Upstate).
Sandwich ELISA (SW-ELISA) assays
CSF and plasma samples were analyzed with Banyan Biomarker's proprietary SW-ELISA as described for GFAP and UCH-L1, 25 and as follows for SBDP150. The SBDP150 ELISA used a goat polyclonal antibody (Banyan) that is specific to new N-terminus of SBDP150 formed after calpain cleavage of αII-spectrin, similar to that reported previously. 32 This SBDP150 polyclonal was used for solid phase immobilization, and a mouse monoclonal antibody conjugated to horseradish peroxidase (HRP) for detection. Briefly, ELISA plates (NUNC Maxisorp high binding) were passively coated overnight at 4°C with capture antibody, then washed and blocked for 30 min. CSF (5–10 μL) or plasma (20–34 μL) samples were incubated for 2 h at room temperature with shaking. After washing, detection antibody was added and incubated for 90 min with shaking.
For SBDP150, detection included a biotinyl-tyramide amplification step. Peroxidase-conjugated detection antibody or streptavidin-HRP conjugates catalyzed the reaction with a colorimetric substrate (TMB, Pierce), and product was quantitated by absorbance at 450 nm in a microplate spectrophotometer (BMG FLUOStar OPTIMA, Germany). For GFAP in CSF, 6.8 μL per sample was measured using a commercial ELISA kit (QC-SL-001, BioVendor) according to the manufacturer's instructions. Standard curves were generated using recombinant proteins of known concentrations corresponding to the biomarker measured in each assay. For each biomarker, quantitative determination of the biomarker concentrations was achieved by comparing the unknown sample signal intensities to the standard curve. Four parameter-fit non-linear regression analyses were applied to determine biomarker quantities.
Statistics
Descriptive statistics were used to characterize biomarker concentrations according to key characteristics (severity of injury, time point, and sample type). For analysis of biomarker levels in the cortex, two-way analysis of variance tests in GraphPad Prism 5.0 were used followed by the Bonferroni post-test to determine differences between groups. For statistical comparison of biofluid-based biomarker values, the Mann-Whitney U test was used for groups of two and the Kruskal-Wallis test for groups of three or more. To determine pairwise differences after Kruskal-Wallis, the Dunn post-test was used. The relation between quantitative variables was assessed by bivariate correlations (Spearman rank correlation test). All statistical tests were two-tailed. The p values<0.05 were considered significant. For biofluid measurements, statistical analyses were performed using the SPSS 20.0 software package and GraphPad Prism 5.0.
Results
Quantitative immunoblotting
SBDP150, UCH-L1, and GFAP levels were measured in control and injured cortex from all rats by quantitative immunoblotting. A representative blot used for quantifying SBDP150 levels is shown (Fig. 1A). Blots were probed with a total αII-spectrin antibody that detected intact spectrin, as well as SBDP150 and SBDP145. Caspase-generated SBDP120 was not observed (not shown). In cortex isolated from animals at 1 day post-injury, SBDP150 levels reflected injury magnitude, showing clear stepwise increases as injury severity increased from 5–12.5% PBBI (Fig. 1B). No change in cortical SBDP150 was observed at 7 days after injury (Fig. 1B). As shown by a representative immunoblot, UCH-L1 levels did not change in the cortex after PBBI (Fig. 1C). Regarding GFAP, two primary GFAP bands were detected on immunoblots of the cortex, full length GFAP at 50 kDa and a GFAP BDP at 45 kDa (Fig. 1C). These bands were measured densitometrically and summed together to give the total cortical GFAP level per group (Fig. 1D). In contrast to SBDP150, total cortical GFAP was highly elevated at 7 days after injury in all injury magnitudes, but showed no changes at 1 day (Fig. 1D). Levels of total cortical GFAP at 7 days increased with injury magnitude for each degree of injury (Fig. 1D). At 7 days post-injury, the 45 kDa GFAP-BDP was significantly increased in 10% and 12.5% of PBBI brains (Fig. 1E).
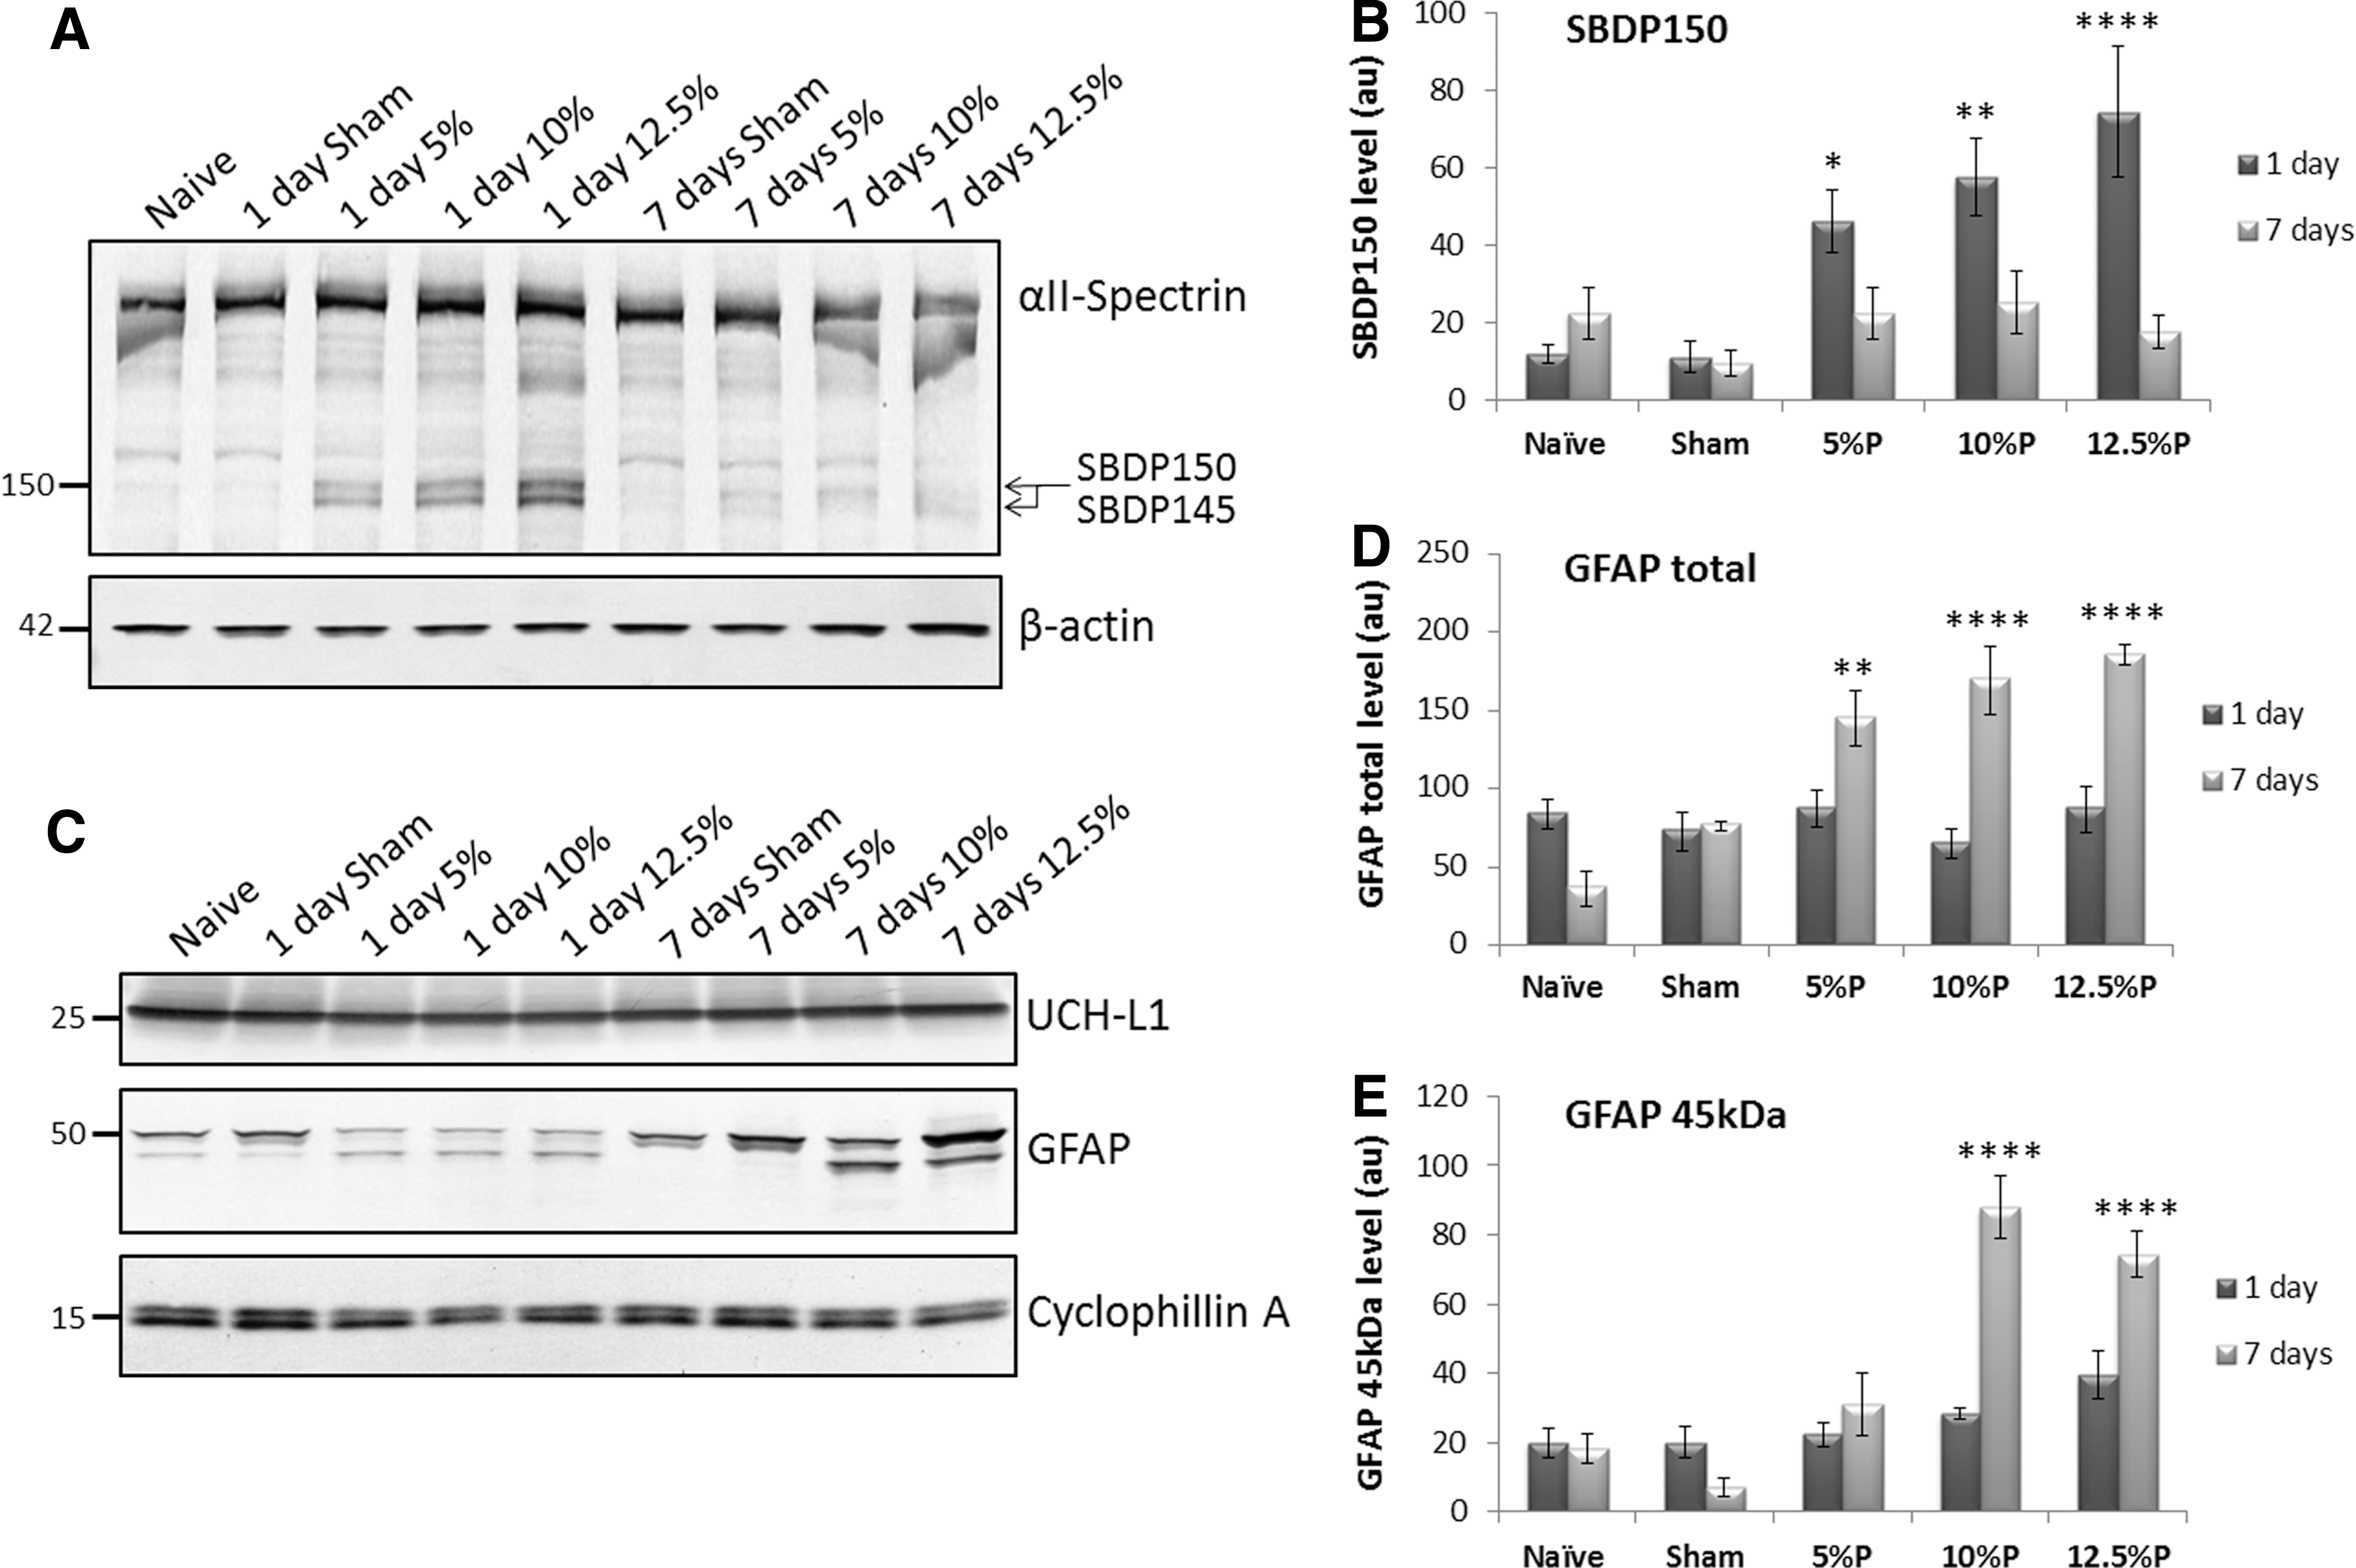
Cortical αII-spectrin breakdown product (SBDP150) and total glial fibrillary acidic protein (GFAP) levels reflected injury magnitude. The levels of the indicated biomarkers in cortex were evaluated by Western blot. β-actin and cyclophillin A served as loading controls. Bands were quantitated densitometrically from Western blots and charted (au=arbitrary densitometry units). Mean values±standard error of the mean and p values relative to sham are shown, with *p<0.05; **p<0.01; ****p<0.0001.
CSF concentrations of SBDP150, UCH-L1, and GFAP
SW-ELISAs were used to measure CSF concentrations of SBDP150, UCH-L1, and GFAP in rats at 1 and 7 days after injury. Median values of each biomarker are shown in Table 1. There were five rats per group. In a few injured rats, the volume of recovered CSF was insufficient to support all three biomarker assays. In these cases, SBDP150 and GFAP were measured, while UCH-L1 was not, as reported in Table 1. For 1 day after injury, CSF concentrations for each biomarker were also charted (Fig. 2). CSF levels of SBDP150, UCH-L1 and GFAP all showed increasing trends with injury magnitude (Fig. 2). For SBDP150 and GFAP, CSF levels were significantly increased relative to naïve controls in the 10% and 12.5% injury groups. For UCH-L1, levels were significant at 12.5% injury (Fig. 2). Further, correlations between biomarkers in the CSF at 1 day were evaluated for all the groups. SBDP150 concentrations were positively correlated with UCH-L1 (R=0.70, p=0.0004) and GFAP (R=0.80, p<0.0001), and UCH-L1 positively correlated with GFAP (R=0.77, p<0.0001). CSF SBDP150 concentrations at 1 day were negatively correlated with plasma concentrations (R=0.53, p=0.006), but no other correlations were found.
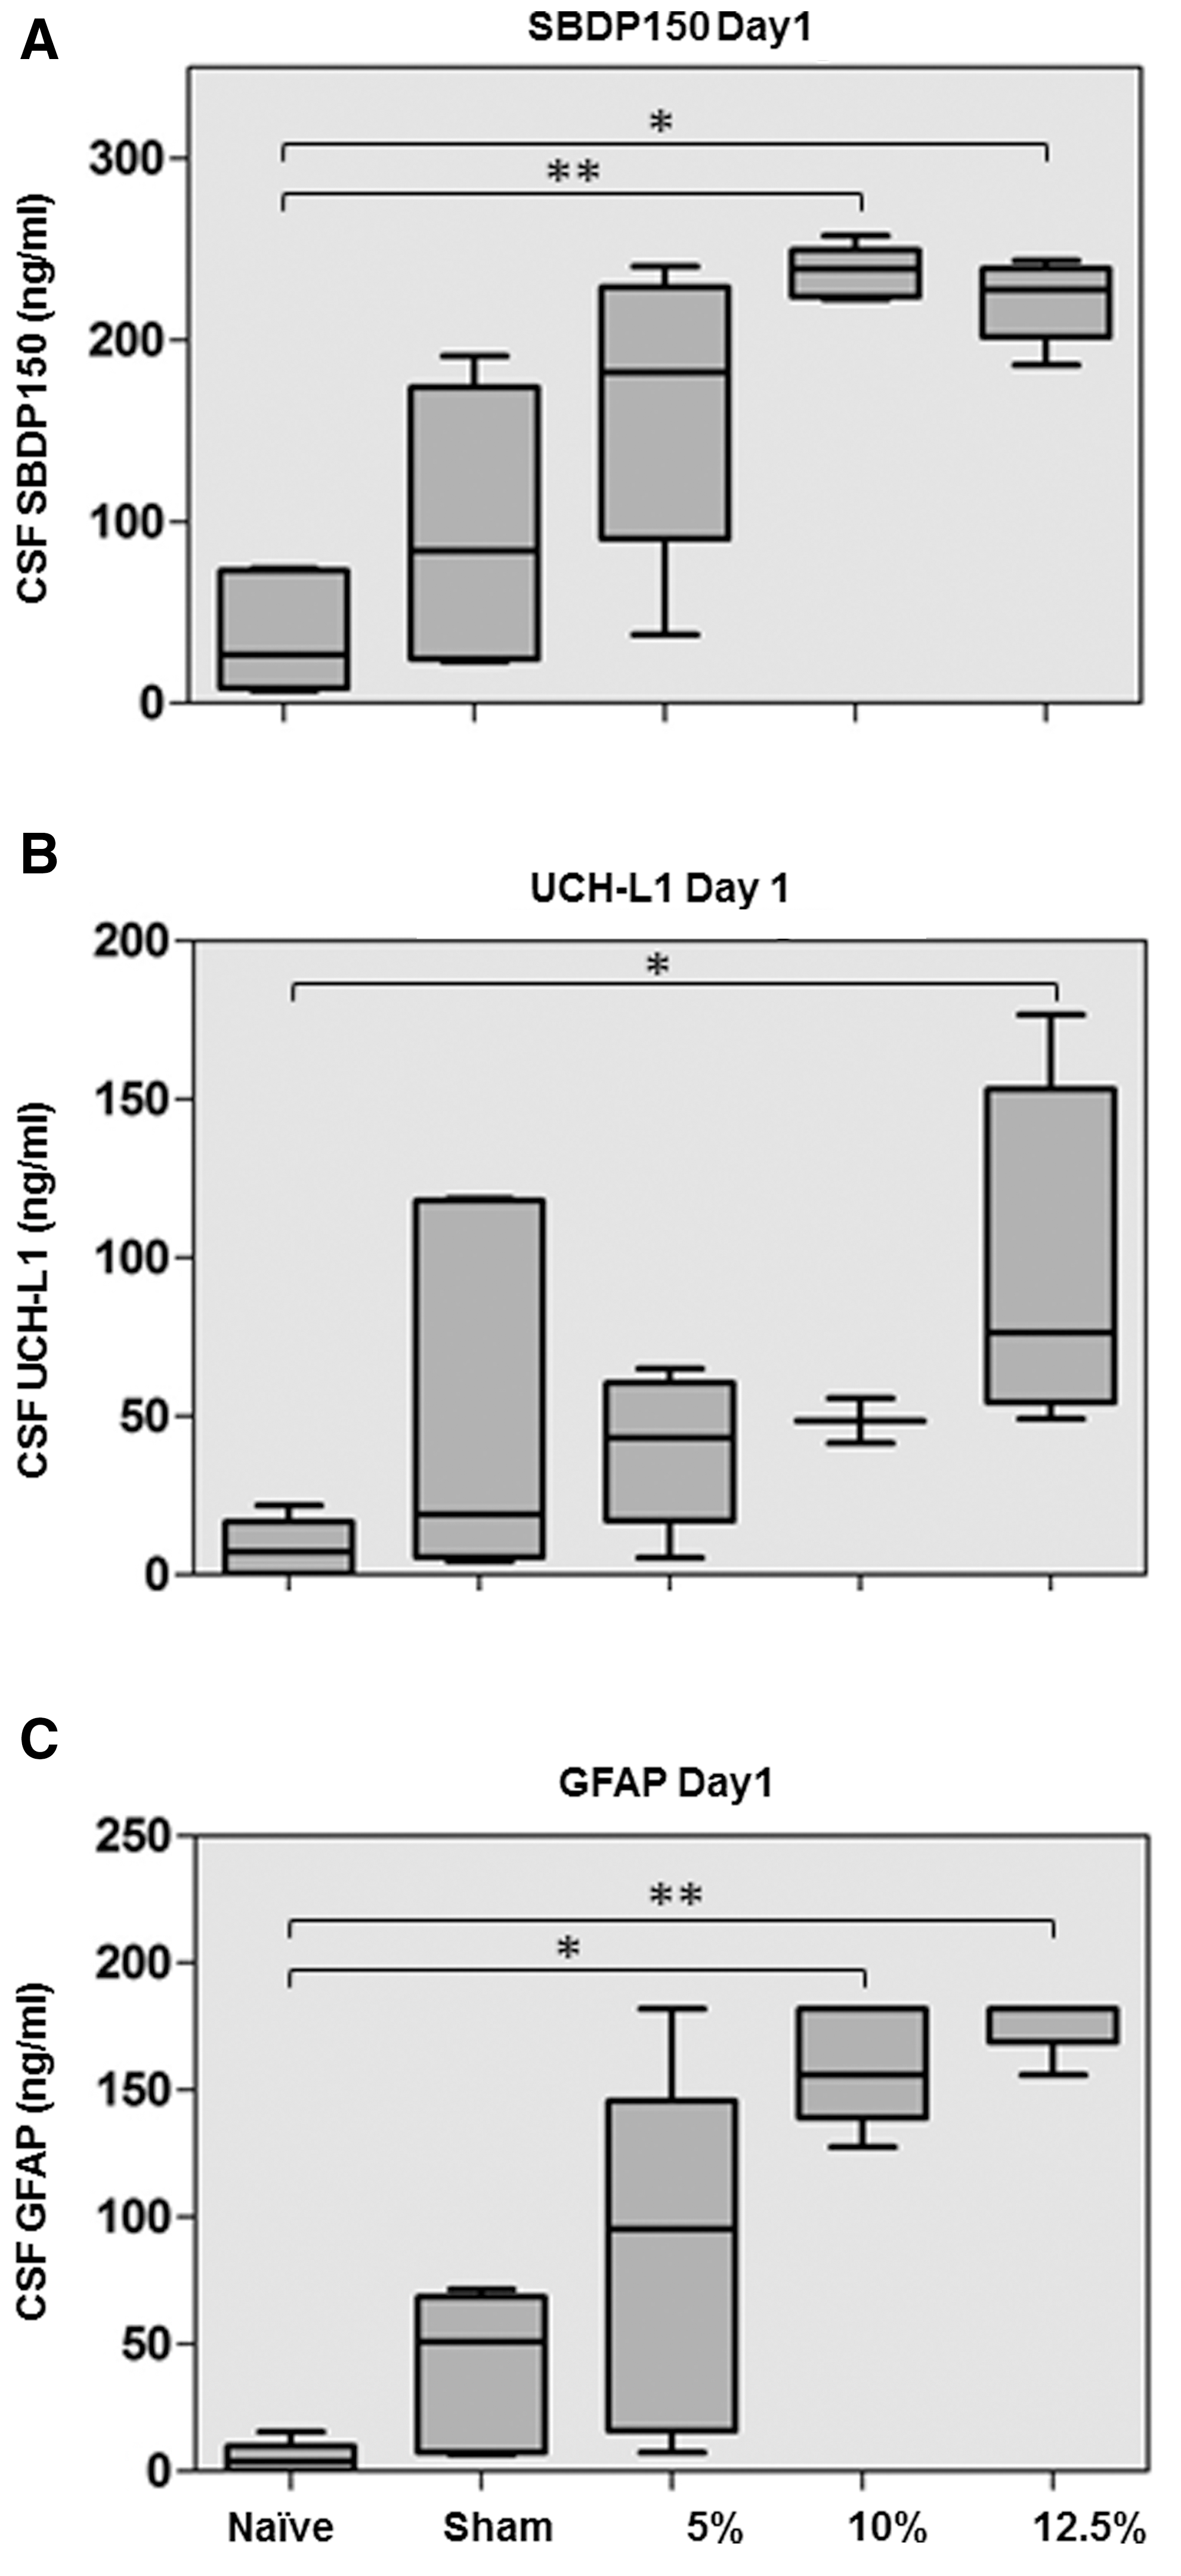
Box‐and‐whisker plots demonstrating cerebrospinal fluid (CSF) αII-spectrin breakdown product (SBDP)150 (
ELISA was used to determine the median concentrations of each biomarker, indicated in nanograms per milliliter. Significant differences compared to naïve are marked with *(p<0.05), **(p<0.01), or ***(p<0.005). The number of measurements per group is also displayed. When less than 5 measurements per group were obtained, it was due to reaction failures caused by low CSF recoveries.
SBDP150, αII-spectrin breakdown product; UCH-L1, ubiquitin C-terminal hydrolase-L1; GFAP, glial fibrillary acidic protein; PBBI, penetrating ballistic-like brain injury.
At 7 days after injury, CSF concentrations of SBDP150, UCH-L1, and GFAP did not differ significantly between groups (Table 1). Biomarker levels in the CSF appeared generally higher at 1 day post-injury compared with 7 days (Table 1). SBDP150 concentrations were still correlated with UCH-L1 (R=0.89, p<0.0001) and GFAP (R=0.78, p<0.0001) and UCH-L1 with GFAP (R=0.78, p<0.0001).
Plasma concentrations of SBDP150 and UCH-L1
The temporal profiles for SBDP150 and UCH-L1 in plasma at six time points post-PBBI are displayed in Figure 3. Individual time points showing significant differences between groups were also charted in Figure 4. There were no significant differences in plasma SBDP150 levels among naïve, sham, and 5% PBBI animals at any of the time points examined (Fig. 3A,4). Interestingly, two distinct trends were identified in the more severely injured animals. Plasma SBDP150 was significantly raised in 10% PBBI animals 5 min after injury, remained elevated at 2 h although not significantly from high variance, then slowly decreased over time (Fig. 3A,4A). Plasma SBDP150 levels in 12.5% PBBI animals were initially low, but significantly increased at 6 h after injury (Fig. 3A,4B).

Line diagrams showing median concentrations of plasma αII-spectrin breakdown product (SBDP)150 (

Box‐and‐whisker plots demonstrating plasma αII-spectrin breakdown product (SBDP)150 (
Plasma UCH-L1 levels showed significant increases as early as 5 min after injury, but rapidly normalized (Fig. 3B). Initially, UCH-L1 plasma levels were increased in all the injured groups, with levels in 12.5% PBBI animals being highly significant at 5 min (Fig. 4C; p<0.001). At this time point, an increasing trend can be seen across injury levels (Fig. 3B,4C). UCH-L1 levels in all injured animals had returned to baseline by 2–6 h (Fig. 4D), showing no significant differences from sham controls at any time point other than 5 min post-injury. An attempt was made to quantify GFAP in plasma; however, the assay used was not sensitive enough to yield measurements.
Discussion
An advantage of the rat PBBI model is the wealth of information regarding pathobiological changes that occur over time after injury. In a comprehensive time-course evaluation of 10% PBBI, three phases of injury progression were described. 16 Phase I (0–6 h) consisted of immediate (<5 min) intracranial hemorrhage. By 2 h, a core lesion had formed as a direct result of mechanical damage from the probe/balloon. During Phase II (6 h to 3 days), the core lesion composed mostly of necrotic tissue had expanded into peri-lesioned areas via secondary death mechanisms, and neuronal degeneration peaked (1 day). Phase III (delayed degeneration, 3–7 days) included a second wave of neuronal and white matter degeneration remote from the core, as well as cavitation and clearance of the core lesion. 16
In the present study, elevated levels of SBDP150 were seen in injured cortex at 1 day post-PBBI. SBDP150 can be formed by calpain cleavage of spectrin. 20 By contrast, caspase-specific SBDP120 was not detected in PBBI cortex (not shown), suggesting low caspase activation in rat PBBI. Because caspase also cleaves spectrin into a 150 kDa fragment, 20 the lack of SBDP120 suggests that the cortical SBDP150 measured here was calpain-generated. In addition, the elevated levels of SBDP150 measured by the ELISA with the calpain-generated SBDP150-specific antibody supports that SBDP150 was derived from calpain (Table 1, Fig. 2). Cortical SBDP150 post-PBBI is therefore consistent with the presence of necrotic tissue in the core lesion. 16 Of interest, although delayed degeneration was reported up to 7 days post-PBBI, 16 cortical SBDP150 was not elevated at that time point in the present study, perhaps because of the clearance of damaged material from the lesion. As illustrated in Figure 5, we propose that PBBI involves a dominant necrotic injury with acute calpain hyperactivation, leading to proteolysis and protein efflux into the CSF and blood. 20
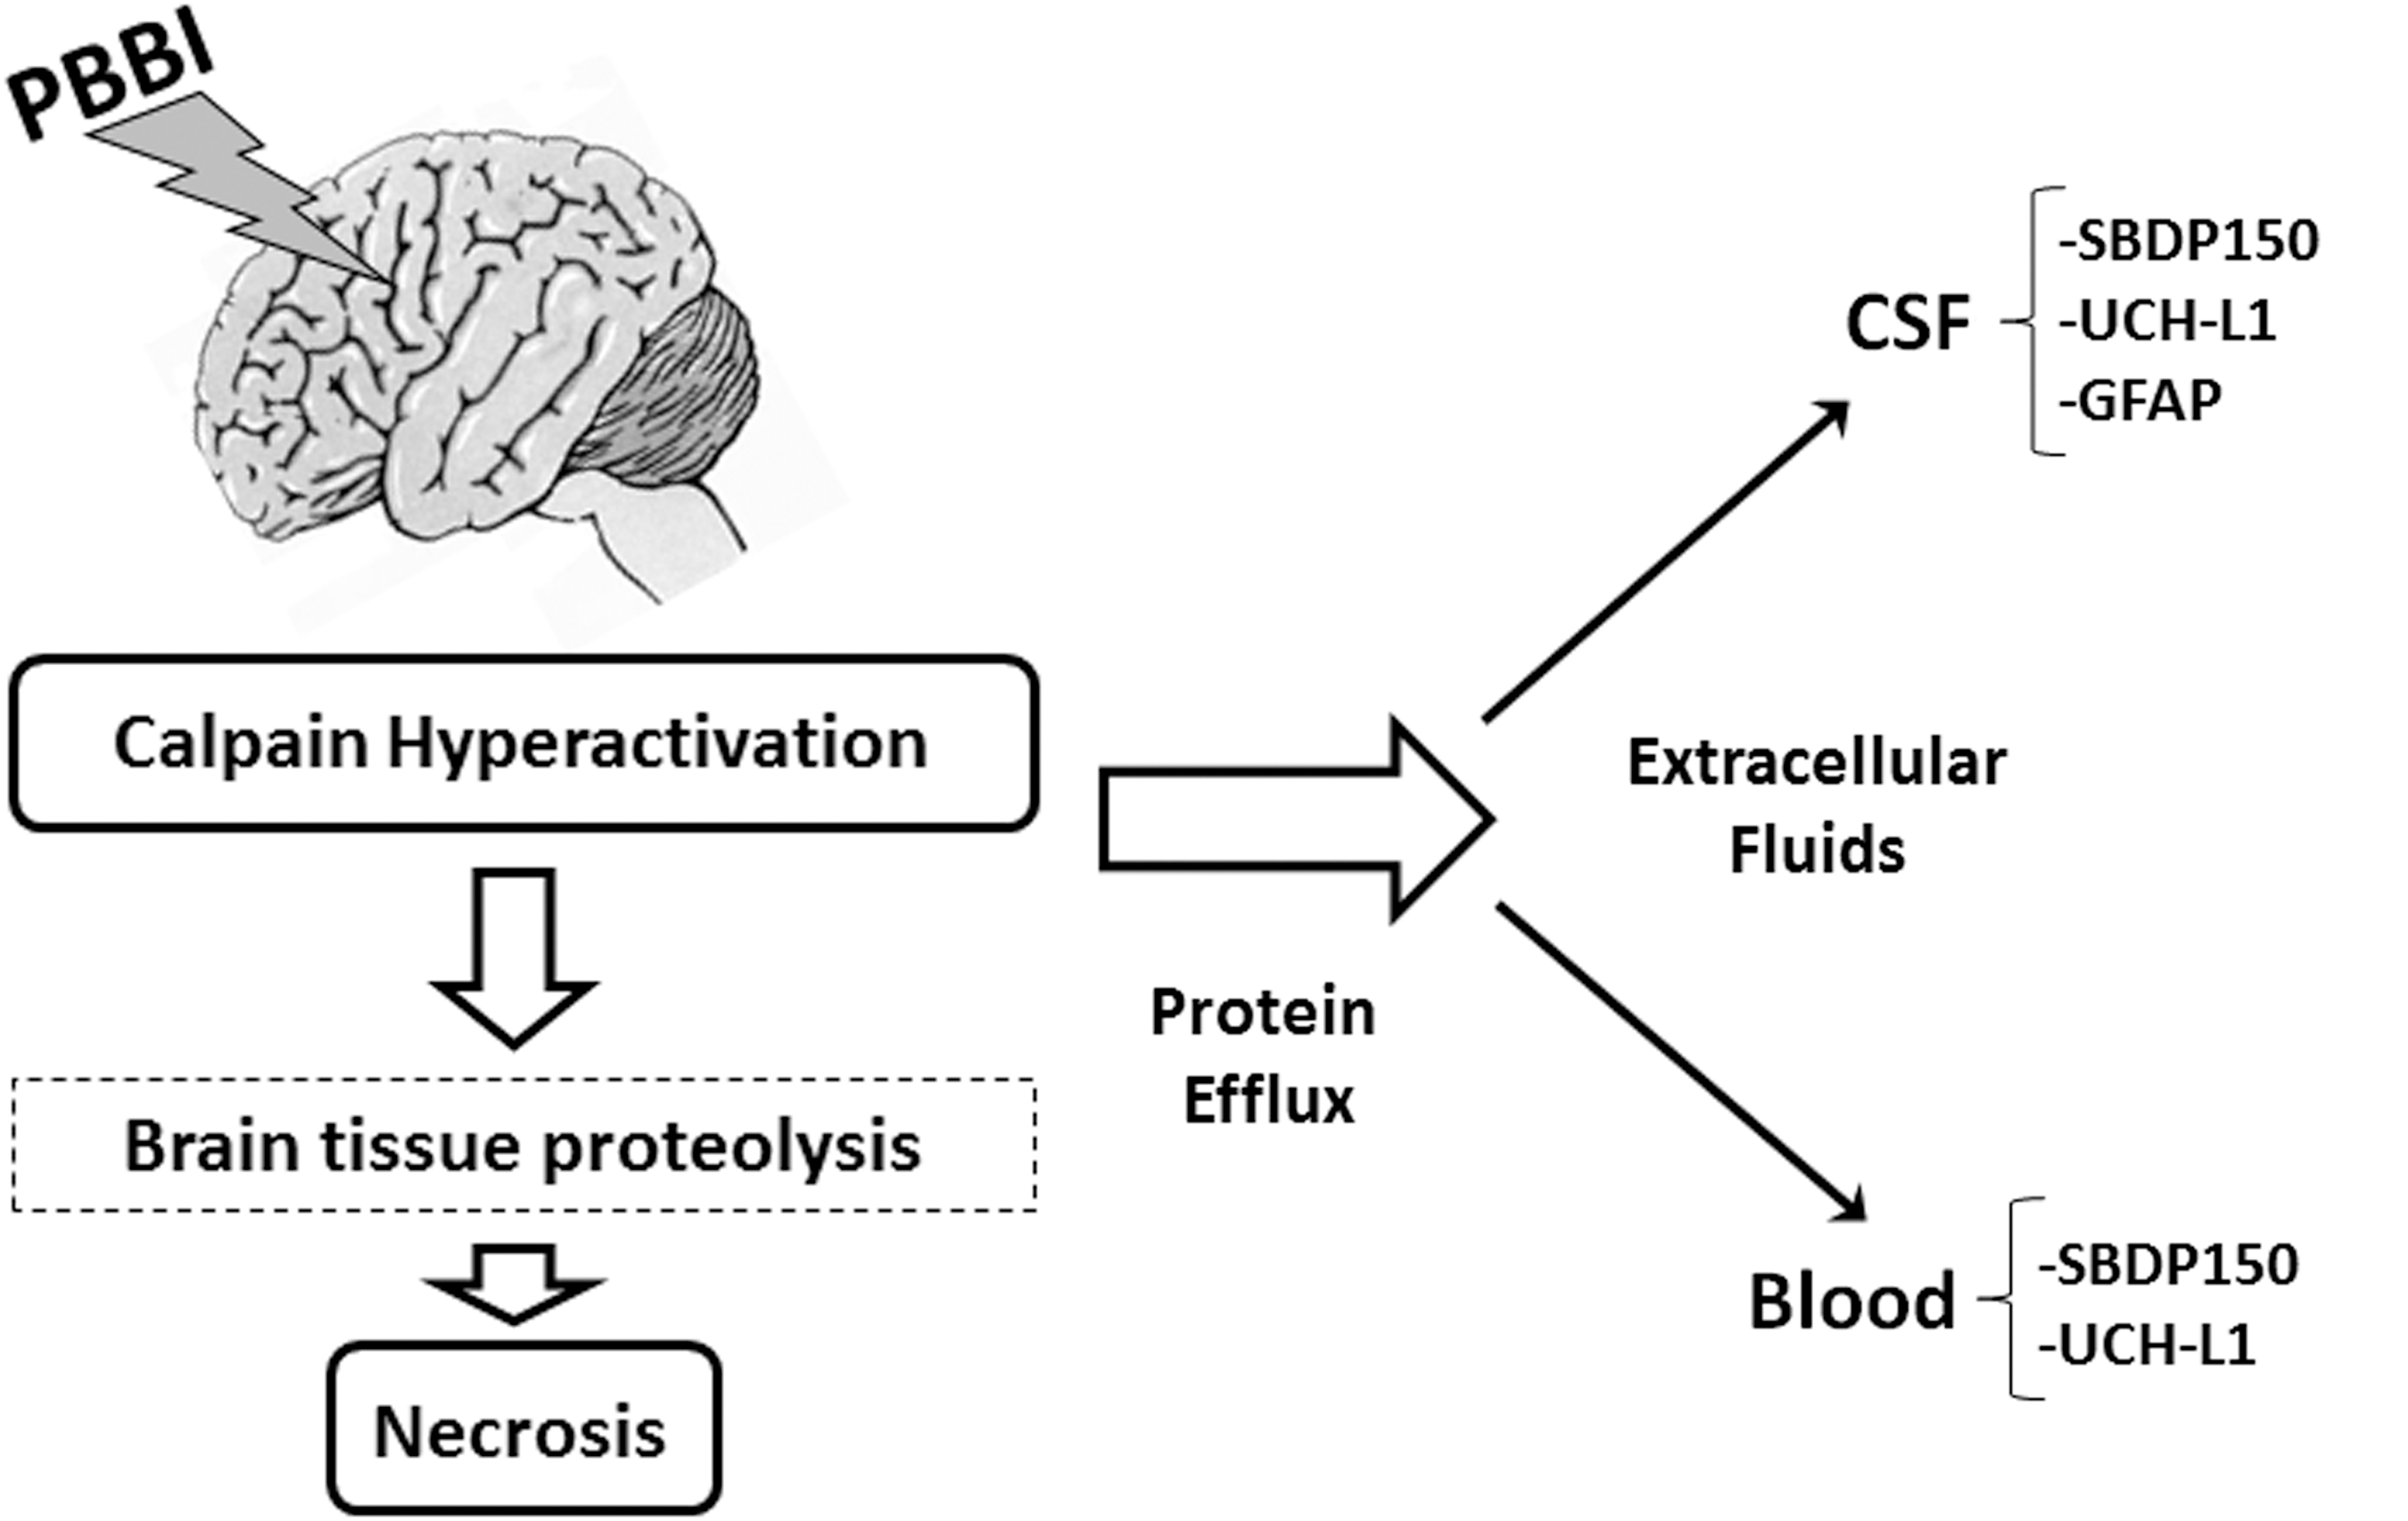
Summary of injury processes and biomarker release after rat penetrating ballistic-like brain injury (PBBI). PBBI of the brain was accompanied by calpain hyperactivation, proteolysis of brain proteins such as αII-spectrin, and necrotic cell death. The indicated brain-derived protein biomarkers were released into biofluids such as cerebrospinal fluid (CSF), and if the blood-brain barrier was disrupted, into the bloodstream. SBDP, αII-spectrin breakdown product; UCH-L1, ubiquitin C-terminal hydrolase-L1.
Cortical SBDP150 and total GFAP both showed striking correlations to injury severity when measured in the PBBI brain, but their timings were distinct. In contrast to SBDP150, which was elevated in the CSF and cortex at 1 day after injury, GFAP was elevated in the CSF at 1 day, but in the cortex at 7 days. The elevation of biomarkers in the CSF at 1 day is likely to reflect injury-induced release of intracellular material from dead/dying brain material, while that of GFAP in the cortex at 7 days may be an indicator of reactive gliosis. Astrocytes react to brain injury by proliferating to form a glial scar during a process termed reactive gliosis or astrogliosis. 26 In a previous study, the timing of astrogliosis was examined in 10% PBBI rats by immunohistochemistry. Results showed a progressive increase in GFAP+ cell density in peri-lesioned cortex through 3 days after injury, which then declined by 7 days, although the changes were not precisely quantified. 18 Here, total cortical GFAP increases at 7 days were seen across all injury levels and were significant. Elevations in cortical levels of the 45 kDa GFAP-BDP at 7 days post 10% and 12.5% PBBI could have resulted from calpain cleavage, because GFAP is known to be degraded by this enzyme. 8
The rapid appearances of UCH-L1 (5 min) and SBDP150 (5 min–6 h) in plasma suggest a relationship with injury processes occurring during Phase I, such as hemorrhaging, mechanical disruption of cells, and calpain activation. Of note, for plasma SBDP150, median levels were elevated in 5% and 10% PBBI animals at 5 min and 2 h post-injury, but not in 12.5% PBBI at these early times (Fig. 3A). At the 12.5% PBBI magnitude, which may be lethal, the brain injury and associated calpain activation might have been so intense in the first few hours after injury that spectrin was degraded past SBDP150 to SBDP145. 20 In vitro digestions have demonstrated that low amounts of calpain-2 produce SBDP150 only or a mixture of SBDP150 and SBDP145, while high amounts result exclusively in SBDP145, suggesting that SBDP150 is an intermediate. 8 SBDP145 might therefore be a better indicator of calpain activity in the severest injury cases, but a plasma SBDP145 assay is not yet available. Alternatively, assessing spectrin levels in the cortex at an earlier time point such as 5 min after injury might be preferable to 1 day, because SBDP150 was detected in both cortex and plasma in 12.5% PBBI animals by 1 day.
Although release of GFAP into the CSF was robust post-PBBI, levels of GFAP in PBBI plasma were too low to be effectively measured by the GFAP ELISA used here. This was likely because of the lack of sensitivity of the assay, because a previous study with a human-specific GFAP ELISA demonstrated that GFAP was released into the bloodstream even after mild/moderate TBI in humans. 10 Based on the present study, however, it is unclear as to whether GFAP is released into the bloodstream after rat PBBI.
In PBBI, bleeding into the brain as a result of probe-mediated rupture of the blood-brain barrier (BBB) is likely accompanied by brain-specific cellular debris being carried out of the brain and into the bloodstream, detected here as the biomarkers UCH-L1 and SBDP150. Another rat PBBI study using the same 5%, 10%, and 12.5% PBBI magnitudes measured BBB permeability at five time points post-injury (4 h, 1 day, 2 days, 3 days, 7 days), and found that the extent of BBB leakage was directly tied to injury severity. 19 Two peaks of BBB permeability were observed, the first at 4 h, and the second at 2 and 3 days after injury, and the BBB remained permeable out to 7 days in the 10% and 12.5% PBBI groups. 19 No BBB leakage was detected at 1 day after injury in any of the injured rats, however. 19
Interestingly, in the present study, elevated early plasma levels of both SBDP150 and UCH-L1 fell to baseline by 1 day post-injury. In addition, although SBDP150 levels were significantly elevated in the CSF at 1 day, they were correspondingly low in the plasma at this time. These results are consistent with the BBB being open early and then closed by 1 day post injury, as previously presented. 19 Similarly, UCH-L1 has been described as a marker of BBB permeability as well as neuronal injury. 9 Here, at 5 min after injury, plasma UCH-L1 levels appeared to increase with injury magnitude, which is also consistent with degrees of BBB permeability reflecting injury severity.
In this study, jugular vein blood sampling supported good recovery of SBDP150 and UCH-L1 in plasma. Sampling from the jugular vein, as opposed to more distal collection sites such as the femoral vein, may minimize dilution of biomarkers after PBBI. Comparing biomarker concentrations in plasma from jugular versus femoral vein sampling would be an interesting area for future study.
While biofluid-based biomarker analyses in TBI are relatively new, for UCH-L1 in the rat, there are enough published data to support a detailed comparison among different injury types. UCH-L1 has been measured in biofluids from rats exposed to severe controlled cortical impact injury (CCI), 9 or to two types of severe blast injury—primary 5 or composite. 6 In rat CCI, a pneumatic impactor is used to injure exposed cortical tissue in a focal manner, with severity controlled by the distance of impactor travel. 9 By contrast, in rat blast, a shock tube is used to deliver a blast wave to the closed head, a relatively diffuse mode of injury. In primary blast, the rat experiences a blast overpressure wave only, while in composite blast, the rat experiences overpressure plus physical movement of the head (head acceleration). 5,6
For UCH-L1 in CSF, significant elevations were seen over control animals at 2 h–1 day post-severe CCI, 9 or at 2 days post-severe composite blast, 6 while no significant between-group differences were seen here in CSF UCH-L1 post-PBBI. For UCH-L1 in blood, differences among TBI models are striking. In severe CCI, serum UCH-L1 showed an elevated pattern from 2 h–1 day, reaching significance at 12 h post-injury. 9 In primary blast, serum UCH-L1 was increased from 6 h–7 days, reaching significance at 1 day, 5 while in composite blast, serum UCH-L1 was significantly elevated at 1 day, dropping to control levels by 4 days. 6 By contrast, in PBBI, plasma UCH-L1 was elevated at 5 min only, dropping to baseline by 2–6 h. These different UCH-L1 temporal profiles suggest profoundly different underlying pathobiological mechanisms among the TBI models. UCH-L1 release into the bloodstream therefore likely depends not only on BBB permeability and injury severity, but also on the type of injury.
Conclusion
Animal models of brain injuries are valuable because they can be used systematically to control injury severity and investigate the relationships among biomarker profiles, injury mechanism, and pathology. From a translational standpoint, biomarkers with the greatest potential clinical utility are those measurable in accessible biofluids and that correspond with injury severity. 4 With their early appearances in plasma, SBDP150 and UCH-L1 may be linked to primary injury pathology. Compared with UCH-L1, SBDP150 may be more useful for detecting brain damage because it remained elevated in plasma longer than UCH-L1. The three biomarkers used in this study have recently been shown to be linked to injury severity and/or outcome in patients with TBI, 10 –13,15,25,27 –29,33 supporting the validity of these proteins as biomarkers for TBI across species lines.
Footnotes
Acknowledgments
This study was supported by Department of Defense W81XWH-07-2-0075 to Ronald Hayes. Many thanks to Nancy Denslow for her editing of the manuscript and helpful advice.
Author Disclosure Statement
Ronald Hayes and Kevin Wang own stock and could receive royalties from Banyan Biomarkers, Inc. and Ronald Hayes is an officer of the company. Authors (JSZ, SM, BY, KJN, VR, TC, JS) are employees of Banyan Biomarkers, Inc. and have stock options, but will not benefit financially from this publication. For other authors, no competing financial interests exist. The opinions or assertions contained herein are the private views of the authors and are not to be construed as official or as reflecting true views of the Department of the Army or Defense. This material has been reviewed by the Walter Reed Army Institute of Research. There is no objection to its presentation and/or publication.