




Abstract
White matter hyperintensities (WMHIs) visible on magnetic resonance imaging (MRI) are common in both healthy adults and in those with medical or psychiatric problems. A practical methodological issue for diffusion tensor imaging (DTI) researchers is whether to include, or exclude, participants from a control group who have WMHIs. The aim of this study was to compare the influence of WMHIs on whole-brain DTI in trauma control subjects. Participants were 48 patients (no-WMHIs, n=36; 2+WMHIs, n=12) prospectively recruited from the Emergency Department of Vancouver General Hospital (British Columbia, Canada). Participants completed an MRI brain scan at 6–8 weeks postinjury (mean, 47.3 days; standard deviation [SD], 6.2; range, 39–66). DTI was used to examine the integrity of white matter (WM) in 50 regions of the brain using measures of fractional anisotropy (FA), and mean (MD), radial (RD), and axial (AD) diffusivity. FA values that were >2 SDs below the mean, and MD, RD, and AD values that were >2 SDs above the mean, were classified as “abnormal scores” indicative of reduced WM integrity. In the entire sample, the 2+WMHI group had a greater number of abnormal FA, MD, and RD scores, compared to the no-WMHI group (p<0.015 and Cohen's d >0.82, indicating large to very large effect sizes, for all comparisons). When controlling for the effects of age using a matched-groups design, the 2+WMHI group still had a significantly greater number of abnormal FA, MD, and RD scores, compared to the no-WMHI group (all p<0.012, all d >0.89, large to very large effect sizes). Researchers should be aware that the inclusion or exclusion of subjects with incidental WMHIs will influence the results of DTI studies.
Introduction
D
A practical and pervasive methodological issue that is rarely addressed by DTI researchers is determining what to do about participants with white matter hyperintensities (WMHIs) found on structural imaging. WMHIs identified with 3T magnetic resonance imaging (MRI) are relatively common in the general population, 21,22 especially with aging. 23,24 For research involving DTI, this creates a methodological issue. For example, in studies involving mild TBI (mTBI), is it prudent to exclude control subjects who have a single or small number of WMHIs? Retention or exclusion of these individuals might influence the results of the study and certainly will influence the generalizability of the research. Although it is common for researchers to apply rigorous inclusion or exclusion criteria for recruitment of control subjects, the decision to include or exclude individuals with WMHIs is typically not stated in the research methodology. 11,25 –27 In a review of 29 studies that compared mTBI and control groups, 11,14 –20,25 –43 we found only two studies that explicitly stated the presence of WMHIs as an exclusion criterion. 28,44 One of these studies excluded specific regions of interest that contained WMHIs from certain analyses, rather than excluding the participant from the entire study. 44
To our knowledge, only one study has examined the influence of WMHIs on DTI results in control participants. Iverson and colleagues 45 examined 30 healthy control participants with (n=6) or without (n=24) multiple WMHIs on whole-brain DTI using measures of fractional anisotropy (FA) across 19 regions of interest (ROIs; i.e., genu, body, and splenium of corpus collosum and two unilateral symmetrical regions [left/right] for the basal pons, cerebral peduncle, posterior limb of the internal capsule, corona radiata, centrum semiovale, uncinate fasciculus, forceps minor, and anterior corona radiate). Participants with multiple WMHIs (range, 3–16) had a greater number of abnormal FA scores across the 19 ROIs, compared to those with, at most, one WMHI. For example, 50.0% of participants in the multiple WMHI group had four or more abnormal FA scores, compared to 16.7% of individuals with, at most, one WMHI. Iverson and colleagues concluded that, pending replication of the findings, the inclusion or exclusion of those participants with WMHIs will likely have an effect on the results of most DTI studies.
The aim of this study was to replicate and extend the study by Iverson and colleagues 45 by comparing trauma control participants with WMHIs versus those without WMHIs on whole-brain DTI using four common DTI metrics (i.e., FA, mean diffusivity [MD], radial diffusivity [RD], and axial diffusivity [AD]). It was hypothesized that those individuals with WMHIs will have a greater number of abnormal FA, MD, RD, and AD scores, compared to those individuals with no WMHIs.
Methods
Participants
Participants were 48 patients prospectively recruited from the emergency department (ED) of Vancouver General Hospital (level 1 trauma center; Vancouver, British Columbia, Canada). Patients were identified for potential inclusion in the study by daily reviews of consecutive ED admissions. Patients were initially targeted for recruitment and consent if they presented to the ED after sustaining a soft-tissue or orthopedic injury as part of a larger study on outcome after TBI.
Participants were included if they (1) were between 19 and 55 years of age, (2) were injured as a result of a traumatic injury (e.g., fall, motor vehicle accident, assault, and so on), (3) had a blood-alcohol level obtained at the time of injury (this criterion is not specific to the current study, but was used as a criterion for a larger study relating to alcohol and outcome from TBI) (4) sustained a soft-tissue or orthopedic injury below the neck, (5) had no evidence of an altered state of consciousness, as indicated by a reduction in Glasgow Coma Scale score, or presence of a loss of consciousness, post-traumatic amnesia, or post-traumatic confusion, and (6) had no evidence of physical head trauma, whiplash, or cervical strain based on medical chart review (e.g., absence of lacerations or contusions to the head and absence of complaints of head, neck, or back pain). In a small number of cases (n=5; 10.0%), participants had undergone a head computed tomography scan; none had evidence of intracranial abnormality. General exclusion criteria included (1) lack of proficiency in conversational English, (2) educated in a language other than English after age 10, (3) history of a significant neurological disorder (e.g., stroke or multiple sclerosis), TBI, learning disability, or psychiatric illness requiring hospitalization, (4) presence of any contraindications to MRI, or (5) history of significant drug abuse other than alcohol.
Participants were selected from a larger sample of 55 orthopedically injured patients enrolled in the study. Three participants were excluded because of the presence of significant incidental findings on structural MRI scans (i.e., meningioma and developmental venous anomaly), and 2 were excluded because of motion artifacts on structural MRI scans. Of the remaining 50 participants, the number of WMHIs identified on structural MRI scans was as follows: (1) no WMHIs (n=36); (2) 1 WMHI (n=2); (3) 2–5 WMHIs (n=6); and (4) 5 or more WMHIs (n=6). For the purposes of this study, two groups were formed based on the number of WMHIs: (1) no-WMHIs (n=36) and (2) 2+WMHIs (n=12). Participants with 1 WMHI (n=2) were not included in the final sample in order to create two distinct groups.
In the final sample, the numbers of magnetic susceptibility foci in cortical, subcortical, and deep WM regions, based on gradient echo images, were as follows: cortical=0; subcortical=1; and deep WM=0. The numbers of WMHIs in cortical, subcortical, and deep WM regions, based on fluid-attenuated inversion recovery (FLAIR) images, were as follows: cortical=1 (right temporal); subcortical=15 (3 right frontal, 1 left frontal, 6 bilateral frontal, 1 left temporal, 1 bilateral temporal, 2 bilateral parietal, and 1 left parietal); and deep WM=17 (3 right frontal, 4 bilateral frontal, 2 left temporal, 1 left frontal, 1 left parietal, and 2 bilateral parietal). See Figure 1 for an example FLAIR scan showing several WMHIs.
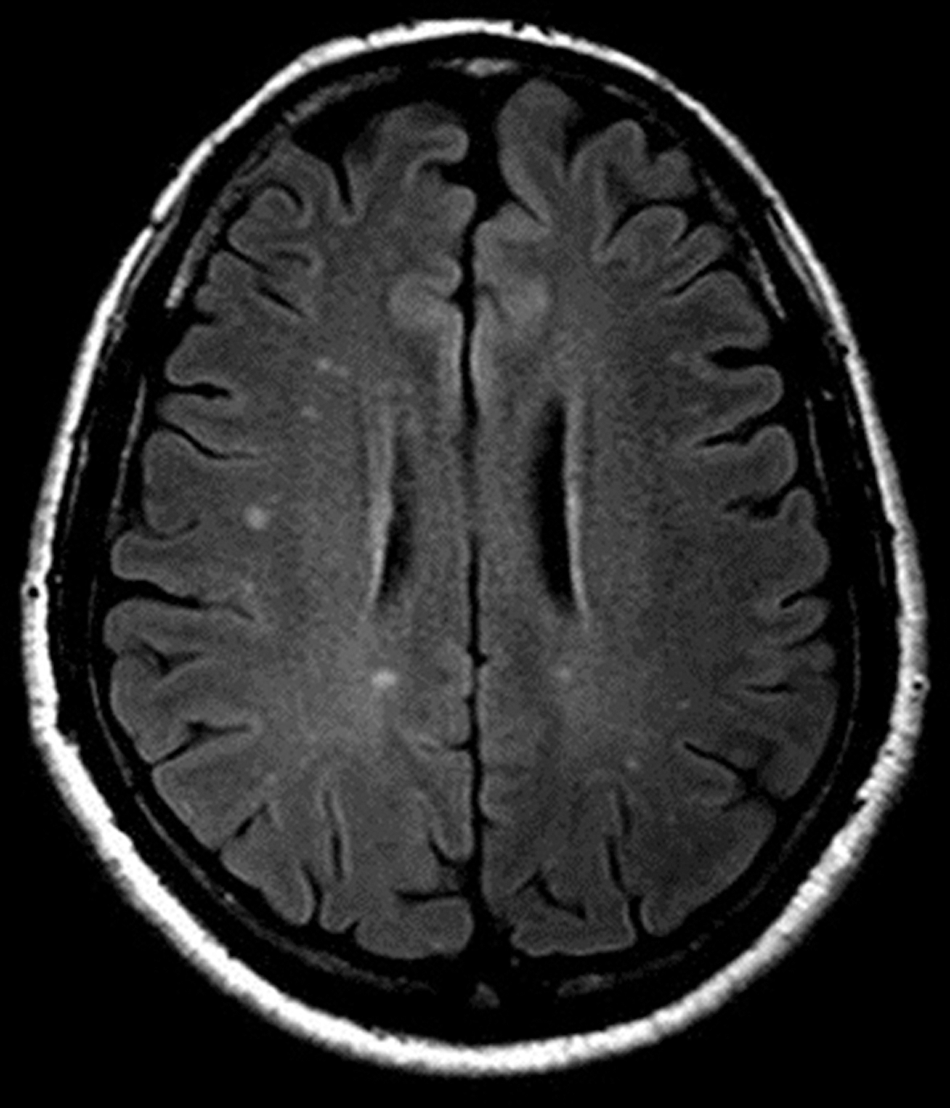
T2-weighted fluid attenuated inversion recovery image from a subject with deep and subcortical white matter hyperintensities.
Measures and procedure
Participants completed an MRI brain scan at 6–8 weeks postinjury (mean [M], 47.3 days; standard deviation [SD], 6.2; range, 39–66). All participants gave written informed consent in accord with the clinical research ethics board at the University of British Columbia (Vancouver, British Columbia, Canada).
Neuroimaging
All MRI data were acquired on a Philips Achieva 3T scanner (Philips, Best, The Netherlands) equipped with Dual Nova Gradients (maximum gradient strength, 80 mT/m; maximum slew rate, 200 mT/m/sec) and an eight-channel head coil. Partial parallel imaging was performed using sensitivity encoding (SENSE). 46 The total data acquisition time was 43 minutes. The MRI protocol consisted of (1) sagittal three-dimensional T1-weighted scan (repetition time [TR], 8.1 ms; echo time [TE], 3.7 ms; flip angle, 8 degrees; acquisition matrix, 240×240; field of view [FOV], 240×240×160 mm3; acquired voxel size, 1×1×1 mm3; reconstructed voxel size, 0.94×0.94×1 mm3; SENSE factor of 2 along the left-right direction), (2) axial T2-weighted turbo spin echo (TR, 3000 ms; TE, 80 ms; flip angle, 90 degrees; acquisition matrix, 320×245; FOV, 240×192×139 mm3; acquired voxel size, 0.75×0.78×4 mm3; reconstructed voxel size, 0.47×0.47×4 mm3; SENSE factor of 1.2 along the left-right direction; two averages), (3) axial T1-weighted spin echo scan (TR, 800 ms; TE, 10 ms; flip angle, 50 degrees; acquisition matrix, 256×163; FOV, 230×183×139 mm3; acquired voxel size, 0.90×1.12×4.00 mm3; 0.45×0.45×4 mm3), (4) axial T2-weighted FLAIR (TR, 10,000 ms; TE, 10 ms; acquisition matrix, 304×194; FOV, 240×193×139 mm3; acquired voxel size, 0.79×0.99×4.00 mm3; reconstructed voxel size, 0.47×0.47×4.00 mm3; SENSE factor of 1.6 along the left-right direction), (5) axial 2D T2*-weighted gradient echo (TR, 837 ms; TE, 16 ms; flip angle, 18 degrees; acquisition matrix, 256×163; FOV, 230×183×139 mm3; acquired voxel size, 0.9×1.12×4 mm3; reconstructed voxel size, 0.45×0.45×4 mm3; two averages), (6) coronal T2*-weighted gradient echo scan (TR, 520 ms; TE, 16 ms; flip angle, 18 degrees; acquisition matrix, 256×162; FOV, 240×191×169 mm3; acquired voxel size, 0.94×1.18×4.00 mm3; reconstructed voxel size, 0.47×0.47×4.00 mm3; SENSE factor of 1.3 along the right-left direction; two averages), and (7) diffusion tensor imaging (DTI) scan (TR, 5618 ms; TE, 75 ms; flip angle, 90 degrees; acquisition matrix, 96×95; FOV, 240×240×125 mm3; acquired voxel size, 2.50×2.50×2.50 mm3; reconstructed voxel size, 1.88×1.88×2.50 mm3; SENSE factor of 2.4 along the front-back; 15 diffusion directions and three averages).
All images were reconstructed by the scanner. All DTI scans were visually inspected for motion artifacts by looking at each individual diffusion-weighted scan and at the nonweighted scan. If any of these images showed signs of motion, the participant was excluded. Two scans in the final sample were excluded based on this criterion. The FLAIR and T2-weighted scans were assessed for WMHIs by a neuroradiologist (J.R.S. or M.K.S.H.). DTI data were processed using the FSL software program.
47
Eddy current and head motion correction were done by a linear, affine registration (FLIRT
48
–50
). Nonbrain voxels were removed using FSL's brain extraction tool (BET
51
). DTI eigenvalues (where λ1 is along the principle diffusion axis and λ2 and λ3 are orthogonal to λ1) were calculated using software in FSL's diffusion toolbox, from which the relevant DTI parameters (FA, MD, AD, and RD) were derived.
To identify ROIs, the FA maps of all subjects were registered into MNI152 space by FLIRT (12 degrees of freedom, cost function=correlation ratio) and the nonlinear registration tool, FNIRT, 52,53 which uses a b-spline representation of the registration warp field 54 (Jacobian range, 0.1–10). The transformation defined in the FA registration was used in turn to register MD, AD, and RD parameter maps into the same MNI152 space. Fifty individual ROIs were identified according to the International Consortium of Brain Mapping (ICBM) DTI-81 WM labels atlas. 55 The ROIs included the (1) genu, body, and splenium of corpus collosum, (2) forceps minor, fornix, and middle cerebellar peduncle, and (3) two unilateral symmetrical ROIs (left/right) each for the anterior corona radiata, anterior limb of internal capsule, cerebral peduncle, cingulum, corticospinal tract, external capsule, inferior cerebellar peduncle, inferior longitidinal fasciculus, inferior fronto-occipital fasciculus, internal capsule, medial lemniscus, posterior corona radiata, posterior limb of internal capsule, posterior thalamic radiation, retrolenticular part of internal capsule, sagittal stratum, superior cerebellar peduncle, superior corona radiata, superior fronto-occipital fasciculus, superior longitudinal fasciculus, tapetum, and uncinate fasciculus.
Because of the large number of ROIs, four summary scores were calculated for each participant and used in all statistical analyses. The four summary scores represent the number of ROIs with FA, MD, RD, and AD values that fell below or above a specified cut-off score for each participant. Cut-off scores were identified by calculating the means and SDs for FA, MD, RD, and AD values in each of the 50 ROIs using the no-WMHI group (n=38). FA values that were >2 SDs below the mean, and MD, RD, and AD values that were >2 SDs above the mean, were classified as reflecting an ROI with “reduced WM integrity” (i.e., abnormal score).
Alcohol measure
The Brief Alcohol Consumption Screen (BACS) is an unpublished four-item quantity/frequency measure designed specifically for this study for the purposes of evaluating alcohol consumption habits that would be consistent with the criteria for “at-risk” drinking established by the National Institute on Alcohol Abuse and Alcoholism (NIAAA 56 ). The BACS produces two summary scores: (1) the number of drinks consumed per week and (2) the number of heavy drinking occasions per year. For the purposes of this study, some parts of the NIAAA criteria for at-risk drinking was considered too stringent for categorizing heavy preinjury alcohol use. We modified the NIAAA criteria relating to the number of heavy drinking occasions per year as follows: (1) women: eight or more drinks per week or four or more drinks on a single occasion more than once per week (i.e., >52 times per year) and (2) men: 15 or more drinks per week or five or more drinks on a single occasion more than once per week (i.e., >52 times per year).
Results
No-WMHI versus 2+WMHI
Descriptive statistics, group comparisons, and Cohen's effect sizes for the four summary DTI scores, and selected demographic and alcohol variables, are presented in Table 1. Group comparisons (using analysis of variance and chi-square analysis) revealed significant main effects for age (p=0.002; Cohen's d=1.10), but not for education or preinjury alcohol use classification (both p>0.05). There were significant main effects (using a negative binomial generalized linear model [GLM]; for the number of abnormal FA, MD, and RD scores (all p<0.012; all d >0.92). Participants in the 2+WMHI group had a significantly greater number of abnormal FA, MD, and RD scores, compared to the No-WMHI group. Of note, although not significant (p=0.065; likely the result of the small sample size), there was a medium to large effect size (d=0.64) for a greater number of AD scores in the 2+WMHI group, compared to the no-WMHI group. When controlling for the influence of age (using negative binomial GLM), there were significant main effects for the number of abnormal FA, MD, and RD scores (all p<0.035), but not for AD (p=0.134). (Exploratory analyses were also undertaken by comparing the no-WMHI group with those participants with one or more WMHIs [i.e., 1+WMHI group]. The overall results remained unchanged. We elected to exclude those participants with a single WMHI because only 2 subjects had one WMHI and the results are not considered generalizable to people with a single WMHI.)
N=48 (no-WMHI, 36; 2+WMHI, 12). See Figure 2 for equations to calculate FA, MD, RD, and AD.
Analysis of variance for age and education; GLM (negative binomial) for the number of abnormal DTI scores; chi-square analysis for preinjury ETOH use.
Negative binomial GLM using age as a covariate.
WMHI, white matter hyperintensities; M, mean; SD, standard deviation; DTI, diffusion tensor imaging; FA, fractional anisotropy; MD, mean diffusivity; RD, radial diffusivity; AD, axial diffusivity; ETOH, alcohol GLM, general linear model.
The cumulative percentages of the number of abnormal FA, MD, RD, and AD scores were calculated and compared between groups (data not shown; available on request). Using chi-square analyses, there was a significantly greater proportion of participants in the 2+WMHI group with abnormal DTI scores, compared to the no-WMHI group for many comparisons. For example, the 2+ WMHI group had a significantly greater proportion of participants with 3 or more abnormal FA (50.0%), MD (83.3%), RD (66.7%), and AD (41.7%) scores, compared to the no-WMHI group (FA [25.0%], MD [19.4%], RD [16.7%], and AD [22.2%] scores, respectively; all p<0.05). Similarly, the 2+WMHI group had a significantly greater proportion of participants with five or more abnormal FA (41.7%), MD (50.0%), and RD (50.0%) scores, compared to the no-WMHI group (five or more abnormal FA [11.1%], MD [5.6%], and RD [8.3%] scores, respectively; see Fig. 2).
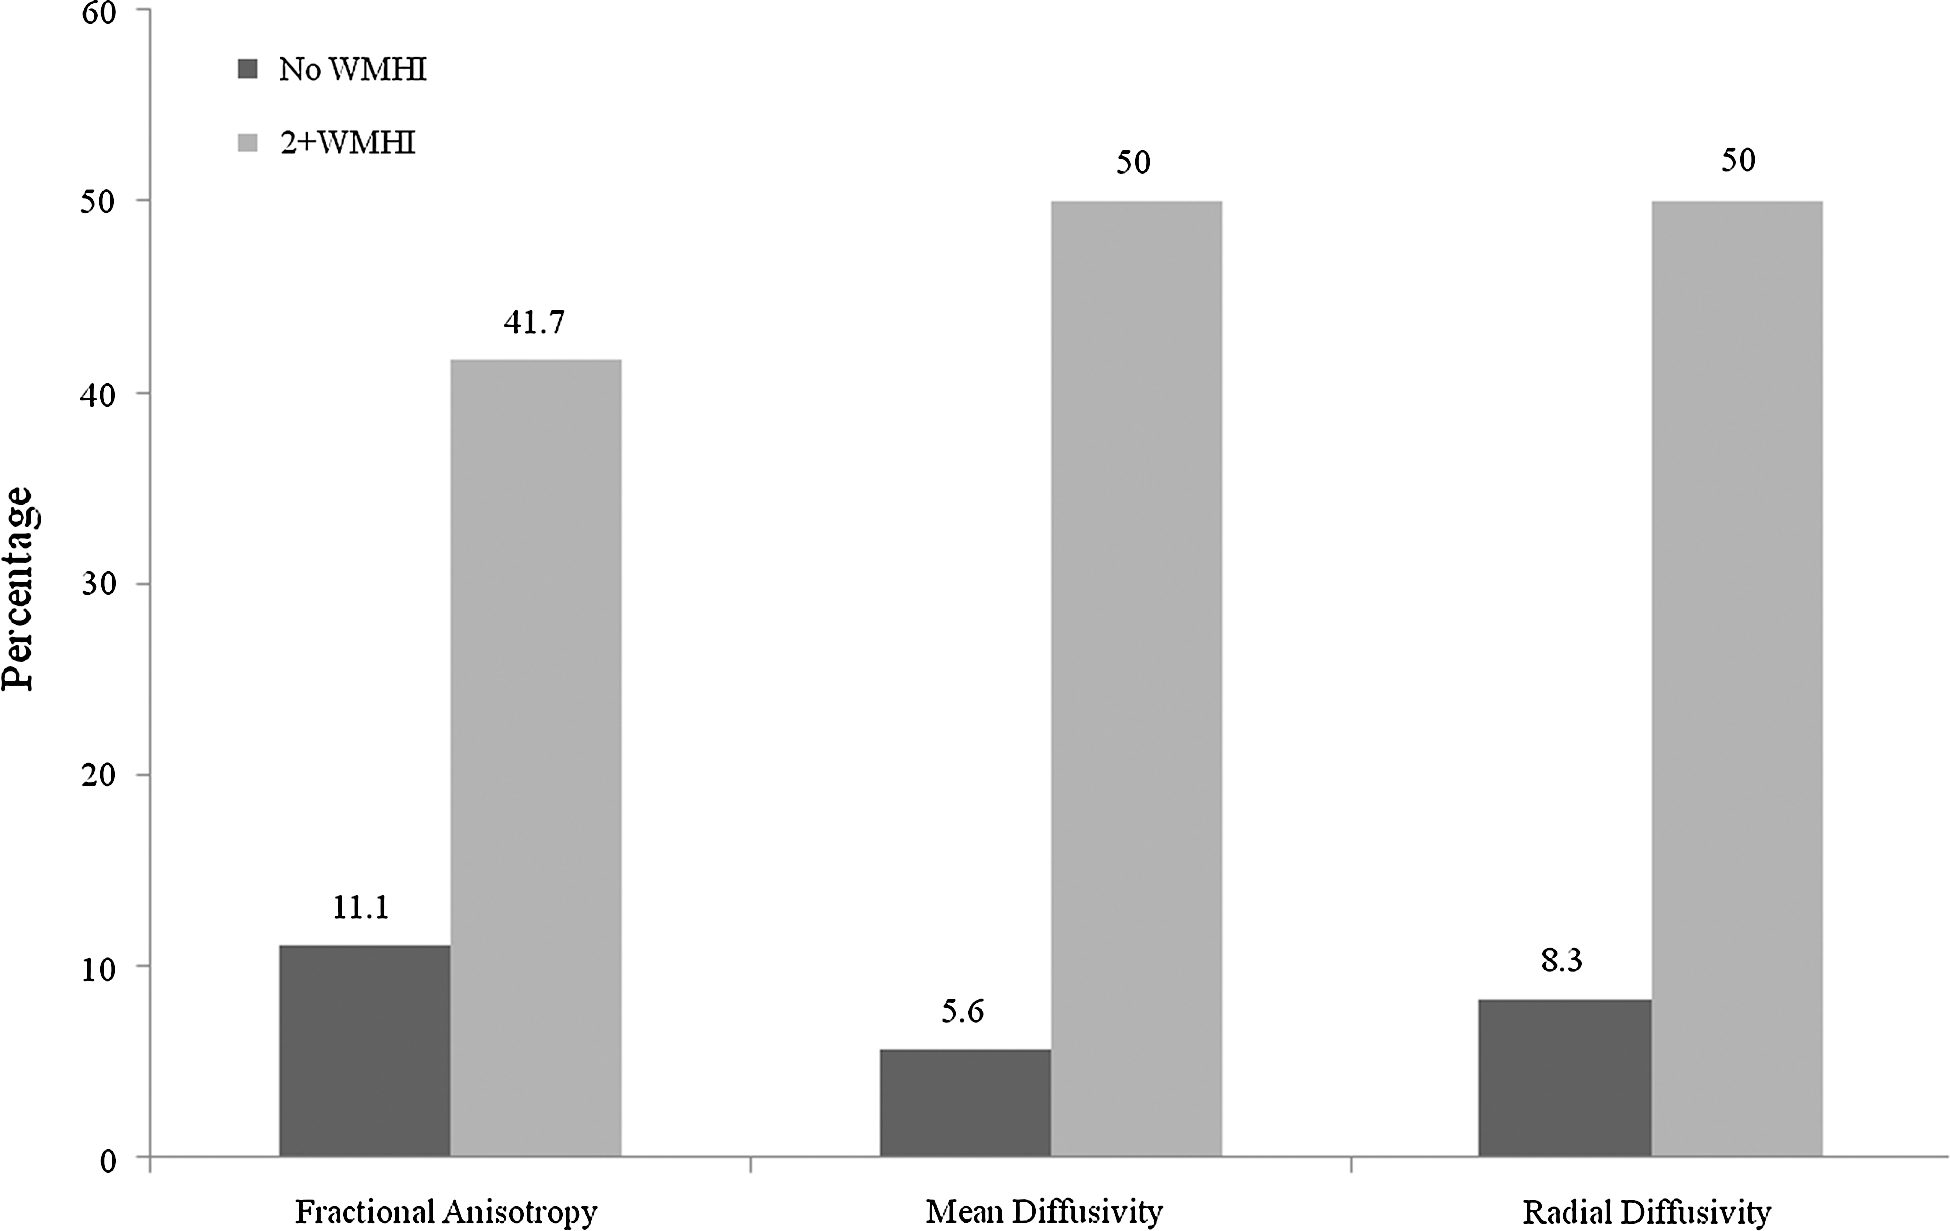
Percentage of participants with five or more “abnormal” fractional anisotropy, mean diffusivity, and radial diffusivity measures (i.e., >2 standard deviations below the mean) when considering 50 regions of interest simultaneously. Comparison of the zero white matter hyperintensities (WMHI) group versus the 2+WMHI group.
For exploratory purposes, all analyses were repeated after dropping small ROIs in the ICBM atlas (i.e., 15 regions with relatively low volume; fornix, and two unilateral symmetrical ROIs [left/right] each for the inferior fronto-occipital fasciculus, medial lemniscus, inferior cerebellar peduncle, superior cerebellar peduncle, superior fronto-occipital fasciculus, tapetum, and uncinate fasciculus). Every significant finding reported above, based on 50 ROIs, remained significant using 35 ROIs, suggesting that the results are unlikely to be from systematic bias in image registration.
No-WMHI versus 2+ WMHI: age matched
To further control the influence of age, an attempt was made to match the 12 participants in the 2+WMHI group with 12 of the 38 participants in the no-WMHI group for age (±5 years). One participant in the 2+WMHI group could not be matched on this criteria. Only participants that were matched in both groups were retained for the analyses (i.e., no-WMHI/age matched, n=11; 2+WMHI/age matched, n=11). Descriptive statistics, group comparisons, and Cohen's effect sizes for the four summary DTI scores, and select demographic variables, are presented in Table 2. There were no significant differences between groups for age (p=0.750; d=0.14) or education (p=0.733; d=0.15). There were significant main effects for the number of abnormal FA, MD, and RD scores (all p<0.017; all d >0.89), but not for AD (p=0.419). Participants in the 2+WMHI/age-matched group had a significantly greater number of abnormal FA, MD, and RD scores, compared to the no-WMHI/age-matched group.
N=22 (11 no-WMHI [age matched], 11; 2+WMHI [age matched], 11). See Figure 2 for equations to calculate FA, MD, RD, and AD.
Analysis of variance for age and education; general linear model (negative binomial) for the number of abnormal DTI scores.
WMHI, white matter hyperintensities; M, mean; SD, standard deviation; DTI, diffusion tensor imaging; FA, fractional anisotropy; MD, mean diffusivity; RD, radial diffusivity; AD, axial diffusivity; ETOH, alcohol.
Examination of the cumulative percentages of the number of abnormal FA, MD, RD, and AD scores revealed a significantly greater proportion of the 2+WMHI/age-matched group with abnormal DTI scores, compared to the no-WMHI/age-matched group for many comparisons. For example, the 2+WMHI/age-matched group had a significantly greater proportion of participants with three or more abnormal FA (45.5%), MD (81.8%), and RD (63.6%), and AD (45.5%) scores, compared to the no-WMHI/age-matched group (FA [18.2%], MD [27.3%], RD [27.3%], and AD [27.3%] scores, respectively).
Discussion
The results of this study are compelling. Participants in the trauma control group who had incidental WMHIs were much more likely to have abnormal areas of WM on DTI than those who had no incidental WMHIs. For example, having five or more regions of diminished WM integrity (of 50), defined as FA scores greater than 2 SDs below the mean, occurred in 41.7% of control participants with WMHIs, compared to only 11.1% of those with no WMHIs. This effect on WM was statistically large and remained after controlling for age.
Another important finding from this study is that participants in the control group (in this case, orthopedically injured controls) will show “abnormal” areas of WM on DTI if multiple ROIs are considered simultaneously. It would be a critical mistake for researchers to assume that abnormal areas of WM are “rare” in control participants. If a single ROI is considered, the cutoff for abnormality is set at 2 SDs below the mean, and the distribution of ROI values are reasonably normally distributed, then only 2% of control participants would be expected to have abnormal WM in this region. However, when we considered 50 ROIs simultaneously and used 2 SDs below the mean for FA as the cutoff for abnormality, we found that 44.4% of control participants with no WMHIs and 83.3% of control participants with two or more WMHIs had at least one area of abnormal WM. When considering the total sample (N=48), 31.3% had three or more, 18.8% had five or more, and 4.2% had 10 or more abnormal FA scores.
Having multiple areas of abnormal WM might be difficult to understand if one assumes that the basic principles of the Gaussian distribution (i.e., the bell curve) are immutable. If a single ROI is considered, then the number of values that occur along the curve within a group of subjects are predictable (i.e., the z-distribution associated with the bell curve). However, when multiple values (and distributions of values within a group) are considered simultaneously, the probability of obtaining one or more low values increases dramatically. This is well established, for example, in the field of neuropsychology where researchers have reported that the probability of obtaining one “impaired” cognitive test score conforms to predictions from the bell curve when considering a single test. However, when considering multiple cognitive test scores simultaneously, it is common for healthy children, adults, and older adults to obtain one or more statistically abnormal score. 57 –60
We believe that the multivariate ROI methodology has tremendous potential in neurotrauma research, especially in mTBI studies. Most TBI studies to date have focused on trying to identify WM problems in specific brain regions. However, the mechanisms of injury and the biomechanics of mTBI are heterogeneous. Therefore, in a sample of patients with mild TBI, WM changes might occur in heterogeneous, not homogenous, brain regions. Applying the multi-variate ROI methodology allows the researcher to determine whether patients with mTBI have more areas of abnormal WM than control participants (when considering multiple areas simultaneously). Statistically, this does not create a problem with multiple comparisons because a single chi-square analysis can be used to test an a priori hypothesis (e.g., a greater percentage of patients with mTBI will have five or more areas of abnormal WM than control subjects).
This study replicates and extends the study by Iverson and colleagues. 45 In that study, healthy control participants with multiple incidental WMHIs were more likely to have multiple abnormal FA scores on DTI. The present study used a different DTI postprocessing methodology, replicated the findings relating to FA, and extends the previous findings to additional DTI measures (i.e., MD and RD). Taken together, these two studies illustrate that WMHIs are an important methodological factor to consider in DTI research.
In conclusion, DTI research in neurotrauma is fraught with methodological challenges. The inclusion and exclusion criteria applied to the TBI versus the control sample can influence DTI findings. Researchers have reported that people with attention deficit hyperactivity disorder, 1 substance abuse, 5 and depression 4 are at risk for having altered WM integrity—and these pre-existing clinical conditions are often present in people who sustain TBIs. Therefore, if pre-existing clinical conditions are an exclusion criterion for the control group, but not the clinical group, then some of the WM findings in the study could be owing, at least in part, to these (and potentially other) pre-existing conditions. A less-obvious methodological problem relates to the presence of pre-existing, incidental WMHIs in control and clinical groups. Researchers who include participants with WMHIs in both control and clinical groups will have more heterogeneous (and representative) samples, but this heterogeneity might reduce the likelihood of finding significant differences between groups. Excluding subjects with WMHIs from the control group, but not the clinical group, will systematically bias the results and increase the likelihood that DTI differences might be owing, in part at least, to preinjury differences in WM. It is possible that failing to control for preinjury differences in WM integrity (by excluding control participants with WMHIs, but not clinical participants with pre-existing WMHIs) has resulted in a systematic bias in the mild neurotrauma literature to date. There is not an easy solution to this problem, however, because we do not have an accurate methodology for determining the etiology of WMHIs. Therefore, in neurotrauma samples, we usually cannot be sure whether WMHIs are pre-existing, trauma related, or are caused by an unrelated postinjury medical factor (e.g., hypertension). Future researchers need to consider carefully, and describe explicitly, how they deal with WMHIs in neurotrauma studies.
Footnotes
Acknowledgments
This study was partly supported by competitive research funding from the Alcohol Beverage Medical Research Foundation and the Canadian Institutes of Health Research (CIHR).
R.L. notes that the views expressed in this article are those of the authors and do not reflect the official policy of the Department of Defense or U.S. government.
J.B.'s research program is supported by a scholar award from the Michael Smith Foundation for Health Research. A.R.'s research is supported by the CIHR New Investigator Award Program and by the National Sciences and Engineering Research Council of Canada.
The authors thank Jan Buchanen, Liz Holland, Lisa Casagrande Hoshino, and Angela Aquino for their assistance with patient recruitment and testing as well as the staff at the University of British Columbia MRI Research Center for the provision of neuroimaging services.
Author Disclosure Statement
G.I. has been reimbursed by the government, professional scientific bodies, and commercial organizations for discussing or presenting research relating to mTBI and sport-related concussion at meetings, scientific conferences, and symposiums. He has a clinical and consulting practice in forensic neuropsychology involving individuals who have sustained mTBIs.