




Abstract
This study investigates the potential clinical utility in the emergency department (ED) of an index of brain electrical activity to identify intracranial hematomas. The relationship between this index and depth, size, and type of hematoma was explored. Ten minutes of brain electrical activity was recorded from a limited montage in 38 adult patients with traumatic hematomas (CT scan positive) and 38 mild head injured controls (CT scan negative) in the ED. The volume of blood and distance from recording electrodes were measured by blinded independent experts. Brain electrical activity data were submitted to a classification algorithm independently developed traumatic brain injury (TBI) index to identify the probability of a CT+traumatic event. There was no significant relationship between the TBI-Index and type of hematoma, or distance of the bleed from recording sites. A significant correlation was found between TBI-Index and blood volume. The sensitivity to hematomas was 100%, positive predictive value was 74.5%, and positive likelihood ratio was 2.92. The TBI-Index, derived from brain electrical activity, demonstrates high accuracy for identification of traumatic hematomas. Further, this was not influenced by distance of the bleed from the recording electrodes, blood volume, or type of hematoma. Distance and volume limitations noted with other methods, (such as that based on near-infrared spectroscopy) were not found, thus suggesting the TBI-Index to be a potentially important adjunct to acute assessment of head injury. Because of the life-threatening risk of undetected hematomas (false negatives), specificity was permitted to be lower, 66%, in exchange for extremely high sensitivity.
Introduction
P
Prichep and colleagues 1 described the development of the TBI-Index, which was based on brain electrical activity recorded from a limited forehead montage using a handheld device. This index demonstrated high sensitivity and specificity in the identification of mTBI. Using this index on ED patients with mTBI with CT findings, it was found that CT positive patients (CT+) could be discriminated from normal ED controls and from CT negative patients with mTBI (CT-), with high sensitivity, specificity, and negative predictive validity (NPV, percentage of CT- patients correctly identified as having a negative diagnosis). 2,3 Comparing the accuracy of detection of CT+injuries using the TBI-Index and the New Orleans Criteria (NOC, guidelines for referral for CT in the ED), O'Neil and colleagues 3 reported that the specificity of the TBI-Index was more than double that of the NOC in the same patients, thus potentially reducing the need to refer for CT scans in those who were, in fact, found to be CT-.
A number of recent publications have evaluated the use of near-infrared spectroscopy (NIS) to assess the presence of a cerebral hematoma in patients who present with mTBI. Such studies reveal limitations of the efficacy of those assessments including hematoma type, location, and depth. 4 –7 These limitations greatly restrict the clinical utility of the reported results.
The present study was designed to investigate the potential clinical utility of the TBI-Index of brain function in the ED to identify the presence of various types of intracranial hematomas. In addition, the relationships between the TBI-Index and the depth and size of intracranial hematomas were explored.
Methods
Patient population
The study population consisted of a retrospective sample of 274 ED patients who presented with head injury and received CT scans. Patients were enrolled in the ED at one of the ten sites of the study (the majority from Washington University, Barnes Jewish Hospital, Bellevue Hospital Center, and William Beaumont Royal Oak Hospital), after a closed head injury and meeting the inclusion/exclusion criteria described below. From this, a convenience sample of 38 patients were found to have an intracranial hematoma based on CT scans obtained after ED admission. A control group of 38 patients with mTBI whose subsequent CT findings were negative was matched to the hematoma group for sex and age and was selected from the same above sample of 274 ED head-injured patients.
All sites received approval from their respective Human Subjects Research Committees. Written informed consent was obtained before testing of all subjects. Assessment of the capacity of the subject to give informed consent was performed using the Conley criteria. 8 mTBI was defined using the American Congress of Rehabilitation criteria, meeting one of the following: (1) any period of loss of consciousness (LOC) <30 min and Glasgow Coma Scale (GCS) score of 13–15 after LOC; (2) any loss of memory for the event immediately before or after the injury, with post-traumatic amnesia less than 24 h; (3) any alteration in mental state at the time of the event, such as being dazed, disoriented, or confused. From this sample 38 patients were confirmed to have intracranial bleeding based on blinded, adjudicated assessment of ED CT scans.
Inclusion/exclusion criteria
Male and female patients between the ages of 18 and 86 years of age who presented to the ED after a closed head injury and met the above mTBI definition were eligible for inclusion. Patient enrollment occurred during all periods when the research assistants were available and were not selected by referral from treating physicians. Only those patients who had a CT scan of the head ordered as part of their clinical evaluation were included in this mTBI sample. Patients were excluded if clinical conditions would not allow placement of the electrodes, or if they were obtunded from intoxication to the point at which they could not provide informed consent. In addition, patients with known psychiatric disorders, including chronic drug or alcohol abuse disorders, chronic seizure history, mental retardation, or who were currently taking prophylactic CNS active medication for a chronic psychiatric condition, were not eligible for the study. If the head injury occurred after a seizure, the patient was not a candidate for this study.
Electroencephalographic (EEG) recording was made before discharge home and as early as practically possible in the workup of the patient that would not hinder the care of the patient, with the vast majority (>85%) tested within 24 h.
CT scans
All CT-scans were initially reviewed by the radiologists/neuroradiologists at each local site of the study. All scans were performed within 20 h of the EEG data acquisition, with a mean of 8.8 h (80% were ≤12 h, and were in the time frame of the standard of care practiced at the ED site of acquisition). There was no significant difference in mean times between the CT+or CT- populations (t=−0.535 p=0.293) evaluations. All measurements of intracranial hematomas were calculated by two independent neuroradiologically trained technician readers (AM and TM), blinded to the EEG results. The results were reviewed for congruence, and all discrepancies, as well as a random sample of 20%, were adjudicated by a third physician reader (DH).
Each hematoma was classified in terms of the lobe or lobes of the brain compromised (frontal, parietal, temporal, or occipital), the hemisphere of the brain region affected (left or right), by hematoma type (epidural [EPH]; subdural [SDH]; or intracerebral [ICH]), and whether or not a subarachnoid hemorrhage (SAH) was also present.
Quantitative measurements of the volume of blood within the hematoma were performed with operator-defined region of interest segmentation using Osirix 9 (Fig. 1). To account for multiple hematomas, a single volume was attributed to each unique bleeding location. For blood spanning multiple lobes but the result of a single bleeding event, a single volume was placed under the lobe corresponding to the epicenter of the bleed (i.e., a left hemispheric SDH concentrated in the parietal lobe was measured across all lobes with one volume marked under P SDH). It is important to note that SAHs were not assigned a volume.
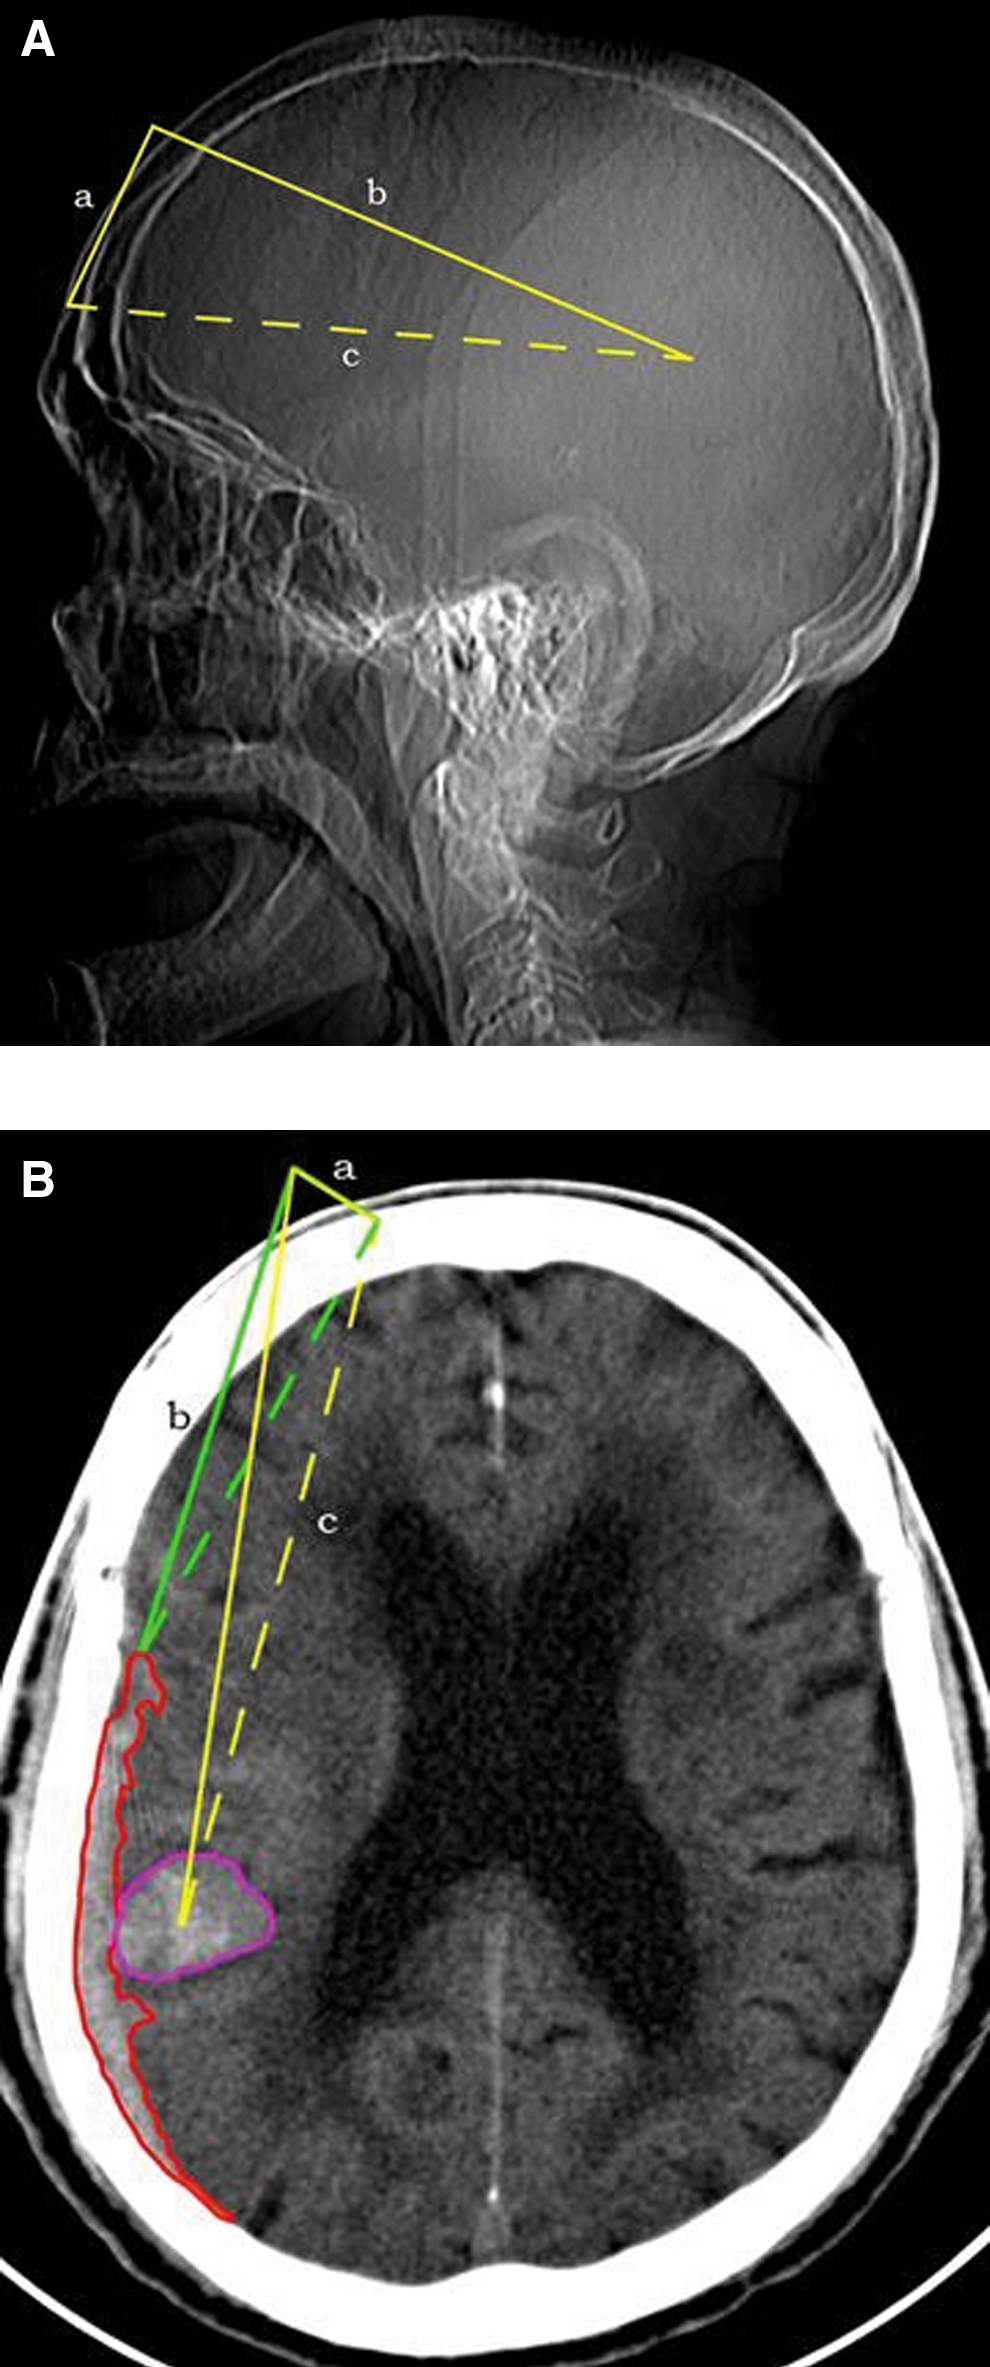
(
A quantitative measure of the distance of the bleeding event from the location of the EEG electrodes (midpoint between FP1 and FP2) was performed. Two linear measurements (mm) were performed for each unique bleeding event. The first measurement corresponded to the shortest distance from the bleeding location to the skull surface location of the BrainScope sensor, FP1 or FP2, depending on the cerebral hemisphere containing the hematoma. The second measurement corresponded to the distance from the same sensor used in the first linear measurement to the epicenter of the bleed. In some cases, the shortest distance to a bleed needed measurement to one lobe while the epicenter was located in a different lobe. SAHs were not measured for linear distances.
Electrophysiological evaluation
All subjects underwent 10 minutes of eyes closed resting EEG recording acquired on a handheld device. The EEG recordings were made from frontal electrode sites of the international 10/20 system using self-adhesive electrodes pasted on the forehead and referenced to linked ears. The frontal electrode sites included FP1, FP2, AFz (located just anterior to Fz on the forehead, below the hairline), F7, and F8. All electrode impedances were below 10 kΩ. Amplifiers had a bandpass from 0.5 to 70 Hz (3 dB points). Electrode placement in all cases was completed in less than 5 minutes. The EEG data were subjected to artifact rejection to remove any biologic and non-biologic contamination, such as that from eye movement or muscle movement. Previous experience has demonstrated that sufficient artifact-free data (60–120 sec) can be obtained from this 10-minute recording (85% in less than 5 minutes).
Quantitative analysis of brain electrical activity
The artifact-free EEG data were then submitted for quantitative analyses off-line to calculate an independently developed quantitative EEG (QEEG) quadratic discriminant function, which was derived to maximally separate a normal ED control population (n=255) from patients who had a TBI/concussion (TBI; n=358). This discriminant function had high sensitivity and specificity for distinguishing patients with structural brain damage (CT+) from those with concussions or those with normal brain function (ED controls). 2
This binary discriminant classification algorithm was constructed using iterative methods and cross-validation (leave-one-out and 10-fold) 10 based on features extracted from all patients in the algorithm development database. The algorithm consists of a weighted combination of selected linear and nonlinear features of brain electrical activity, which mathematically describe the profile of TBI as distinguished from normal brain activity or brain activity compromised by concussion. The result is expressed as a discriminant score or index (TBI-Index) used to classify the patient as most probably belonging to the CT+population based on a threshold determined on the receiver operator curve of the discriminant function. Based on this threshold, this algorithm has been demonstrated to have a sensitivity of 95% and NPV of 98%. 1
This Index was calculated off-line for each subject in the study, blinded to any information about the clinical status of the patient. It is important to point out that patient age was taken into account before calculation of the TBI-Index because all EEG features were age-regressed before inclusion in discriminant analyses. 11
Results
The 38 hematoma patients were age and sex matched (27 males and 11 females) with 38 ED control patients with mTBI whose CT scans were negative. The mean age for the hematoma group was 55.1 years (18.19–86.8), and the mean age for the CT- controls was 53.2 years (18.16–79.74). There was no significant difference for age between the two groups (t=–1.43, p=0.33). All cases were scored using the Marshall Score grading the severity of the CT+finding. Thirty-two cases were Marshall Score 2, 2 were 3, 1 was 4, and 3 were 5. CT- controls had Marshall Scores of 1. With respect to the American Congress of Rehabilitation criteria for mTBI, there were no significant differences between CT+and CT- subjects for presence of amnesia (chi-square 1.134, p=0.2869), altered mental status (chi-square 1.545, p=0.2139), or GCS (chi-square 3.504, p=0.0612), but significantly more of the CT+group reported brief LOC (chi-square 12.336, p=0.0004).
Neuroradiological findings
For the 38 hematoma patients the locations of the hematomas are shown in Table 1 below. Among these there were: 6 epidural hematomas (EDH), one of which was accompanied by a SAH; 14 subdural hematomas (SDH), 9 of which also had a SAH; and 19 intracranial hematomas (ICH), 13 of which also had a SAH, and 6 who also had a SDH. Hematomas in all regions of interest (frontal, parietal, occipital and temporal) were represented in this sample and both hemispheres were represented.
Correponds to the largest volume of blood.
R, right; SDH, subdural hematoma; SAH, subarachnoid hemorrhage; ICH, intracerebral hematoma; L, left; EDH, epidural hematoma.
Table 2 gives the volume of blood measured both for the largest volume within a single region and for the total volume across regions. The average amount of measured bleeding was 12.14 mL (standard deviation [SD]=16.41), with the largest volume summed across regions equal to 13.76 mL (SD=18.48) and the range of blood detected 0.13–59.51 mL. The smallest blood volumes measured were those confined to a single 2–5 mm CT slice. There were no significant differences found between the type of hematoma and the volume of blood, with mean values of 4.5 mL for EDH, 18.3 mL for SDH, and 12.9 mL for ICH (sum: F=1.2, p=0.3, single largest region: F=1.6, p=0.2).
Column showing largest volume corresponds to the region indicated by “a” in Table 1, for the location of the largest volume.
SD, standard deviation.
Also shown in Table 2 is the distance from the frontal electrode sites where the brain electrical activity was measured to the closest presence of blood and also to the epicenter of that bleed. The mean distance from the recording electrodes to the closest blood measured was 55.16 mm (SD=32.37) and to the epicenter of the bleed was 78.45 mm (SD=40.35), with a range of 4.88–160.51 mm. There was a significant difference found between type of hematoma and distance to the epicenter of the bleed with 86.6 mm for EDH, 94.8 mm for SDH, and 61.2 mm for ICH (F=3.3, p=0.04).
TBI-Index
The TBI-Index is based on a binary discriminant function with a threshold above which a CT+finding is predicted (see details of the Index elsewhere 1 ). Table 3 shows the contingency table for the accuracy of the TBI-Index for discriminating the hematoma patients from the mTBI CT- patients.
CT, computed tomography.
Based on the application of the TBI-Index to the hematoma and mTBI CT- control cases in this study, sensitivity to hematomas was 100%, specificity was 66%, positive predictive value (PPV) was 74.5%, and positive likelihood ratio (PLR) was 2.92. With sensitivity of 100%, NPV was 100% and negative likelihood ratio (NLR) was 0.
Although the TBI-Index is a binary classifier and, in this sample, all hematoma cases were correctly identified as being CT+, it is of interest to look at the correlation with the individually obtained discriminant scores and the volume and distance measures made. A significant correlation between the TBI-Index and the volume of blood present was found for the largest single region (r=.36; p=0.028) and for the sum or total volume across regions (r=0.38, p=0.019). There were no significant differences found between the TBI-Index and the shortest distance to the bleed (r=−0.13, p=0.432) or to the epicenter of the bleed (r=.03; p=0.854). The TBI-Index did not vary as a function of hematoma type with the average discriminant score for SDH=84.2 (SD=21.4), ICH=79.9 (SD=24.9), and EDH=62.6 (SD=35.7). The mean discriminant score for the mTBI CT- control group was 16.7.
Of most importance is the finding that the TBI-Index was equally sensitive for indicating abnormal function for EPH, SDH, and ICH, was not influenced by the distance of the hematoma from the recording electrodes, and was not influenced by the presence or absence of a co-occurring SAH.
Discussion
The results of the present study continue to support the hypothesis that the TBI-Index of brain function/dysfunction can be used to correctly identify in the ED mTBI patients with intracranial hematoma seen on CT scan. While this tool is not a substitute for a CT scan, the data suggest the clinical utility of the tool as an adjunct to clinical practice currently used for triage of patients with mTBI or in those situations where CT scans are not readily available. Importantly, sensitivity to mass lesions in the clinically critical epidural, subdural, and cerebral hemisphere compartments is demonstrated.
Although not quantified, the algorithm also appears sensitive to SAH. Because emergency treatments exist for each of these locations, the potential to add clinically directive value to emergent care by sensitive screening for all types of brain bleeding and promoting rapid definitive diagnosis with CT appears promising.
The variables that contributed most to the classification algorithm included monopolar and bipolar scale-free features for the total spectrum that evaluates the global complexity of the brain electrical activity, especially in the theta frequency band; monopolar and bipolar power shifts, especially in theta; disturbances in coherence relationships between regions, especially in high frequencies (alpha2, gamma); shifts in phase synchrony, especially in high frequencies, and fractal features. The fact that all subjects in this study were classified as abnormal on this discriminant suggests that these features are useful in describing the changes in brain electrical activity seen in this subpopulation.
Further, the TBI-Index score varied as a function of the size of the bleed with larger scores for larger volumes. Thus, this technique may also prove useful for following patients with documented intracranial hematoma for expansion of lesions when expectant observation is being performed in lieu of surgery or for patients with EPH during a lucid interval. It may prove capable of defining interval change in bleeding mass and therefore be useful in determining if repeated CT is advised. The fact that the EEG analyzed within this study was collected from an easily applied frontal montage of recording electrodes using a handheld device increases its clinical utility for environments that would not be suitable for conventional EEG collection.
The Food and Drug Administration (FDA) recently issued approval of a handheld near-infrared brain hematoma detection device. In the application for this device, clinical data were reported showing a sensitivity of 74.6% for the detection of ICH greater than 3.5 mL and less than 2.5 cm from the brain surface. Specificity was 81.6% for no hematoma or hematoma less than 3.5 mL and greater than 2.5 cm from the brain surface. These limitations for size and location were stipulated in the FDA cleared Indications for Use, 12,13 potentially reduce NIS clinical utility. In contrast, correct identification of mTBI hematoma using the TBI-Index was independent of lobar location as defined by measuring the distance from the forehead recording electrodes to the site of the bleed, with bleeds in the frontal, parietal, occipital, and temporal regions all being correctly identified. More specifically, the majority of the hematomas were located farther from the brain surface, with smaller volumes than the limitations that apply to the Infrascan, with 29 of the 38 (based on shortest distance) and 34 of the 38 (based on distance to epicenter) located greater than 2.5 cm from the recording electrodes and 18 of the 38 (based on largest volume) and 16 of the 38 (based on total volume) with volumes less than 3.5 mL.
Strong evidence was presented that the TBI-Index was not influenced by the distance of the bleed from the EEG recording electrodes. It was also sensitive to a wide and clinically important range of bleed volumes. Thus, this radiographic evaluation of bleed type and location is consistent with the hypothesis that the TBI-Index algorithm can identify all types of intracranial bleeding. Although this data set is small, it did not demonstrate the distance related limitation of detection sensitivity noted above with methods based on NIS.
There are several limitations to the above study. The number of hematoma patients was small, especially when one attempts to look at results across regions of the brain impacted by the hematoma. The number of EPH in the present study was limited in respect to those with SDH and ICH. Many subjects had multiple locations for their hematomas. The lack of a “gold standard” for the CT- group is another weakness. It is noted that the stratification of risk was heavily on the side of correct detection of hematomas, resulting in a lower than otherwise specificity in CT- brain-injured patients. While the CT+and CT- controls were well matched (age, sex, and symptoms of mTBI), there was a higher incidence of reported brief LOC at the time of the injury in the CT+group, suggesting that the inclusion of a CT- control group matched for LOC might be important to explore.
The high mean age of our patient samples (55 years) appeared to be a function of our clinical criteria that selected a moderately severe injury with a range of brain bleedings in still conscious (GCS >8) subjects. Because this sample was taken from a set of 10 EDs, it was believed to be representative of ED populations, and together with the use of age regression of all EEG features, believed to be generalizable across the adult age range. Another concern about generalizability relates to exclusion criteria. These criteria, however, were necessarily applied to minimize problems of informed consent. While obtunded subjects were not candidates for this study, the presence of drugs and/or alcohol per se was not a criterion for exclusion, and such subjects were not found to perform differently on the algorithm. Future studies may more fully examine the effects of higher levels of alcohol and drugs and the presence of known substance dependence disorders on the performance of the TBI-Index.
Conclusions
EEG based measures of brain function/dysfunction may provide information suggesting the presence of an ICH in patients with mTBI presenting to the ED. While such a tool is not meant to replace a CT scan, it offers a possible alternative to be used in triage situations or in situations where no CT scan is available. For example, it could be implemented while transporting a patient from an accident scene to a hospital where more extensive testing would be available. The present results suggest that this technology is sensitive to the presence of EDH, SDH, and ICH and is not restricted to large hematomas only and not restricted by the distance of the hematoma from EEG recording electrodes. Future studies should examine: a greater number of CT+subjects, the effects of chronic drug and alcohol disorders on sensitivity and specificity levels, as well as to study serial TBI-Index recordings after hematoma to document future increased bleeding events.
Footnotes
Acknowledgments
The authors acknowledge the contributions of those who made this research possible, including the primary investigators and research technicians at all the clinical sites and the patients who volunteered. This research was supported by BrainScope Co., Inc., Bethesda, MD, who granted expenses related to data acquisition.
Author Disclosure Statement
This research was supported by a clinical research grant from BrainScope Company, Inc., to the clinical sites participating in data acquisition (two of these Principal Investigators are Drs. Naunheim and Sheth, co-authors). Dr. Chiang served as a Principal Investigator at one of the sites that did not receive direct funding from BrainScope Company, Inc. Drs. Prichep and Chabot serve as consultants to BrainScope Company, Inc., and Dr. Prichep holds financial interest, through patented technology. Dr. Hanley sits on the Medical Advisory Board of BrainScope Company, Inc. W.A. Mould and Timothy Morgan were paid consultants who performed the hematoma measurements, blinded to all other data. BrainScope had no role in the conduct of the studies, analysis of the data, or preparation of manuscripts. Strict adherence to ethical concerns was followed, and all subjects signed written informed consents for participation in the study.