




Abstract
Neuron-specific enolase (NSE) has been suggested as a prognostic biomarker for neuronal alterations resulting from conditions such as traumatic brain injury (TBI), neurodegenerative disease, or cardiac arrest. To validate serum NSE (sNSE) as a brain-specific biomarker, we related it to functional brain imaging data in 38 healthy adults to create a physiological framework for future studies in neuropsychiatric diseases. sNSE was measured by monoclonal two-site immunoluminometric assays, and functional connectivity was investigated with resting-state functional magnetic resonance imaging (rfMRI). To identify neural hubs most essentially related to sNSE, we applied graph theory approaches, namely, the new data‐driven and parameter‐free approach, eigenvector centrality mapping. sNSE and eigenvector centrality were negatively correlated in the female cerebellum, without any effects in male subjects. In cerebellar cortex, NSE expression was significantly higher than whole-brain expression as investigated in the whole brain and whole genome-wide atlas of the Allen Institute for Brain Sciences (Seattle, WA). Our study shows a specific linkage between the neuronal marker protein, sNSE, and cerebellar connectivity as measured with rfMRI in the female human brain, although this finding shall be proven in future studies including more subjects. Results suggest that the inclusion of sNSE in the analysis of imaging data is a useful approach to obtain more-specific information on the neuronal mechanisms that underlie functional connectivity at rest. Establishing such a baseline resting-state pattern that is tied to a neuronal serum marker opens new perspectives in the characterization of neuropsychiatric disorders as disconnective syndromes or nexopathies, in particular, resulting from TBI, neurodegenerative disease, or cardiac arrest, in the future.
Introduction
A
Besides structural parameters, recent imaging studies in the growing field of connectomics investigate functional connectivity and its changes resulting from diseases in the human brain. 9,10 Focusing on this aspect, neuropsychiatric diseases have been coined nexopathies recently. 11 Whereas sNSE allows the neuronal function and damage in neuropsychiatric disorders to be easily investigated, the specificity of sNSE for functional brain connectivity has not been investigated in vivo until now. To identify neural hubs most essentially related to sNSE, we applied graph theory approaches, namely, the new data‐driven and parameter‐free approach, eigenvector centrality (EC) mapping. 9,10 Here, a voxel receives a large value if it is strongly correlated with many other nodes that are themselves central within the network—similar to Google's PageRank algorithm. This method was chosen because it seems to outclass other connectivity measures, such as seed-based approaches or independent component analysis, because of its assumption-free nature and because it has already been validated in other studies. 10 We investigated the association between sNSE and brain-imaging data in healthy subjects to create a physiological framework for future studies in neuropsychiatric diseases.
Methods
Resting-state functional magnetic resonance imaging (rfMRI) data were investigated in 38 healthy adults (18 female and 20 male; age, 30±8 [standard deviation] years). There was no significant difference between women and men for age (29.9±8.1 vs. 29.7±7.4 years; p=0.92), and body mass index (21.4±3.6 vs. 23.1±3.1 kg/m2; p=0.13). Imaging was performed with a 3 T TIM Trio Scanner (Siemens, Medical Solutions, Erlangen, Germany) and a 32-channel head coil using a T2*-weighted gradient-echo echo planar imaging (EPI) sequence (flip angle=90 degrees; repetition time=2300 ms; echo time=30 ms) with 300 repetitions. Preprocessing was performed using Statistical Parametric Mapping 8 (SPM8) with MATLAB 7 (The MathWorks, Inc., Natick, MA), including estimation and correction for motion and EPI deformation. Thereafter, functional images were coregistered with the high-resolution anatomical image, and normalization was performed using the unified segmentation approach. 12 Finally, functional images were smoothed using a Gaussian smoothing kernel of 8 mm full width at half maximum.
For each participant, an EC map 13 was calculated from the rfMRI signal using the LIPSIA software package. 14 For all voxels within a GM mask, a similarity matrix was generated including Person's correlation coefficients between all rfMRI time courses. In order to use a similarity matrix with only positive numbers, a value of 1 was added to all matrix entries before computing EC. According to the theorem of Peron and Frobenius, this similarity matrix has a unique real largest eigenvalue, and the corresponding eigenvector has strictly positive components. Then, the EC map was generated using the components of this eigenvector to determine the EC of all voxels.
sNSE was measured by monoclonal two-site immunoluminometric assays, as previously described in detail, 5,8 with a mean sNSE concentration of 10.3±2.1 μg/L (range, 7.1–15.1). In order to investigate the relationship between sNSE and brain network connectivity, statistical analysis was performed across all EC maps using the general linear model including sNSE as a regressor. The model also included the participant's gender as a further factor to investigate the interaction between both sNSE and gender. Age was used as a nuisance covariate. Informed consent was obtained from subjects. The research protocol was approved by the ethics committee of the University of Leipzig (Leipzig, Germany).
Results
As illustrated in Figure 1, the analysis revealed a negative correlation between sNSE and EC in the female cerebellum. In male subjects, we did not find such an association. Although one has to be aware of the relatively small number of subjects and accordingly limited statistical power in our pilot study, the interaction analysis confirmed this gender-specific finding, even using false discovery rate correction at p<0.05. Thus, this inverse relationship between sNSE and EC appears to be specific to women. The SPM Anatomy toolbox assigned these changes most consistently and bilaterally to Lobule VIIa and Crus II—parts of the cognitive cerebellum related to executive, spatial, and linguistic functions. 5
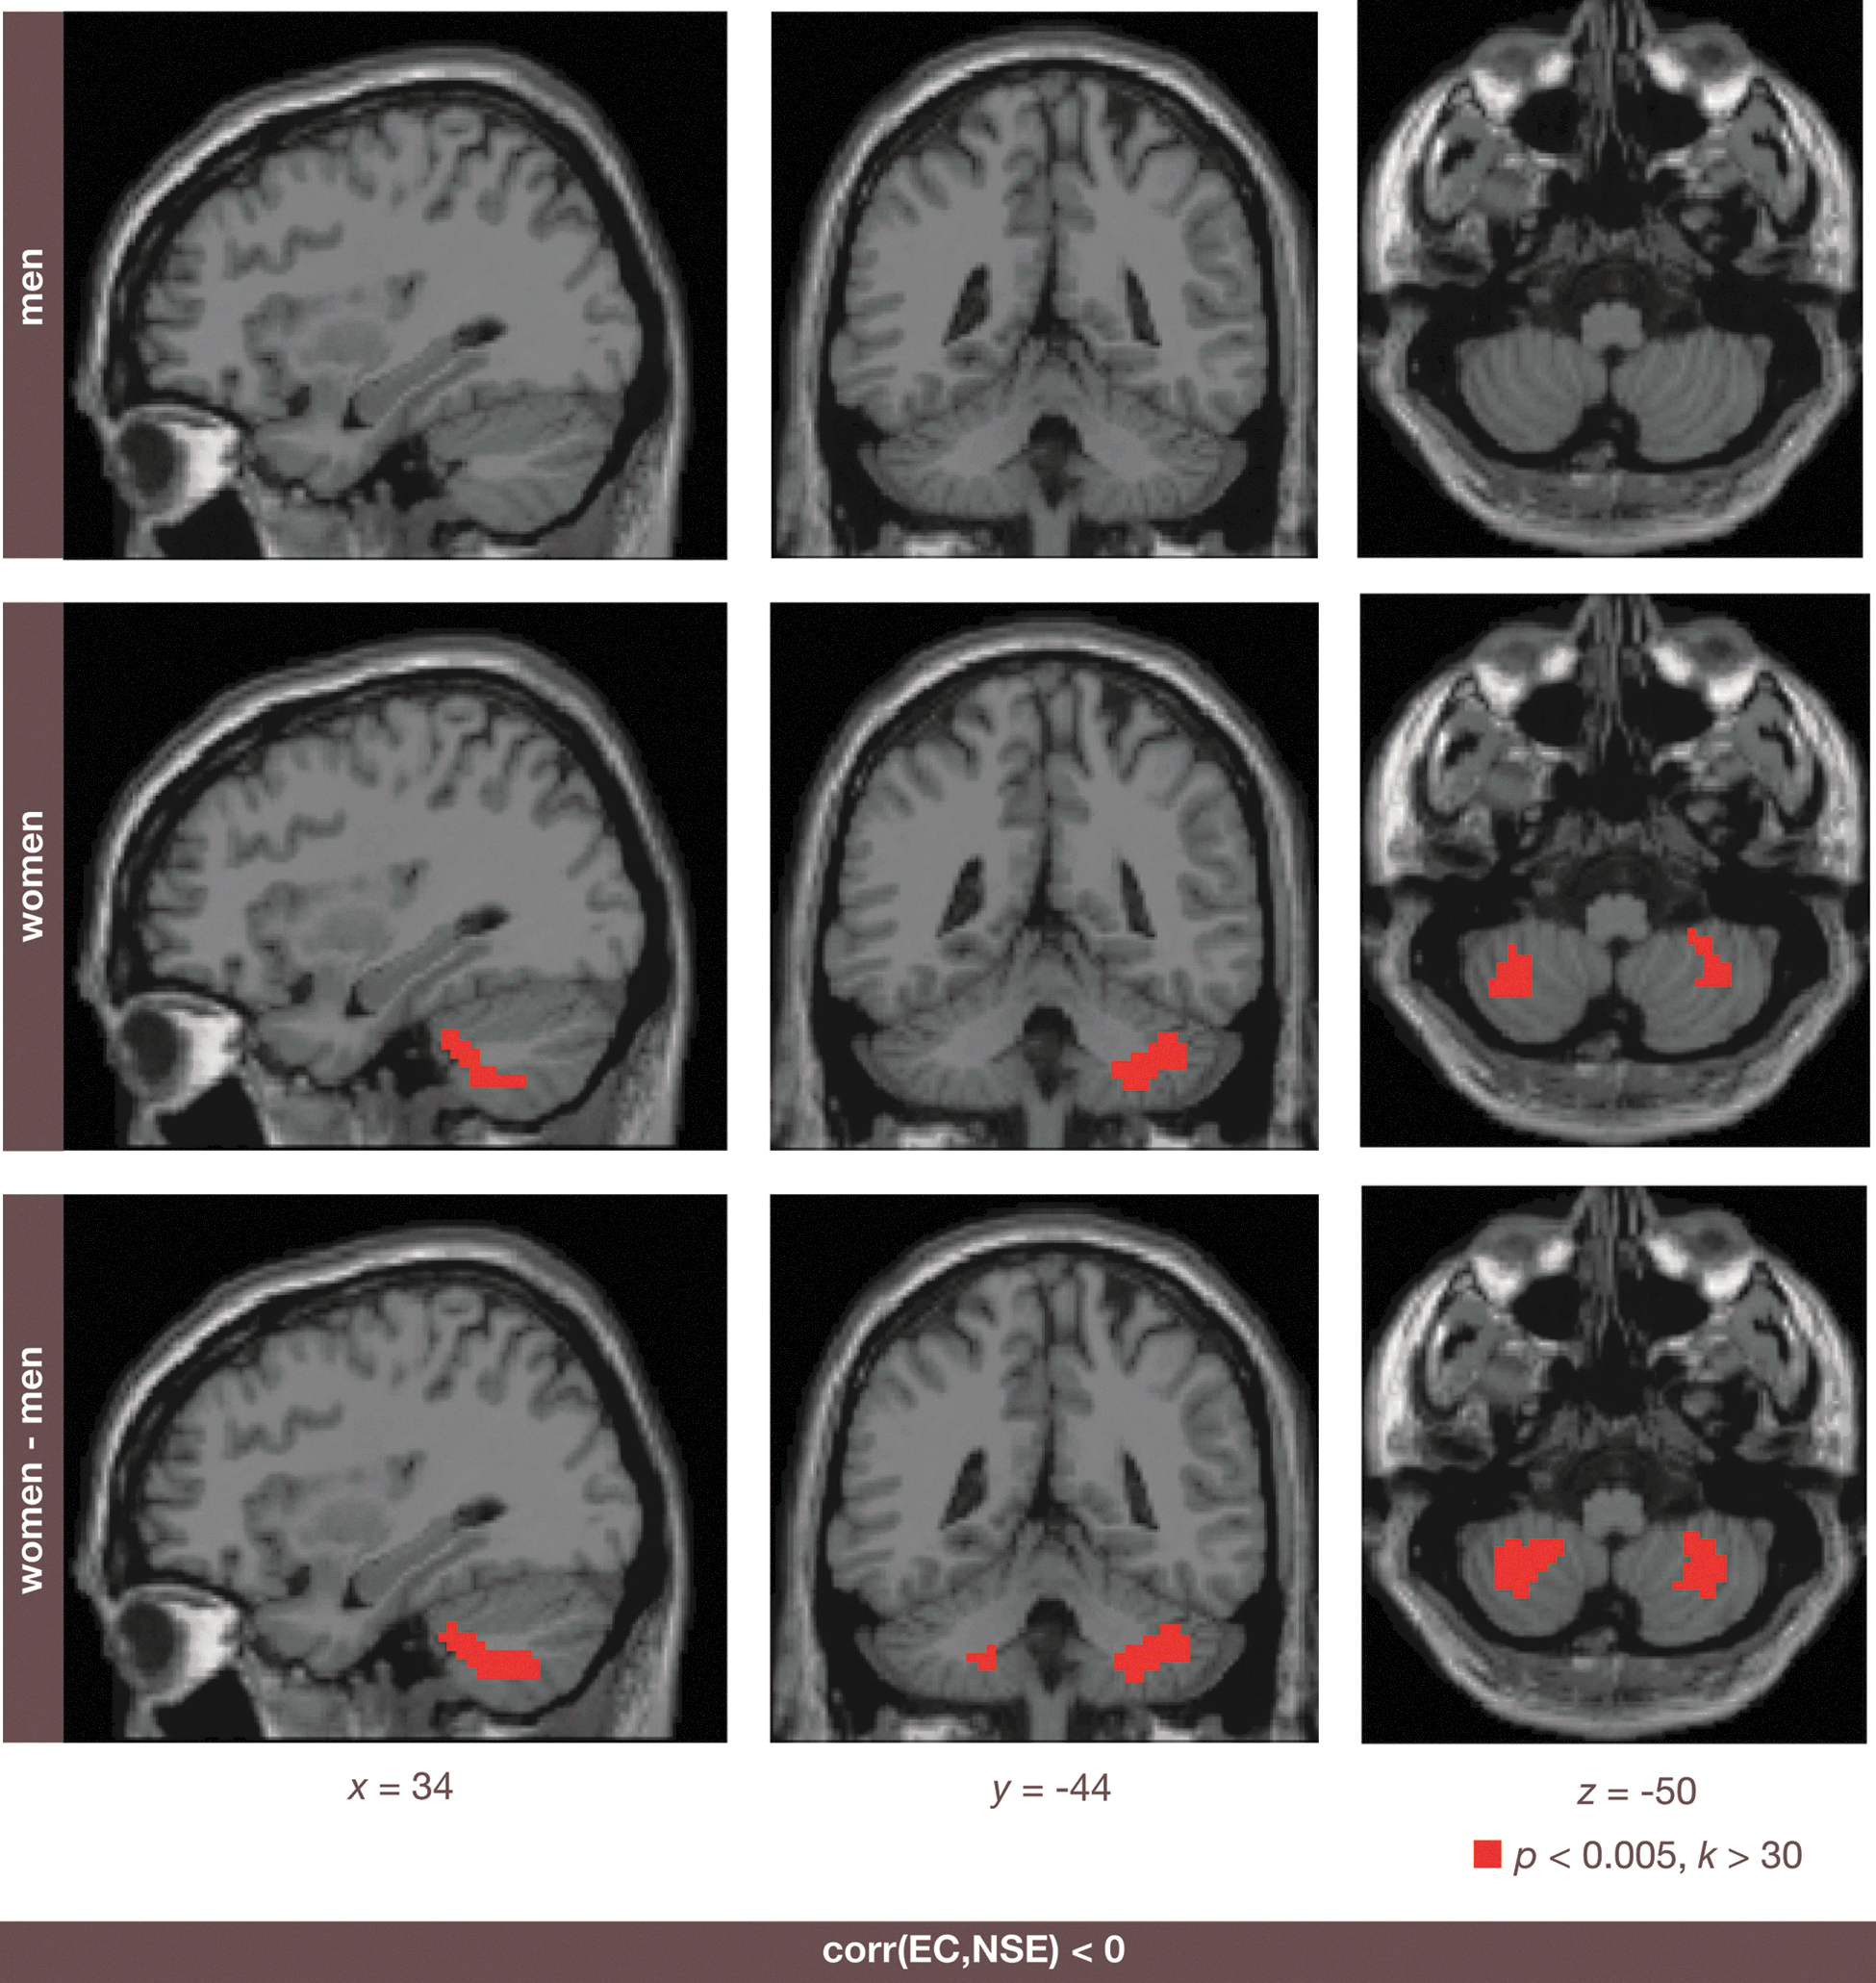
Negative correlation between serum neuron-specific enolase (NSE) and eigenvector centrality (EC) in the female cerebellum in contrast to male subjects. Coordinates in MNI (Montreal Neurological Institute) space. Results are shown using a voxel threshold of p<0.005 with a minimum cluster size of 30 voxels. Top and middle row shows the correlation for men and women, respectively. The bottom row depicts a significant interaction between both factors, serum NSE and gender, identifying the correlation specific to women (p<0.05 false discovery rate corrected). Color image is available online at
To further validate our neuroimaging findings, we investigated gene expression of NSE in whole-brain data from the whole genome-wide atlas of the Allen Institute for Brain Sciences
15
(Seattle, WA;
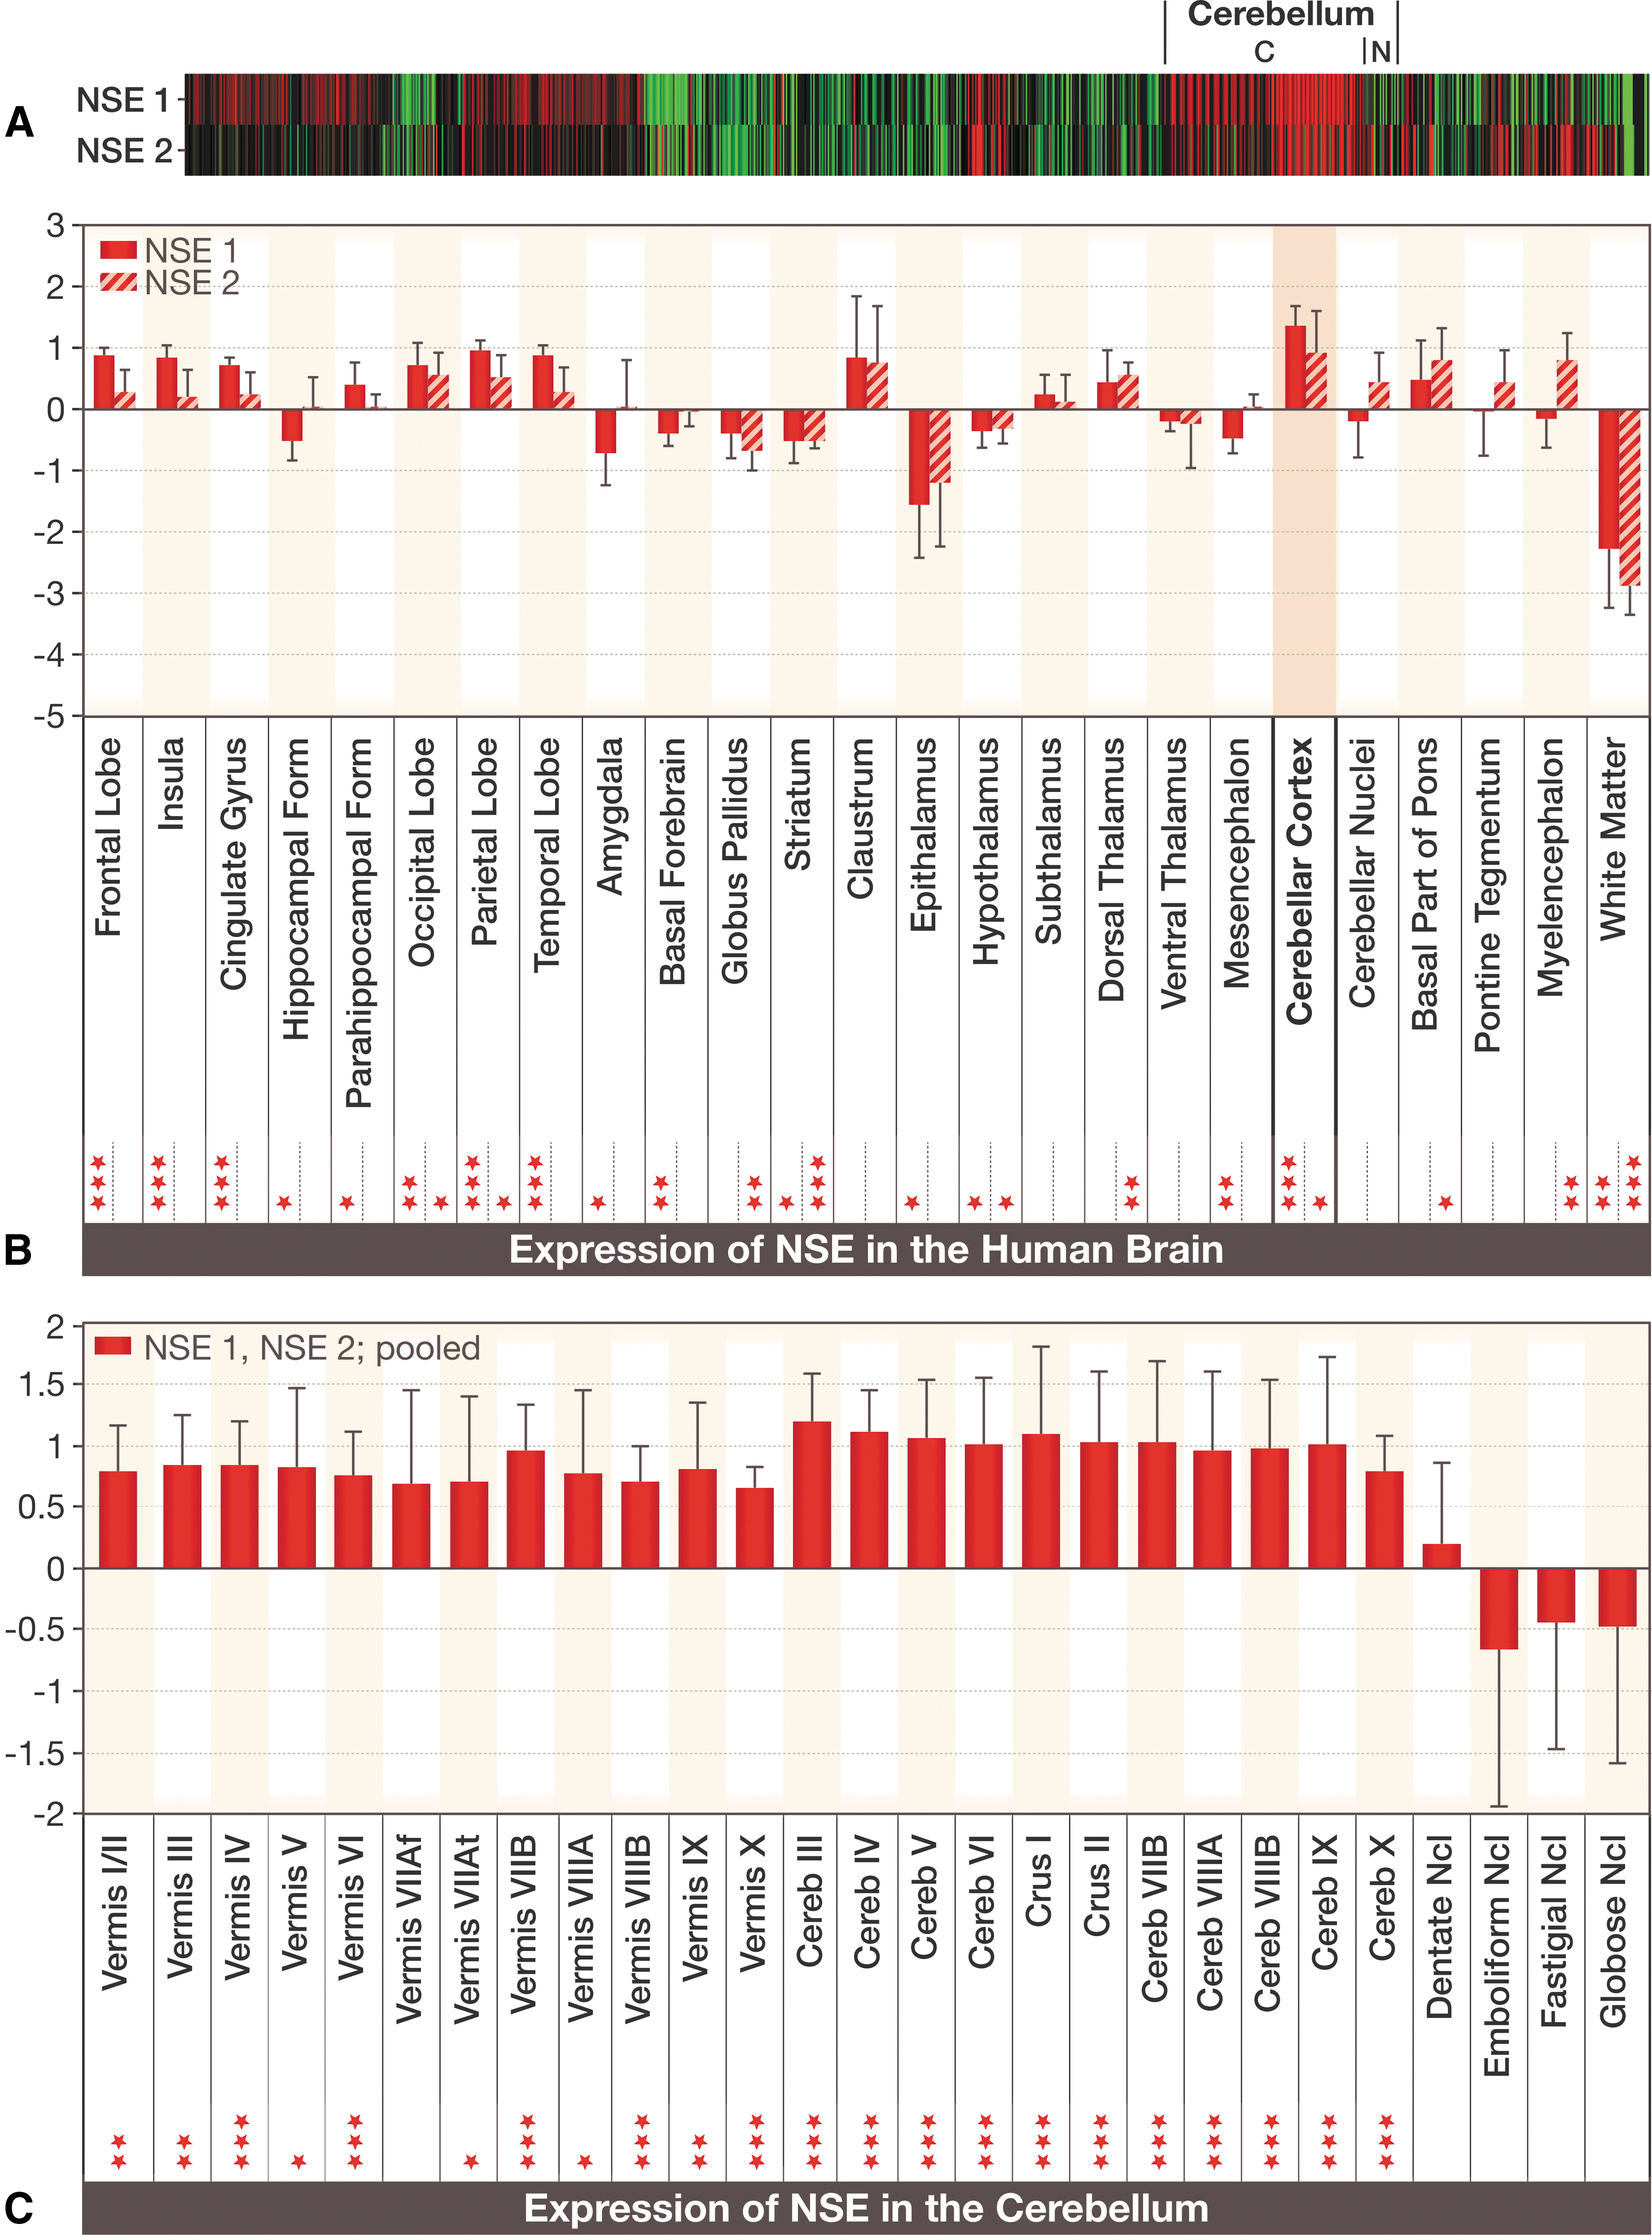
Individually normalized gene expression of neuron-specific enolase (NSE) according to the Human Brain Atlas of the Allen Institute for Brain Sciences (Seattle, WA). z-scores normalized to whole human brain expression. (
Discussion
Our pilot study shows a specific linkage between the neuronal marker protein, sNSE, and cerebellar functional connectivity, as measured with rfMRI, in the female human brain. Data support the hypothesis of a gender-specific relationship between imaging data and serum markers, as recently shown for the association between diffusion tensor imaging (DTI) parameters and the glial marker serum protein, S100B, 8 although our results shall be proven in future studies including more subjects. The cerebellum has been discussed as a structure involved in obesity with regard to reductions of GMD and resting-state connectivity. 5 Our study adds a relationship between sNSE and functional connectivity to the previously reported association between sNSE and cerebellar and hippocampal GMD in overweight and obesity, in comparable cerebellar subregions. 5 Remarkably, we did not observe such an association for the glial marker serum protein, S100B, suggesting that our results are cell specific. 8,16 Our imaging results are in agreement with the highest expression of NSE in the human cerebellum, when investigated in the whole human brain, and with the fact that the cerebellum contains the majority (70–80%; cerebral cortex approximately 20%) of all brain neurons, regardless of brain size. 17 Hence, strongest signal-to-noise ratio in this brain region might have supported or led to our finding of a close correlation between sNSE and resting-state brain connectivity. Although the Allen Institute for Brain Sciences did contain only 1 female subject, we do not expect different expression patterns in both sexes. 18
Our results suggest that the inclusion of sNSE in the analysis of imaging data is a useful approach to obtain more-specific information on the neuronal mechanisms that underlie functional connectivity at rest. Establishing such a baseline resting-state pattern that is tied to a neuronal serum marker opens new perspectives in the characterization of neuropsychiatric disorders as disconnective syndromes or nexopathies, in particular, resulting from TBI, neurodegenerative disease, or cardiac arrest. 1 –8 In these diseases, serum markers such as sNSE have been evaluated for diagnosis and prognosis. Further, resting-state alterations are known to be specific for such diseases. Our multi-modal approach enables inter-relating and cross-validating disease-specific changes in both modalities, which might improve prognostic validity in the future.
Our multi-modal approach might further be validated with other imaging measures, such as structural imaging, DTI, and electroencephalography, that may also address networks and connectivity. Besides NSE, other specific serum biomarkers shall be incorporated into the analysis of imaging data in the future. Here, serum markers specific for destruction processes and/or brain cells might be involved: S100B for glia 16,19 –21 ; glial fibrillary acidic protein for astrocytes; myelin basic protein for oligodendrocytes; and tau or amyloid for cell destruction/neurodegeneration. 1
Footnotes
Acknowledgments
This study has been supported by LIFE (Leipzig Research Center for Civilization Diseases at the University of Leipzig), funded by the European Union, European Regional Development Fund (ERDF), and by means of the Free State of Saxony within the framework of the excellence initiative (M.L.S., K.A., S.H., T.L., S.R.H., and A.V.), by the German Consortium for Frontotemporal Lobar Degeneration, funded by the German Federal Ministry of Education and Research (M.L.S. and S.H.), by the Parkinson's Disease Foundation (grant no.: PDF-IRG-1307; to M.L.S., S.H., and K.M.), and by research and salary support of the Alexander von Humboldt Foundation and the Society in Science (Branco Weiss fellowship; to J.S.).
Author Disclosure Statement
No competing financial interests exist.