




Abstract
Traumatic spinal cord injury (SCI) causes long-term disability with limited functional recovery linked to the extent of axonal connectivity. Quantitative diffusion tensor imaging (DTI) of axonal integrity has been suggested as a potential biomarker for prognostic and therapeutic evaluation after trauma, but its correlation with functional outcomes has not been clearly defined. To examine this application, female Sprague-Dawley rats underwent midthoracic laminectomy followed by traumatic spinal cord contusion of differing severities or laminectomy without contusion. Locomotor scores and hindlimb kinematic data were collected for 4 weeks post-injury. Ex vivo DTI was then performed to assess axonal integrity using tractography and fractional anisotropy (FA), a numerical measure of relative white matter integrity, at the injury epicenter and at specific intervals rostral and caudal to the injury site. Immunohistochemistry for tissue sparing was also performed. Statistical correlation between imaging data and functional performance was assessed as the primary outcome. All injured animals showed some recovery of locomotor function, while hindlimb kinematics revealed graded deficits consistent with injury severity. Standard T2 magnetic resonance sequences illustrated conventional spinal cord morphology adjacent to contusions while corresponding FA maps indicated graded white matter pathology within these adjacent regions. Positive correlations between locomotor (Basso, Beattie, and Bresnahan score and gait kinematics) and imaging (FA values) parameters were also observed within these adjacent regions, most strongly within caudal segments beyond the lesion. Evaluation of axonal injury by DTI provides a mechanism for functional recovery assessment in a rodent SCI model. These findings suggest that focused DTI analysis of caudal spinal cord should be studied in human cases in relationship to motor outcome to augment outcome biomarkers for clinical cases.
Introduction
T
Current imaging modalities such as conventional magnetic resonance (MR) illustrate SCI pathology at the level of the whole cord; however, evaluation of individual cord components such as white matter tracts remains more complex. Diffusion tensor imaging (DTI), an MR imaging technique, allows for the examination of white matter directionality and relative health by measuring the anisotropic diffusion of water in the white matter. 16 Briefly, hydrophobic myelin preferentially directs molecular water diffusion parallel to the long axis of the axon. Within a region defined by the voxel size, the diffusion in specific directions can be measured and the diffusion tensor computed. White matter directionality is inferred by mapping the principal eigenvectors of the tensor, which are aligned with the fiber direction, resulting in a visual representation of the fiber tract.
This methodology forms the basis for tractography, which models the fiber tracts. Tractography has been used primarily to assess the relationships of fiber tracts to intracranial lesions with only limited applications in spinal cord pathology. 17 –20 In terms of axonal health, DTI is also used to measure fractional anisotropy (FA), a numerical value between 0 (isotropic) and 1 (anisotropic), which describes the relative directionality of the molecular motion of water. DTI detects SCI, as quantified by FA, by capitalizing on the disruption of the normally linear arrangement of white matter fiber tracts within the spinal cord. Linear tracts encourage anisotropic molecular water motion while perturbation of this linearity will promote more isotropic motion. Therefore, lower FA measurements may indicate axonal pathology more sensitively than conventional MR, allowing FA values to serve as surrogate markers of white matter health.
To date, preclinical studies of traumatic SCI evaluation using DTI have used transection, 5,21 –26 compression, 27 ischemic, 28 and contusion injury models 4,7,11,29 –34 with many focusing on locomotor and histological correlations. From a translational standpoint, a preclinical SCI model in which non-invasive techniques can recognize graded injury severity and prognosticate recovery has significant implications for assessing therapeutic interventions and complementing clinical evaluations. If specific MR measures at distinct locations with respect to the injury site correlate with outcome, then these measures should be studied as surrogate outcome biomarkers in human cases.
With these concepts in mind, we performed experimental thoracic SCI contusions of varying severity in rats followed by locomotor testing and hindlimb kinematic assessments along with post-mortem DTI and histological evaluations, with a primary focus on the relationship between DTI imaging and functional outcomes. Over 4 weeks post-injury, Basso, Beattie, and Bresnahan (BBB) locomotor scores were recorded and hindlimb kinematic functions were evaluated. 35,36 After spinal cord fixation, tractography and FA values were measured at the injury epicenter and at specific rostral and caudal intervals immediately adjacent to the injury site.
Our data indicate FA values that identify the primary site of injury and show gradual improvement moving away from the injury epicenter. Statistical evaluation indicates that FA values caudal to the lesion, but not at the lesion itself, are able to discern mild from moderate/severe injury. These results were combined with locomotor analyses and histopathologic evaluations revealing positive correlations between imaging (FA values), locomotor activity (BBB score and middle swing foot position relative to hip), and spared tissue measurements. From these experimental observations, we suggest that DTI measurements should be analyzed in caudal spinal cord relative to motor function in future human studies to develop a new surrogate outcome biomarker for clinical spinal cord trauma.
Methods
Spinal cord contusion
To model traumatic SCI, female Sprague-Dawley rats (250–270 g, n=24) were first anesthetized with an intraperitoneal injection of ketamine (60 mg/kg) and xylazine (10 mg/kg) and maintained at 37°C using a heating pad controlled by a rectal temperature probe. Animals were then prepped and draped in a sterile fashion. A linear incision was made over the thoracic region. After soft tissue and muscle dissection, the T2 spinous process was identified and used as a landmark to count caudally to T6-7 level. Laminectomies were performed exposing the underlying dura and spinal cord. The NYU weight-drop SCI model (10 g rod dropped from a pre-determined height 37 ) was used to create contusions corresponding to mild (height=12.5 mm; n=4), moderate (height=25 mm; n=8), and severe (height=50 mm; n=7) injury. Additional control animals (n=5) underwent laminectomy without contusion. Bleeding, if any, was controlled with Gelfoam (Pfizer; New York, NY), and the incision was closed using suture to approximate the muscles and clips to close the skin.
Animals were then placed in a warmed cage to recover from anesthesia. After the surgical procedure, animals were provided with food and water on the cage floor and underwent manual bladder compression twice daily for the duration of the post-operative experimental period. All experiments were conducted in accordance with Yale University's Institutional Animal Care and Use Committee recommendations.
Locomotor assessment/hindlimb kinematic evaluation
During the 4-week post-injury survival, animals underwent locomotor evaluation with BBB scoring at 2 and 4 weeks post-injury. 36 Animal locomotion in an open field was scored by consensus evaluation of two blinded observers. In addition, motion-capture kinematic evaluation of hindlimb function was recorded at the 4-week time point, as described. 3 Briefly, before video monitoring, reflective markers (B&L Engineering; Santa Ana, CA) were attached using non-toxic glue bilaterally to: the iliac crest; the head of the humerus; the greater trochanter of the knee; the lateral malleolus; the fifth metatarsal; and the third toe. Recordings were made from four synchronized cameras at 100 Hz (Basler Vision Technologies, Germany) placed at approximately 45 degrees and 135 degrees relative to the position of the track. SIMI motion-capture software (SIMI Reality Motion Systems, Germany) was used to obtain three-dimensional coordinates of the markers during locomotion.
The hindlimb was modeled as an interconnected chain of rigid segments and multiple bilateral gait parameters (e.g., swing length, step cycle duration, hip-knee-ankle [HKA], and knee-ankle-foot [KAF] angles) from recordings containing at least two consecutive step cycles were extrapolated. Data was exported using the SIMI motion-capture software numerically as Excel (Microsoft Corporation; Redmond, WA) spreadsheets as well as individual frame-by-frame images of gait cycles of each animal.
We analyzed the position of the toe relative to distance traveled in the y (anterior-posterior) and z (superior-inferior) planes, after normalizing the position of the toe relative to a fixed hip to analyze the swing phase of the gait cycle. The gait cycle was defined as a single attempted forward excursion by the hindlimb; many of the animals were unable to step and/or bear weight because of the nature of the injury. Swing length was defined as the distance traveled by the toe in the y axis for a single gait cycle. Step cycle duration was defined as the time needed for the toe to complete a single gait cycle. Swing velocity was the swing length divided by the step cycle duration as defined above.
For animals with significantly impaired hindlimb function, motion of the forepaws was used to extrapolate swing length and step cycle duration in that selected animals either attempted hindlimb forward excursion but were unable to bear weight or showed minimal to no hindlimb function, each resulting in hindlimb drag. Additional measures included the middle swing foot position relative to hip as well as HKA and KAF angles. Frame-by-frame images were analyzed using ImageJ (National Institutes of Health; Bethesda, MD) and Illustrator (Adobe Systems; San Jose, CA).
Statistical analyses for the above measures were calculated as described: for BBB analysis, scores within groups were averaged and reported as means±standard error (SE). One-way analysis of variance (ANOVA) with post-hoc Tukey honestly significant difference (HSD) (p<0.05) was used to evaluate for differences between groups. For swing length and step cycle duration, two consecutive steps were measured and averaged for each hindlimb. The individual hindlimb averages were then averaged together to create an average measure for a given animal. These average measures were then averaged within groups to calculate an overall average for the group. This methodology was undertaken because the authors thought that each step should not be considered an independent event and wanted to account for any potential differences between left and right hindlimb function.
Swing velocity measurements were calculated by first calculating an individual animal's swing velocity as defined by the animal's averaged swing length divided by the average step cycle. These values were then averaged within groups. With the goal for this study to evaluate for differences between groups, group average values are reported as means±SE. One-way ANOVA with post-hoc Tukey HSD (p<0.05) were used to evaluate for statistically significant differences.
DTI acquisition/FA calculation/tractography
After conclusion of locomotor and kinematic evaluations, animals were transcardially perfused with cold phosphate buffered saline (PBS) followed by 4% paraformaldehyde/PBS solution. Spinal cords were removed and flat mounted on a plastic slit to acquire conventional T2 weighted MR images and DTI datasets. Briefly, spinal cords were glued onto a plastic slide, which was placed into a custom-built MRI compatible tube filled with Fluorinert, an MRI susceptibility-matching fluid (Sigma-Aldrich, Inc., St. Louis, MO). The MRI datasets were obtained on a 9.4 Tesla horizontal bore magnet (Bruker, Billerica, MA) with a custom-made 1H radio frequency surface coil, as described. 38 Twenty contiguous slices of 400 μm thickness were acquired for both anatomical and DTI experiments. The 256×256 anatomical images were acquired using a fast spin-echo sequence with a repetition time (TR) of 3 sec, an echo time (TE) of 14.1 msec, eight averages and a field of view of 40 mm×25.6 mm, resulting in an in-plane resolution of 156 μm×100 μm. The DTI experiments were performed using the Stejskal-Tanner spin-echo diffusion-weighted sequence with a diffusion gradient of 5 msec and a delay between the two diffusion gradients of 15 msec.
Two Shinnar–Le Roux (SLR) pulses of 1 msec each were used for excitation and inversion, respectively. Twenty-four averages were acquired with a TR of 1.5 sec and a TE of 25.1 msec. The 128×64 images were zero filled to 256×256, resulting in an in-plane resolution of 156 μm×100 μm. Sixteen diffusion weighted images were acquired for each slice, 15 corresponding to various non-collinear diffusion weighting directions with the same b=1000 s/mm2 and one with no diffusion weighting.
T2 images and FA maps were then generated from the data acquisition. A single observer familiar with reading MR images and blinded to cord injury severity reviewed all sequences and established the injury epicenter based on the location consistent with the most significant alteration in normal spinal cord morphology. For sham injury animals, there was no visible parenchymal lesion resulting in an estimate as to the site where the laminectomy was performed. A 500 μm segment was then measured from that location in both rostral and caudal directions by a second observer also blinded to cord injury severity. These segments were further subdivided into 100 μm increments from which FA values for the entire cord parenchyma were measured.
After establishing the regions of interest, FA values were generated by a single blinded observer by outlining the cord parenchyma in the axial plane resulting in a numerical measure. FA values for each location were averaged within groups and reported as means±SE. To assess for comprehensive differences in FA values between injury groups, two-way ANOVA (injury severity and location) with post-hoc Tukey HSD (p<0.05) was evaluated. This assessment was followed by one-way ANOVA with post-hoc least significant difference (p<0.05) to evaluate for individual differences in FA values between injury groups at individual locations along the spinal cord.
To further evaluate post-injury axonal characteristics, tractography was used to visualize white matter location and directionality. Tracking was performed using diffusion tensors computed from the diffusion weighted MR images in conjunction with fasciculography (
Immunohistochemistry for tissue sparing
After imaging, cords were sectioned in 50 μm slices using a vibratome starting from the injury epicenter and proceeding in both rostral and caudal directions for 500 μm to correlate with MR imaging. Every other section (corresponding to 100 μm intervals) was processed in 1% Triton X-100/PBS with 10% normal donkey serum using primary antibodies to neurofilament heavy chain (NF-H; 1:100; Sigma; St. Louis, MO) and glial acidic fibrillary protein (GFAP; 1:100; Sigma; St. Louis, MO) followed by appropriate secondary antibodies (Alexa 488 [NF-H] and 594 [GFAP]; 1:1000; Life Technologies; Grand Island, NY) to visualize axons and astrocytes, respectively.
To further evaluate histological outcomes, the percentage of total spared tissue was calculated for the different injury and sham injury groups. Images from every other consecutive transverse section from 200 μm rostral to 200 μm caudal to the injury epicenter were imported into ImageJ. In a blinded fashion, total spared tissue area was measured at each of these sections for each animal. The values were summated per animal and averages within groups were calculated, similar to previous studies. 37,41 These averages were normalized to sham injury control values and reported as a percentage of spared tissue area±SE. One-way ANOVA with Tukey HSD (p<0.05) was used to determine significant differences between groups.
Functional–imaging–histological correlation analyses
To evaluate for a predictive relationship between locomotor and imaging studies, BBB scores and FA values for the various experimental groups were plotted for each of the specific locations along the spinal cord—namely, the injury epicenter and the 100 μm rostral and caudal increments, generating 11 data sets. For each location, linear regression was used to generate coefficient of determination (R2) values. To quantify the linear correlation between the two variables (BBB score and FA value), Pearson correlation coefficients (R) along with p values were calculated for each location to determine significant correlations. Similarly, average middle swing foot position relative to hip measurements for the different injury and control groups along with FA values were plotted for each of the spinal cord locations. At each location, linear regression was used to generate coefficient of determination values and Pearson correlation coefficients. To provide a measure of correlation between functional outcomes and histologic findings, the percentage of spared tissue for each of the injury and sham injury groups was plotted relative to BBB score as well as caudal FA values. R2 values were measured for each of these correlations.
Results
Locomotor assessment (Table 1)
Animals receiving contusion and sham injury were assigned BBB scores at 2 and 4 weeks post-injury. When these scores were compared within groups, all injured animals showed trends toward improvement over the 2-week interval with only moderate injury animals achieving statistical significance (p<0.05). Sham injured animals demonstrated no deficits leading to perfect scores at both post-injury time points. When comparisons between groups at each time point were evaluated, all scores showed statistically significant differences (p<0.05) except for scores between severe and moderate injury groups. There was no significant difference between mild and sham injured animals at 4 weeks post-injury. These data indicate significant impairment of locomotor function for severe and moderate injury groups with animals unable to bear weight on their hindlimbs at either post-injury time point while mild injury animals maintained weight-bearing but demonstrated toe clearance and paw position deficits. Of note, two animals within the moderate injury group died before completion of the study while a single animal from the moderate injury group was excluded from analysis based on locomotor scores indicating normal hindlimb function at 2 weeks post-injury.
Basso, Beattie, and Bresnahan (BBB) scores at 2 and 4 weeks post-injury for the three injury severities and sham injury animals. Values are mean±standard errors. Note that severe and moderate injury animals were unable to bear weight at either post-injury time point while mild injury animals were weight bearing but had persistent post-injury toe clearance and paw position deficits. When the two time points were compared within individual severity groups, all groups trended toward recovery of locomotor function, although only moderate injury animals achieved statistically significant improvement (a; p<0.05). When post-injury time points were compared between groups, significant differences (p<0.05) were noted between all injury severities except for severe and moderate groups (b). Similarly, there was no significant difference between mild and sham injury groups at the 4-week post-injury time point (c).
Hindlimb kinematics (Figs. 1, 2)
Kinematic measures including joint position angles, swing length, step cycle duration, swing velocity, and middle swing foot position relative to hip were evaluated at four weeks post-injury. Hindlimb motion along with HKA and KAF joint position angles for two consecutive bilateral step cycles of a single animal from each group are presented as a function of time (Fig. 1, A–L). There were only minor variations in step cycle duration for different steps by the same animal. Comparisons between groups indicated appreciable differences in joint angle measures over time. Mild injury measures were comparable to sham injury; however, the overall negative middle swing foot position after mild injury (see below) resulted in observable gait impairment. Moderate injury animals demonstrated a gait pattern dissimilar from mild and sham injury with attempted hindlimb forward excursion followed by drag indicating progressive impairment while severe injury animals had little to no change in joint angle measures consistent with minimal to no hindlimb function. Given their hindlimb weight-bearing impairment, moderate and severe injury animals were dependent on their forepaws for forward motion.
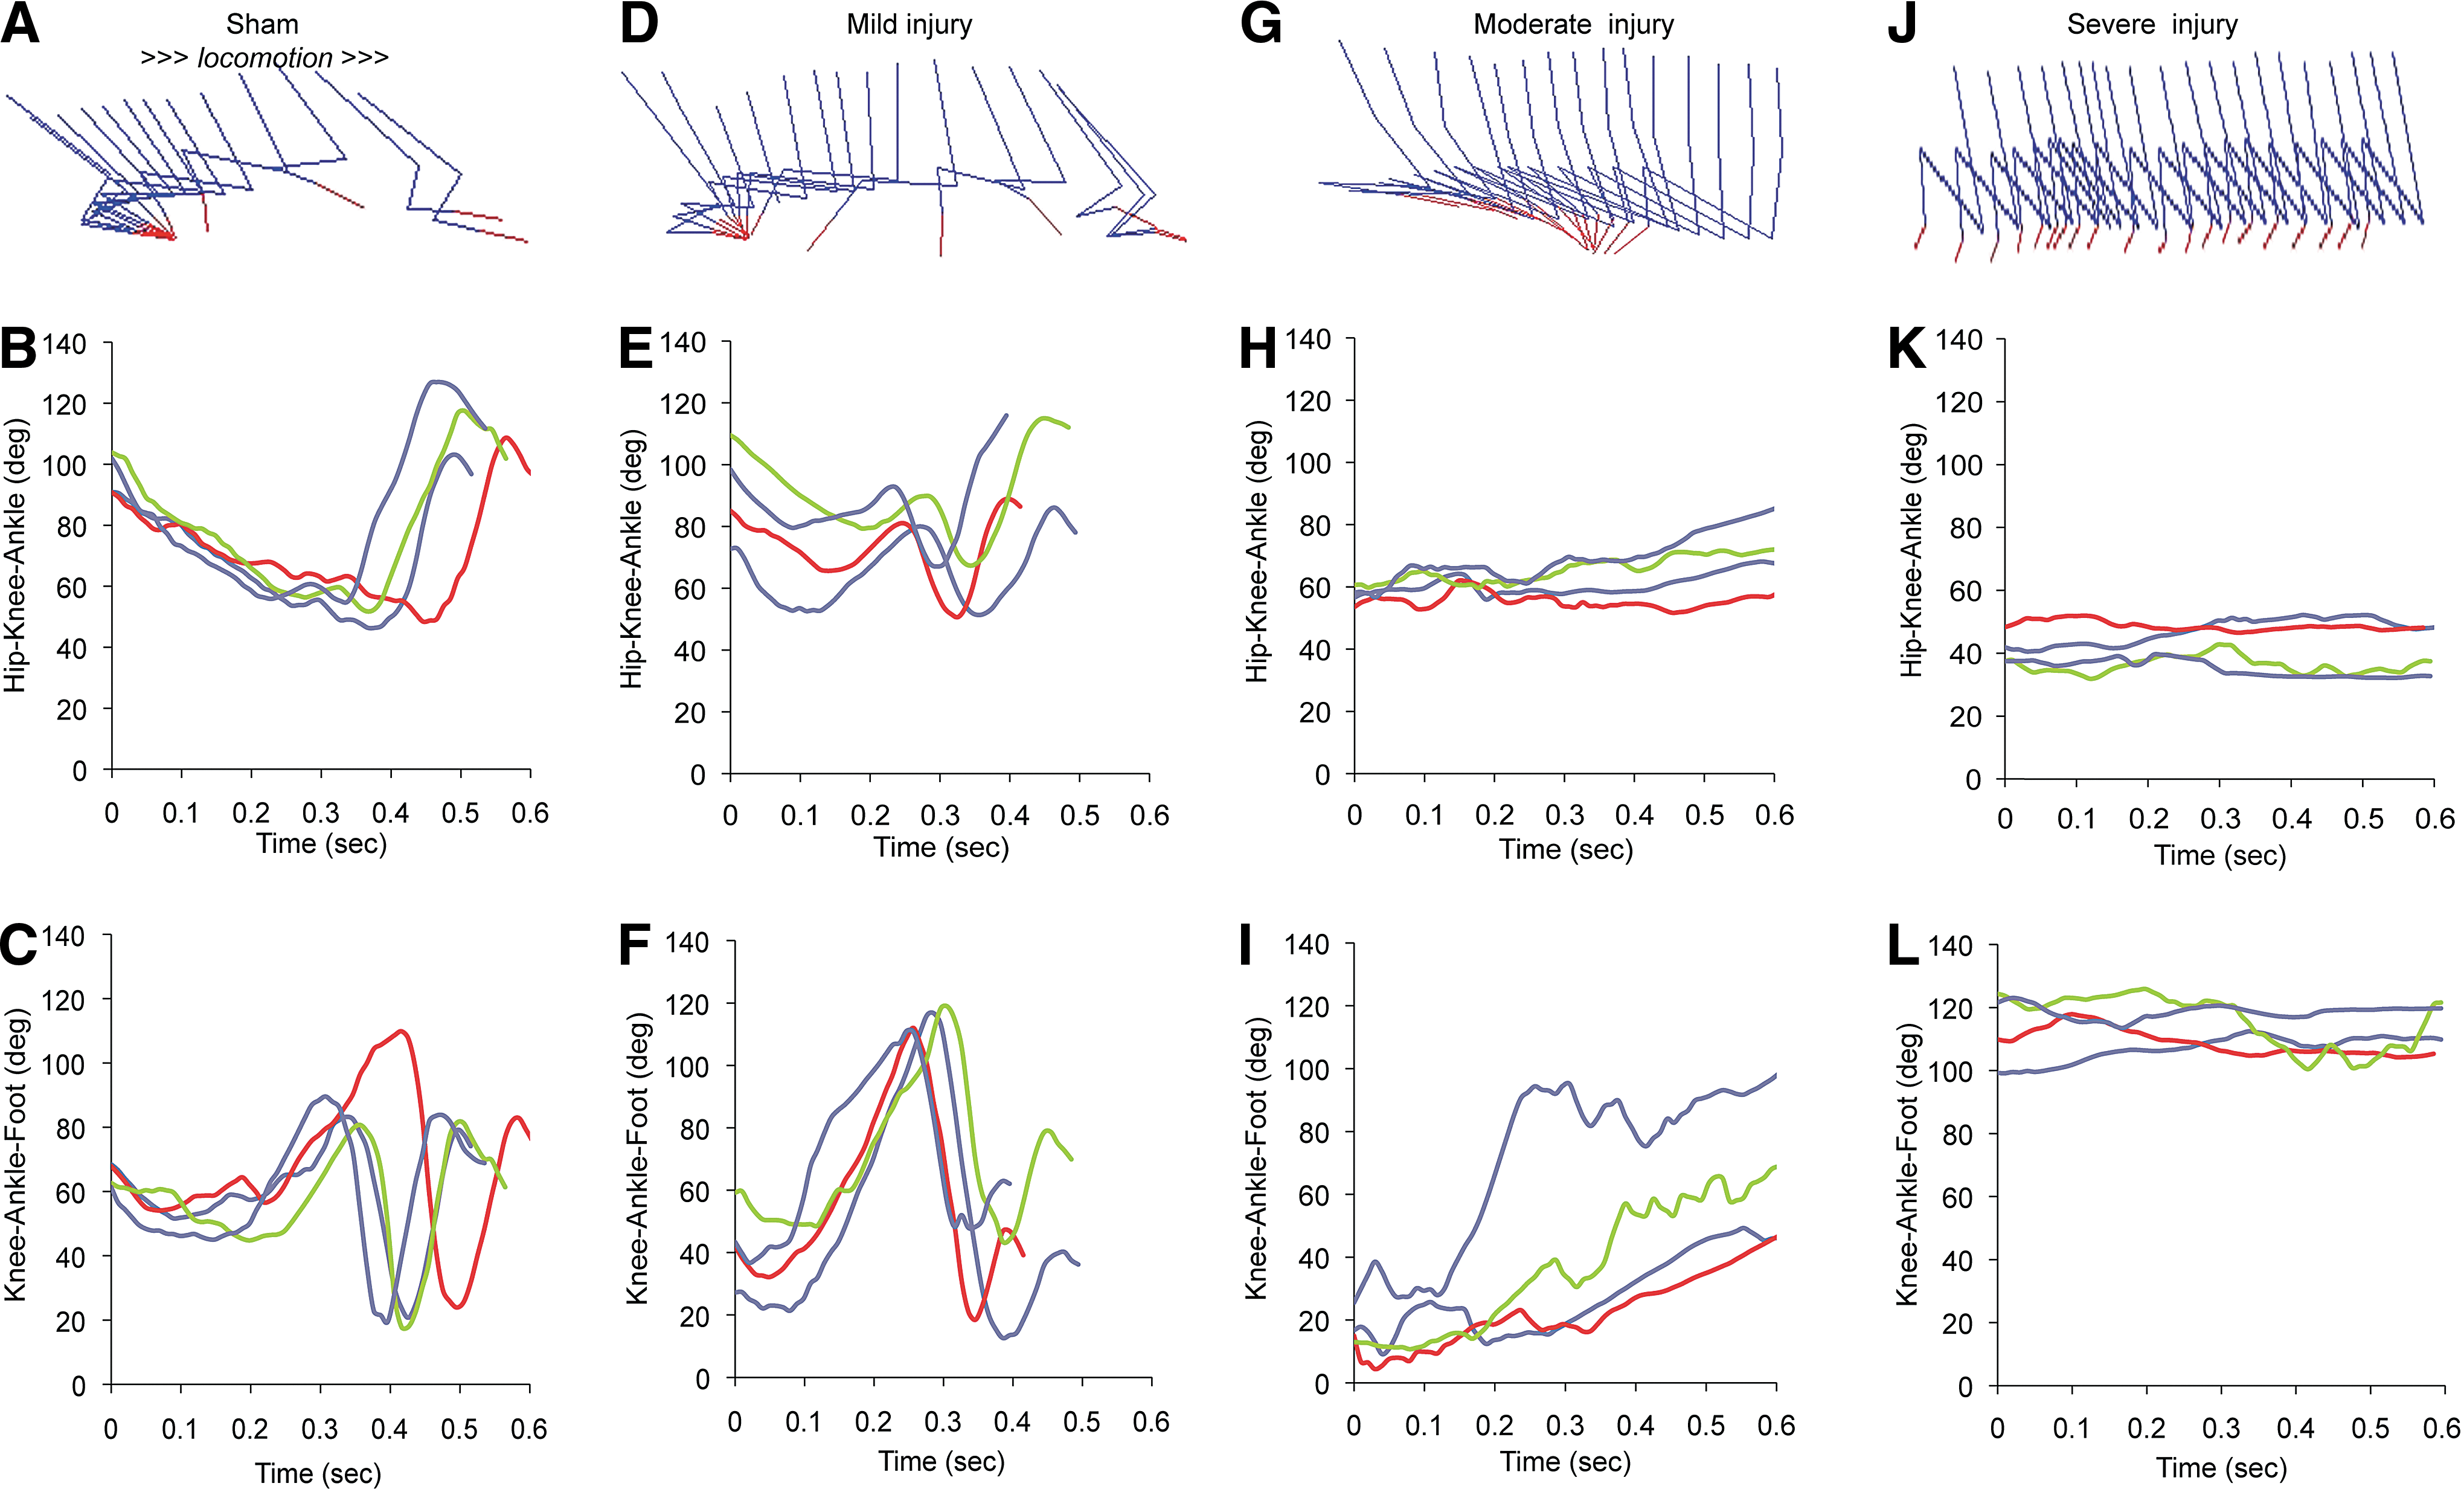
Kinematic evaluations of hindlimb function after traumatic thoracic spinal cord contusion from individual rats. Representative drawings of hindlimb kinematics and joint angle measurements (Hip-Knee-Ankle and Knee-Ankle-Foot) over time for sham (
Average kinematic data grouped by injury severity were assessed for specific parameters (Fig. 2). Despite obvious differences in function, there were no significant differences between any injury severity group and the sham injury group for swing length (Fig. 2A) or velocity (Fig. 2C), consistent with the forelimbs maintaining ambulation rate. For step cycle duration (Fig. 2B), moderate injury measures were significantly different from those of mild and sham injury. In contrast, there were marked differences between groups for middle swing foot position relative to hip position (Fig. 2D). Sham injury animals demonstrated a positive average position consistent with normal gait, while all injured groups had negative averages. Severe injury animals had the most negative position. Comparison of mean position revealed statistically significant differences between severe and both mild and sham injury measures as well as between moderate and sham injury (p<0.05).
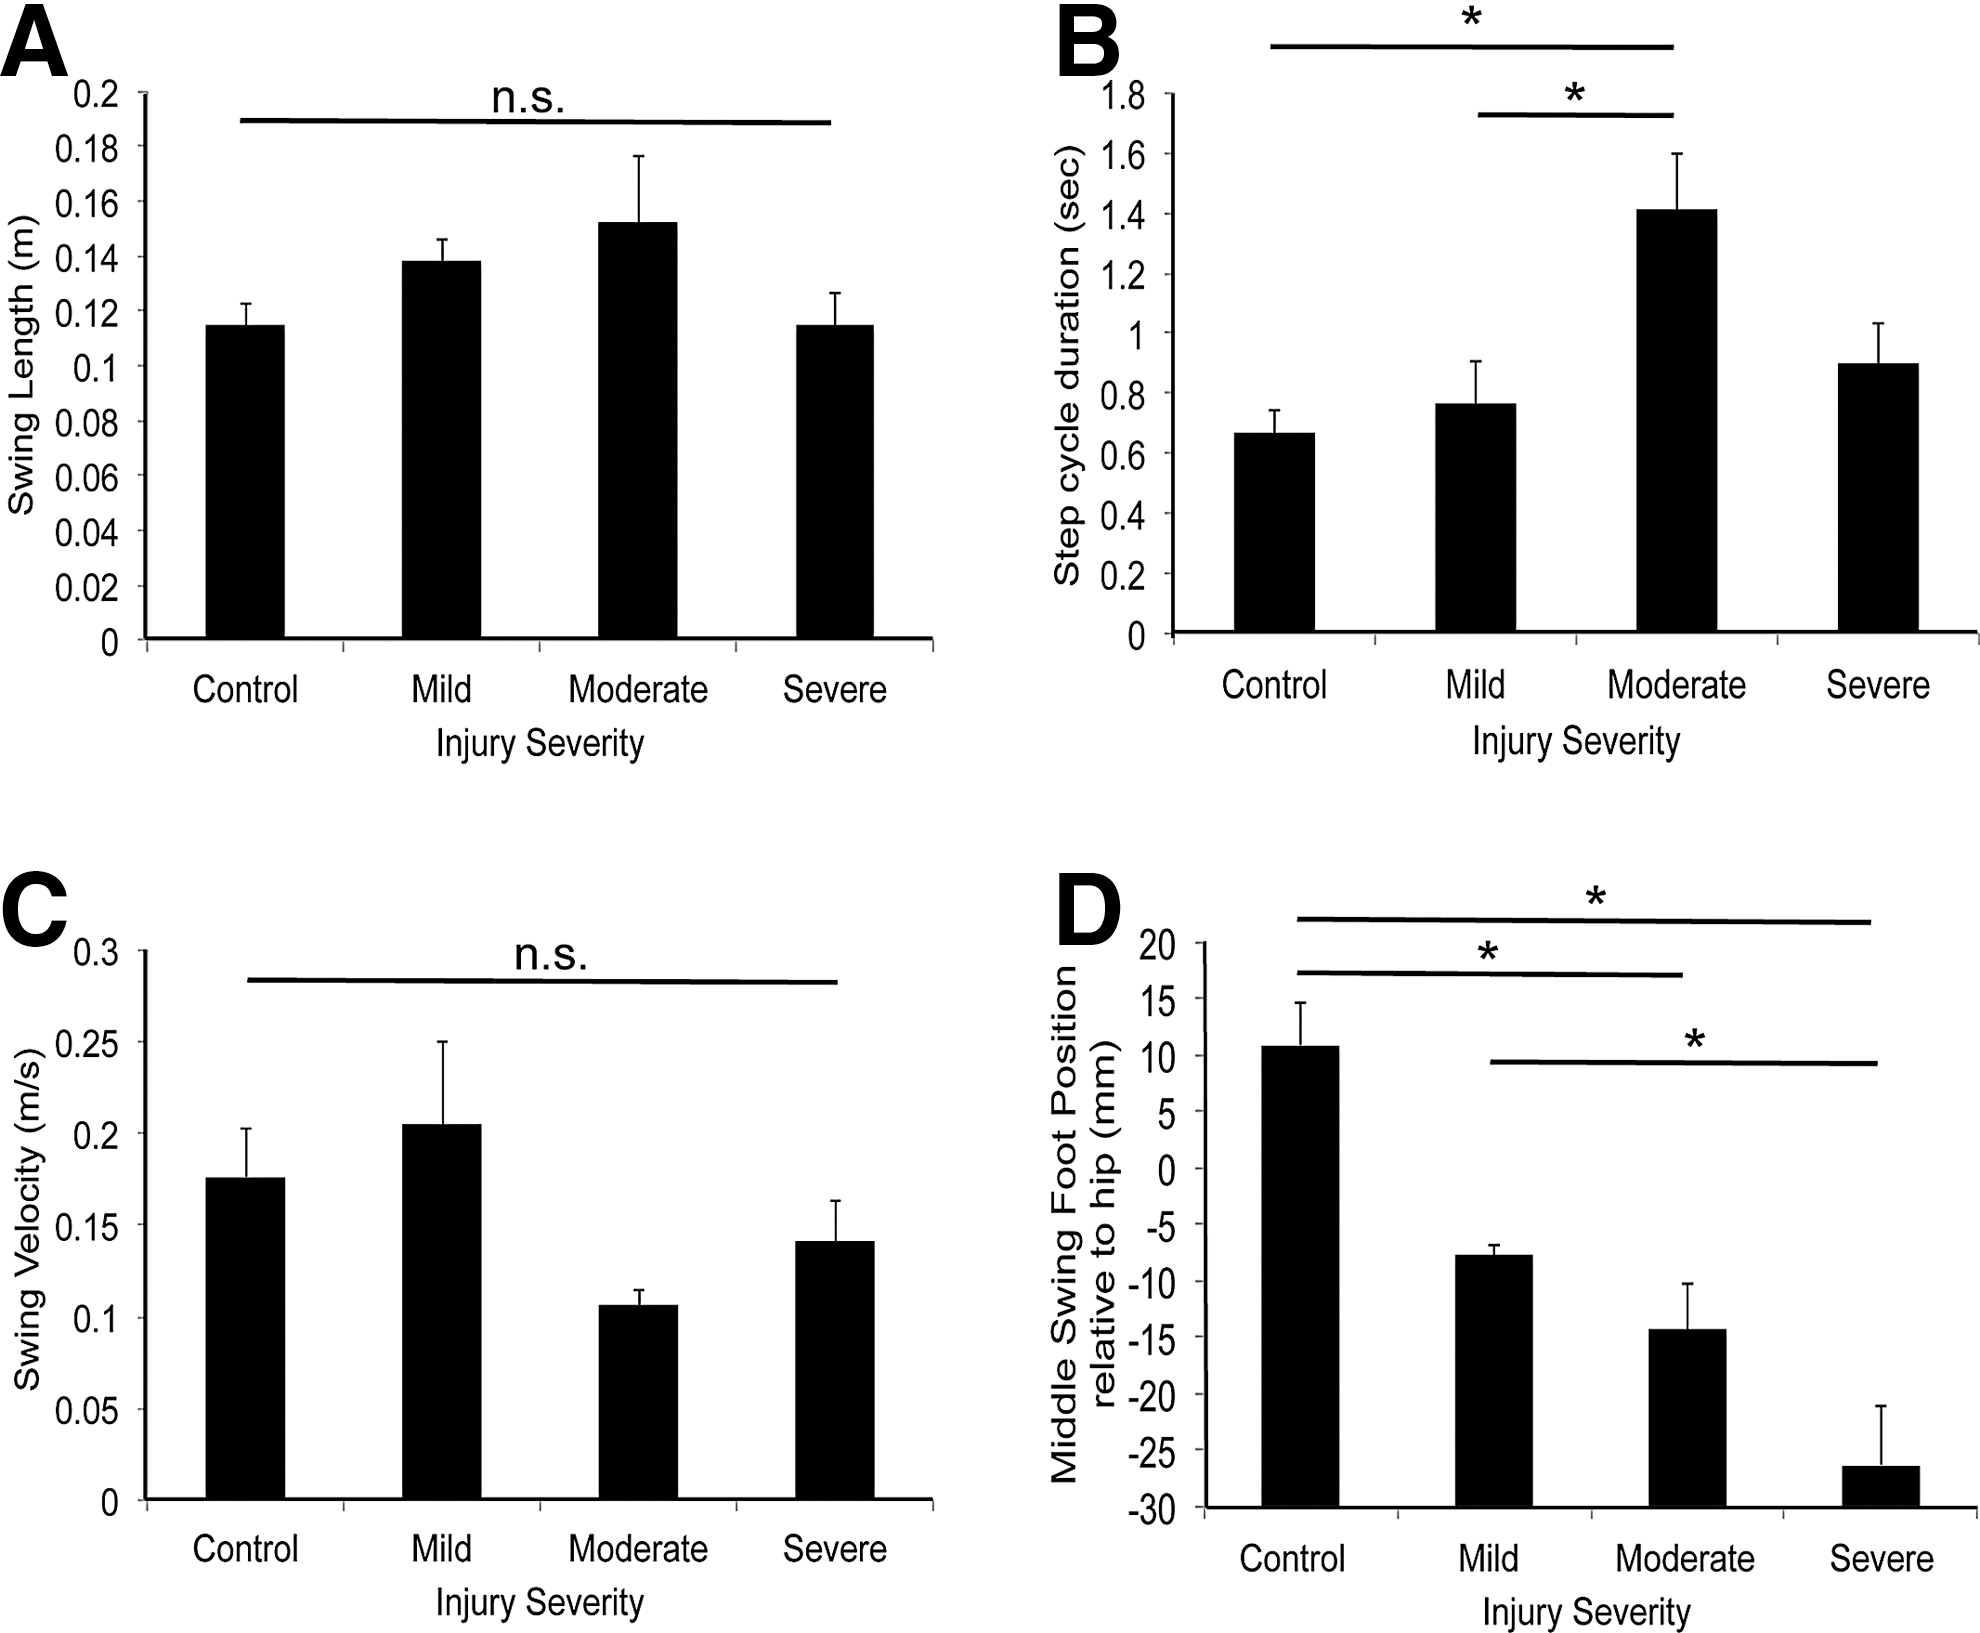
Kinematic evaluations of hindlimb function after traumatic spinal cord contusion. Kinematic analyses from different injury groups as in Figure 1 were pooled and plotted as mean±standard error of the mean, n=3–5 rats. There were no statistically significant differences between groups for swing length (
DTI results
Conventional T2 (Fig. 3A)
Sham injury animals revealed normal spinal cord morphology with linear areas of hyper- and hypointensities consistent with circumferential white matter tracts surrounding central gray matter. There was no evidence of intramedullary pathology. Injured animals, however, showed disruption of this linear arrangement as indicated by a hyperintense region within the central cord parenchyma corresponding to the site of contusion. The parenchyma immediately surrounding this hyperintense region revealed linear hyperintensities. These findings were consistent with post-injury central syrinx formation and preservation of surrounding white matter fibers. This impression was subsequently confirmed by histology. Most central hyperintense regions extended approximately 100 μm in both rostral and caudal directions from the injury epicenter. In the regions 200–500 μm rostral or caudal to these hyperintense regions, preservation of the linear hyper- and hypointense pattern comparable to that seen in sham injury animals was observed suggesting normal parenchyma.
FA maps
(Fig. 3B–D). FA values were generated from corresponding FA maps by first identifying 500 μm rostral and caudal to the injury epicenter and then determining 100 μm intervals within these regions. At these intervals, the entire cord parenchyma was outlined from corresponding axial views followed by BioImage Suite software (Yale University) analysis. FA values averaged within groups were then plotted based on location as a function of injury severity (Fig. 4). Sham injury animals revealed relatively uniform FA values across the length of spinal cord. For all injury groups, the injury epicenter demonstrated the lowest FA value. Similarly, there was no statistically significant difference in FA values between the different injury severities at the epicenter, although all values were significantly different from the sham injury value (p<0.001). As distance from the injury epicenter increased, FA values increased in a stepwise fashion, although these values never reached corresponding sham injury values.

MRI sequences at 9.4 Tesla of sham injury (left) and mild injury (middle and right) spinal cords. Colorimetric T2 (
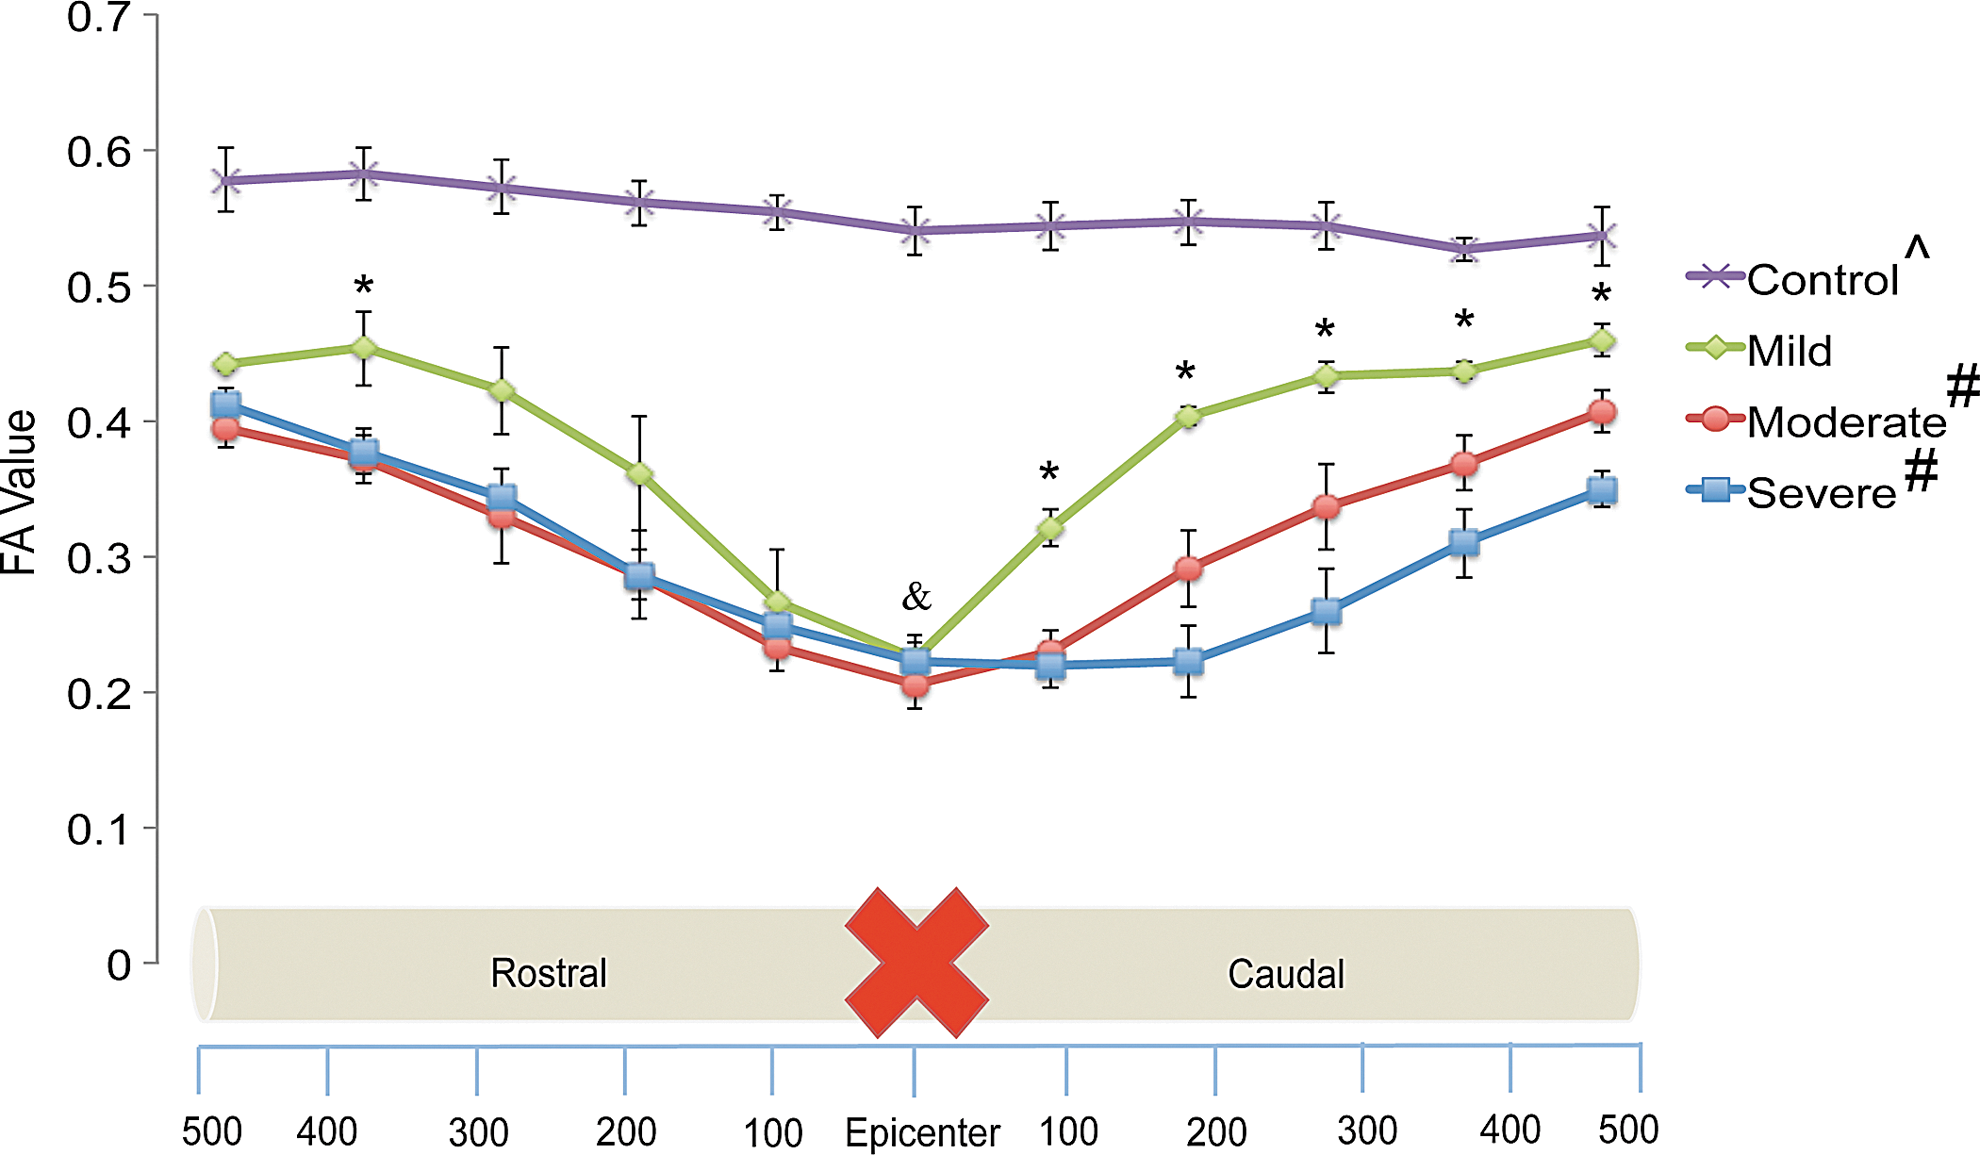
Fractional anisotropy (FA) value versus location (μm) as a function of injury severity. Values are averaged within groups and reported as mean±standard error. Two-way analysis of variance with post-hoc analysis accounting for injury severity and location revealed no significant difference between moderate and severe injury groups (#) although all other group comparisons were significant (p<0.05). At all locations along the spinal cord, all injury severities revealed statistically significant differences from sham injury animals (^; p<0.05). There were no significant differences in FA values between injury groups at the injury epicenter (&). FA values for mild injury animals were significantly different from moderate and severe injury animals at all caudal locations but only at a single rostral location (*; p<0.05). Color image is available online at
Post-hoc analysis accounting for injury severity and location indicated no significant difference between moderate and severe injury groups (p=0.064), although all other group comparisons were found to be significantly different (p<0.001). When specific locations were examined, FA values for mild injury were significantly different from moderate and severe injury values at all locations caudal to the injury epicenter but only at a single rostral location (p<0.05).
To determine if correlations existed between locomotor evaluations and DTI results, each animal's BBB score at 4 weeks post-injury was plotted against its FA value as a function of location. Linear regression and coefficient of determination (R 2 ) values were first calculated for each location followed by Pearson correlation coefficients (R) to assess for the correlative strength (Fig. 5). The weakest correlations were observed at the injury epicenter (R=0.73) and immediately rostral to the epicenter (R=0.72), consistent with the observation that no significant differences between FA values and injury severity occurred at this location. The overall average Pearson correlation coefficient for the individual data sets, however, was 0.81±0.02 (mean±SE: range: 0.72–0.90) with more positive correlations observed in the caudal segment (range: 0.85–0.90). Of note, p values calculated at all locations found each correlation to be statistically significant (p<0.0001). Given the graded deficits noted for middle swing foot position relative to hip measures for each of the injury severities, a similar comparison was generated between the foot position measures and FA values as a function of location. The average Pearson correlation coefficient for the data set was 0.67±0.20 (mean±SE: range: 0.55–0.76) with the weakest correlations noted at and immediately rostral to the injury epicenter with stronger correlations in the caudal segment.
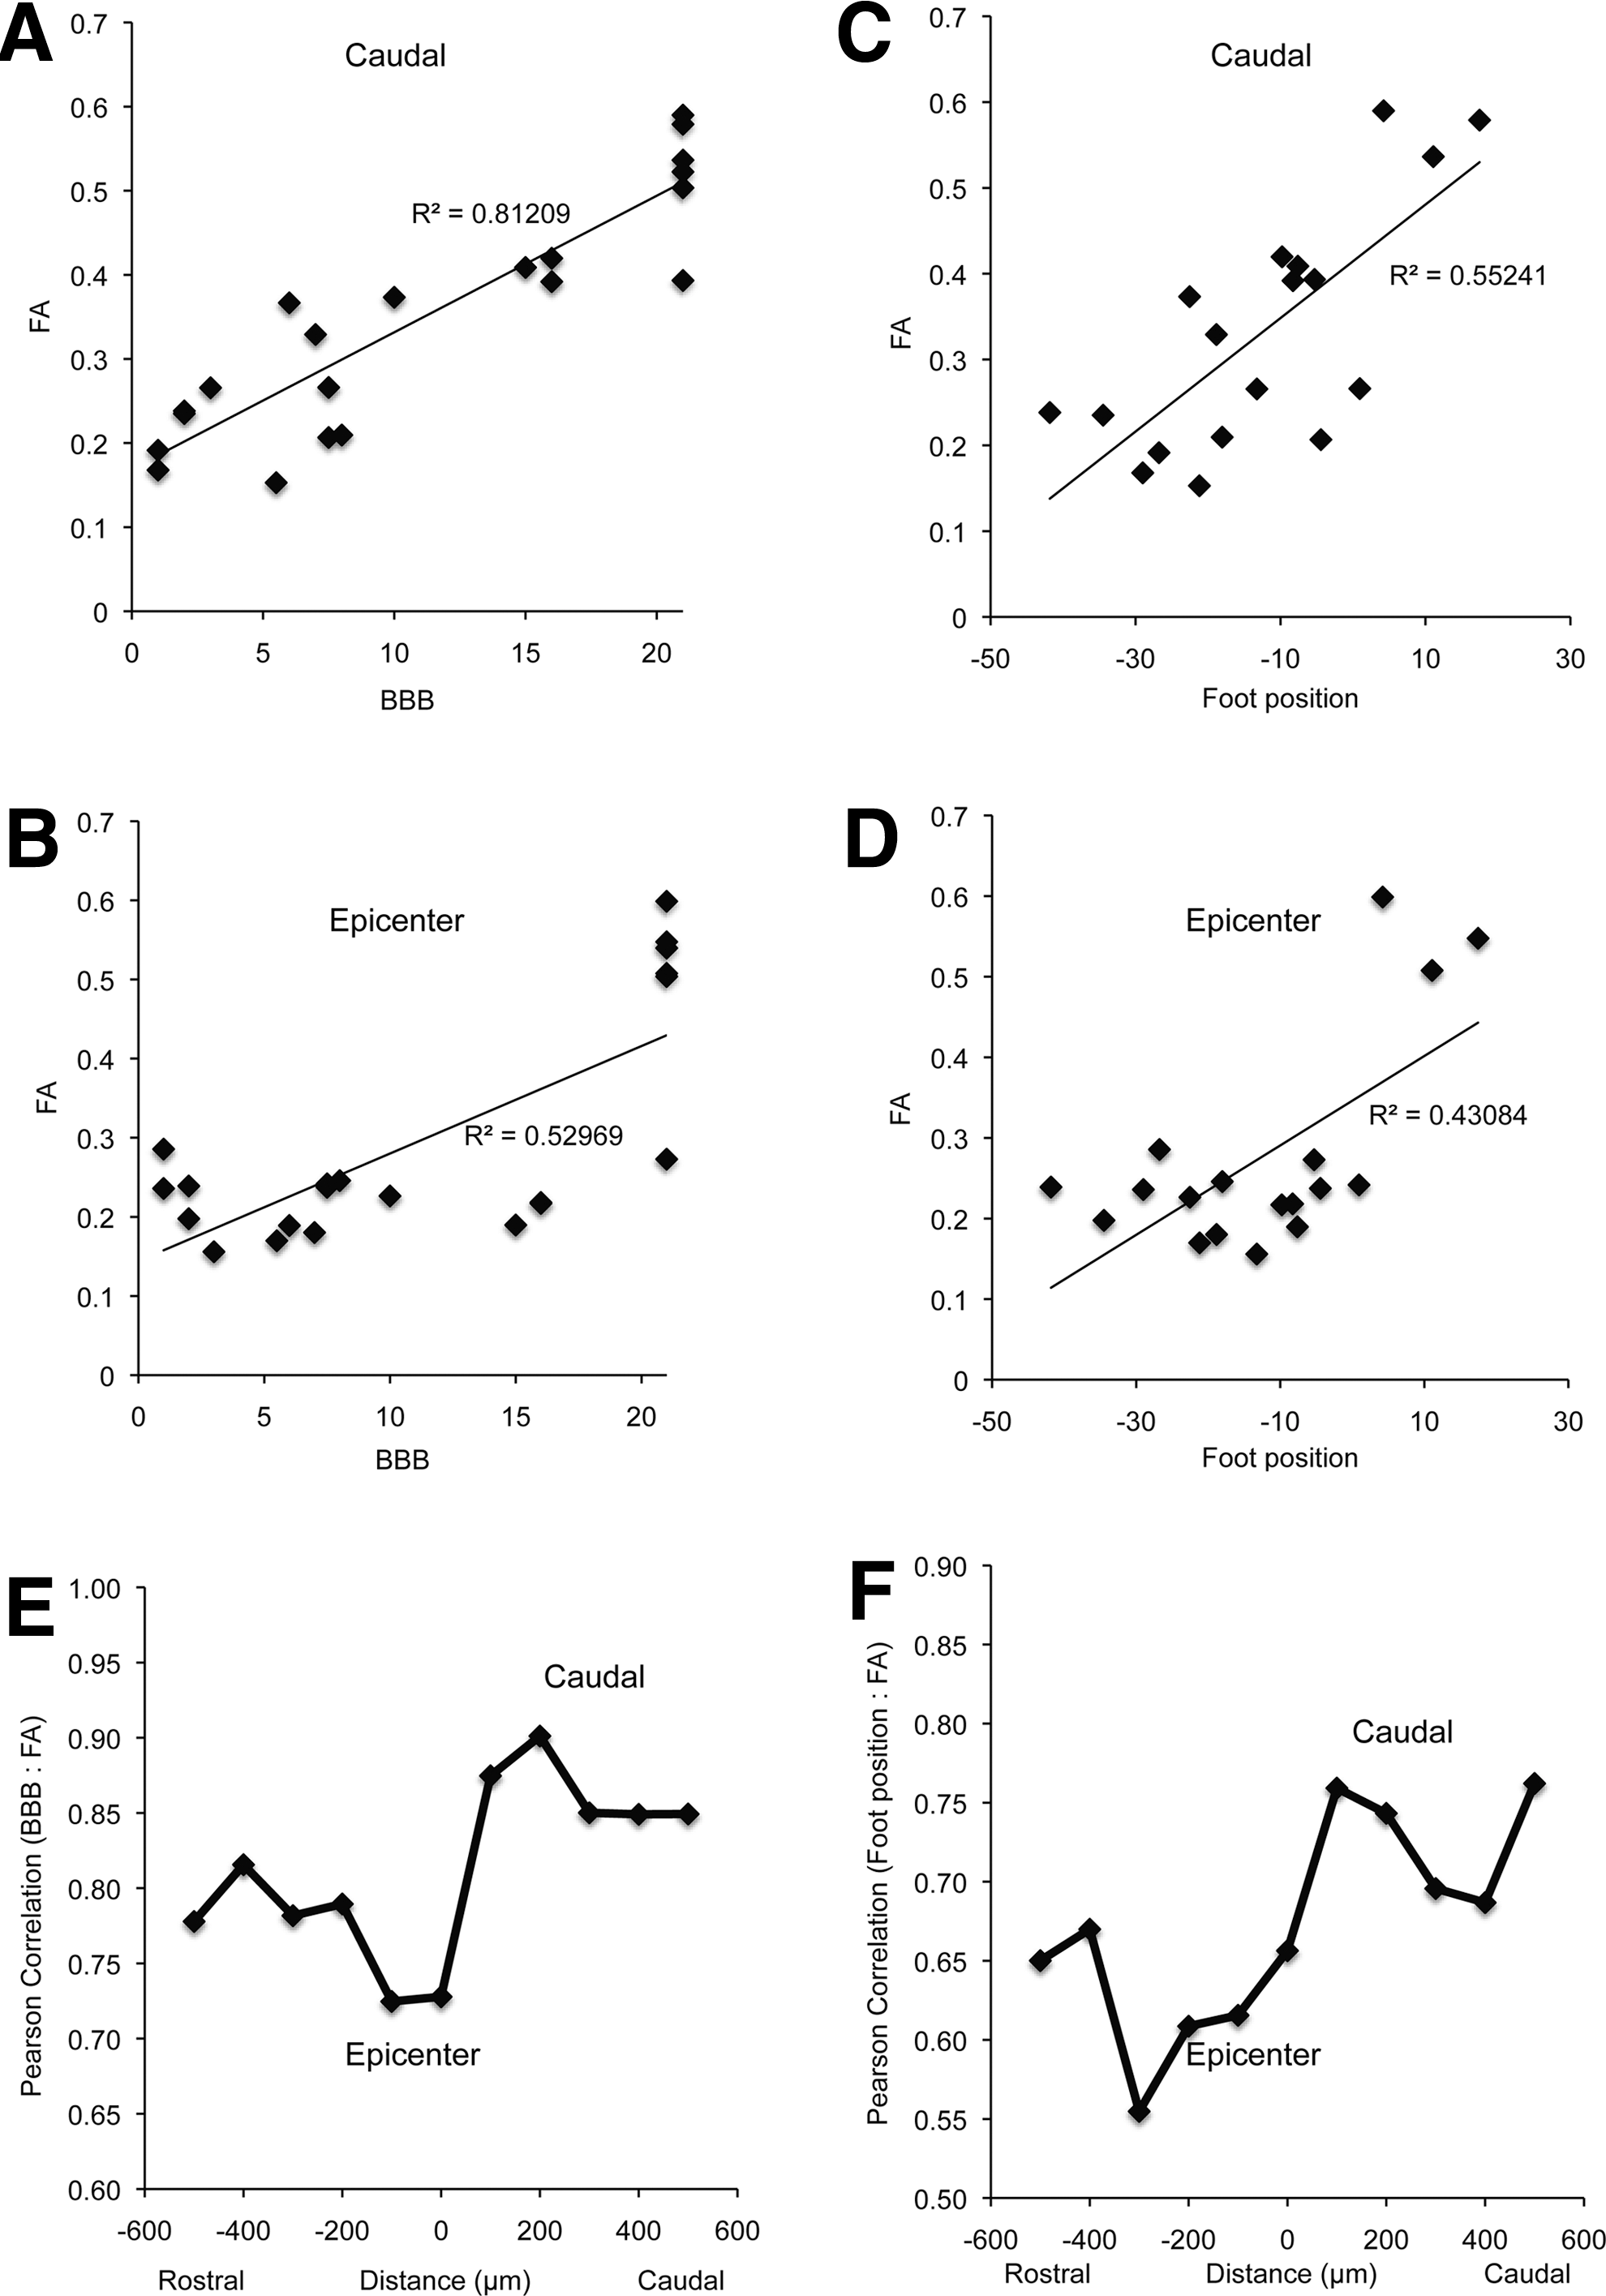
Positive correlations between imaging (fractional anisotropy [FA] value) and locomotor (Basso, Beattie, and Bresnahan [BBB] and middle swing foot position relative to hip) data. To assess for correlations between locomotor activity and diffusion tensor imaging findings, BBB scores (
Tractography (Fig. 6)
Images from sham injury animals revealed linear bundles of fibers tracking along the length of the cord parenchyma, although separate tracts could not be resolved. For all injured tissue, linear fibers were observed until immediately adjacent to the syrinx formation, at which point fibers abruptly stopped. FA values at the injury epicenter were too low to permit tracking through or around them; however, images suggested fibers passing through the preserved tissue surrounding the syrinx, although they could not be followed into the continuing cord segment. To overcome this limitation, fibers were traced starting from each end of the cord segment, with select fibers appearing to meet within the tissue surrounding the syrinx suggesting continuity. Axons passing through this preserved tissue were subsequently confirmed by immunohistochemistry.
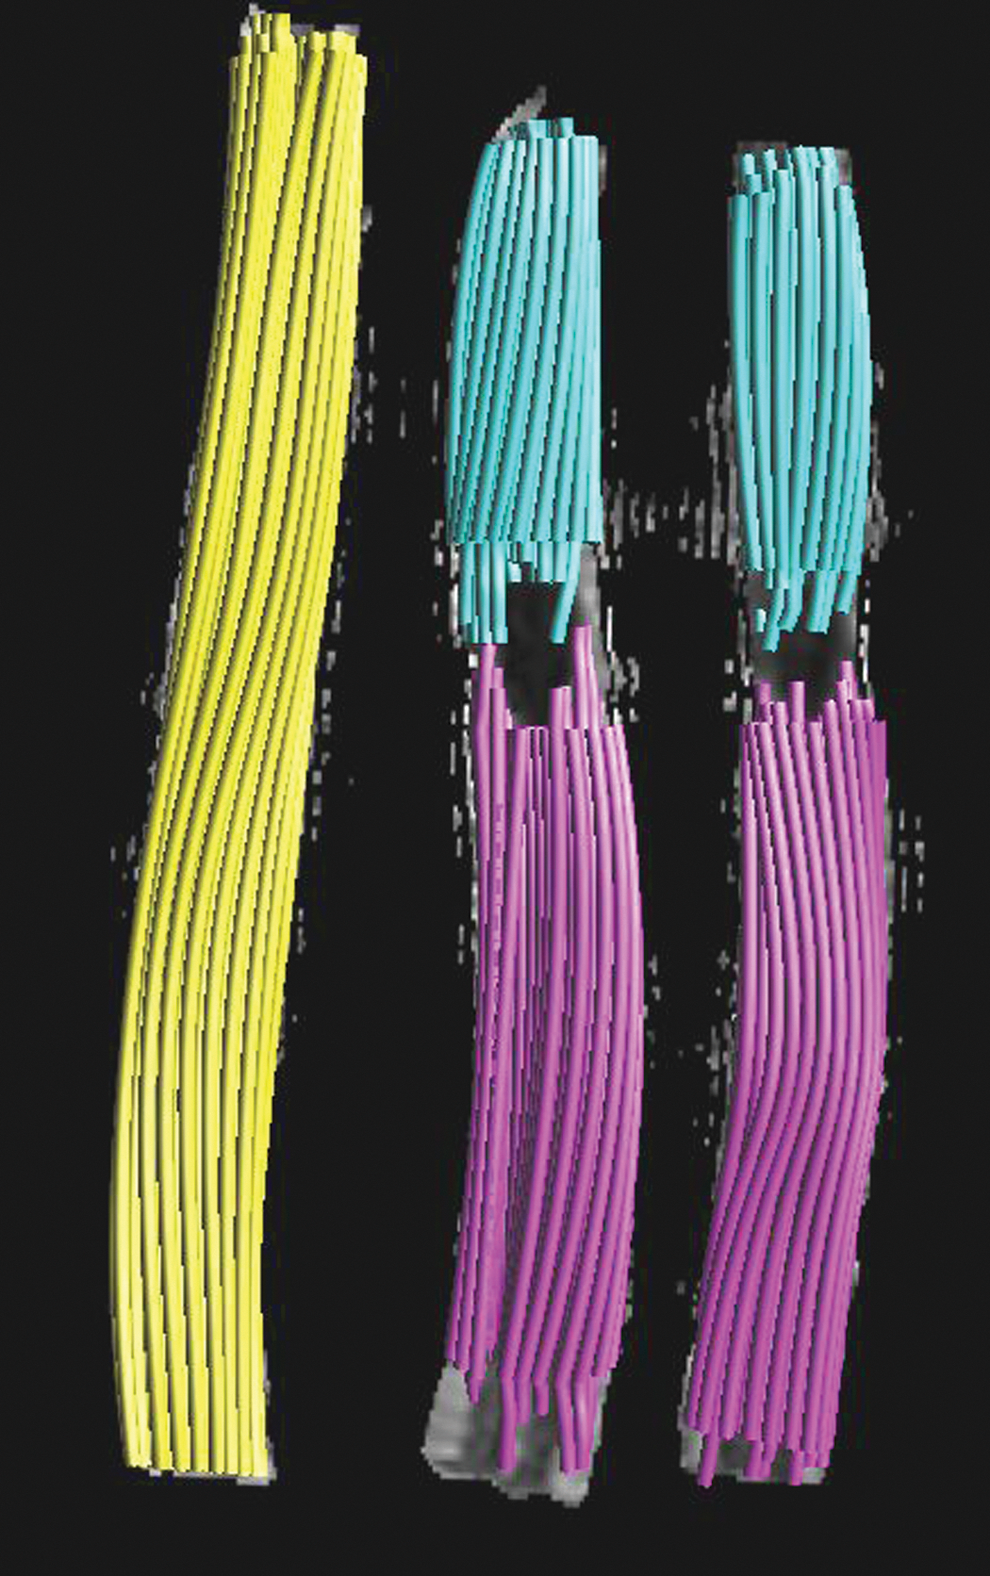
Tractography of control and injured spinal cords. Tractography of spinal cord white matter fibers is illustrated for the identical cords as seen in Figure 2. On the left, the sham injury cord (yellow) shows linear fibers that may be visualized throughout the length of the observed tissue section. Although unable to discern individual fiber tracts, fibers are seen in continuity as they travel in the rostral-caudal direction. The remaining examples are from mild injury animals showing linear fibers traveling until immediately adjacent to the injury epicenter. At this location, more centrally located fibers appear to stop abruptly at the syrinx while peripherally oriented fibers appear to continue through the spared parenchyma. To overcome low fractional anisotropy values that do not allow for tracking through or around the syrinx, fibers were tracked starting at either end of the observed segment. Select purple and blue fibers appear to meet within the peripherally spared parenchyma suggesting continuity past the injury site. This continuity was confirmed using immunohistochemistry. Color image is available online at
Immunohistochemistry
After demonstrating these strong correlations between caudal FA values and functional outcomes, we examined the relationship of these measures with tissue damage assessed histologically. Low power microscopic observation of tissue at and immediately surrounding the injury site revealed pathology consistent with spinal cord contusion, including evidence of tissue destruction as well as syrinx formation while more distant sites showed preserved tissue architecture (Fig. 7). Matching MR images show a similar pattern. Injured tissue demonstrated a robust glial response including astrocyte localization consistent with the development of scar formation along with significant glial immunoreactivity surrounding the syrinx, which extended approximately 100 μm rostral and caudal from the injury epicenter. Swollen axonal profiles were observed at the injury epicenter and extended approximately 100–200 μm in both rostral and caudal directions (A: inset within middle panel), while smaller fine caliber profiles were observed in the more proximal and distal segments, consistent with the profiles observed throughout sham injury animals (B). There were no areas of focal necrosis or tissue disruption extending beyond the injury epicenter.
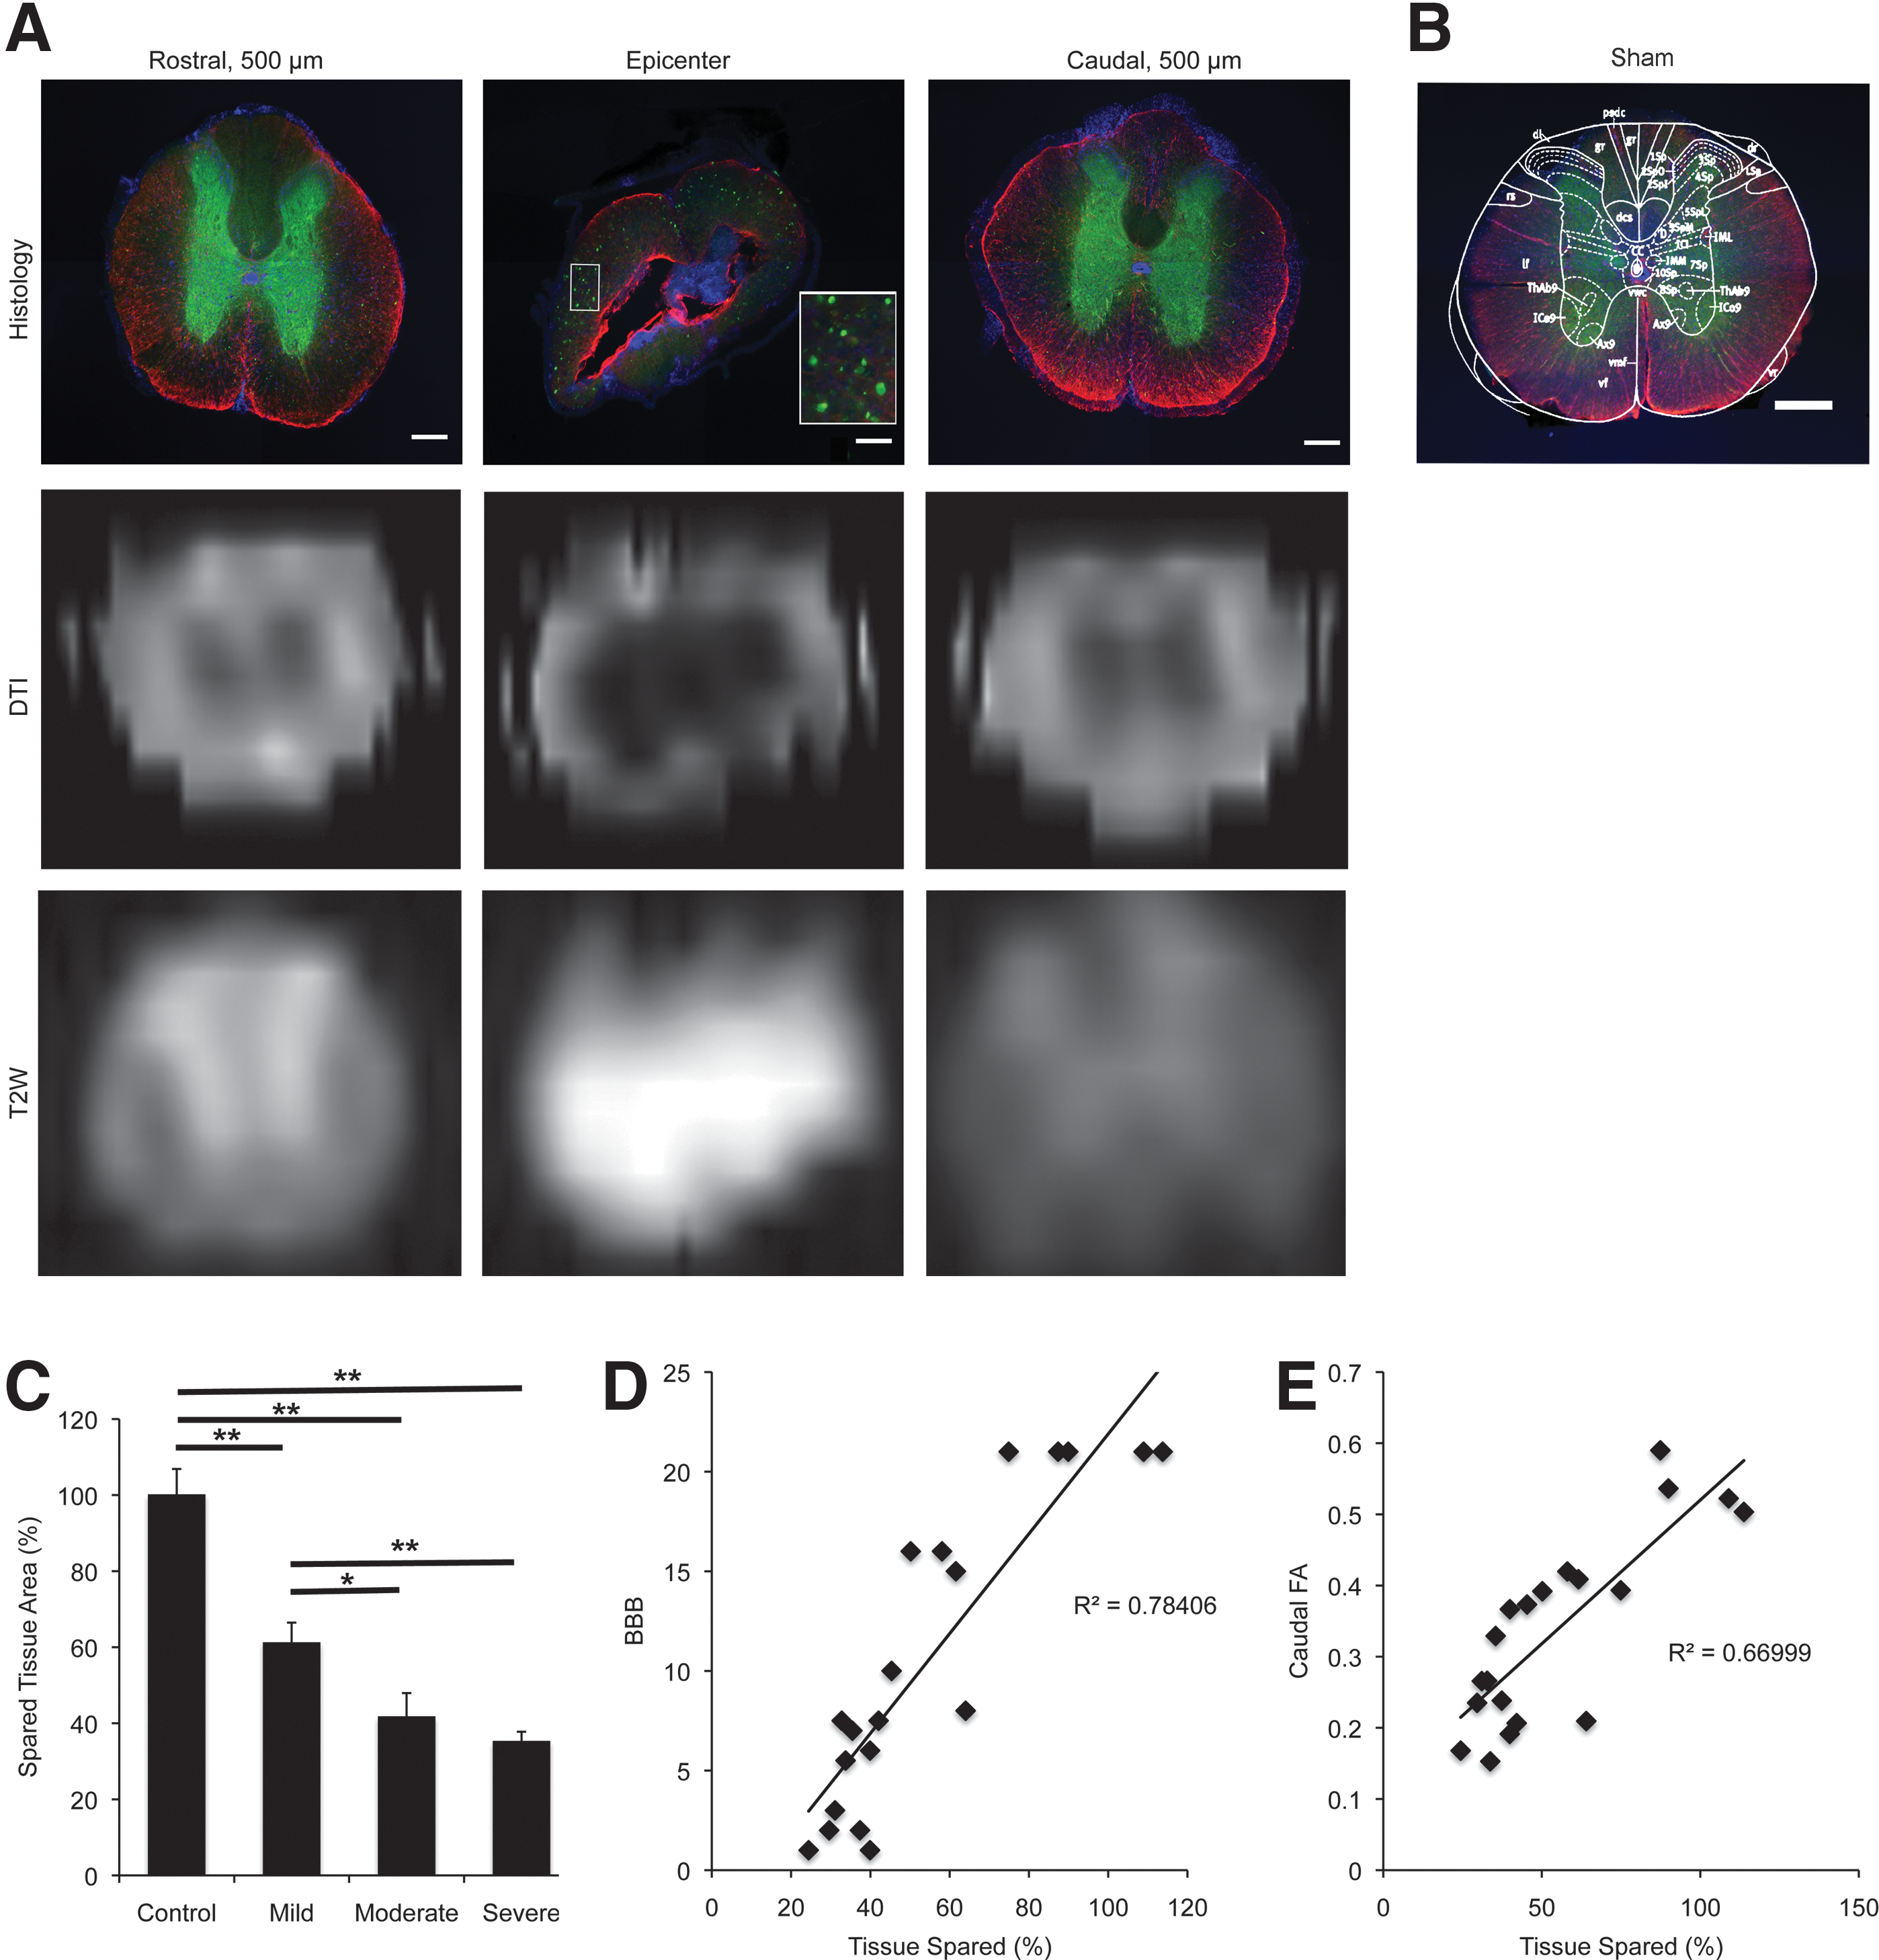
Correlation of spinal cord histology after contusion injury. Representative photomicrographs of spinal cord histology along with diffusion tensor imaging (DTI) and T2W images at the injury epicenter (middle) as well as at sites 500 μm rostral (left) and caudal (right) to the epicenter (
Calculation of percentage of spared tissue area (C) revealed significant differences between sham injury and all injury groups as well as between mild and moderate or severe injury (p<0.05); however, no significant differences were observed between moderate and severe injury. Plots of percentage of spared tissue and BBB score (D) as well as caudal FA (E) as functions of tissue sparing revealed relatively strong coefficient of determination values (R2=0.78 and 0.70, respectively).
Discussion
In modeling traumatic SCI, graded contusion injuries approximate the spectrum of clinical outcomes and histology. 36,37,42 –46 Given the preservation of select ascending and descending white matter fibers, many patients retain some neurologic function below their injury site and recover additional function over time, depending on the location of injury. 47 Experimental spinal cord contusion is a well-validated injury model with histopathology similar to that seen in human traumatic SCI, including central syrinx formation with associated astroglial proliferation and axonal swelling as well as corresponding imaging findings that mirror those observed after human trauma. 37,44,48,49
To assess a range of SCI, animals in the current study underwent contusion of three severities followed by locomotor/hindlimb kinematic, imaging, and histopathologic evaluations. Locomotor evaluations revealed that moderate and severe injury animals were unable to bear weight on their hindlimbs while mild injury animals retained this function as demonstrated by their respective BBB scores and hindlimb kinematic data. Although moderate and severe injury animals did not regain weight- bearing status, some improvement in locomotor function was observed as was also true for mild injury animals. These findings are comparable to those made by Basso and colleagues 36 in their original description of the BBB scale. Similarly, the current study's evaluations of hindlimb kinematics were similar to those of Couto and associates 50 after experimental mild SCI contusion as well as Alluin and coworkers 51 after spinal cord clip compression. The ability to recover and/or preserve weight-bearing has significant clinical implications for patients with SCI by reducing associated comorbidities such as pulmonary infections and skin breakdown. Therefore, an experimental paradigm in which a dependent variable (e.g., impactor height) can be changed to generate different neurological outcomes makes preclinical SCI contusion injury an important and clinically relevant model in which to explore relationships between imaging techniques and functional outcomes.
Experimental traumatic SCI severity and recovery are linked to the extent of axonal injury with several studies indicating correlations between functional outcome and volume of spared tissue (positive) 37,52,53 or injury severity (negative), 35,54,55 although none evaluated concomitant neuroimaging. Imaging is a critical component of clinical SCI evaluation, with conventional MR studies providing insight into pathological macroscopic changes within spinal cord parenchyma. 56
In the current study, T2 MR sequences revealed hyperintense regions at the injury epicenter with surrounding linear hyperintensities indicative of central syrinx formation and preserved white matter fibers, respectively, a finding subsequently confirmed by histology. These findings are identical to those observed in the subacute/chronic phases of evolving human traumatic SCI contusion. This study, however, is novel through its use of DTI with corresponding FA values and tractography that were able to provide additional information that is not possible with conventional T2 sequences. 17,22
In regions immediately adjacent to injury epicenters, T2 sequences demonstrated imaging characteristics suggestive of normal parenchyma. FA values within identical regions, however, indicated white matter pathology as suggested by values less than sham injury. Although values at the injury epicenter were similar for all injury groups, values in rostral and caudal directions revealed stepwise increases, similar to results seen by Konomi and colleagues 21 after marmoset SCI contusion. Further, FA values were indicative of groupings as determined by locomotor evaluation with mild injury values significantly different from moderate and severe injury values. At all increments rostral and caudal to the injury epicenter, FA values for all injury groups remained below control values, suggesting evolving white matter pathology not appreciated by conventional imaging or immunohistological evaluation.
These findings suggest that while FA computations may not be able to distinguish severity at the injury epicenter, they are able to provide insight into the relative pathological severity within adjacent white matter as nearby as 100 μm away from the epicenter. Given that the dynamic range of FA values between severely damaged tissue at the epicenter and normal tissue is small (i.e., ∼0.1), it may be necessary to combine other MR imaging modalities (e.g., magnetization transfer, etc.) to further distinguish severity at the injury epicenter.
Our observations have implications for clinical algorithms of SCI recovery in that the relative health of preserved white matter fibers after SCI may be predictive of potential recovery. It is reasonable to assume that healthier axon tracts have a better chance for recovery and that preservation of axons within regions adjacent to injury sites provides one of the best opportunities for regrowth. Studies examining mechanisms and therapeutic interventions aimed at attenuating axonal growth inhibition after experimental SCI indicate the importance of perilesional axon health via preservation and growth of remaining fibers past lesion sites. 3,41 Reliance on conventional MR sequences for relative spinal cord health prognosis may be limited. Incorporating DTI into a clinical SCI algorithm provides a non-invasive technology for evaluation (tractography) and quantification (FA values) of perilesional white matter health. Serial imaging may be followed over time to evaluate for potential recovery and provide guidance for post-injury therapeutic interventions and prognosis of functional recovery within the context of a clinical trial.
The ability to correlate physical examination findings with imaging remains one of the goals of clinical medicine. For patients with SCI, the current gold standard for evaluation is the clinical examination with imaging to confirm anatomical localization followed by serial examinations and imaging to document neurological dysfunction and/or recovery. Before DTI, tissue adjacent to the injury site was presumed to be healthy if conventional MR suggested normal anatomy; however, preclinical studies have indicated that this perilesional area may harbor evolving pathology. 10,31 Therefore, FA values may serve as surrogate markers of axon survival, one that correlates tightly with functional outcome.
Our study is novel through its use of DTI to provide additional information that is not appreciated on conventional T2 sequences. 17,22 We combined locomotor (BBB) and kinematic (middle swing foot position relative to hip) data together with imaging (FA) data to look for correlations. At all locations along the spinal cord, the FA-BBB and FA-middle swing foot position relationships revealed statistically significant positive correlations as measured by linear regression and Pearson correlation coefficients. For FA-BBB plots, a relatively weak correlation was observed at the injury epicenter, again suggesting that FA values may not be able to establish relative injury severity at this location; however, more positive correlations, especially caudal to the epicenter, suggest preserved yet injured white matter fibers relevant to locomotion.
To date, previous studies of DTI in experimental traumatic SCI have focused observations on either single injury severity, 21,29 –34 acute time points, 4,7,11 Wallerian change, 5,23 transection, 24,26,57 or compression 27 paradigms with only limited extension to clinical scenarios. 22 Studies by Metz and associates 48,58 exploring correlations between various behavioral, electrophysiological, and MR imaging evaluations after experimental contusion and clinical SCI found significant relationships between different locomotor assessments as well as between ambulatory capacity and MRI lesion length and ventral tissue bridge, although DTI was not performed. Several small clinical studies have explored DTI and FA in evaluating post-traumatic SCI neurologic function and recovery 59 –62 and have tried to correlate imaging and clinical findings 8,9,63,64 with some success. DTI has also been explored in other spinal neurologic conditions such as cervical spondolytic myelopathy, 61,62,65 neuromyelitis optica, 66 transverse myelitis, 67 multiple sclerosis, 68 Brown-Sequard syndrome, 6 and spinal neoplasms. 69,70
Our findings suggest that FA is able to differentiate between mild and moderate/severe experimental traumatic SCI within parenchyma outside of the contusion site itself, and that these findings correlate with locomotor activity, especially within caudal segments. While this work was in preparation, similar conclusions were obtained by Jirjis and coworkers, 71 although their locomotor analysis was less complete and tractography was not assessed.
The long-term clinical goal is to incorporate DTI into a clinically relevant assessment algorithm for the SCI patient population. To achieve this goal, each patient would serve as his or her own control by first establishing FA values within spinal cord segments remote from the injury site to serve as comparisons to values at and adjacent to the injury epicenter. Over time, serial imaging would establish individual and/or group databases that would provide a range of FA values that correlate with certain neurologic functions and/or expected recovery. In that DTI-specific sequences may be acquired during routine MR studies with only a few minutes of additional scanning time needed, adding DTI to current SCI imaging protocols would have only minimal impact on total scan times and patient comfort.
Given the relatively small size of the rodent spinal cord, the current study was limited by FA values that reflected the entire cord parenchyma and resolution constraints of the MR imaging machine and software. In that the human spinal cord is considerably larger than that of the rodent and accounting for continuing improvements in MR technology and analytic software, future clinical studies may tailor caudal FA values to individual white matter tracts to provide more specific information regarding motor and sensory function. 17,22,38,60,72,73
Conclusion
This study provides preclinical data for the development of more comprehensive examinations using DTI in the context of SCI evaluation. Our findings suggest that incorporating DTI into comprehensive clinical SCI assessments may offer a distinct non-invasive methodology capable of providing information regarding both the extent and the prognosis for potential locomotor recovery. In particular, our findings indicate that future clinical DTI studies should focus on caudal FA values as a potential biomarker in human traumatic SCI.
Footnotes
Acknowledgments
We acknowledge support from the National Institutes of Health to F.H. (Core Center for Quantitative Neuroscience with Magnetic Resonance, P30NS052519) and to S.M.S (R01NS080388), and from the Falk Medical Research Trust and the Wings for Life Foundation to S.M.S.
Author Disclosure Statement
No competing financial interests exist.