




Abstract
The aim of this study is to estimate the long-term cost-effectiveness of two different rehabilitation trajectories after severe traumatic brain injury (sTBI). A decision tree model compared hospitalization costs, health effects, and incremental cost-effectiveness ratios (ICER) of a continuous chain versus a broken chain of rehabilitation. The expected costs were estimated by the reimbursement system using diagnosis-related group and based on point estimates of the Disability Rating Scale (DRS); the health effects were measured by means of area under the curve (AUC). The incremental health benefit was estimated as the difference in the AUCs between the chains. Lower values on the DRS scale indicate better health; thus, smaller AUCs were preferred. The modeled population was a cohort of 59 patients with sTBI (30 in continuous chain; 29 in broken chain) with 6-weeks, 1-year, and 5-year post-injury follow-ups. Regarding the DRS estimates, 5-year AUCs were 19.40 (continuous chain) and 23.46 (broken chain). Across 5 years, the continuous chain of rehabilitation had lower costs and better health effects. By replacing the broken chain with the continuous chain, NOK 37.000 could be saved and 4.06 DRS points gained. By means of probabilistic sensitivity analysis, the majority of ICER estimates (67% of the Monte Carlo simulations) indicated that a continuous chain of rehabilitation was less costly and more effective. These findings indicate that the trajectory of continuous rehabilitation represents a dominant strategy in that it reduces costs and improves outcomes after sTBI under reasonable assumptions.
Introduction
T
It is estimated that the total annual costs of TBI are $48.3 billion in the United States. 4 According to the European Brain Council's Costs of Disorders in the Brain in Europe 2010 study, the total annual costs of TBI in Europe are €33 billion. 5 In a study of the costs of acute TBI treatment in the United States, McGarry and associates 4 reported that the costs of emergency stays in hospital were $50,438 for survivors of severe TBI (sTBI). Average costs increase dramatically for persons who receive rehabilitation treatment.
According to Ricker and colleagues, 6 institution-based rehabilitation and support functions for a patient with sTBI may cost up to $85,000. In a 4-year follow-up study, the average costs for medical and long-term care services averaged $196,460 for survivors receiving rehabilitation services compared with $17,893 for those receiving no rehabilitation. 7 Acute rehabilitation costs for survivors of sTBIs have been shown to average $110,891 per person, or about $1000 per day. 8 Limited data exist regarding TBI hospitalization and rehabilitation costs in European countries. 5 It is suggested from the US estimates, however, that treatment and conventional rehabilitation are expensive, and new models are needed to evaluate the cost-effectiveness of different treatment strategies.
Early rehabilitation after sTBI is associated with better outcomes and results in overall cost savings. 9 –11 Intensive intervention appears to lead to gains in the acute phase. 12 An effective combination of medical and rehabilitation efforts produced shorter hospital stays and better living situations for patients with sTBI. 13 The cost-effectiveness of TBI rehabilitation after severe TBI has yet to be determined, however.
Recently, we published a quasi-experimental study 14 that evaluated whether the early initiation of a continuous chain of rehabilitation could improve functional outcomes for patients with sTBI. We noted that patients treated with early rehabilitation in a continuous chain of treatment had better functional outcomes 12 months post-injury. Nevertheless, the consequences on functioning beyond 1 year post-injury have not been studied and are of major importance when evaluating the cost benefits of initiating rehabilitation early. Greater knowledge on this subject could improve resource allocation and the prioritization and development of rehabilitation programs for patients with TBIs. 15
In this study, we aimed to estimate the long-term cost-effectiveness of the early initiated, continuous chain of rehabilitation after severe TBI compared with the broken chain of rehabilitation. We hypothesized that the early initiation and continuous rehabilitation trajectory would be more cost-effective.
Methods
Decision tree model
We developed a decision tree model to represent the two rehabilitation trajectories after sTBI (Fig. 1). Two treatment options, the continuous or broken chain of rehabilitation, are determined by the number of beds available in the intensive care unit (ICU).

The decision tree illustrating the pathway of a continuous chain of treatment versus a broken chain of rehabilitation for patients with severe TBI.
In Figure 1, treatment paths are identified by decision nodes where each node is represented by probabilities for treatment choice. In the continuous chain of treatment option, early comprehensive rehabilitation started in the ICU during acute TBI hospitalizations. When the patients' medical conditions were sufficiently stable, they were transferred directly to one of two specialized rehabilitation hospitals (in the eastern and southern regions) for further subacute brain injury rehabilitation. In the broken chain of treatments option, early rehabilitation at the ICU was not offered, and there were no direct transfer to rehabilitation units. Instead, these patients received either inpatient brain injury rehabilitation in subacute rehabilitation units after a waiting period at a local hospital or received no inpatient rehabilitation at all. In-depth descriptions of the treatment chain models and their contents are described in Andelic and coworkers. 14
In this study, the costs include costs related to TBI hospitalizations and inpatient rehabilitation in a 5-year perspective. Expected costs were calculated from the reimbursement system. In Norway, the acute hospitalizations and inpatient rehabilitation were covered by activity-based financing and block grants. The activity-based financing is based on diagnosis-related groups (DRG). The DRG system classifies hospital services into groups that are medically related and homogeneous with regard to use of resources. DRG is a way of describing a hospital's case mix. 16 Each DRG group is given a cost weight representing the resource utilization of the specific DRG group relative to the average patient. The average patient is given a DRG weight equal to 1. In 2009, one DRG was estimated to NOK 35,127 ($1 is equivalent to NOK 6.09).
Estimated health effects and expected costs were evaluated and summed over each path. These are illustrated by the cost per effect at each end node in Figure 1 according to the trajectories in a continuous versus broken chain of rehabilitation.
Study participants
This cost-effect analysis used the clinical data of 59 patients with severe TBIs who survived 5 years post-injury. Patients were admitted to the Trauma Referral Centre for the southeast region of Norway (Oslo University Hospital Ulleval [OUH]) in the period from 2005 to 2007 and had 6 weeks, 1 year, and 5 years post-injury follow-ups. The study setting and inclusion/exclusion procedures have been described elsewhere. 14
Briefly, the inclusion criteria for this study were being between 16–55 years of age, having a Glasgow Coma Scale (GCS) ≤8, 17 needing neurointensive care (i.e., neuromonitoring to optimize the conditions for neuronal survival) for at least 5 days, and survival 5 years post-injury. Because ethically justifying the randomization of patients seemed untenable for researching the acute care of patients with TBI, 18 we used a quasi-experimental study design for the inclusion of the patients in the acute phase. In general, the capacity (i.e., available-bed principle) of the ICU determined assignment to the continuous chain of treatment or to the broken chain of treatment and delayed admission to inpatient rehabilitation.
A total of 64 survivors with sTBIs were initially included in the study and were followed to 6 weeks. Three patients dropped out and two patients died before the 5-year follow-up. Ultimately, 30 patients (23 males) were assigned to the continuous chain of treatment and 29 patients (22 males) were assigned to the broken chain of treatment. As previously reported, 14 no statistically significant differences were found between the two treatment groups regarding the demographic variables, causes of injury, or clinical severity of injury.
Clinical outcomes
Functional status was assessed using the Disability Rating Scale (DRS), which measures levels of arousal, awareness, and responsiveness (including eye opening, communication ability, and motor response); cognitive ability for self-care activities (such as feeding, using the toilet, and grooming); dependency on others (level of functionality); and psychosocial adaptability (employability). 19 The scores on the DRS items included values from 0 to 29 (low to high disability level). The first author scored the DRS at the 6-week, 1-year, and 5-year follow-ups. The health effect was measured by means of area under the curve (AUC) analyses. 20,21 AUC was estimated as the integral of the DRS score from 6 weeks to 5 years, including the 1-year follow-up. 20
Lower values on the DRS scale refer to better health outcomes; thus, lower AUCs are preferred. For instance, the AUC at Sunnaas Rehabilitation Hospital (17.28) indicates a better health outcome compared with that of Rehabilitation Clinic in Kristiansand (20.28) (Table 1).
AUC, area under the curve; SD, standard deviation.
AHUS (Akershus University Hospital).
Østfold, Lovisenberg and acute hospitals from Sørlandet.
Transition probabilities
How the patients moved from one type of treatment to the next option was defined in terms of transition probability. 22 The assumptions are based on data collected in a previous study 14 and are defined in Table 2. The uncertainty in the probabilities is represented by the beta and Dirichlet distributions.
The beta distribution has been applied for the continuous chain.
the Dirichlet distribution for the broken chain.
Costs
The identification and quantification of treatments were performed using the Patient Information Systems (PasDoc and DocuLive). We included costs related to acute hospitalizations at the Trauma Referral Centre (OUH) and at local hospitals (i.e., other acute hospitals in the southeast region of Norway) as well as for hospital rehabilitation at specialized rehabilitation units in the southeast region (i.e., rehabilitation hospitals/rehabilitation departments). In Table 3, the seven most frequent DRG codes used for acute hospitalizations are reported.
DRG, diagnosis-related group; M, medical DRG; S, durgical DRG.
$1 is equivalent to NOK 6.09.
The estimation of rehabilitation costs is very complicated and is based on the main treatment activity during the hospitalization, resources used, the ICD-10 diagnosis, length of hospital stay (LOS), and DRG weights. DRG code 462A corresponds to ICD-10 diagnosis code Z50.80 (“complex” rehabilitation, which is provided by an interdisciplinary team with a minimum of six specialized health care professionals). DRG code 462B corresponds to diagnosis code Z50.89 (“regular” rehabilitation, which is provided by an interdisciplinary team with a minimum of four specialized health care professionals). The DRG weight increases with LOS, and the algorithm is presented in the Appendix. For the purposes of this study, we included only the calculation of total rehabilitation costs of the continuous and broken chains of rehabilitation (Table 4).
LOS, length of stay; SD, standard deviation.
The weights depend on resources used and LOS; see Appendix for details.
$1 is equivalent to NOK 6.09.
Statistical analyses
The descriptive data are presented as the means and standard deviations or the proportions of subjects within predefined categories. Total hospitalization costs and average costs were estimated using SPSS version 20 (SPSS Inc., Chicago, IL).
The costs related to acute and rehabilitation hospitalizations were summed according to intervention and discounted 4%.
To evaluate whether a continuous chain of treatment is a cost-effective alternative to a broken chain of treatment, we applied the incremental cost-effectiveness ratio (ICER). Because a positive outcome is measured by a reduction in the DRS scale, we adjusted for this by including a negative sign in the definition of the ICER, defined by
A treatment strategy is considered as dominant if the strategy is both more effective and less costly than the comparator. To account for uncertainty in the model parameters, a probabilistic sensitivity analysis (PSA) was conducted. 23 In the PSA, we assumed that the uncertainty for the DRS, transition probabilities, and costs were represented by normal, beta, Dirichlet, and gamma distributions, respectively. By means of Monte Carlo simulations, new distributions of effects and costs were generated and presented in a cost-effectiveness plane and by means of cost-effectiveness acceptability curves (CEAC). 24 The analysis was performed using TreeAge Pro 2009 (TreeAge Software. 2009. Williamstown, MA: TreeAge Software, Inc).
Results
Clinical outcomes
DRS scores measured at the different time points after sTBI for both treatment trajectories are presented in Table 1. At the first follow-up time point at 6 weeks, the mean DRS scores were similar for both treatment groups. Estimated AUCs for the two strategies are illustrated in Figure 2. The 5-year AUCs were 19.40 and 23.46 for the continuous and broken chains, respectively.

Disability Rating Scale (DRS): Area under the curve (AUC) according to the rehabilitation chain in a 5-year perspective.
Costs evaluations
For all 59 study participants, the total cost related to hospitalization during the first 5-years post-injury reached NOK 74,000,000, and the average cost per patients was NOK 1,255,000. The cost for the first year after the injury accounted for more than 90% of the total 5-year hospitalization cost. The total length of stay in the first year after sTBI accounted for 91% of the 5-year bed days. The costs of 1-year and 5-year hospitalizations for 59 subjects with sTBI for the two treatment trajectories are presented in Table 5.
SD, standard deviation; LOS, length of stay; CEA, cost-effective analysis.
$1 is equivalent to NOK 6.09
Overall, the average 5-year total cost of acute hospitalizations (NOK 842,000) was considerably higher than the cost of rehabilitation (NOK 412,000). Between the two treatment trajectories, the average cost of acute hospitalization was higher for the continuous chain treatment group than for the broken chain treatment group (continuous: NOK 922,000; broken: NOK 760,000; the difference between continuous and broken chains: NOK 162,000); however, the cost of rehabilitation was higher for the broken chain treatment group than the cost in the continuous group (broken: NOK 514,000; continuous: NOK 314,000; the difference between broken and continuous groups: NOK 200,000). Together, the average 5-year cost per patient including both acute hospitalization and rehabilitation was NOK 37,000 higher for the broken chain treatment group.
Cost-effectiveness analysis
For a 5-year perspective, the treatment trajectory of the continuous chain of rehabilitation had lower costs and better outcomes when compared with the broken chain of rehabilitation's trajectory (Table 6).
$1 is equivalent to NOK 6.09.
Because a positive outcome is a reduction in scale, a smaller area indicates higher health outcomes, we adjust by a negative sign.
ICER (incremental cost-effectiveness ratio) refers to (1).
The interpretation would be that by replacing the broken chain of treatment with a continuous chain of treatment, for each patient with sTBI, NOK 37,000 could be saved, and 4.06 DRS points could be gained. Therefore, the continuous chain of treatment was considered as the dominant strategy. From a 1-year perspective, NOK 17,000 could be saved, and 0.83 DRS points could be gained by replacing the broken chain of treatment with a continuous chain of treatment.
Uncertainty in the cost-effectiveness
In the PSA, a scatter plot in the incremental cost-effectiveness plane of simulated (100,000 repetitions) pairs of 5-year incremental cost and effect is used to represent uncertainty by running a Monte Carlo simulation to propagate input parameters (Fig. 3).
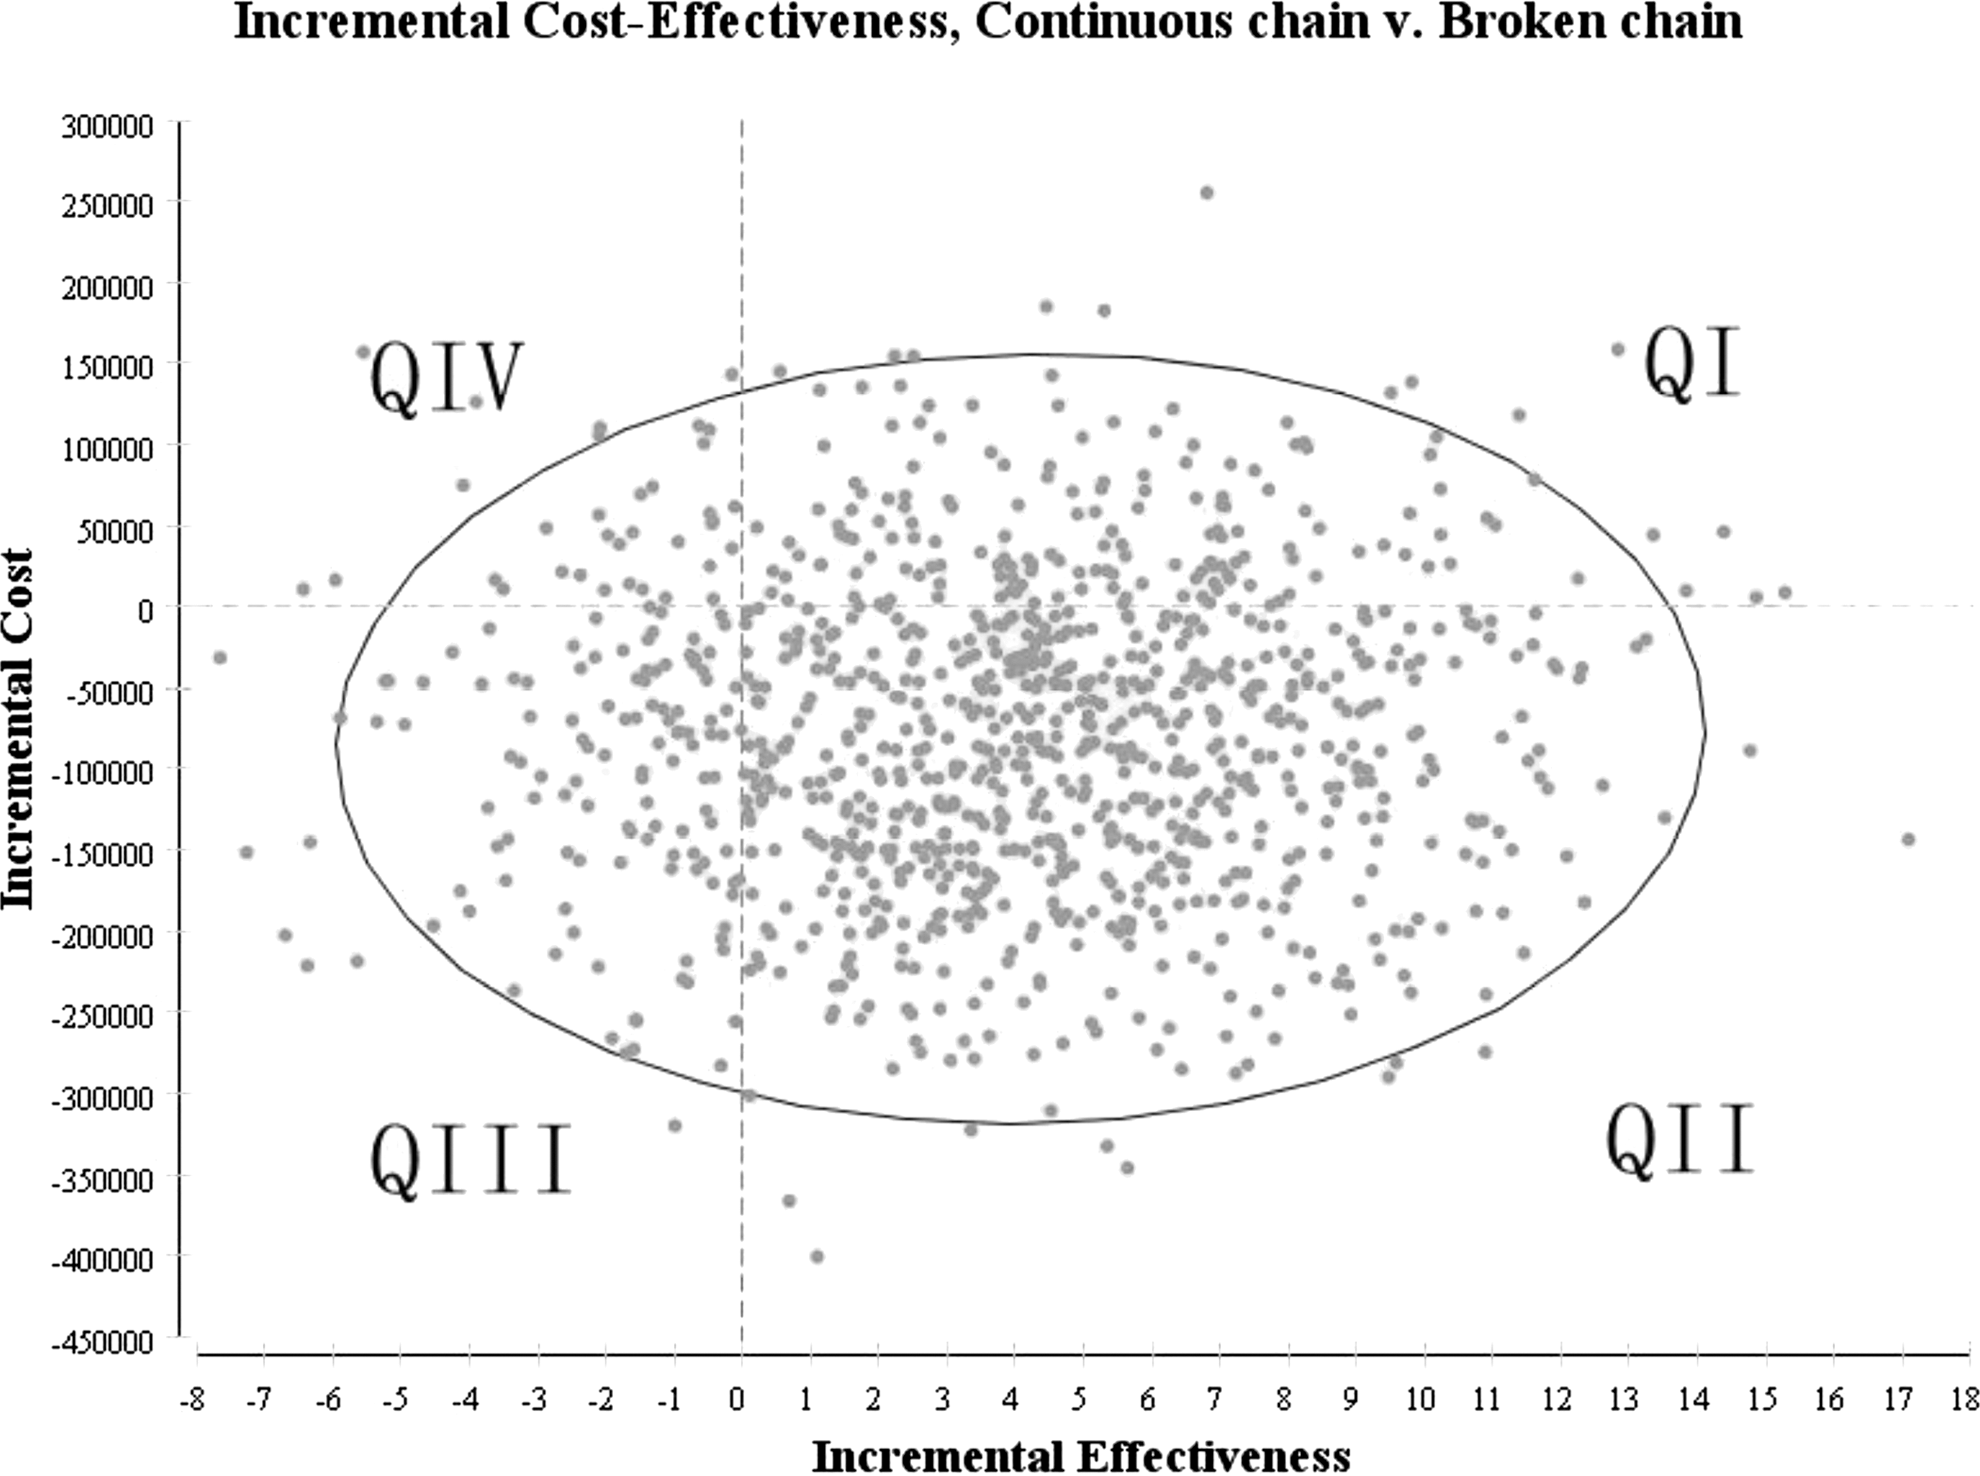
Incremental cost-effectiveness scatter plot for continuous chain of rehabilitation compared with broken chain.
The scatter plot illustrates the uncertainty surrounding the expected incremental costs and effects. The four areas in the figure describe simulated ICERs from the Monte Carlo simulation comparing the continuous chain with the broken chain: ICERs allocated in Q1 improve health outcomes and have higher costs; those in QII improve health outcomes and reduce costs; those in QIII reduce health outcomes and reduce costs; and those in QIV reduce health outcome and increase costs. Interventions falling in QII are always dominant; whether ICERs in QI and QIII are preferred depends on the willingness to pay for incremental increases in DRS.
The majority of the incremental cost-effect pairs fall into Quadrant II (67%) indicating that in 67% of the simulations, the continuous chain of treatment is less costly and more effective (Table 7).
A small proportion (3%) of the points lies in Quadrant IV, indicating that the continuous chain of treatment strategy is non-dominant, with a lower effect and higher cost. A total of 17% of pairs are in Quadrant I, and 13% pairs are in Quadrant III, indicating that there is uncertainty regarding the results of the continuous chain of treatment, either in terms of its higher effect and higher cost or lower effect and lower cost. This finding confirms that there is some uncertainty concerning whether and at what value the continuous chain of treatment strategy is cost-effective.
The CE acceptability curve (CEAC) shows that the continuous chain of treatment is cost-effective with a probability >80% regardless of the value of the willingness to pay variable (Fig. 4).
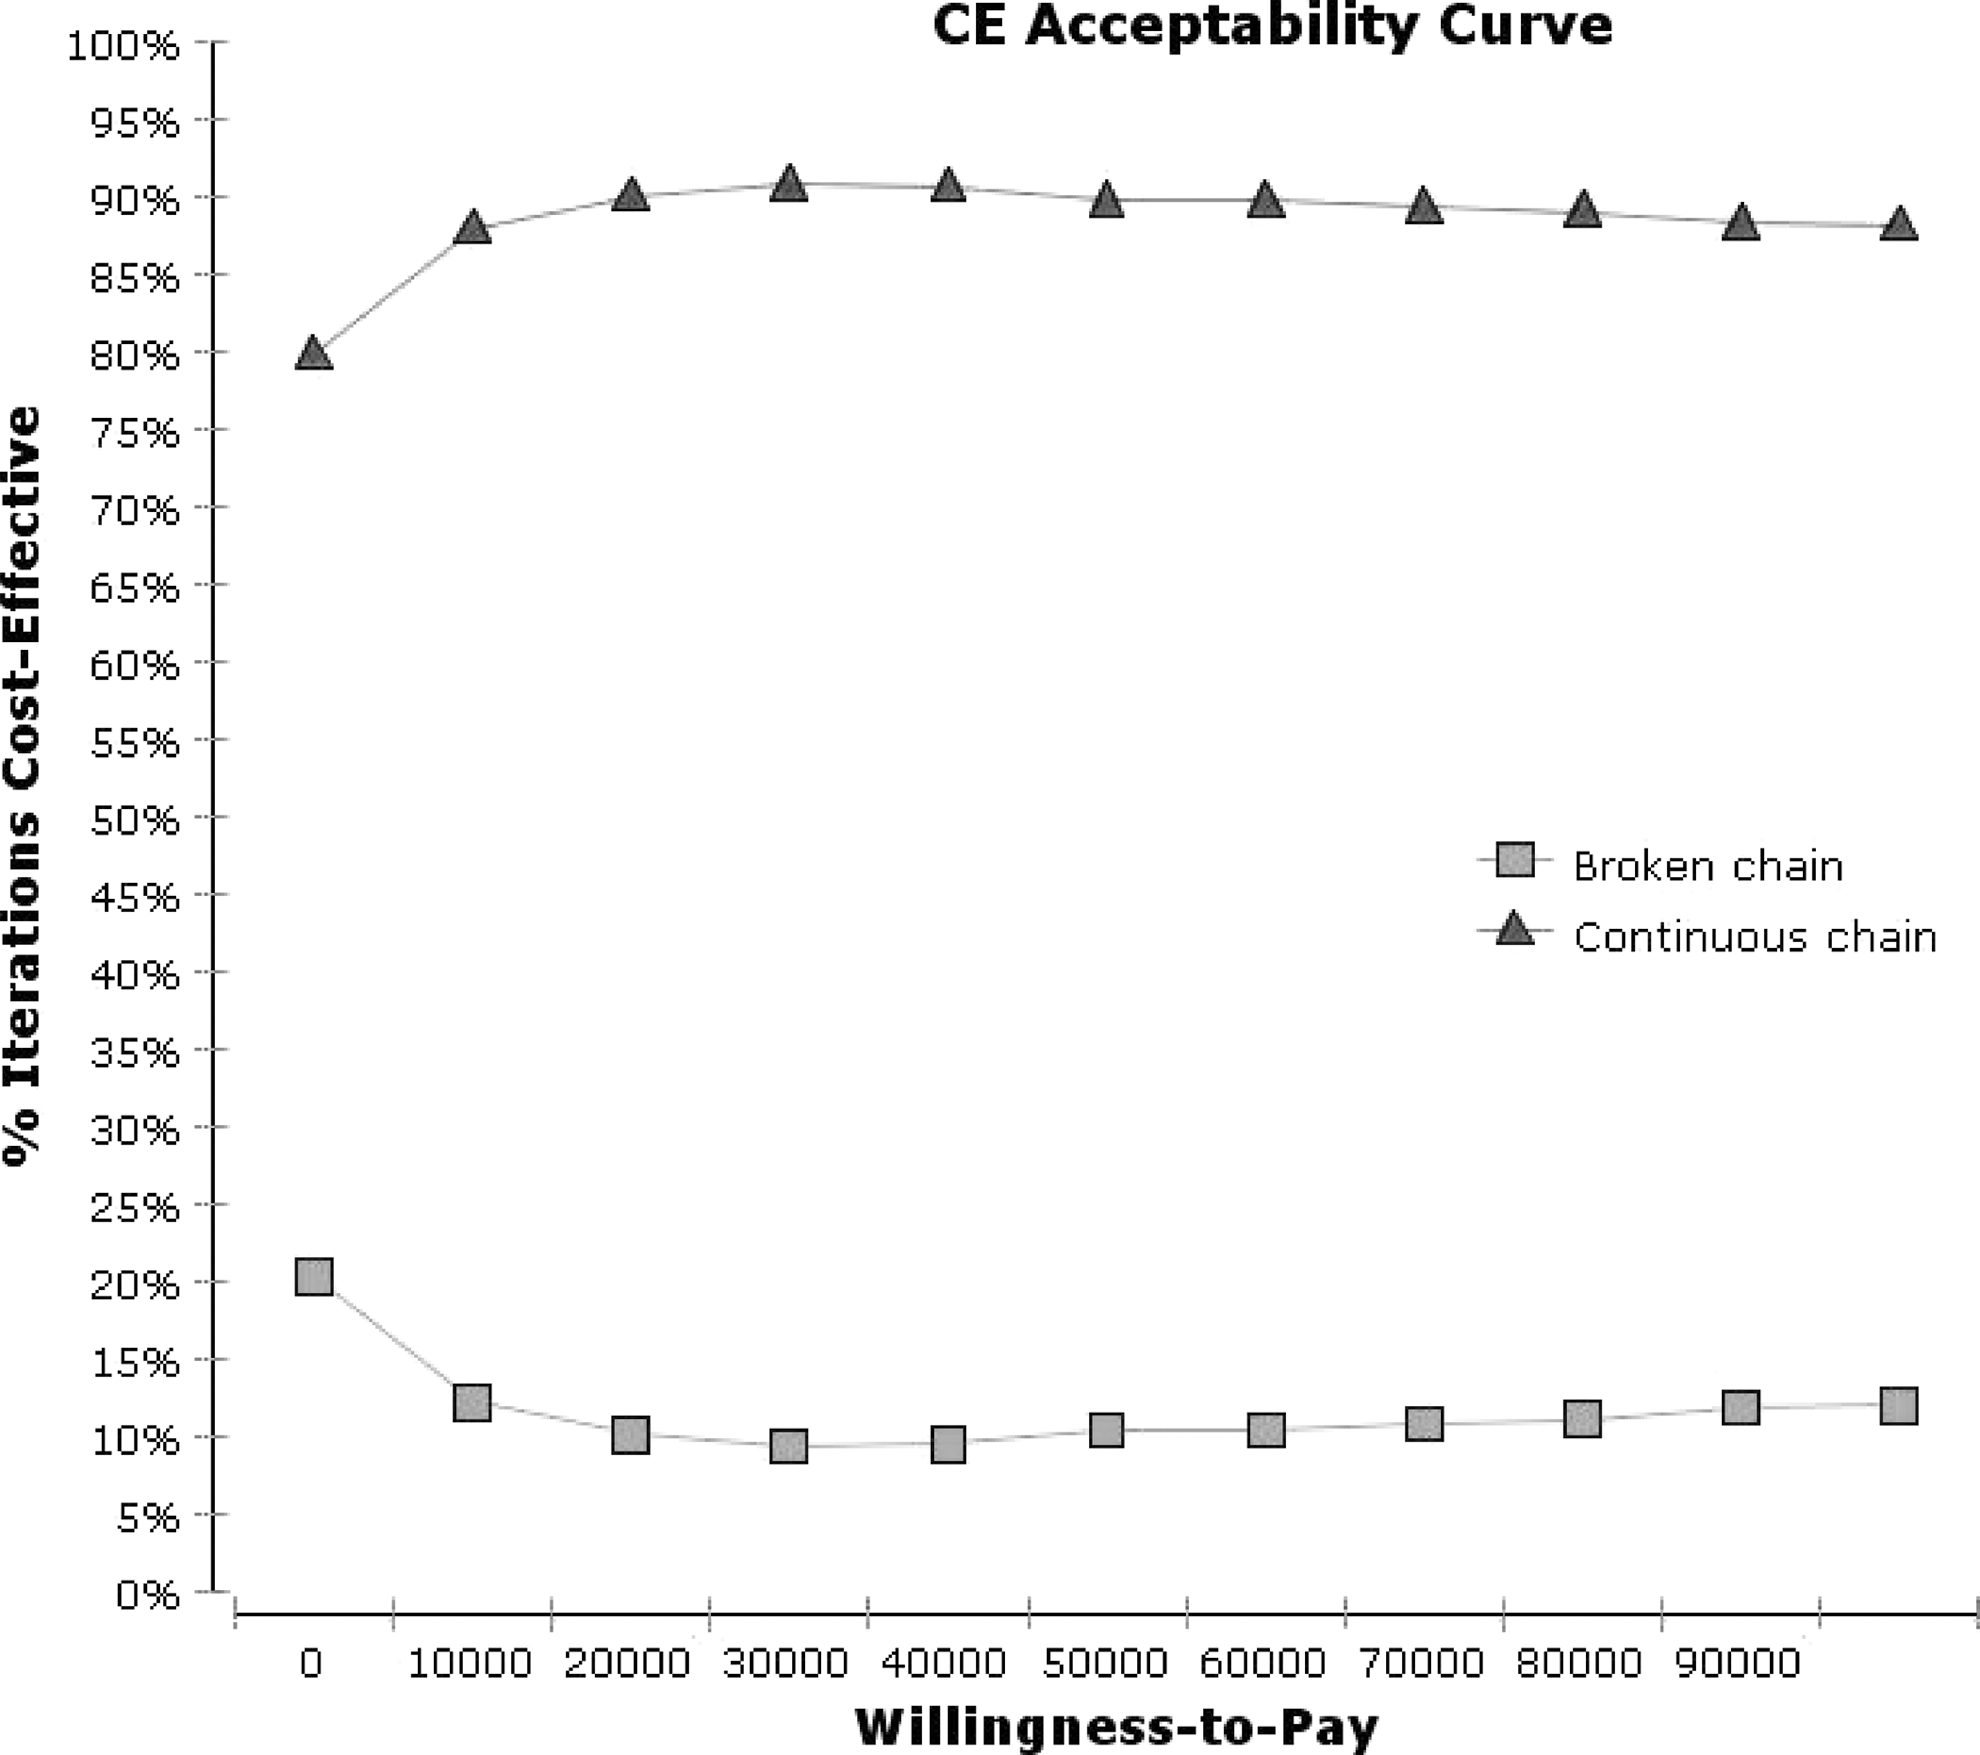
Cost-effectiveness (CE) acceptability curves.
The CEAC summarizes the uncertainty of the incremental cost-effectiveness scatter plot, indicating that the probability that the ICER falls below the acceptable ratio is approximately 80% under the continuous chain of treatment when the willingness-to-pay is NOK 0, while the ratio increases to 85% when the willingness-to-pay increases to NOK 100,000.
Discussion
This study investigates the long-term cost-effectiveness of two different rehabilitation trajectories for the treatment of patients with sTBI: the early-initiated and continuous chain of rehabilitation compared with a broken chain of rehabilitation. The results indicated that the continuous chain of rehabilitation has lower costs and better health outcomes than the broken chain of rehabilitation over a long-term period (5 years). Moreover, our findings suggest that the patients' health effects (i.e., functional improvements) are greatest during the first year after their TBIs, in line with previous studies on functional outcomes after TBI. 25 In addition, the hospital care burden of severe TBI was found to be substantial during the first year after the injury (constituting more than 90% of the total cost).
The total TBI hospitalization (acute hospitalizations and inpatient rehabilitation) costs from a 5-year perspective were substantial (NOK 1,255,000 per patient). It is understandable that the costs were largely related to TBI-related hospitalizations during the first year after injury, which include acute neurointensive treatments, life-saving intracranial and other trauma-related surgeries, and inpatient rehabilitation hospitalizations during the postacute phase.
The average cost of severe TBI hospitalizations in this study was similar to the US estimates made by Brooks and associates. 7 . However, a review by Berg and colleagues 26 in 2004, however, found considerably lower average costs per inpatient with severe TBI in Sweden (€6,045, equivalent to NOK 50,403). Their findings reflected incidence-based average costs calculated from the limited existing cost estimates. Nonetheless, it is important to mention that our cost estimates included data collected in the prospective cohort study covering both the acute hospital care in Trauma Referral Centre and in local hospitals as well as the costs of hospital-based rehabilitation. Moreover, we included patients with more severe intracranial injuries (i.e., those in need of neurointensive care for at least 5 days) who survived through the 5-year follow-up. According to McGarry and coworkers, 4 studies that include only survivors after TBI may tend to overstate the average cost of care. It is also worth mentioning that Polinder and colleagues 27 found wide variation among European countries regarding costs per inpatient day for injury-related hospital admissions, with Norway being the most expensive country.
Considering acute hospitalization costs, the continuous chain of treatment was more expensive than the broken chain of treatment, indicating that more resources (including those for early initiation of rehabilitation in an ICU unit) were needed for the former trajectory in the acute-TBI phase. The total rehabilitation costs were, however, lower in the continuous chain of treatment indicating that this group needed in-patient rehabilitation of shorter duration most likely because of the faster functional recovery that resulted from having received early initiation of rehabilitation in the ICU. 28
Although many clinicians are well aware of the expensive nature of TBI health care, many of them are reluctant to accept responsibility for health care strategies that place a considerable financial burden on resources, even if the care strategy has the potential to improve the patients' outcomes. 29 There is scant literature regarding the cost-effectiveness of TBI-related interventions. A recently published study found that aggressive treatment in the acute phase (i.e., invasive intracranial monitoring and decompressive craniectomy) is a cost- effective option, 30 whereas another study reported that decompressive craniectomy was not found to be as cost-effective as a lifesaving procedure for patients with critically severe TBI. 29
Because there are no publications pertaining to the cost-effectiveness of different care pathways after severe TBI, this study contributes to the literature by evaluating the long-term cost-effectiveness of two different rehabilitation trajectories. The study results indicate that treating TBI patients with early initiation of rehabilitation in a continuous chain of treatment is more cost-effective both in 1-year and 5-year perspectives compared with the strategy of a broken chain of treatment with a waiting period for TBI rehabilitation; thus, our study hypothesis is confirmed. It should, however, be noted that there is a limit on bed availability in ICUs for early TBI rehabilitation.
Although the analysis showed that a continuous chain of treatment is cost-effective, there is a certain amount of uncertainty because of the small size of the study group. While estimating uncertainty in the end nodes for the model, simplifications were made because we had a small data set, as mentioned previously. Because the population of Norway is small and severe TBI is less common compared with other countries, 31 it was difficult to obtain a larger sample in this study.
As with all cost-effectiveness models, the limitations of our study should be considered. First, it might be difficult to generalize the study results to other countries because the basis for the cost-effect analysis was a quasi-experimental study based on “the available bed principle” instead of a randomized controlled trial (RCT). RCT specifies that the study objects are randomly allocated to receive the alternative treatments under study. In Norway, the ethical justification for randomizing patients seemed untenable for researching the acute care of patients with severe TBI. The inclusion criteria in this study, however, helped the study patients more or less equally in terms of the chain of treatments they received. The mean DRS scores at 6 weeks were similar in both types of rehabilitation chains. Nonetheless, there was a considerable variability between hospitals included in both continuous and broken chain of rehabilitation in terms of DRS score and AUC. This could be explained by dispersion of patients and transfers between hospitals and differences in rehabilitation provided at each hospital. Because of a small number of patients, we were not able to perform subgroup analysis to examine these causes any further.
Considering the close relationship between sTBI and coexisting injuries, the total costs of hospitalization in this study were related to the treatment of both conditions. It is difficult to attribute the acute care of patients with multiple injuries to any one cause. Nevertheless, it is worth mentioning that sTBI was the principal diagnosis in this patient population. This study included persons aged 16–55 years; therefore, the results may not generalize to persons outside this age group.
When estimating effects, we did not have the DRS scores at the acute TBI admission, and the baseline used in the study was 6 weeks, as mentioned above. The larger DRS effect size and more precise results for the rehabilitation outcomes might be observed if the difference from 0 month to 1 and 5 years was determined. The result of the CEA, however, should not be affected because both groups were assessed using the same measurements.
In addition, the data on costs in this study were based on DRG pricing, obtained by simply multiplying DRG reimbursement by cost weight. This procedure is relatively generalized and not accurate enough when compared with the bottom-up micro-costing method, which measures the costs of every item in detail. On the other hand, the cost weight was calculated strictly for each patient according to their personal characteristics, which can still give us a general idea about the costs.
The study included acute hospitalization and inpatient rehabilitation costs; thus, the costs were estimated from the hospital's point of view. The cost would have been higher if estimated from a broader perspective, because this perspective would be concerned with all types of health care costs, such as medication, specialist consultations, and health care in the primary care sector, and indirect costs, such as time and productivity loss. In addition, we do not have the information on whether or not patients went on to receive outpatient rehabilitation.
How this would affect the incremental costs is unclear because better DRS score in the continuous chain could stem from more intensive treatment and follow-up and therefore lead to higher costs. On the other hand, improved health could also result in reduced need for health care services. It may be of interest to conduct a subsequent study to further assess this issue.
Generally, we would have preferred to include a generic measure for health outcomes, such as Health-Related Quality of Life. A generic measure would make it easier to compare cost-effectiveness in this analysis with interventions evaluated elsewhere in the health care sector.
The strength of this study is the long time perspective of the data that were collected and recorded. The findings of the study are of practical importance for both professionals working in hospitals and government decision makers. Using a decision model tool is a logical choice when handling all of the data needed for cost-effect evaluations in TBI.
Footnotes
Acknowledgments
This study was funded by the Institute of Health and Society, CHARM (Research Centre for Habilitation and Rehabilitation Models and Services), the Faculty of Medicine, University of Oslo, and the Department of Physical Medicine and Rehabilitation, Oslo University Hospital, Oslo.
Author Disclosure Statement
No competing financial interests exist.
Appendix
| Length of stay (days) | DRG weight “Complex” rehabilitation a | DRG weight “Regular” rehabilitation b |
|---|---|---|
| 1 | 0.47 | 0.22 |
| 2 | 0.79 | 0.32 |
| 3 | 1.11 | 0.42 |
| 4 | 1.43 | 0.52 |
| 5 | 1.75 | 0.62 |
| 6 | 1.75 | 0.72 |
| 7 | 1.75 | 0.82 |
| 8 | 1.75 | 0.92 |
| 9 | 1.75 | 1.02 |
| 10 | 1.75 | 1.12 |
| 11 | 1.75 | 1.22 |
| 12 | 1.75 | 1.32 |
| 13 | 1.75 | 1.42 |
| 14 | 1.75 | 1.52 |
| 15 | 1.75 | 1.62 |
| 16 | 1.75 | 1.62 |
| 17 | 1.75 | 1.62 |
| 18 | 1.75 | 1.62 |
| 19 | 1.85 | 1.62 |
| 20 | 1.95 | 1.62 |
| … .. | … … | … … |
Complex rehabilitation: from 21th to 105th day of rehabilitation, DRG weight increases each day with 0.10.
Regular rehabilitation: from 21th to 35th day of rehabilitation, DRG weight remains stable at 1.62. From 35th to 98th day of rehabilitation, DRG weight increases each day with 0.09. From 98th to 105th day of rehabilitation, DRG weight remains stable at 7.38.
DRG, diagnosis-related groups.