




Abstract
Our aim for this study was to quantitatively develop an early epidural hematoma (EDH) natural evolutionary curve and assess association of the most common radiological signs of initially nonsurgical supratentorial EDHs on early computed tomography (CT), in addition to their CT time for EDH enlargement. We retrospectively reviewed pertinent data of supratentorial EDH cases with CT ≤6 h postinjury (1997–2013) in three medical institutions in Shanghai. Cases involved were divided into six groups according to their initial CT time postinjury (≤1, 1–2, 2–3, 3–4, 4–5, and 5–6 h for groups 1 through 6, respectively). Time of initial CT, EDH-associated fractures, EDH volume, and EDH locations were the focus in the present study. A total of 797 eligible cases were included. The EDH growth curve showed that EDH reached 98.1% of its final stabilized size by volume in 5∼6 h postinjury. EDH volume and locations on initial CT was greatly associated with subsequent EDH increase ≥30 mL with EDH increase requiring surgery when CT time was added. Multi-variate analysis succeeded in determining two risk factors for EDH enlargement ≥30 mL and EDH enlargement requiring an operation for EDH cases with an early CT/EDH volume >10 mL on CT performed ≤2 h and EDH located at the temporal or temporoparietal region on CT ≤1 h post brain injury. Using recursive partitioning analysis, “high-risk” identification criteria were derived to predict EDH enlargement ≥30 mL with sensitivity of 90.5% (95% confidence interval [CI], 77.9–96.2), specificity of 60.1% (95% CI, 54.3–65.7), and EDH enlargement requiring surgery with sensitivity of 100.0% (95% CI, 89.9–100.0), and specificity of 59.9% (95% CI, 54.1–65.4). A redo-CT 5∼6 h post impact for cases at high risk is recommended.
Introduction
E
Because of lack of valuable predictive radiological signs on initial CT, neurosurgeons frequently adopt the protocol of “observe and redo-CT” for initially nonsurgical cases with EDH after their first CT study. Decision of “which case” and “when to rescan” either depends on a clinical picture of patients during observation or is based on the neurosurgeon's personal experience.
In the current study, our aim was to quantitatively develop an early EDH natural evolutionary curve and assess the association of the most common radiological signs on initial CT imaging, combined with CT time for subsequent hematoma enlargement ≥30 mL and an enlargement requiring neurosurgery in initially nonsurgical cases with supratentorial EDH to: 1) identify patients at high risk of subsequent EDH enlargement ≥30 mL and an increased EDH requiring surgery based on their CTs performed at an early stage (≤2 h postinjury) and 2) provide a valuable reference of timing for a redo-CT for those at high risk as well.
Methods
In the current study, we retrospectively conducted a cohort review of initially nonsurgical cases with a diagnosis of traumatic supratentorial EDH in the neurosurgery department of three institutions in Shanghai between October 1997 and October 2013.
Inclusion criteria of the patients involved in our study were as follows: 1) age ≥3 years; 2) initial brain CT performed ≤6 h postinjury; 3) with diagnosis of supratentorial EDH; 4) initially managed conservatively; and 5) at least having one follow-up CT ≤72 h. Exclusion criteria included: 1) time of head trauma not clearly recorded on admission chart; 2) with coagulopathy at time of admission (prothrombin time >15 sec or partial thromboplastin time >60 sec); 3) Glasgow Coma Scale (GCS) score ≤9 on admission; 4) with signs of hypovolemia at time of admission; 5) combined with other traumatic intracranial space-occupying lesions on initial or follow-up CT scans (subdural hematoma, intracerebral hematoma, hemorrhagic contusion, and diffuse cerebral edema); 6) conservatively managed cases without radiological evidence of hematoma stabilization (definition of EDH stabilization was described in section of EDH enlargement, stabilization, and growth index); and 7) loss to follow-up.
Patients were categorized into six groups according to time of their initial CT imaging study postinjury: group 1 (≤1 h), group 2 (1–2 h), group 3 (2–3 h), group 4 (3–4 h), group 5 (4–5 h), and group 6 (5–6 h). Pertinent clinical data of all patients were extracted from the Institutional Trauma Patient Database in three hospitals, which included: demographics, neurological evaluation, time and results of CT imaging study, relevant management, and prognosis.
All brain CTs were performed with axial slices of 5 mm in patients. For CT images printed on a film, EDH volume measurement was performed using a compass. For CT images available for retrieval from the picture archiving and communications system (PACS), CT window setting for detection of skull fractures was with a width of 1500 Hounsfield units (HU) and level of 400 HU, whereas a setting with a width of 80 HU and level of 40 HU was used for identifying and measuring EDHs.
Radiological signs of EDH-associated skull fractures, EDH volume, and EDH locations on CT were selected to be the focus in the current study. EDH-associated fracture was defined as a skull fracture inside the EDH territory on initial or follow-up CT. Hematoma volume was measured using the formula: AxBxC/2. 7 In cases with multiple EDHs, hematoma volume was the sum. In cases with a delayed EDH, EDH volume on initial CT was presumed to be 0 mL. According to their epicenters on follow-up CT, EDHs were divided into three locations: frontal, temporal or temporoparietal, and occipital.
The same two senior neurosurgeons evaluated CT imagings of all patients involved in the current study with regard to EDH locations, volume, and presence of skull fractures. Main disagreement involved the method of measuring volume of a small hematoma on CT films. The two observers eventually reached a consensus on all of those disagreements, except for five that necessitated a third party to be involved.
Enlargement of EDH was defined as either an increase of hematoma volume ≥10% on follow-up CT imagings when compared with the initial CT or any new presence of EDH on follow-up CTs. Hematoma stabilization was defined as EDH volume change of less than 10% on two CT studies. The final stabilized volume of EDH was defined as either the EDH volume on follow-up CT scan, which could indicate hematoma stabilization in nonsurgical patients, or hematoma volume measured on preoperative CTs in surgically managed cases. The EDH growth index was defined as EDH volume on initial CT/final stabilized EDH volume (%) in each case.
Based on EDH-associated fractures, EDH volume, and EDH locations on initial CT, three categories of variables were created for cases in groups 1 and 2: 1) presence of EDH-associated fracture on CT performed in a particular time window postinjury; 2) EDH volume >10 and >20 mL on CT performed in a particular time window postinjury; and 3) location of EDH on CT performed in a particular time window postinjury (frontal, temporal or temporoparietal, and occipital). End points in multi-variate analysis were: 1) EDH enlargement on follow-up CT ≥30 mL and 2) EDH enlargement requiring neurosurgery.
Data were analyzed using commercial statistical software (SPSS, version 16; SPSS, Inc. Chicago, IL). The univariate analysis was performed according to the type of data (the Student's t-test for continuous data, Fisher's exact test for binomial categorical data, and the chi-square test for unranked categorical data). Relative risk of all variables for both end points was evaluated by multi-variate analysis using recursive partitioning analysis. Mean with its 2 standard deviations (SDs) of EDH growth index in each group was used to describe EDH enlargement tendency over time (≤6 h postinjury, time resolution of 1 h). The level of statistical significance was set at 0.05.
A detailed study design is depicted in Figure 1.
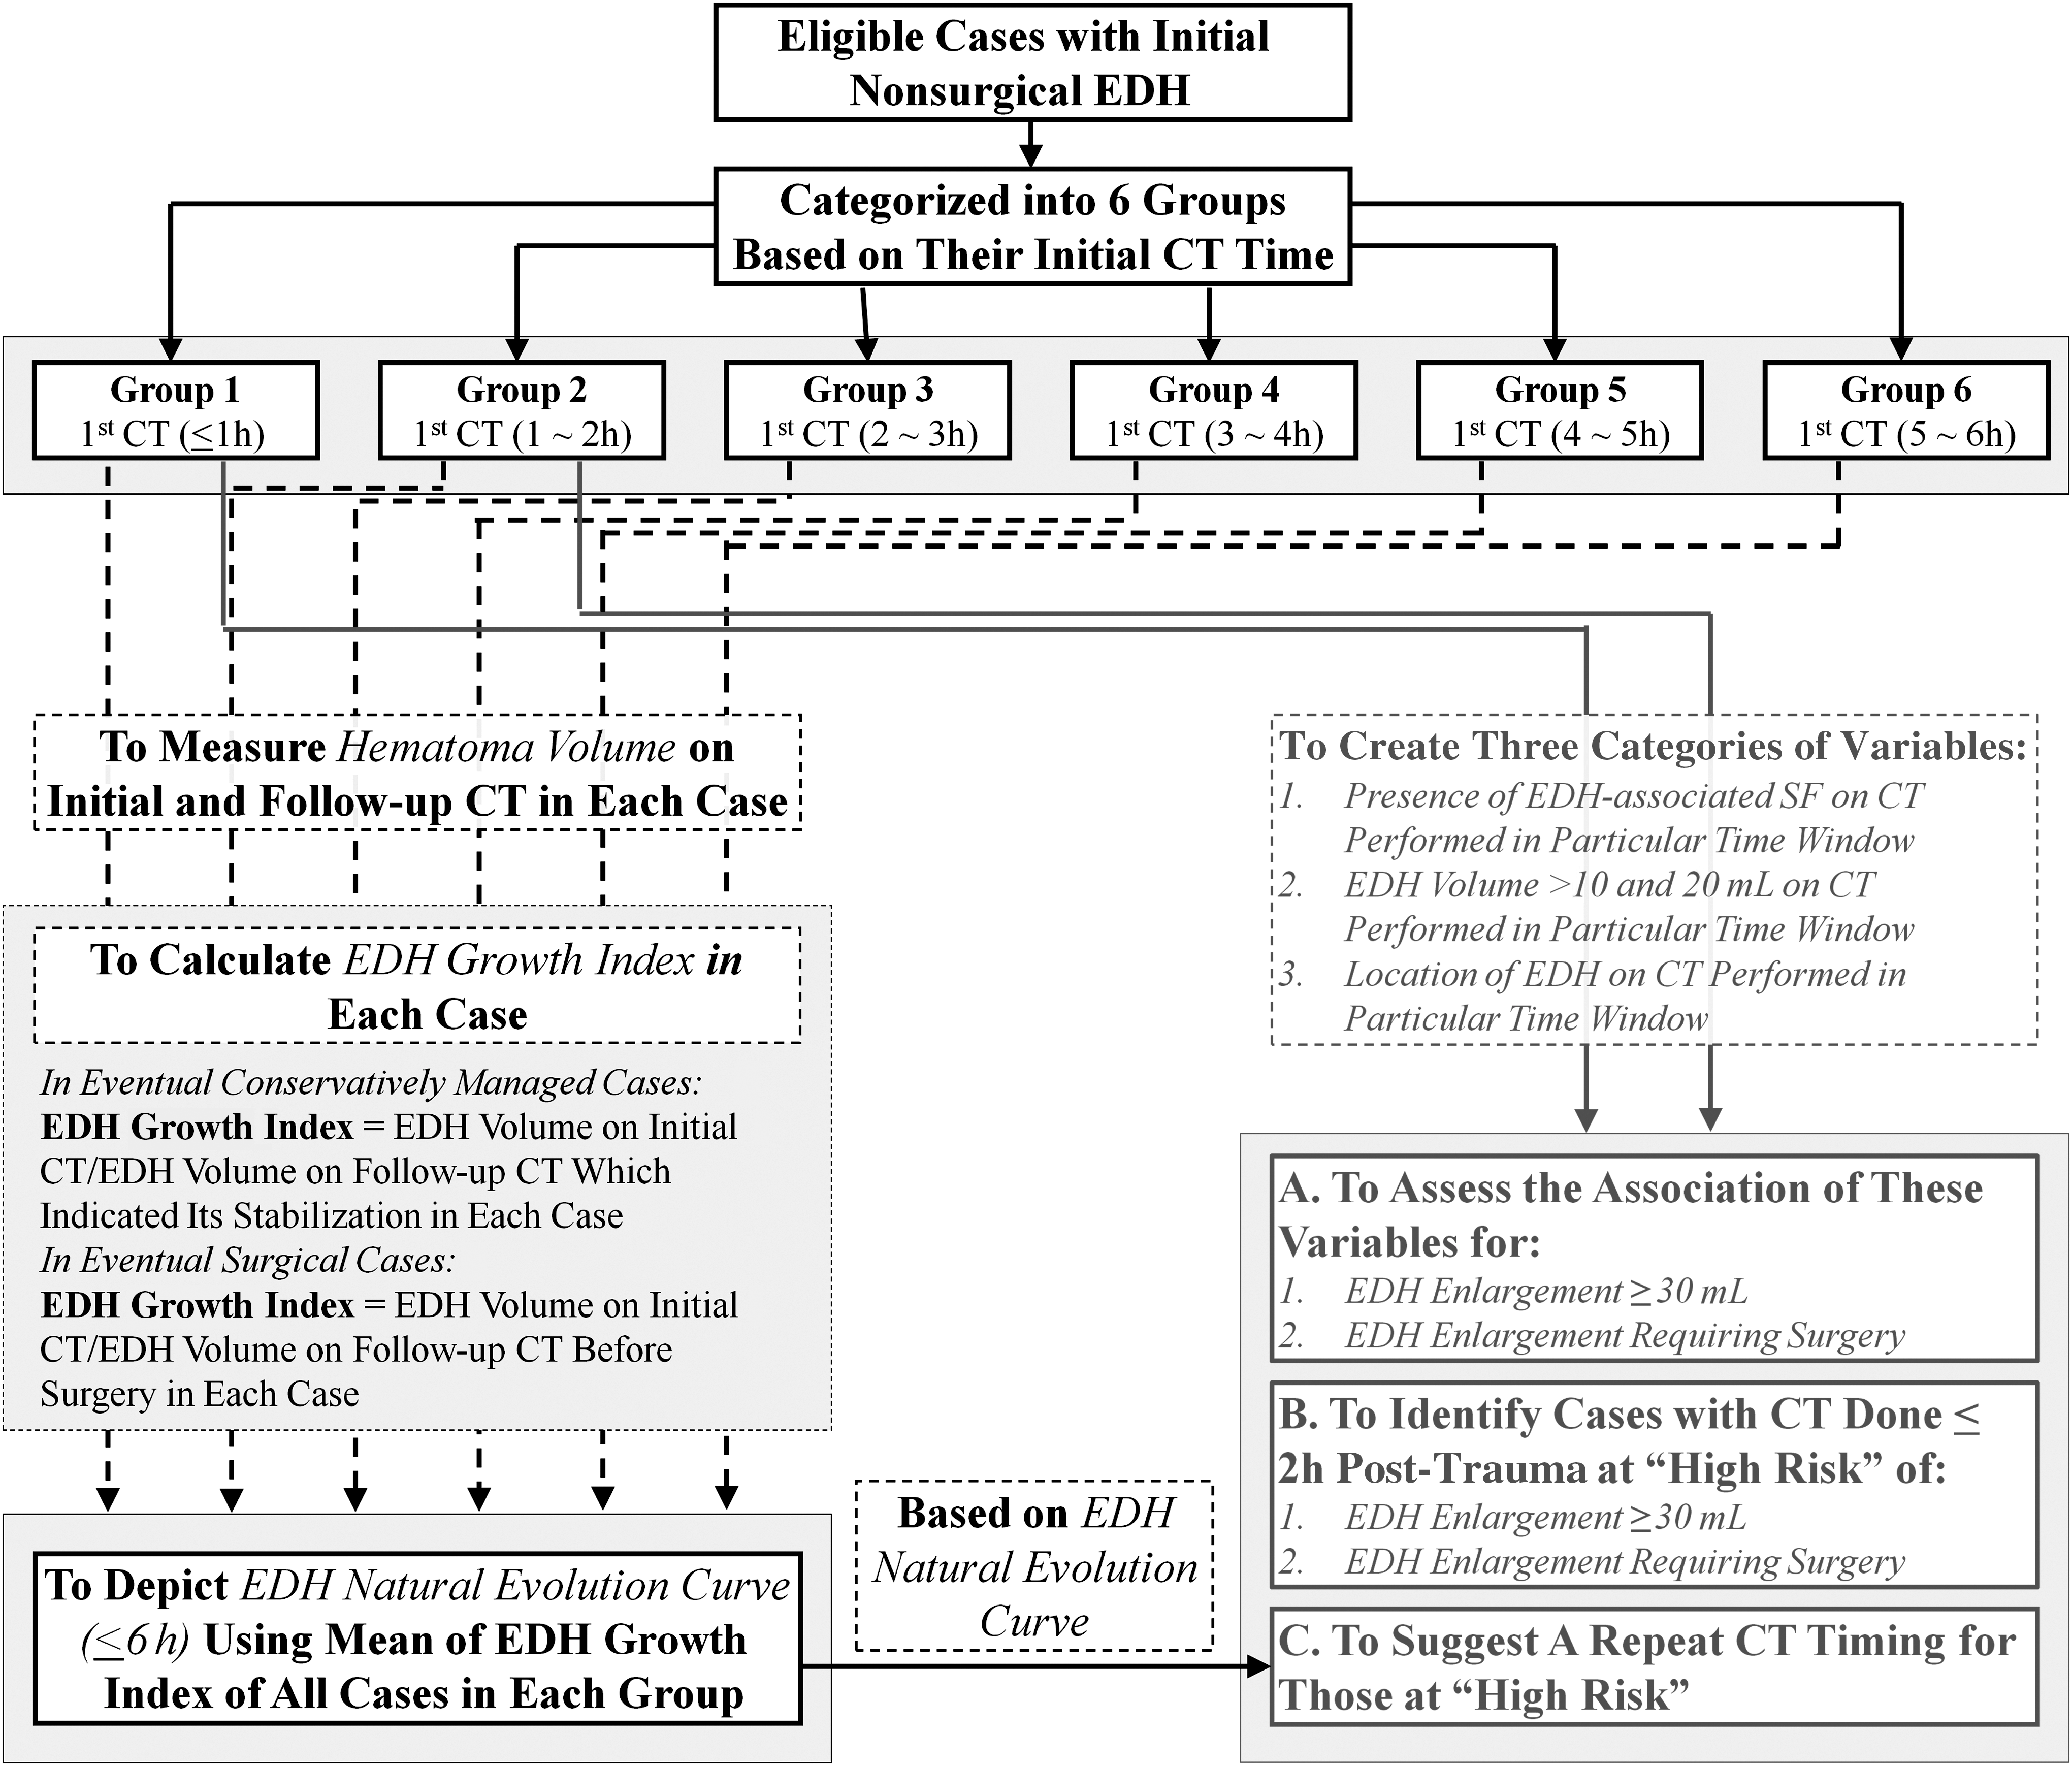
Study design. EDH, epidural hematoma; CT, computed tomography; SF, skull fracture.
Results
Among 1241 patients with a diagnosis of EDH who were treated in our three institutions during this 16-y study, 797 eligible patients were included (63, 260, 194, 117, 94, and 69 cases in groups 1 through 6, respectively). EDH enlargement after initial CT was reported in 257 (32.2%) patients. Reasons for a redo-CT that indicated hematoma enlargement in these patients mainly included: escalating headaches (58.0%); repeated vomiting >2 times (37.7%); a routinely performed CT imaging (30.7%); decline of GCS >2 (8.2%); seizures (5.4%); and impaired pupil response (3.9%). Hematoma volume ≥30 mL on follow-up CT scans (on any of the follow-up CT scans) was found in 63 (7.9%) patients, of whom 43 (5.4%) eventually underwent neurosurgery. Three patients died during treatment (mortality rate of 0.4%). Detailed clinical data of these patients are summarized in Table 1.
Unless otherwise indicated.
SD, standard deviation; GCS, Glasgow Coma Scale; CT, computed tomography, EDH, epidural hematoma; SAH, subarachnoid hemorrhage; SF, skull fracture.
EDH enlargement after initial CT was reported in 43 (68.3%), 117 (45.0%), 52 (26.8%), 23 (19.7%), 15 (16.0%), and 7 (10.1%) cases in groups 1 through 6, respectively (Fig. 2A). Statistical significance was gained among groups in which CT was conducted ≤3 h (p values were 0.00, 0.00, 0.01, 0.16, and 0.28 for groups 1 through 5, respectively. p value was calculated between group 1 and groups 2 through 6 for group 1; group 2 and groups 3 through 6 for group 2; group 3 and groups 4 through 6 for group 3; group 4 and groups 5 through 6 for group 4; and group 5 and group 6 for group 5).
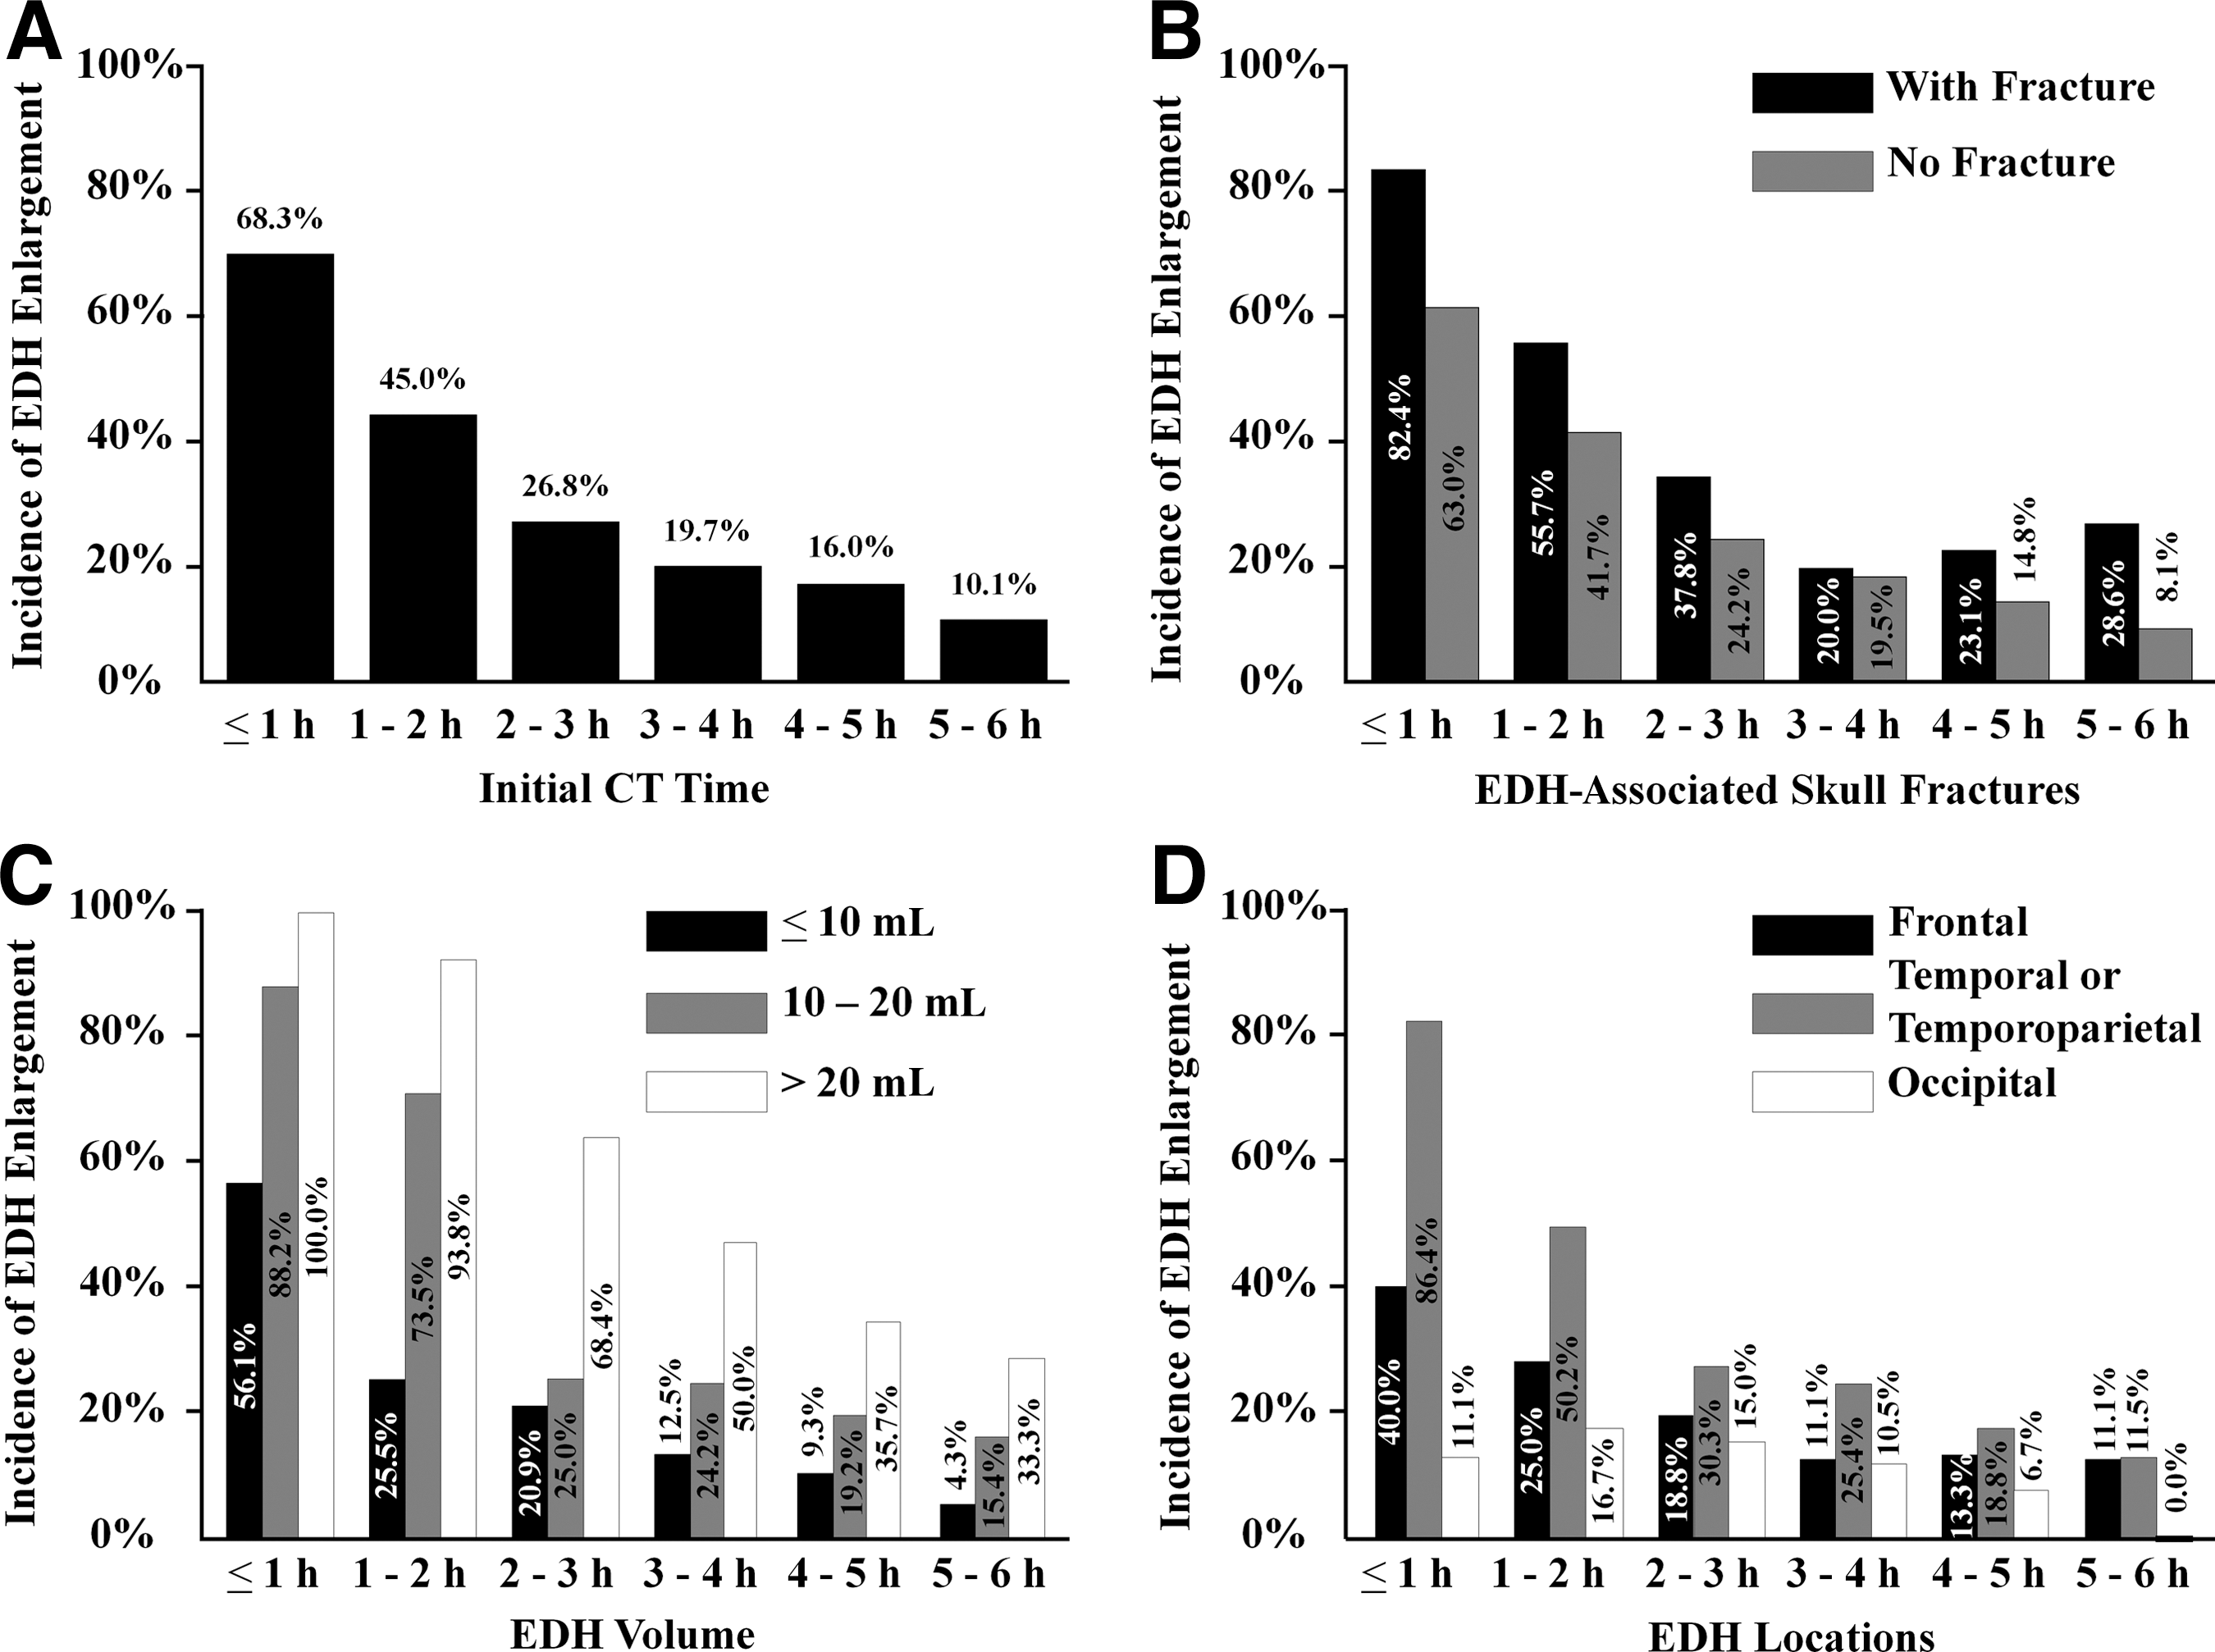
Incidence of epidural hematoma (EDH) increase after initial computed tomography (CT). (
Cases with associated skull fractures had higher incidence of subsequent EDH enlargement than those without in all groups, but none of them reached statistical significance (p value were 0.14, 0.06, 0.09, 0.96, 0.45, and 0.30 for groups 1 through 6, respectively; Fig. 2B). EDH with volume >10 mL in each group had a greater chance of increasing than those with volume <10 mL, with statistical significance acquired in all six group (p values were 0.01, 0.00, 0.02, 0.01, 0.04, and 0.02 in groups 1 through 6, respectively; Fig. 2C). EDHs located at the temporal or temporoparietal region were more likely to grow than those in other locations in all groups. Statistical significance was acquired in groups when CT performance was ≤2 h (p values were 0.00, 0.00, 0.07, 0.06, 0.28, and 0.50 for groups 1 through 6, respectively; Fig. 2D). Detailed results are described in Appendices 1–3 (see online supplementary material at
EDH growth index was calculated in all 797 patients. Mean of EDH growth index with its 2 SDs in each group was as follows: 68.1%±60.3% in group 1; 81.4%±53.4% in group 2; 90.2%±37.9% in group 3; 93.7%±31.1% in group 4; 95.4%±22.0% in group 5; and 98.1%±12.0% in group 6. Dynamics of mean of EDH growth index with its 2 SDs over time is depicted in Figure 3 (maximal of the upper bounds was set as 100%).
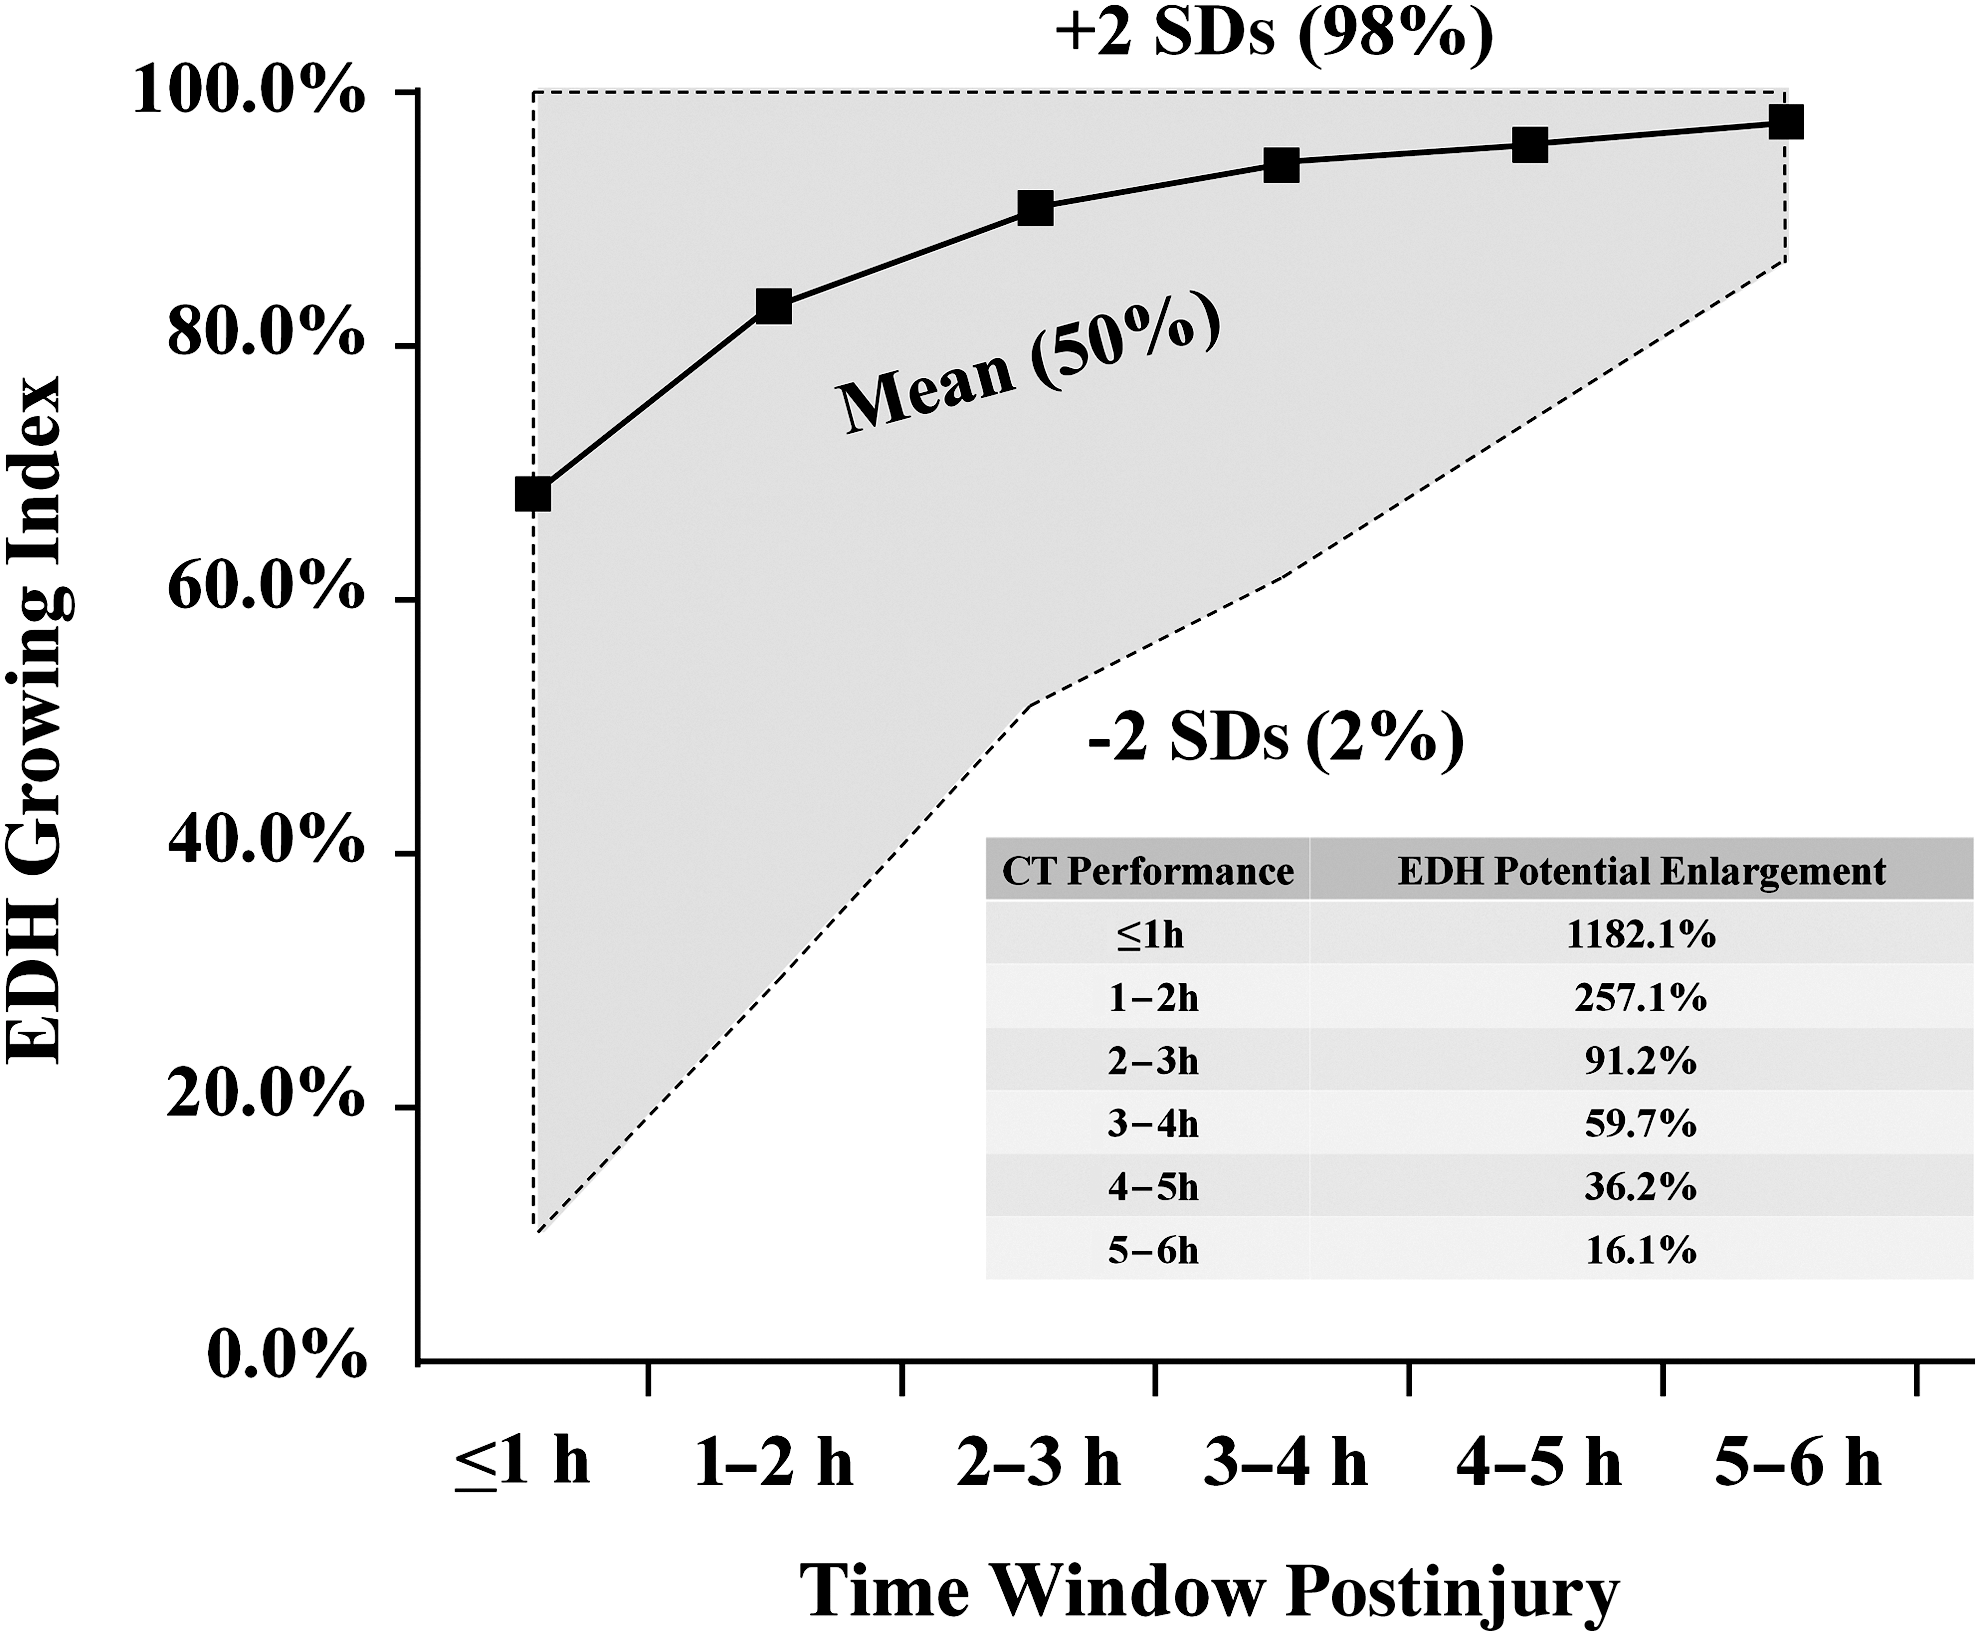
Epidural hematoma (EDH) growth index over time. Maximal of the upper bound was set as 100%. EDH growth index was defined as EDH volume on initial computed tomography (CT)/final stabilized EDH volume in each case. EDH potential maximal enlargement=(100% – lower bound of 2 standard deviations [SD])/lower bound of 2 SDs in each group.
We assessed the relative risk of all variables for both subsequent hematoma enlargement >30 mL and subsequent EDH enlargement requiring surgery using recursive partitioning analysis with 95% confidence intervals (CIs) in cases in groups 1 and 2 (Appendices 4 and 5; see online supplementary material at
Only variables with both p<0.05 and relative risk >1.0 are shown.
Versus the rest.
EDH, epidural hematoma; CI, confidence interval; CT, computed tomography.
Only variables with both p<0.05 and relative risk >1.0 are shown.
Versus the rest.
CI, confidence interval; CT, computed tomography; EDH, epidural hematoma.
A total of 4 patients escaped the criteria identification (2 in each group) for EDH enlargement >30 mL, comprising 9.5% of patients with increased EDH volume ≥30 mL in these two groups. All surgical cases in groups 1 and 2 (34 patients) reached the criteria. Decision tree for EDH enlargement >30 mL and EDH enlargement requiring surgery in groups 1 and 2 is shown in Figures 4 and 5, respectively.
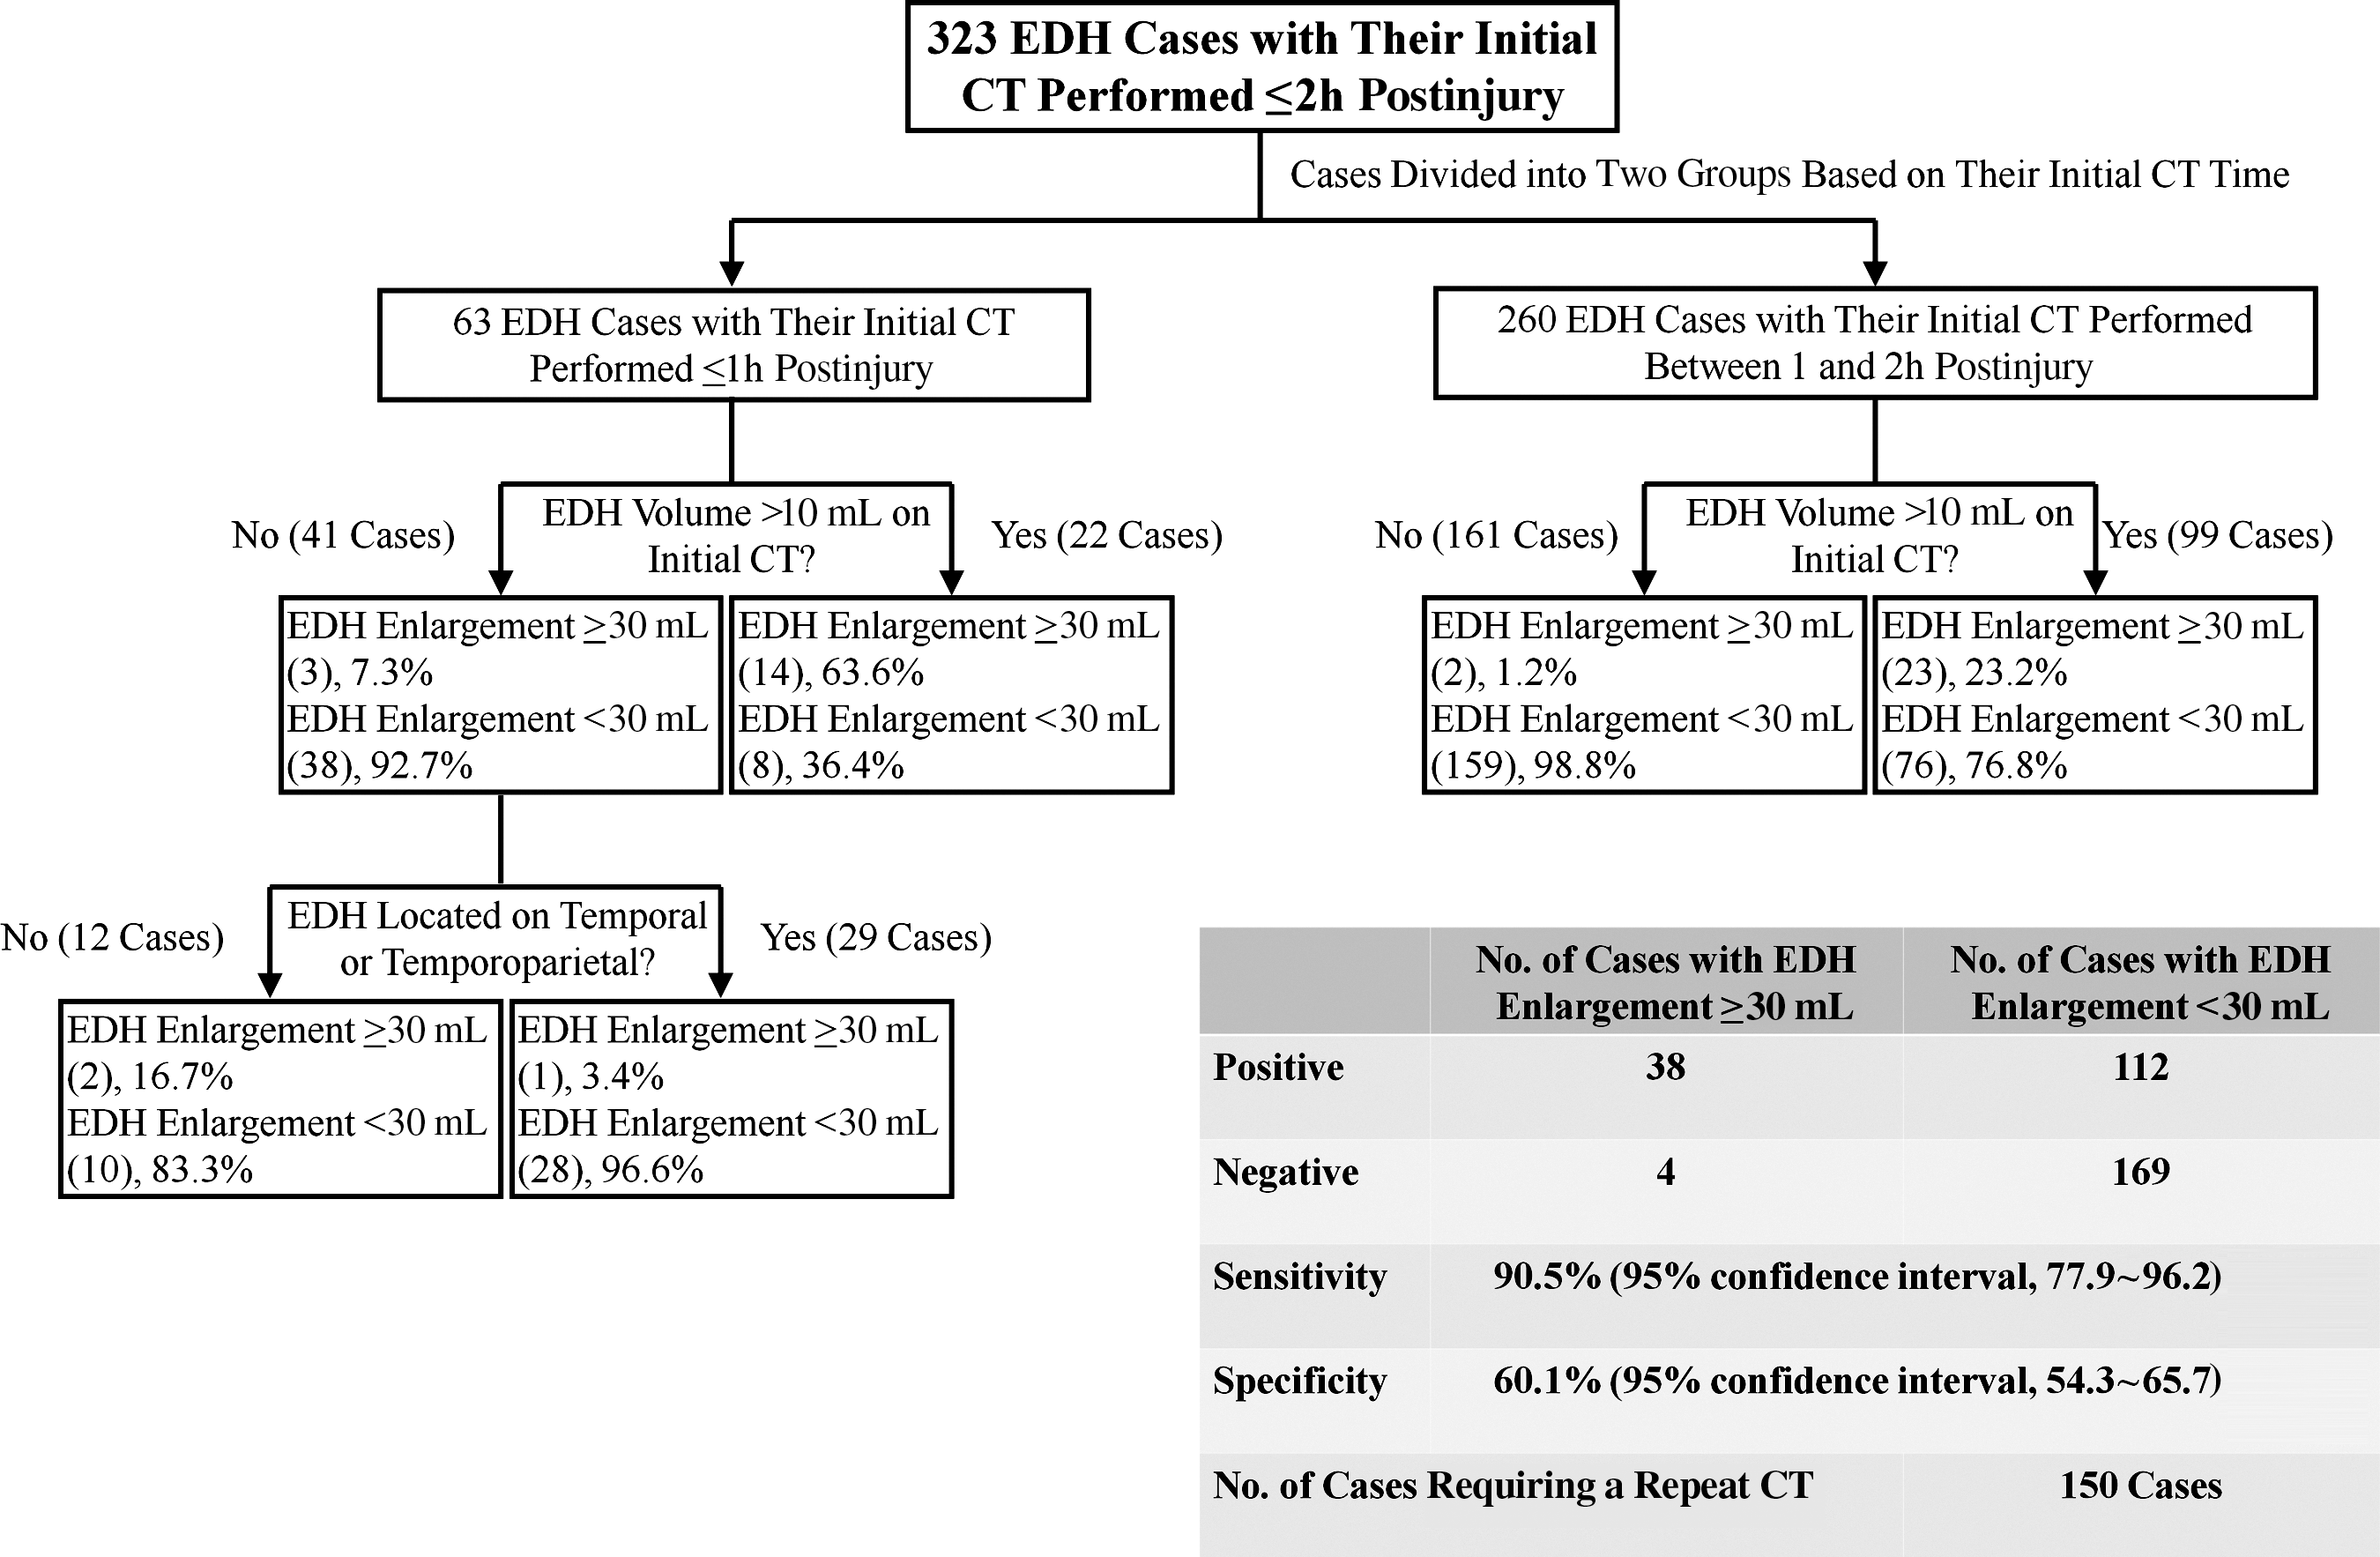
Decision tree for predicting epidural hematoma (EDH) enlargement >30 mL based on computed tomography (CT) performed ≤2 h post brain trauma.

Decision tree for predicting epidural hematoma (EDH) requiring neurosurgery based on computed tomography (CT) performed ≤2 h post brain trauma.
In the current study, patients with EDH >10 mL (33 of 121 patients in groups 1 and 2) and >20 mL (15 of 21 patients in groups 1 and 2) presented on a CT performed ≤2 h had a 27.3% (95% CI, 20.1–35.8) and 71.4% (95% CI, 50.0–86.2) chance of need for a future surgical decompression, respectively.
Discussion
In clinical practice, timing of a redo-CT for a patient with an initially nonsurgical EDH mainly depends on his or her clinical outlook. We considered that any clinical deterioration in a patient with a simple initially nonsurgical EDH mainly resulted from his or her EDH expansion. Therefore, we designed the current study putting more focus on the natural evolution of a simple supratentorial EDH.
Before the CT era, EDH was considered to stop enlarging promptly after impact. 8 Since the introduction of CT scanning in the 1970s, physicians gradually recognized that EDH had its inherent tendency to increase. 4 –6,9,10 It has been assumed that the incidence of EDH enlargement after initial CT is associated with time of CT performance. 3 –6,9,10 Our study, for the first time, provides direct evidence of this strong association (Fig. 2A). In addition, our results showed that, although up to 10.1% of EDHs still tended to grow even after 5–6 h postinjury (group 6), most hematomas (73.2%) stabilized after 2–3 h (group 3).
Interestingly, we found that the incidence of EDH enlargement after initial CT correlated not only with time of the imaging performance, but also with hematoma volume and locations when CT time was added (Fig. 2C,D). Potential explanations for these findings were: 1) larger hematoma accumulated during a certain period postinjury was associated with larger or more torn blood vessels involved—thus, the coagulation mechanism needed more time to take effect; and 2) EDH at the temporal or temporoparietal region usually resulted from arterial bleeding (middle meningeal artery or its branches of origin). 8 Therefore, hematoma located at this region tended to grow.
Although it has been studied, association of skull fractures on an early CT for subsequent EDH increase still remains uncertain. 5,6 Our study also failed to determine their associations, although EDHs with skull fractures seemed to have a greater chance of growing (Fig. 2B). In clinical practice, we observed that some patients with EDH (particularly young patients) with skull fracture had subgaleal or subcutaneous swellings that usually developed in size over time after brain injury. A potential explanation for this uncertain association of skull fractures for EDH subsequent expansion might be related to this phenomenon. It could be assumed that some epidural blood might leak into the subgaleal space through a torn periosteum, at least in some of those EDH cases, resulting in such a weak association. 11,12
Our newly determined “high-risk” identification criteria that were based solely on an early performed CT (≤2 h) had the ability to identify 90.5% of patients with hematoma expansion >30 mL (95% CI, 77.9–96.2 and 100.0% of cases eventually requiring surgical decompression (95% CI, 89.9–100.0).
The optimal method to study the EDH growth pattern was to perform a serial CT for the same group of patients with EDH in a certain time interval. Because of practical and ethical considerations, such a study would be difficult to conduct in reality. Therefore, we designed the current study in which we tried to describe the EDH growth pattern in an indirect way, in which EDH volume was measured in different groups of patients who had CT performance in different, but consecutive, time windows post brain injury.
At the stage of study design, we initially planned to explore the EDH growth pattern ≤12 h postinjury, but eventually we decided to only focus on patients with initial CT performance ≤6 h, mainly because of statistical considerations. During the study, we found that it was difficult to describe a general EDH evolutionary pattern when based on the “absolute” hematoma volume. Therefore, we standardized EDH volume by using a newly created variable of EDH growth index, which was defined as EDH volume on initial CT/final stabilized hematoma volume in each case.
Our EDH growth curve showed that an EDH had potential to enlarge up to approximately 1000%, 250%, 100%, 60%, 40%, and 20% of its volume when it was at ≤1, 1–2, 2–3, 3–4, 4–5, and 5–6 h postinjury, respectively (Fig. 3). Therefore, a redo-CT should be prescheduled for patients at high risk after their initial CT, particularly for those who might need an urgent craniotomy.
Although our EDH growth curve was not able to describe the hematoma growth pattern after 6 h, because almost 90% of EDHs achieved stabilization at 5–6 h postinjury (in group 6), and an EDH at 5–6 h had a 98% of chance of increasing ≤20% by volume in the future (Fig. 3), we believed that an EDH at 5–6 h had already exhausted the primary course of its expanding phase. Therefore, we suggested performing a redo-CT at this time window for patients at high risk with their early CT performance (≤2 h). Clinical symptoms developed within the range of 6–15 h (8.5±1.7 h) postinjury in 32 (94.11%) of 34 eventual surgical cases in groups 1 and 2 in our study.
Thus, the main advantage of performing a redo-CT 5–6 h postinjury for patients at high risk was that it had the potential to provide direct radiological indication for surgical decompression even before the presence of clinical escalations. In addition, for “still” nonsurgical cases at 5–6 h, CT imaging in this time window had the ability to provide to neurosurgeons a general idea of how the EDH developed after the initial imaging study, helping them to predict its final volume in a more precise way.
Our results also revealed that patients with EDH >20 mL presented on a CT performed ≤2 h had a 71.4% (95% CI, 50.0–86.2) chance of need for future surgical decompression (15 of 21 patients in groups 1 and 2). Time duration postinjury to clinical deterioration in those 15 eventual surgical cases ranged from 4.5 to 12.0 h (7.8±1.3 h). Therefore, close clinical observation should be applied to patients with EDH >20 mL on a CT ≤2 h postinjury. Patients having a deteriorating clinical outlook before the time window of 5–6 h needed an immediate redo-CT.
Late EDH significant enlargement has been reported. 4,5,13 –15 In our study, the maximal EDH volume increase in group 6 was 40.4% by volume (EDH growth index was 71.2% on initial CT in 1 patient with a temporal EDH expanding from 27.1 to 38.1 mL. Significant escalating headaches with repeated vomiting developed in this patient 5 h after initial CT. Therefore, it was recommended that patients with EDH volume ≤30 mL on a redo-CT performed in 5–6 h still need to be closely observed, particularly those with EDH >20 mL.
A total of 4 patients in groups 1 and 2 identified at “low risk” by our identification criteria had an EDH increase of >30 mL after initial CT, but none of them were surgical cases. All of these patients had episodes of slightly escalating headaches or repeated vomiting more than two times ≤12 h. Thus, for those patients at low risk, clinical observation needed to be applied. Timing of a redo-CT for these patients depends on their clinical outlook.
Our EDH growth curve was derived mainly from evolution of relatively “chronic” hematomas that initially did not need surgical decompression. “Ultraacute” massive bleedings caused by the torn middle meningeal artery or its main branches usually required urgent neurosurgery immediately after the initial CT. Thus, our EDH growth curve might not be able to describe the hematoma growth tendency of such major bleedings. In addition, although it was mainly based on nonsurgically managed cases (754 cases) in which final stabilized EDH volume could be precisely obtained, our EDH growth curve still contained data of 43 patients who eventually were operated on.
Hematoma volume on preoperative CTs in these patients might not be the “real” final stabilized size. Therefore, our EDH growth curve actually slightly shifted upward, particularly when time windows were ≤2 h (comprising 79.1% of surgical cases in our study), although the difference might not be significant (mean time of preoperative CTs in these 43 surgical cases was 8.9±2.0 h postinjury; according to our results, we believed that a fair number of these hematomas had achieved stabilization when those preoperative CTs were conducted).
In the current study, we excluded cases combined with any of those traumatic intracranial space-occupying lesions, such as subdural hematomas, intracerebral hematomas, hemorrhagic contusions, and diffuse cerebral edema. In addition, cases with hypovolemia or coagulopathy at time of admission were excluded as well. Exclusion of these conditions in our study was because of considerations of their potentials to influence the natural evolution of an EDH.
The GCS has been used to assess the severity of brain-injured patients for decades. Clinically, GCS ≤9, between 9 and 14, and ≥14 represents severe, moderate, and mild TBI, respectively. During the stage of data acquisition, we found that only 5 patients with EDH with their GCS ≤9 on admission were initially conservatively managed after the first brain CT performance (most of our patients with severe EDH either revealed a huge EDH on their first CTs that indicated an urgent decompression or combined with other intracranial traumatic lesions). These 5 patients were admitted within 2 h post brain injury, combined with either traumatic intrathoracic or abdominal problems. Therefore, evaluation of GCS on admission might not precisely reflect their real neurological impairment that resulted directly from impact. Further, such a serious and complex general medical condition might influence their natural EDH evolution. Thus, we eventually decided to exclude these 5 patients from our study.
Additional analysis was conducted to determine whether severity of brain injury (moderate and mild) on admission in patients in groups 1 through 4 (CT ≤4 h, because of statistical considerations, group 5 and 6 were not included in this analysis) was associated for their final management (surgical or nonsurgical). Interestingly, we found that association of moderate cases on admission for future neurosurgery in groups 1–4 had an increasing trend (Table 4). Our results suggested that association of moderate GCS status in an ultraearly stage (≤1 h post impact) for future need for neurosurgery was weak (p value was 0.262 in group 1). Such an association in patients with EDH became stronger after 1 h post brain injury. A potential explanation for these results was that consciousness impairment at an ultraearly stage after brain injury might partially result from brain concussion after direct impact. This phenomenon highlighted the importance of close observation on initially nonsurgical EDH patients with persistence of GCS <14 after 1 h post head trauma.
Versus cases with GCS ≥14.
Variables acquired statistical significance in two groups with p<0.05.
GCS, Glasgow Coma Scale; CI, confidence interval.
Our high-risk identification criteria were derived solely from the most common radiological signs on early performed CTs after brain injury and neglected all other factors, including clinical presenting manifestations of these patients. We hope that this newly derived radiological identification criteria (if validated), combined with the EDH early evolutionary curve, could serve as a reference for neurosurgeons when treating patients with initially nonsurgical EDH: 1) helping to identify patients at high risk of EDH enlargement >30 mL or an ever-expanding hematoma that might eventually require surgery in patients with an early CT performance (≤2 h postinjury) and 2) providing a relatively quantitative method to predict the possible evolution of an EDH (≤6 h). A repeated CT performed at the time window of 5–6 h postinjury for those at high risk suggested in our study has the ability to radiologically identify 100.0% of surgical cases at that time. Therefore, decompressive procedures could be radiologically indicated earlier in patients managed using this protocol than those handled in a traditional way.
The current study has several limitations. In addition to its retrospective nature, the study involved three institutions. CT scanners differed from one another among our hospitals. Moreover, the current study spanned 16 years. Sensitivity of those CT scanners has been changed and significantly improved because of a system upgrade. Therefore, these factors have confounded results of imaging interpretation, particularly regarding measurement of hematomas on CT films that were performed at a time when PACS was not available. Actually, during the stage of study design, we were aware of such systemic and random errors that would influence our study conclusions. Therefore, measurement of all these hematomas was conducted by the same two senior neurosurgeons. Further, we uploaded CT data of most of the patients (97 of 114) in which CT was performed before the PACS era to PACS during our data acquisition stage to get more precise imaging evaluation. Thus, we believe that those measurement errors would be acceptable in the current study.
Conclusions
EDH volume and locations on initial CT could be strongly associated with subsequent EDH increase when CT time is added. After recursive partitioning analysis, high-risk identification criteria based on an early performed CT (≤2 h postinjury) were derived to identify an EDH enlargement >30 mL and an ever-growing EDH requiring neurosurgery. According to our results, a redo-CT is recommended to be performed in 5–6 h postinjury for patients at high risk. For patients at low risk, close observation needs to be applied. Timing of redo-CT in low-risk patients depends on their clinical presentations.
Footnotes
Author Disclosure Statement
No competing financial interests exist.
Acknowledgments
We thank all the neurosurgeons, radiologists, and statisticians involved at our hospitals for their hard work during the study. We also wish to thank Professor Lv Zhi-bao (Shanghai Children's Hospital) for participating in the protocol design and Associate Professor Qian Jian-hua, Dr. Zhang Hong (No. 3 People's Hospital in Shanghai), Dr. Fang Li-hao (Shanghai Children's Hospital) for statistical advice.
References
Supplementary Material
Please find the following supplemental material available below.
For Open Access articles published under a Creative Commons License, all supplemental material carries the same license as the article it is associated with.
For non-Open Access articles published, all supplemental material carries a non-exclusive license, and permission requests for re-use of supplemental material or any part of supplemental material shall be sent directly to the copyright owner as specified in the copyright notice associated with the article.
