




Abstract
Diagnosis and early prognosis of the vegetative state/unresponsive wakefulness syndrome (VS/UWS) and its differentiation from the minimally-conscious state still rest on the clinical observation of responsiveness. The incidence of established clinical indicators of responsiveness also has proven variable in the single subject and is correlated to measures of heart rate variability (HRV) describing the sympathetic/parasympathetic balance. We tested responsiveness when the HRV descriptors nuLF and peakLF were or were not in the ranges with highest incidence of response based on findings from previous studies (10.0–70.0 and 0.05–0.11 Hz, respectively). Testing was blind by The Coma Recovery Scale-revised in the two conditions and in two experimental sessions with a one-week interval. The incidence of responses was not randomly distributed in the “response” and “no-response” conditions (McNemar test; p<0.0001). The observed incidence in the “response” condition (visual: 55.1%; auditory: 51.5%) was higher than predicted statistically (32.1%) or described in previous clinical studies; responses were only occasional in the “no-response” condition (visual, 15.9%; auditory, 13.4%). Models validated the predictability with high accuracy. The current clinical criteria for diagnosis and prognosis based on neurological signs should be reconsidered, including variability over time and the autonomic system functional state, which could also qualify per se as an independent indicator for diagnosis and prognosis.
Introduction
T
The incidence of established clinical indicators of responsiveness has proven variable also in the single subject. The Coma Recovery Scale-revised (CRS-r)
9,16
global, visual, and auditory scores were found to be higher in the morning than in the afternoon in subjects repeatedly tested.
18
The visual pursuit response (a key CRS-r item and marker of evolution into the MCS)
9,16
reportedly is observed in about 20% of subjects otherwise unambiguously diagnosed as being in VS/UWS and in about 70% of cases in MCS.
19
Its incidence at multiple testing (six times/subject/d) varied within/across subjects and over time during the day, with maximal incidence occurring at 10.30
Replicable changes in the autonomic system (ANS) functional state have been identified in VS/UWS and MCS subjects in response to simple or complex sensory inputs. 24 –28 The pursuit response proved correlated to measures of heart rate variability (HRV; the heart rate fluctuations around the mean value over the time sample) describing the sympathetic/parasympathetic balance. The response was modeled by machine learning methodologies (Support Vector Machine) 29 and the procedure confirmed the correlation. The intervals of HRV descriptors at which the incidence of the visual response was maximal were identified. 32 Contributions by the ANS in modulating the residual responsiveness would be in agreement with its predominant role in VS/UWS subjects. 3,10,30 –32 The purpose of this study was to verify whether the HRV descriptors of autonomic function can predict the incidence of responses in VS/UWS subjects with an accuracy compatible with clinical needs. To this end, we measured HRV, an established index of the sympathetic/parasympathetic interplay also applied in the description of interactions between the brain and the ANS both in awake subjects and those with a severe disorder of consciousness. 33 –37 Two separate conditions were selected (i.e., when the values of the HRV significant markers were or were not within the ranges at which responsiveness was observed with higher incidence in previous studies). 27,38 –41 Each subject was blindly tested for response in each condition.
Methods
Patients
Eight subjects (seven males, age-range 18–55 years; mean age 39.6±17.3 years; one female, age 23 years) in chronic VS/UWS according to the current clinical criteria and established evaluation scales were studied. 2,4 –6,8 In all cases, scores were congruent with the cutoffs in use for clinical characterization of the subjects in VS/UWS—that is, lower than 25 on the Loewenstein Scale 42 and 2 on the Level of Cognitive Function scale (LCF), 43 and higher than 21 on the Disability Rating Scale. 44 The CRS-r 16 global score was equal to or lower than 7. Subjects who were clinically unstable, had concurrent systemic disorders (e.g., of the cardiovascular system), were under treatment with (neuro)active drugs or beta-blockers, or had evidence of recurrent pain were not admitted to the study. The patients' relatives or caregivers were informed in full detail about the study and procedures and gave their written consent. Data were treated under the condition of anonymity. The ethical principles of the Declaration of Helsinki (1964) by the World Medical Association concerning human experimentation were followed. Demographics and clinical information are summarized in Table 1.
CRS-r, Coma Recovery Scale-revised; VS/UWS, vegetative state/unresponsive wakefulness syndrome; m, male; f, female.
Stimulus conditions and experimental procedure
Subjects were tested between 10:00
Each patient was tested twice with a week interval in recording sessions lasting 20±1 min. Each session included 24 stimulus conditions (12 visual, 12 auditory) presented according to the CRS-r guidelines. 16 Specifically, the visual pursuit response was tested by means of a round mirror (12 cm in diameter) moved slowly in front of the subject in the horizontal and vertical planes for 45° (right, left, up, down); it was ranked positive for a consistent response when the patient's eyes followed the mirror without loss of fixation. Responsiveness to auditory stimuli was tested by calling the patient's name from the right or left side while standing behind him/her to avoid visual contact; the patient's moving the head toward the calling voice was regarded as a positive response. 16
Previous studies applying advanced data analyses to sort out consistent trends or associations in large datasets 45 have identified the HRV descriptors nuLF and pkLF as reliable measures of sympathetic/parasympathetic function in the VS/UWS and MCS. 34,38,46 –48 Both parameters describe the control of cardiovascular function in adaptive behavior and the interaction between excitatory and inhibitory autonomic control mechanisms. Specifically, nuLF is deemed indicative of sympathovagal balance. 49 The 0.1 Hz component LF (pkLF) describes the sympathetic/parasympathetic interplay mediated by baroreflex and has been related to changes in arousal and to emotional responses. 50,51 A correlation between responsiveness and these descriptors is documented. 26,39,41 The electrocardiogram (EKG) was continuously recorded at rest (5 min baseline) and during testing, and the HRV descriptors were computed online. Visual and auditory stimuli were administered only when the HRV signal was stationary in order to reduce short fluctuations. Two testing conditions were predetermined according to previous observations and models 41 indicating a highest probability of observing a response at HRV nuLF values in the 10–70 interval and peakLF values between 0.05 Hz and 0.11 Hz; these intervals are defined (and will hereafter be referred to) as the “response” condition (Fig. 1 and Fig. 2). Any time point with nuLF and peakLF values outside these ranges was considered a “no-response” condition.

Bottom: In vertical bars, the numbers of observed (left; n=71) and not observed (right; n=150) responses to sensory stimulation. In green, on the horizontal planes, is the “response” condition as pre-defined by the heart rate variability (HRV) nuLF and peakLF descriptors values at which the highest incidence of responses has been observed in previous studies; in red, the “no-response” HRV condition. Top: Three-dimensional distribution of the probability of observing or not observing a response, estimated as the relative frequency of response for each subject versus the HRV descriptors.
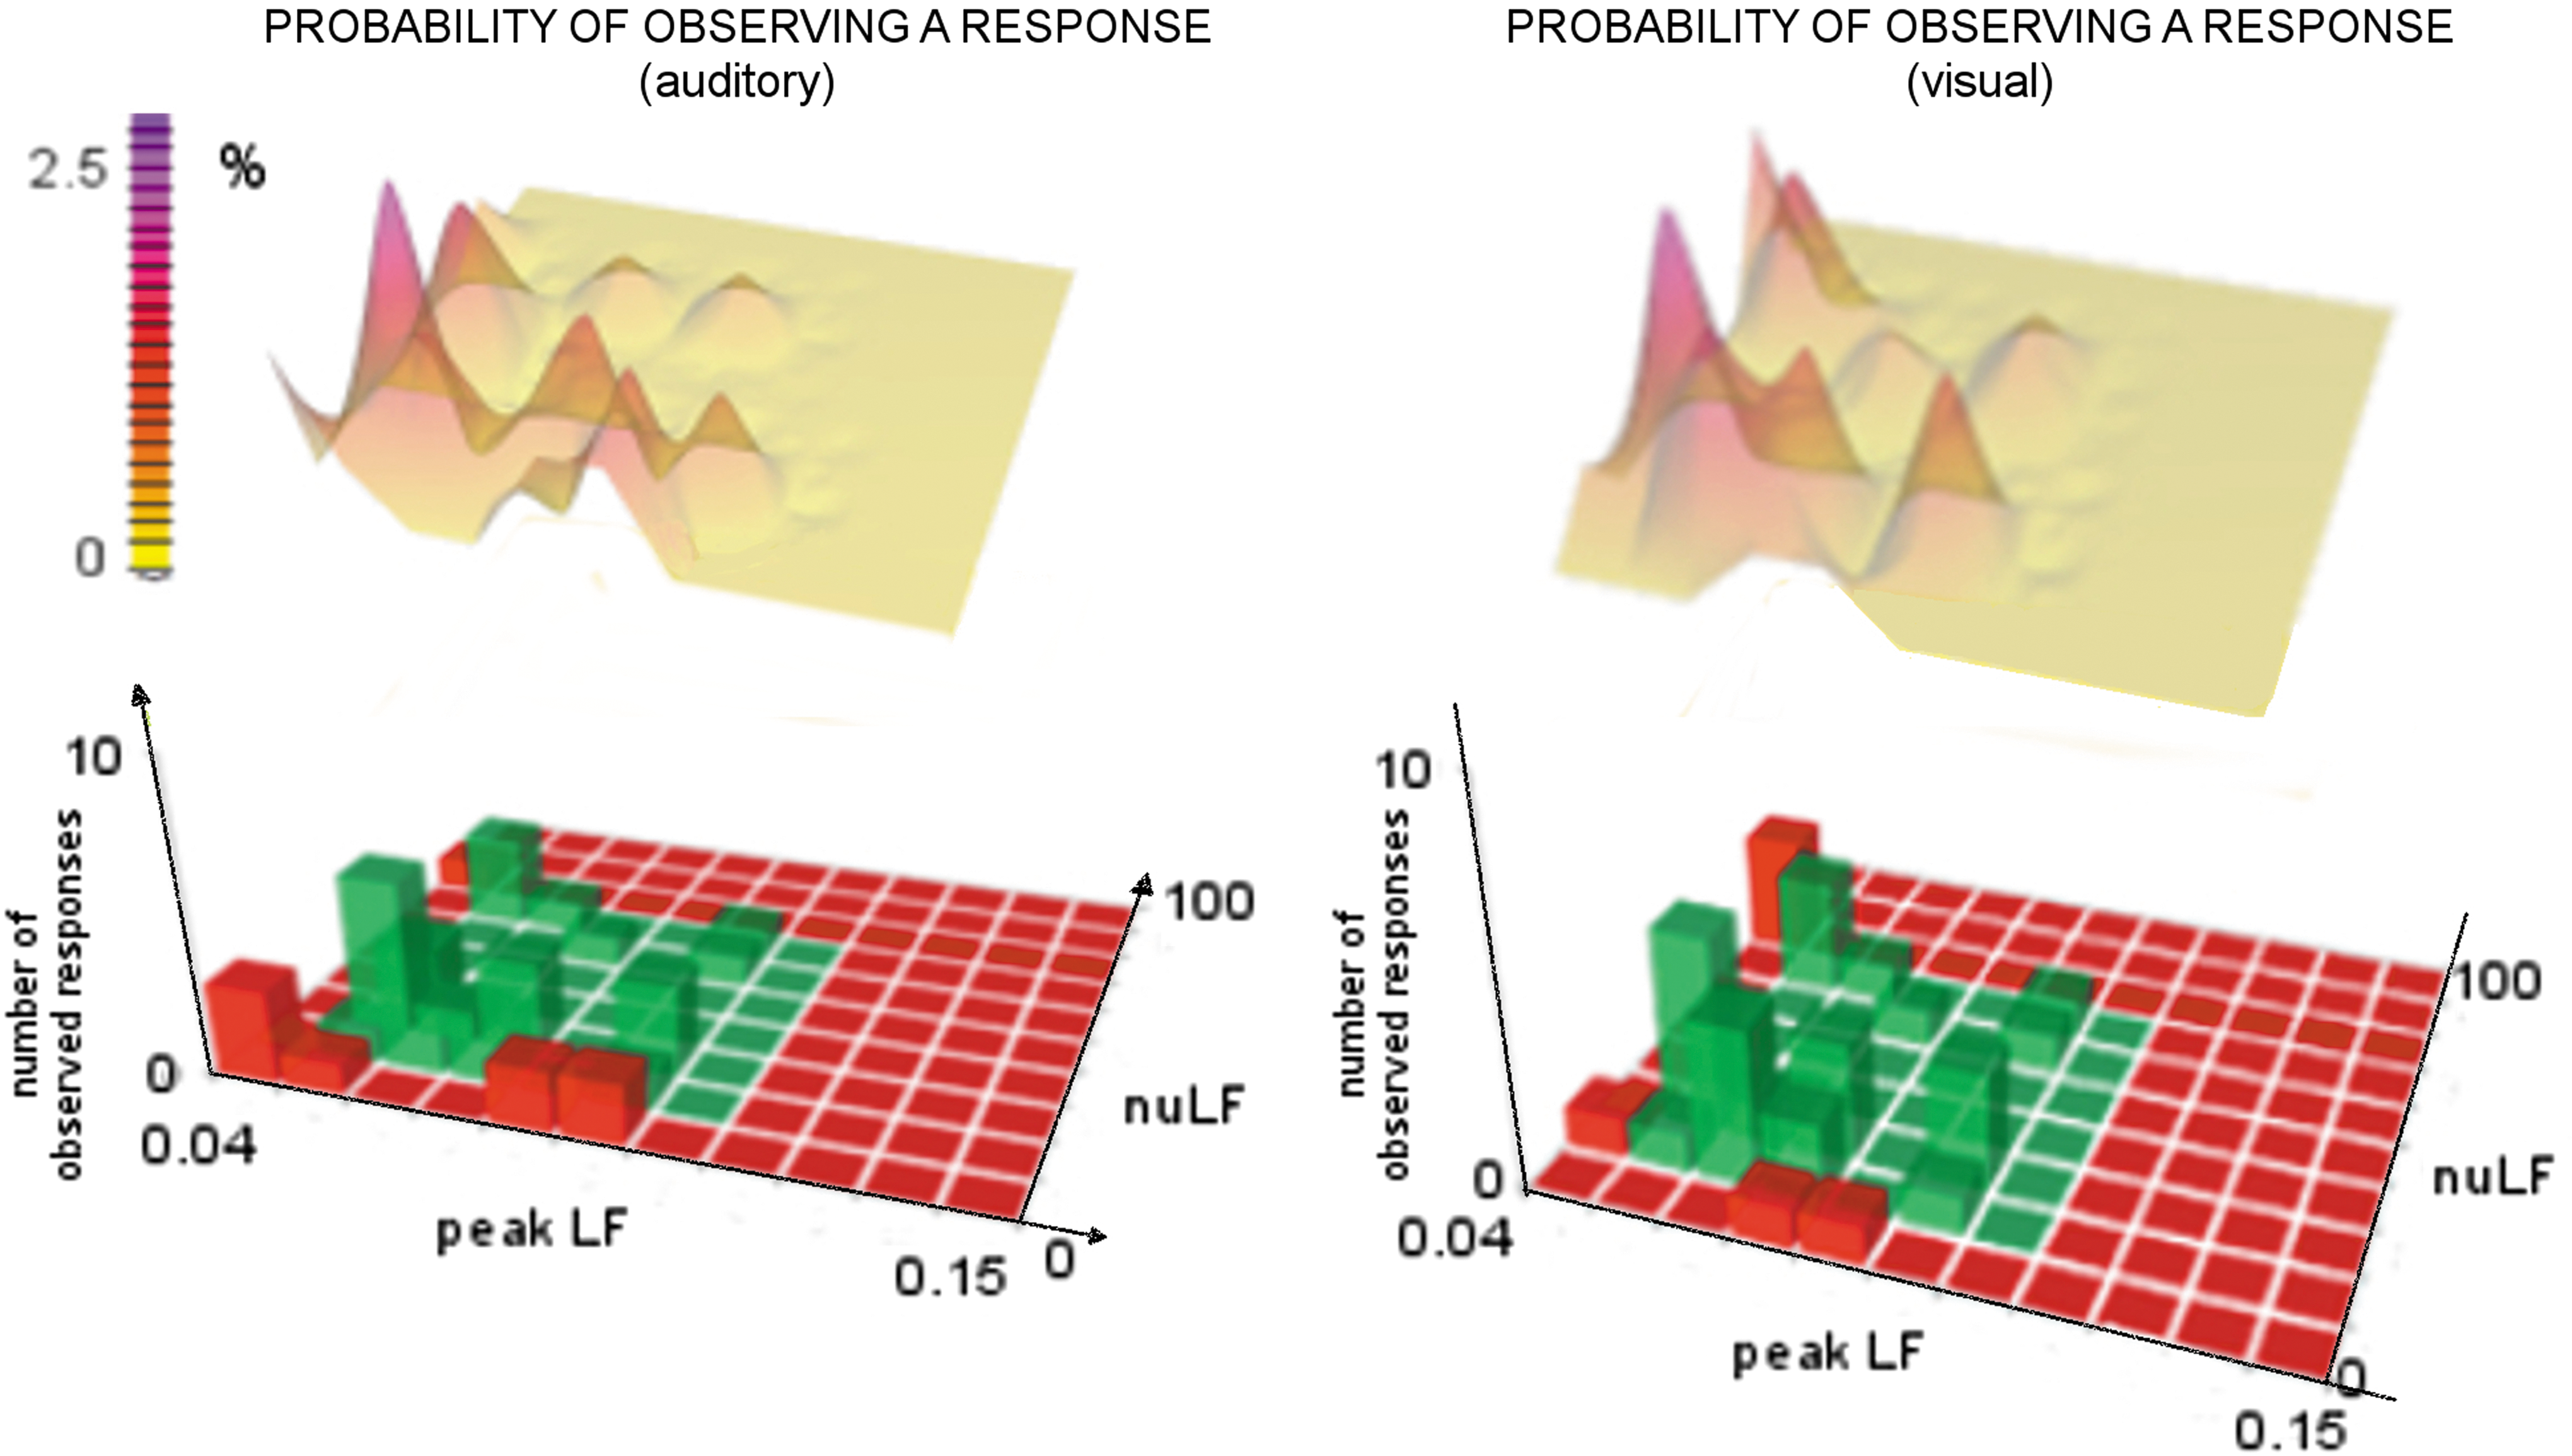
Numbers of observed responses to visual (right, n=36) and auditory (left, n=35) stimulus conditions and distributions of the probability of observing a response estimated as the relative frequency of response for each subject versus the heart rate variability descriptors. In green and red, the “response” and the “no response” areas, respectively.
Each stimulus was administered twice by an expert neuropsychologist, who was blind for the “response” or “no-response” condition of the HRV parameters and ANS functional state. A total of 384 stimuli were administered; 42% were discarded because of artifacts due to movement; 221 stimuli (27.6±4.3 per subject) were analyzed.
HRV data collection
The heart rate signal was recorded through a photopletismograph sensor positioned on the middle finger of the left hand; the sampling rate was 128 Hz, with resolution at 24 bit (NEXUS 32; Mindmedia, Herten, the Netherlands).
52
–54
This procedure was favored to minimize the patients' discomfort due to conventional EKG recording electrodes; recording procedure and sampling rate have proved reliable in previous studies on awake
55,56
and VS/UWS subjects
24,27,28,41
and are in agreement with the guidelines by the Task Force of European Society of Cardiology and the North American Society of Pacing and Electrophysiology.
57
The tachogram (i.e., the series of consecutive intervals between heartbeats) was processed in the frequency domain (Fast Fourier Transform [FFT]) by the software Biotratace+ (
The signal stationarity in the time windows at which responsiveness to visual or auditory stimulus conditions was or was not to be tested (the “response” and “no-response” conditions) was evaluated in real time by means of the graphical representation of both the row signals and of the coefficient of variability calculated in 15-sec time windows.
Data processing
The baseline HRV descriptors of the two recording sessions were compared using the Mann-Whitney test and data were cumulated for successive analyses after excluding differences. The “response” and “no-response” conditions were compared for the probability of observing a visual or auditory response by the McNemar's test 63,64 after estimating the expected distribution of responses in the two conditions by the Bayesian Analysis Model 65 (pre-test [prevalence] and post-test [positive predictive values] prevalence). The incidences of responses in the “response” and “no-response” conditions and in the first and second sessions were compared using the Fisher's exact test.
The machine learning classifier Support ONE-R was applied to estimate the weight of each selected HRV descriptor (nuLF and pkLF). 66 ONE-R is a simple classification algorithm that generates one level of decisional tree and infers simple classification rules from a set of instances; in this case, the aim was to model a rule predicting the class (response, no-response) given the values of the attributes (HRV descriptors). 66,67 The algorithm ONE-R is commonly used to obtain a good trade-off between recognition (portion of correct sample/label association in a training sub-sample) and generalization (portion of correct sample/label association in a test sub-sample). The 10 fold cross validation statistics were used to partition the data samples into subsets so that data analysis was first carried on selected subsets, while other subsets served to confirm and validate the initial analyses. 68
Results
No differences were found when comparing in the frequency domain the HRV descriptors from the two baseline sessions at a one-week interval (Mann-Whitney test: −1.050<z < −0.053; p>0.29).
The Bayesian analysis model predicted an incidence of 32.1% observed responses in the pre-test (prevalence) and 52.8% in the post-test (positive predictive values) analyses, with a negative predictive value of 86.9% and positive and negative likelihood ratios of 2.3662 and 0.3169, respectively. Positive responses were observed irrespective of the sensory modality in the 53.3% and 12.9% of cases in the “response” and “no-response” conditions, respectively; the mean incidence per subject of positive responses was 53.1±21.1 and 14.6±10.3 in the two conditions, respectively. The observed responses were not randomly distributed but were clustered in each session at the selected nuLF values between 10 and 30 and peakLF values between 0.06 Hz and 0.11 Hz. The differences in distribution were significant on the McNemar test (X2=17.455; p<0.0001), without substantial differences between the visual and auditory stimulus conditions (Fig. 1 and Fig. 2).
The incidence of observed visual or auditory responses in the “response” condition was 55.1% (72% at nuLF values between 10 and 30) and 51.7%, respectively (mean per subject, 54.3±32.2 [visual] and 51.9±19.7 [auditory]); that of no observable response in the “no-response” condition was 83.3% (visual) and 90% (auditory; Fig. 3). No differences were found between the two testing sessions in the occurrence (Fisher's exact test: p=0.43) or absence (p=0.57) of responses in the “response” and “no-response” conditions.
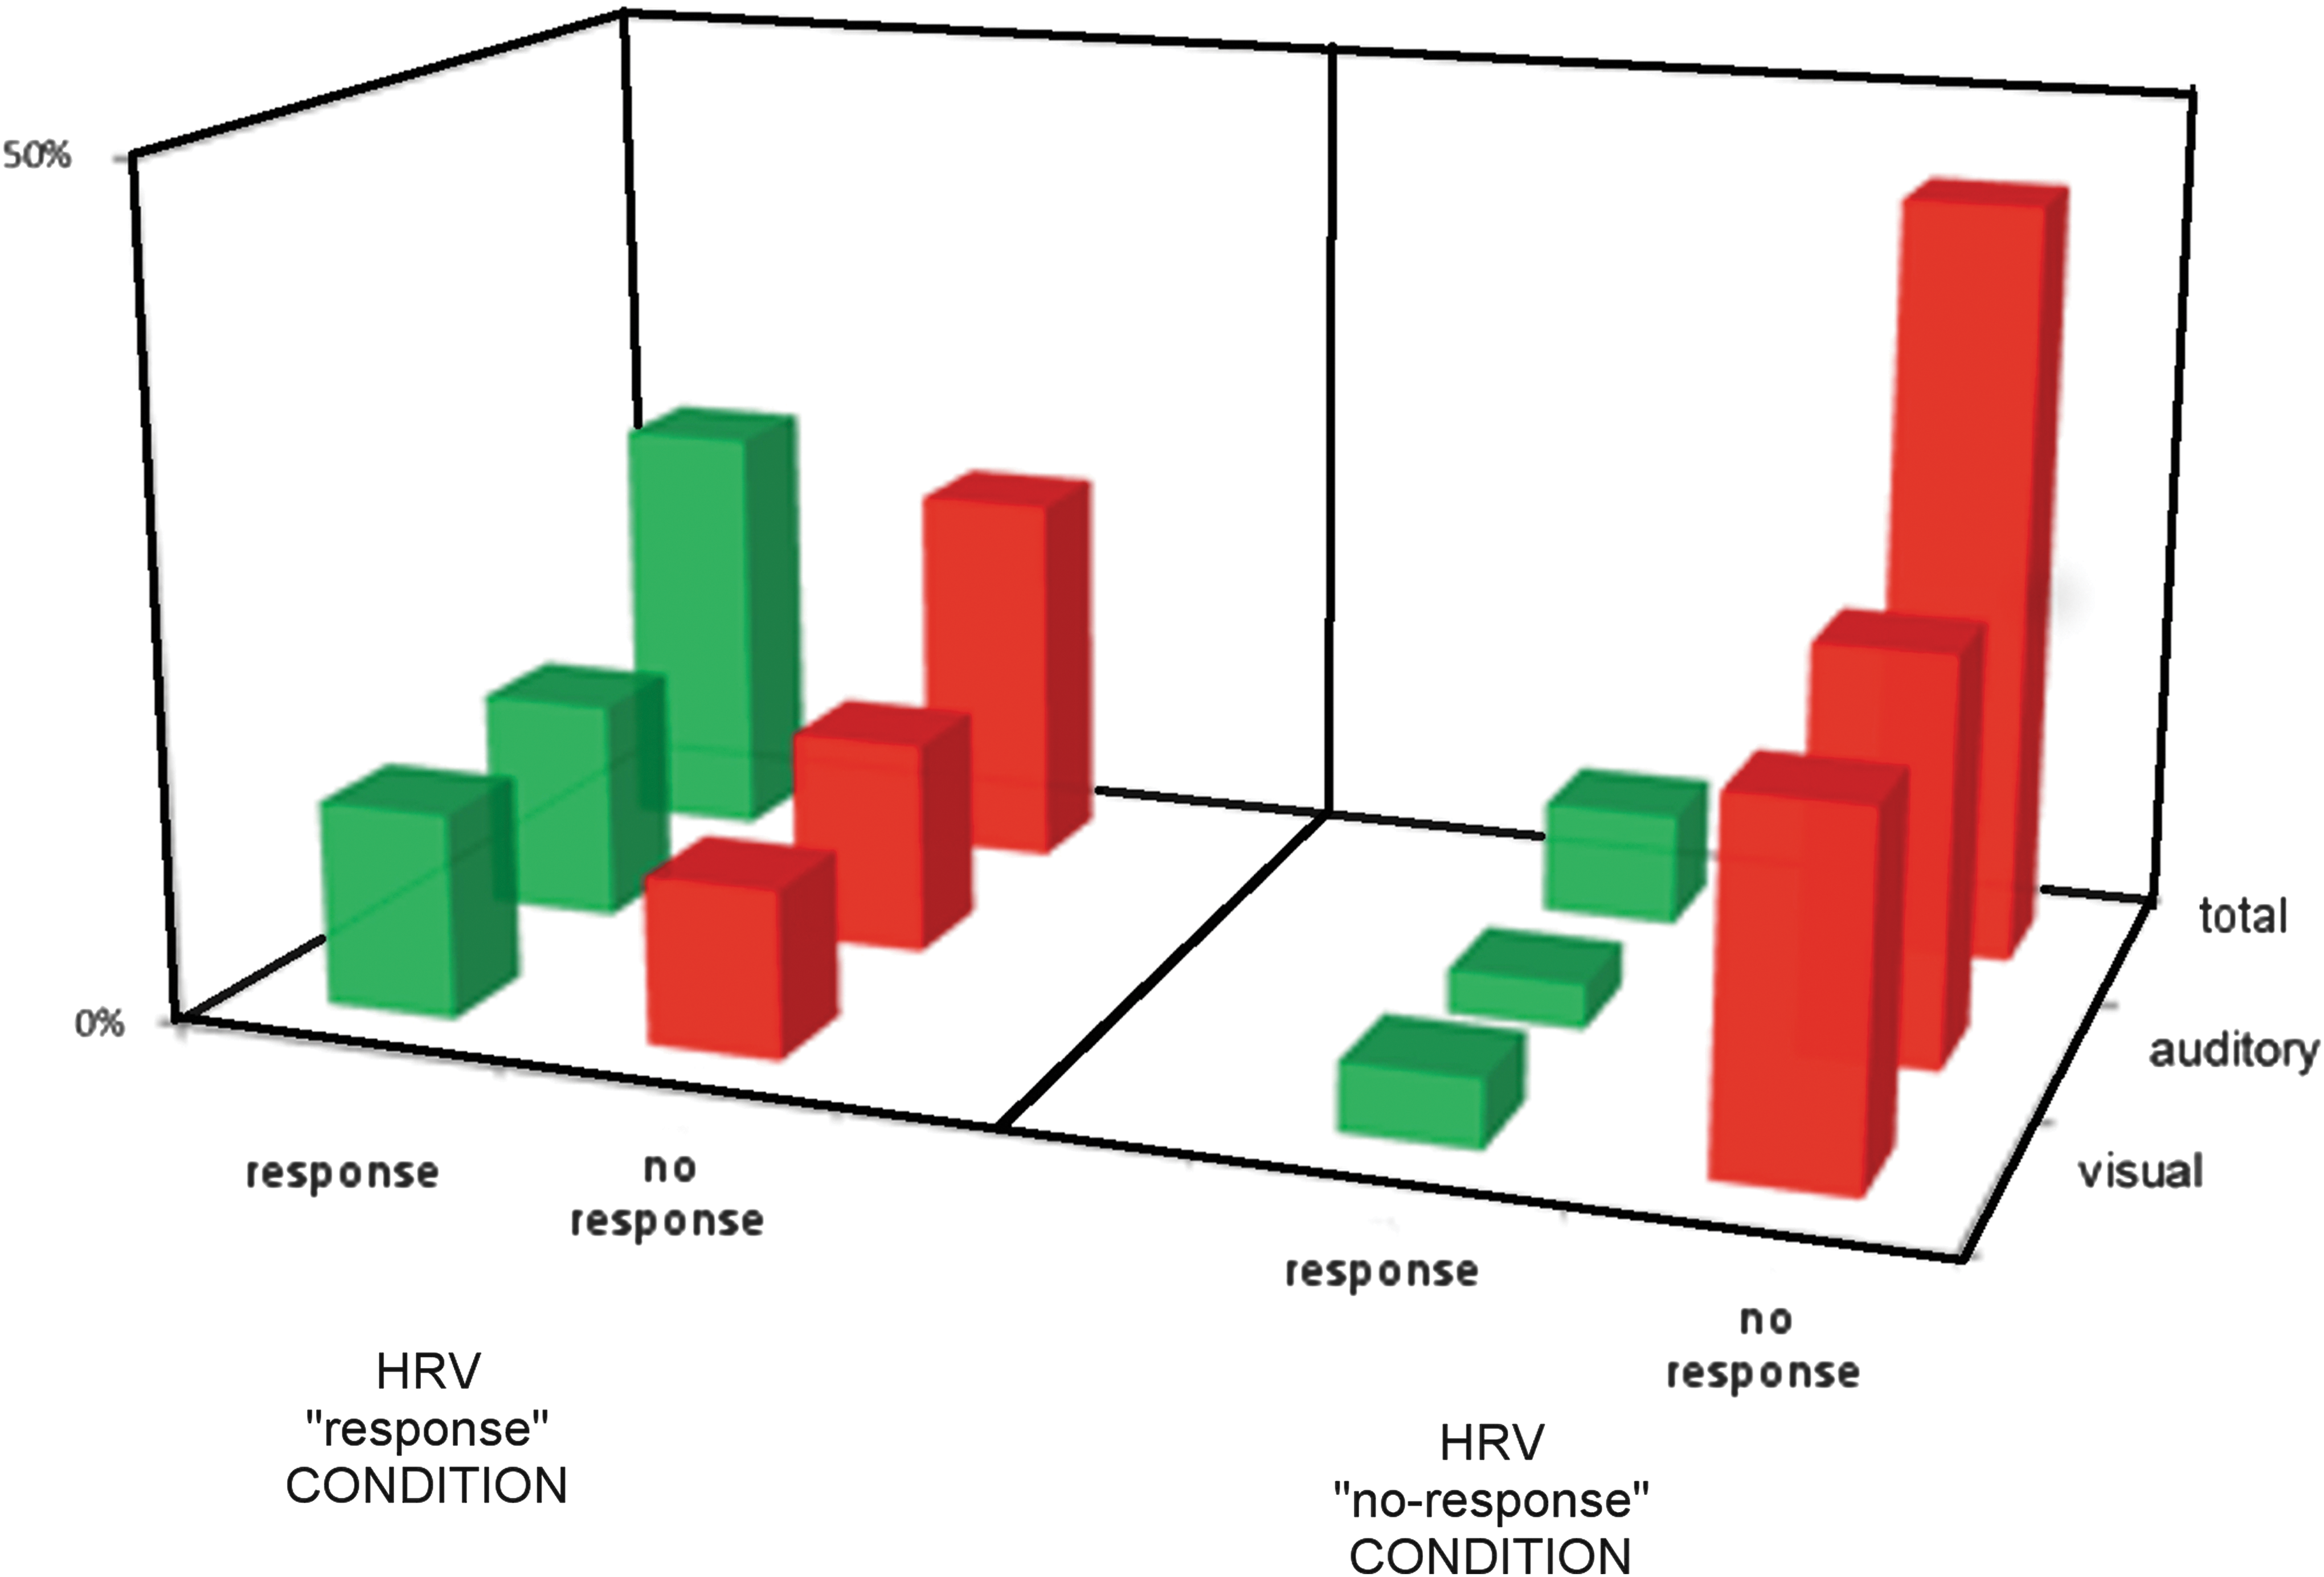
Overall incidence of the observed responses in the “response” and “no-response” conditions.
The ONE-R classifier estimated a correct classification of 76% and 72.4% in the training test and of 66.9% and 69.2% in the 10-fold cross-validation test for the nuLF and peakLF descriptors, respectively (Table 2). The correct prediction of response by the nuLF descriptor (43.7% positive predictive value) was higher than by the peakLF descriptor (24.6%). The highest correct classification of responses was observed at nuLF values between 21 and 30, and peakLF values between 0.09 HZ and 0.11Hz. Specificity was high (71.81–80.89).
Discussion
Evidence from neuroimaging research has documented retained modular brain function in VS/UWS and MCS subjects in the absence of the integrative processes necessary to sustain consciousness. 3,11,13,14,69 Neuroimaging studies also indicate direct/indirect functional links between the autonomic control and activity in brain structures that are involved in higher brain functions, such as attention and conscious processes. 33,35,36,70,71 A model network has been proposed, with the anterior cingulate cortex and its projections to the prefrontal cortex, amigdala, hypothalamus and brainsteam involved in the modulation of autonomic output in response to pain and emotional or behavioral stimulus conditions 33,37,72 –75 ; the model is consistent with the stimulus-related changes in the autonomic functional state observed in subjects otherwise diagnosed as being in VS/UWS. 24,26 –28,41 Responsiveness in these subjects, therefore, appears to be mediated by relatively complex processes. The incidence of established clinical signs of responsiveness varied during the day 18,20 and has been found to correlate with the sympathetic/parasympathetic balance. 41
In our study, responsiveness was predicted with high accuracy by the sympathetic/parasympathetic balance measured by the HRV descriptors nuLF and pkLF. The observation of visual (54.8%) or auditory (55.3%) responses was significantly higher in our subjects' group when tested at nuLF and pkLF descriptors within the value ranges indicative of sympathetic/parasympathetic balance than outside these ranges (12.9% and 16%, respectively). The incidence of a visual pursuit response was about twice higher at these HRV values than when predicted statistically or compared with the reported incidence at random testing (∼20%). 6,19 Remarkably, the absence of responses was predicted with over 85% accuracy when testing the subject's responsiveness at HRV values outside the “response” intervals but only in about half of cases when testing within the “response” intervals. Taken together, these findings suggest that subjects in VS/UWS may differ as to responsiveness to conventional sensory stimuli and could be classified in this respect with greater accuracy if tested in relation to their autonomic system functional state.
The test–retest experimental paradigm has been designed and limited in time to minimize the effect of age on HRV 41,76,77 and those of fragmentary circadian/ultradian or otherwise cyclic processes, spontaneous fluctuations, and environmental interference, as well as the end-effects of neuronal/nonneuronal factors modulating the brain state or responsiveness. 3,20,78 –80 Sources of biases possibly gone undetected in the study and random variability cannot be ruled out in principle but the higher incidence of responses at pre-selected ranges of the HRV descriptors is likely to exceed spontaneous variability and rather suggests that the current indices of responsiveness in VS/UWS vary depending on the concomitant functional state/balance of the autonomic nervous system. 26,27,38,41,81 In particular, some pathophysiological specificity of the HRV measures appears possible and these findings confirm the CRS-r reliability in the identification of conditions of different underlying pathophysiology.
Diagnosis and the clinical differentiation between VS/UWS and MCS remain mandatory in the management of patients, allocation of resources, and programming of health care policies but still rest mainly on the clinical observation of responsiveness and on the clinician's responsibility, 9,12,23 with a high estimated misdiagnosis between VS/UWS and MCS. 12,19,21 –23 Contrary to the positron emission tomography and functional magnetic resonance imaging availability mainly as research tools, 12 HRV recording methods are noninvasive and of limited technical complexity, easily applicable in conditions allowing limited environmental control such as (semi)intensive care units or with no collaboration by the investigated subjects, as it is in the case in the disorder of consciousness; thus, standard HRV analyses can be easily implemented. 34,47,82 –84 Testing for responsiveness in the disorder of consciousness while monitoring the ANS functional state and balance would result in higher accuracy and seems a practical approach to control the risks of erroneous classification and misdiagnosis of any individual subject in VS/UWS. Validation by mathematical models 41 allows some generalization of results due to the low sensitivity to risks of alpha inflation 85 also when derived from a relatively large dataset (n=221 in our case) from a small subject sample. 66,68,86,87 Caution is nevertheless mandatory and the translational power of the approach to the clinical routine must be confirmed in cohort investigations on large patients' samples.
It has been suggested that VS/UWS appears today neither static nor homogeneous, with characteristics compatible with a multifaceted condition—or variety of conditions. 7 Accordingly, the clinical criteria currently in use to define the disorders of consciousness and predict outcome based on neurological signs should be reconsidered, including variability over time and correlation with the autonomic system functional state—which could also qualify per se as an independent variable for diagnosis and prognosis.
Footnotes
Author Disclosure Statement
No competing financial interests exist.