
Abstract
Acute traumatic brain injury (TBI) is associated with neurological dysfunction, changes in brain proteins, and increased serum biomarkers. However, the relationship between these brain proteins and serum biomarkers, and the ability of these serum biomarkers to indicate a neuroprotective/therapeutic response, remains elusive. Penetrating ballistic-like brain injury (PBBI) was used to systematically analyze several key TBI biomarkers, glial fibrillary acidic protein (GFAP) and its break-down products (BDPs)—ubiquitin C-terminal hydrolase-L1 (UCH-L1), α-II spectrin, and α-II spectrin BDPs (SBDPs)—in brain tissues and serum during an extended acute-subacute time-frame. In addition, neurological improvement and serum GFAP theranostic value was evaluated after neuroprotective treatment. In brain tissues, total GFAP increased more than three-fold 2 to 7 d after PBBI. However, this change was primarily due to GFAP-BDPs which increased to 2.7–4.8 arbitrary units (AU). Alpha-II spectrin was nearly ablated 3 d after PBBI, but somewhat recovered after 7 d. In conjunction with α-II spectrin loss, SBDP-145/150 increased approximately three-fold 2 to 7 d after PBBI (vs. sham, p<0.05). UCH-L1 protein levels were slightly decreased 7 d after PBBI but otherwise were unaffected. Serum GFAP was elevated by 3.2- to 8.8-fold at 2 to 4 h (vs. sham; p<0.05) and the 4 h increase was strongly correlated to 3 d GFAP-BDP abundance (r=0.66; p<0.05). Serum GFAP showed such a strong injury effect that it also was evaluated after therapeutic intervention with cyclosporin A (CsA). Administration of 2.5 mg/kg CsA significantly reduced serum GFAP elevation by 22.4-fold 2 h after PBBI (vs. PBBI+vehicle; p<0.05) and improved neurological function 1 d post-injury. Serum biomarkers, particularly GFAP, may be correlative tools of brain protein changes and feasible theranostic markers of TBI progression and recovery.
Introduction
S
TBI is a multifaceted process governed by a pathophysiological sequelae that may persist for days, weeks, and months. 5 It has been hypothesized that these processes may be reflected in part by differential brain specific proteins detectable in tissue and possibly serum. Some of the most intensely studied TBI proteins include glial fibrillary acidic protein (GFAP) and its break-down products (GFAP-BDPs)—α-II spectrin break-down products (SBDPs), and ubiquitin C-terminal hydrolase-L1 (UCH-L1).
GFAP, an intermediate filament protein primarily expressed in astrocytes, has been shown to be increased in TBI and used as a marker of inflammation. 6 Recent studies also have shown that GFAP-BDPS are increased in brain tissue of rodent models of TBI. 7 TBI also has been shown to cause changes in α-II spectrin, a key neuronal scaffolding protein; however α-II spectrin is not typically studied as an independent metric in lieu of extensive analysis of its break-down products (SBDPs), which are increased in TBI. 8,9 Lastly, UCH-L1 (an enzyme enriched within neuronal cell bodies) may have a role in the ubiquitin-proteasome pathway during neuropathologic conditions wherein loss of UCH-L1 has, indeed, been linked to TBI-induced neurodegeneration. 10 Animal models of TBI have indicated that temporal changes in UCH-L1 occur in rodent brain tissue, albeit only during early, acute penetrating ballistic-like brain injury (PBBI). 11
Consistent with these observations, these proteins have been studied as potential TBI biomarkers in human, as well as animal, studies. GFAP and UCH-L1 have been used to differentiate injury types, predict long-term clinical outcomes, and determine injury severity. GFAP and UCH-L1 are increased acutely in serum or cerebrospinal fluid (CSF) of patients who experienced a mild or moderate TBI. In addition, GFAP and UCH-L1 have been correlated to negative long-term outcomes, such as increased mortality and Glasgow Coma Scale score. 12 –15 More recently, GFAP-BDPs detected in biofluids have been correlated to injury severity, poor outcome, and mortality. 16 –19 SBDPs are reported to be increased in the CSF of TBI patients within 24 h of injury and also are associated with poor clinical outcome as late as six months after injury incident. 20,21
Although many studies have demonstrated the potential value of serum biomarkers in TBI, none have correlated the abundance of serum markers with actual changes in the brain tissue. Therefore, the present study sought to determine if translational serum biomarkers may predict subsequent brain protein changes (and neuroprotection) in a pre-clinical model of severe TBI (i.e., PBBI). Further, this study also sought to determine if serum biomarkers could be used as indicators of early therapeutic intervention in an exemplary manner. In this case, cyclosprorin A (CsA), which decreases brain tissue damage in rodent models of TBI, was chosen as a potential therapeutic drug. 22,23
Methods
Surgical procedures
Male Sprague-Dawley rats weighing 250–300 g (Charles River Labs, Raleigh, VA) were housed individually under a normal 12-h light/dark cycle (lights on at 6:00
PBBI model
Experimental PBBI has been extensively characterized and reproduces a temporary cavity in the brain, which mimics the ballistic nature of a high-velocity bullet wound. 24 Briefly, a 10% unilateral frontal PBBI was induced in rats by stereotaxic insertion of a specially designed probe into the right hemisphere of the brain. The probe was inserted through a cranial window over the frontal cortex and rapid inflation/deflation of the water-filled balloon was used to create a temporary cavity in the cerebrum. Sham rats received identical surgical procedures without balloon expansion.
Brain tissue collection and Western blotting
Brain coronal tissue sections, 2 mm thick, were dissected starting 5 mm from bregma, and the ipsilateral hemisphere was immediately flash frozen in liquid nitrogen, and then stored at −80°C until use. Ipsilateral tissues contain cortical and subcortical regions, and include the frontal cortex caudate-putamen, as well as the corpus callosum. Brain tissues were collected 2 h, 4 h, 1 d, 2 d, 3 d, and 7 d after either PBBI or sham craniotomy and sonicated for 2×10 sec in 1× RIPA lysis buffer containing protease and phosphatase inhibitors (Sigma-Aldrich, St. Louis, MO). Lysates were centrifuged at 10 kg at 4°C for 20 min. Clarified supernatant was collected and protein concentrations were determined with the BCA protein assay kit (Thermo/Pierce, Rockford, IL). Samples containing 5 μg of total protein were separated by denaturing and reducing, 4–15% gradient, PAGE with the NuPage system (Invitrogen, Grand Island, NY). After transferring to PVDF membranes, blots were probed with primary antibodies to GFAP or α-II spectrin (Abcam, Cambridge, MA) or to UCH-L1 (Millipore, Billerica, MA). After incubation with appropriate horseradish peroxidase-linked secondary antibodies, chemiluminescent signal was developed with the SuperSignal West Femto Chemiluminescent Substrate (Thermo/Pierce, Rockford, IL). Densitometry of protein band intensity was measured using an ImageQuant LAS 4000 with automated background subtraction (GE Healthcare, Piscataway, NJ). In all cases, PBBI and sham biological replicates were measured on the same blot. GFAP and GFAP-BDP blots were normalized to 1 μg total protein from bi-lateral PBBI cerebral cortex (void of lesioned tissue and the blood clot, removed via scalpel dissection) loaded into each gel to control from gel–gel variation. Alpha-II spectrin, SBDP-145/150, or UCH-L1 were each normalized to the average sham value at individual time-points. Thus, the average value in sham tissues at each time-point=“1”. Values are indicated as arbitrary units (AU) derived from densitometric measurements; n=50-10 per group for each time-point.
Serum enzyme-linked immunosorbent assays
Blood was collected by cardiac puncture using Z/1.3 clotting tubes (Sarstedt, Newton, NC) and allowed to clot at room temperature for 30 min before centrifugation at 1200 g for 10 min at 4°C. Serum was transferred to a storage tube and supplemented with 1× Halt Protease and Phosphatase inhibitor mix (ThermoPierce, Rockford, IL). GFAP and UCH-L1 sandwich enzyme-linked immunosorbent assays (ELISAs) were conducted in-house using standard 96-well, flat bottom, Nunc Immuno Maxisorp plates (Fisher, Pittsburgh, PA) according to the manufacturers' protocol as described (Banyan Biomarkers, Alachua, FL). 25 Signal intensity was developed with 3,3′,5,5′-tetramethylbenzidine substrate and measured in duplicate using a colorimetric plate reader (450 nm). Target protein content was determined from standards with either five-parameter curve fitting (GFAP) or linear extrapolation (UCH-L1). Detection and accuracy was confirmed with internal calibrator controls. Values are indicated as the fold change ng/mL measurements, compared with sham, at each time-point; n=4–9 per group for each time-point.
CsA preparation and administration
A stock solution of CsA; (SandImmune® Injection, 5 mL sterile ampule; Novartis, East Hanover, NJ) was prepared fresh daily by diluting 1 mL CsA (50 mg/mL CsA+650 mg/mL Cremophor® EL+32.9% alcohol by volume; Sigma-Aldrich, St. Louis, MO) with 9 mL sterile normal saline to yield a concentration of 10 mg/mL. A corresponding stock solution of the vehicle, Cremophor EL, was prepared in sterile 32.9% ethanol in normal saline. Working concentrations of CsA (2.5mg/kg or 5 mg/kg) or vehicle (Cremophor EL) were diluted into sterile saline and filtered with Millex GV, 0.22 mm, 33 mm sterile syringe filters (Millipore, Billerica, MA). Solutions were delivered by slow intravenous bolus infusions (10 min duration) via the jugular vein administered 15 min after PBBI or sham surgery (n=10–13 per group).
Neuroscore assessments
Baseline neurological deficits were evaluated 15 min post-PBBI (prior to drug treatment), then 1 d post-injury using a modified battery of tests. 26 Neurological scores were based on a 12-point sliding scale ranging from 0 (normal) to 12 (severely impaired) comprised from the following four neurological tests: 1) contralateral forelimb flexion during tail suspension; 2) shoulder adduction (body upward curling behavior) during tail suspension; 3) open-field circling behavior; and 4) impaired resistance to lateral push.The maximum score for each component=3.
Statistical analysis
For brain tissue analysis by Western blotting, two-sided tests were used to evaluate the effect of injury and time on the potential increase or decrease in brain tissue biomarkers. The two-tailed Student's t-test was performed for α-II spectrin and SBDP-145/150 at individual time-points after normalization to respective shams at each time-point. Analysis of GFAP and GFAP-BDP in brain tissues by Western blotting was completed using two-way ANOVA with Bonferroni correction to determine significance between groups across time-points. One-sided tests were used to evaluate the potential increase in serum biomarkers as an effect of PBBI or decrease as a consequence of drug treatment. GFAP or UCH-L1 serum ELISA data was compared with sham values or PBBI+vehicle at specified time-points using the parametric one-tailed Student's t-test. Correlation coefficients were determined with one-tailed Pearson's or Spearman's correlation coefficient (r) analysis. All values shown are displayed as the mean±standard error of the mean. In the figures, statistical significance (p<0.05) is indicated with an asterisk (*). All analyses were conducted with Prism 6 (GraphPad Software, La Jolla, CA).
Results
GFAP and GFAP-BDPs in brain tissues
GFAP was detectable throughout this study at different molecular weights: total GFAP (summation of 37–50 kDa), intact GFAP (50kDa alone), and GFAP-BDP (summation of 37–48kDa). Total GFAP densitometry was relatively unchanged in PBBI, compared with sham, during acute time-points at 2 h, 4 h, and 1 d after injury brain tissues. However, the total signal was greatly increased in PBBI, compared with sham at 2 d, 3 d, and 7 d. GFAP-BDPs showed a distinct laddering pattern at approximately 37kDa, 42–44 kDa, and 48 kDa 2 d, 3 d, and 7 d after PBBI. Interestingly, the 50 kDa immunoreactive band representing intact GFAP was detectable throughout the first 2 d after injury but became less prominent 3 d and 7 d after PBBI (Fig. 1A).
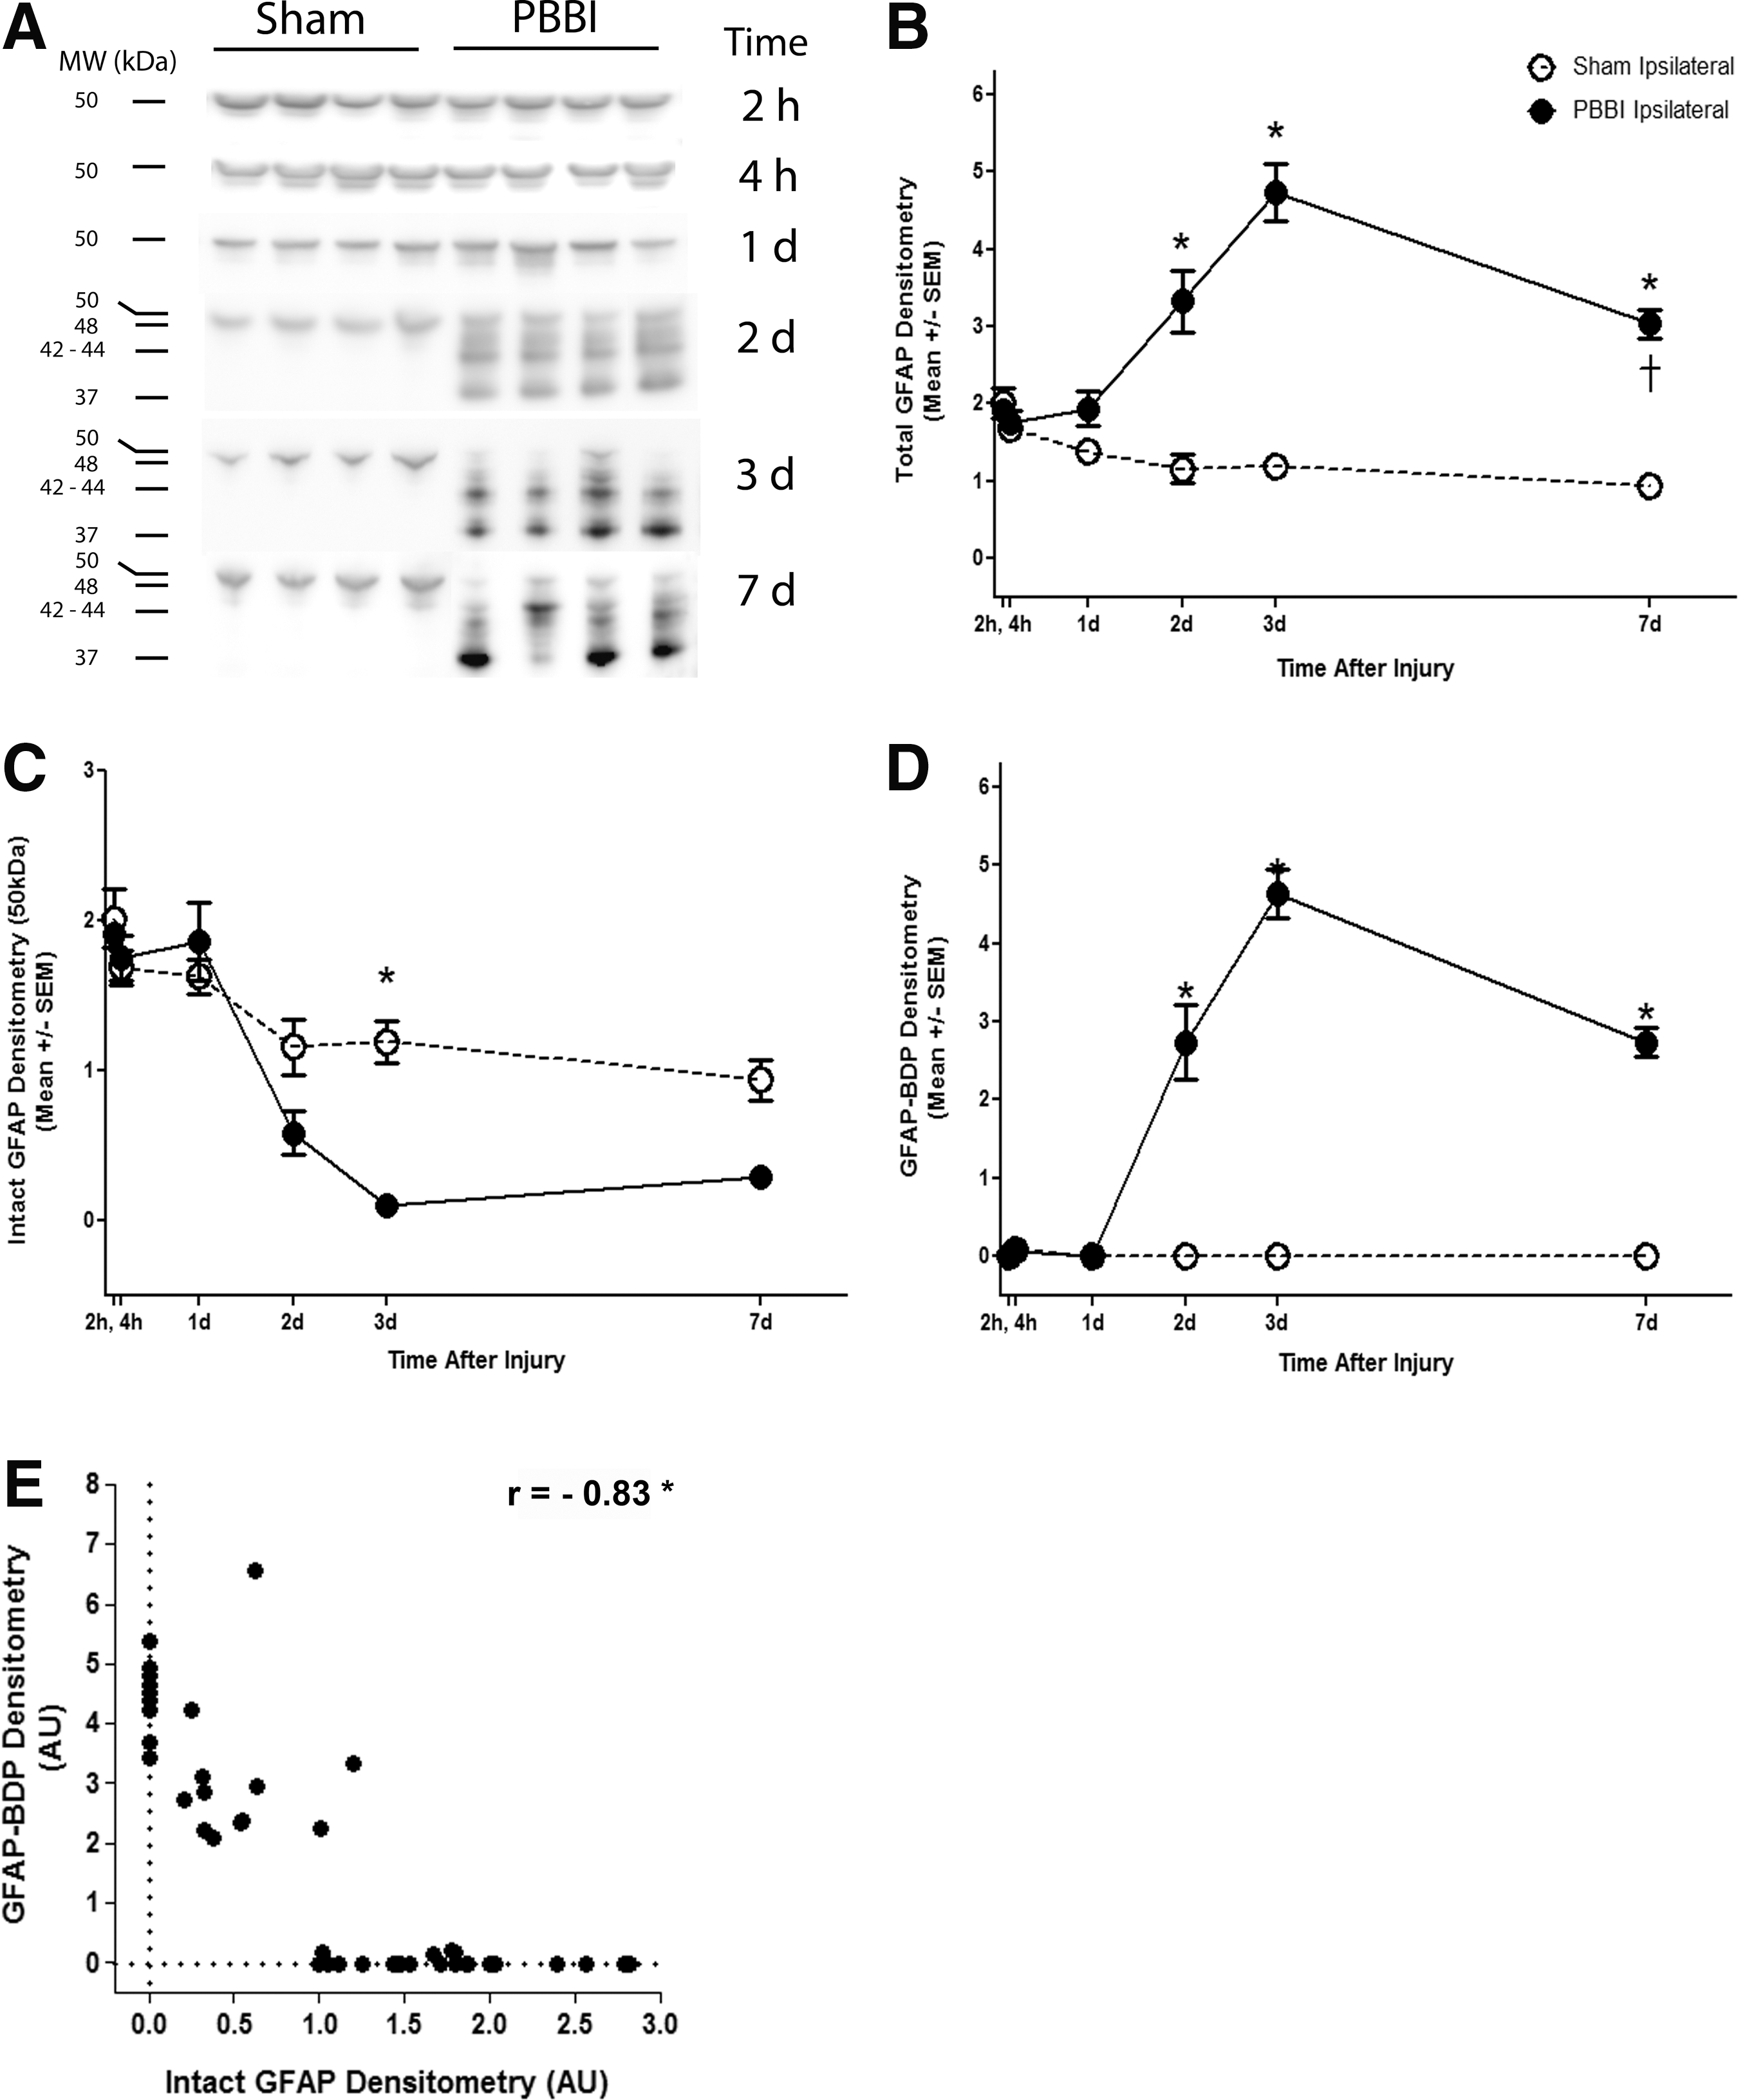
Penetrating ballistic-like brain injury (PBBI) leads to loss of glial fibrillary acidic protein (GFAP) and gain of GFAP break-down products (BDPs) during the subacute time-frame.
Quantitative analysis indicated a clear increase in total GFAP immunoreactivity. The increase in total GFAP densitometry was significantly increased by 2.8-fold at 2 d (3.3±0.4 AU vs. 1.2±0.2 AU), and 3.9-fold at 3 d (4.7±0.4 AU vs. 1.2±0.1 AU). The fold change was slightly smaller at 7 d post-injury, wherein total GFAP was increased by 3.3-fold, compared with sham (3.0±0.2 AU vs. 0.9±0.1 AU; Fig. 1B).
Although total GFAP increased over time, the Western blot images clearly indicate that intact GFAP (50 kDa) decreased and the lower molecular weight break-down products (37–48 kDa) increased. The effect of PBBI on intact GFAP and GFAP-BDPs were analyzed separately. Intact GFAP is gradually decreased over the course of injury and was nearly ablated after PBBI by 3 d. At this time-point, intact GFAP densitometry decreased by 12-fold in PBBI (0.097±0.07 AU), compared with sham (1.2±0.14 AU; Fig. 1C).
GFAP-BDPs were not detectable 2 h through 1 d after PBBI; however, densitometry increased sharply 2 d (2.7±0.5 AU) and 3 d (4.6±0.3 AU) after PBBI. Similarly, GFAP-BDPs were increased at 7 d (2.7±0.2 AU) in PBBI tissue, although abundance was slightly decreased, compared with values detected 2–3 d after injury. GFAP-BDPs were not detectable in sham tissues (Fig. 1D). The relationship between intact GFAP and its BDPs also was explored. Data was compiled from ipsilateral tissues all across time-points after PBBI. Pearson correlation analysis indicated that intact GFAP and GFAP-BDPs had a strong negative correlation (Pearson's r = −0.83; one-tailed; p<0.05). The loss of intact GFAP was directly proportional to the increase in GFAP-BDPs (Fig. 1E).
Brain-derived alpha -II spectrin and SBDP-145/150
Both full length α-II spectrin and SBDP-145/150 were readily detectable in sham and PBBI brain tissues at 280 kDa and 145/150 kDa, respecttively. Full length alpha-II spectrin was prominent at 2 h, 4 h, and 1 d after injury, with no apparent difference due to PBBI, compared with sham controls. Notably, α-II spectrin was drastically decreased starting at 2 d through 7 d after PBBI, compared with sham (Fig. 2A).
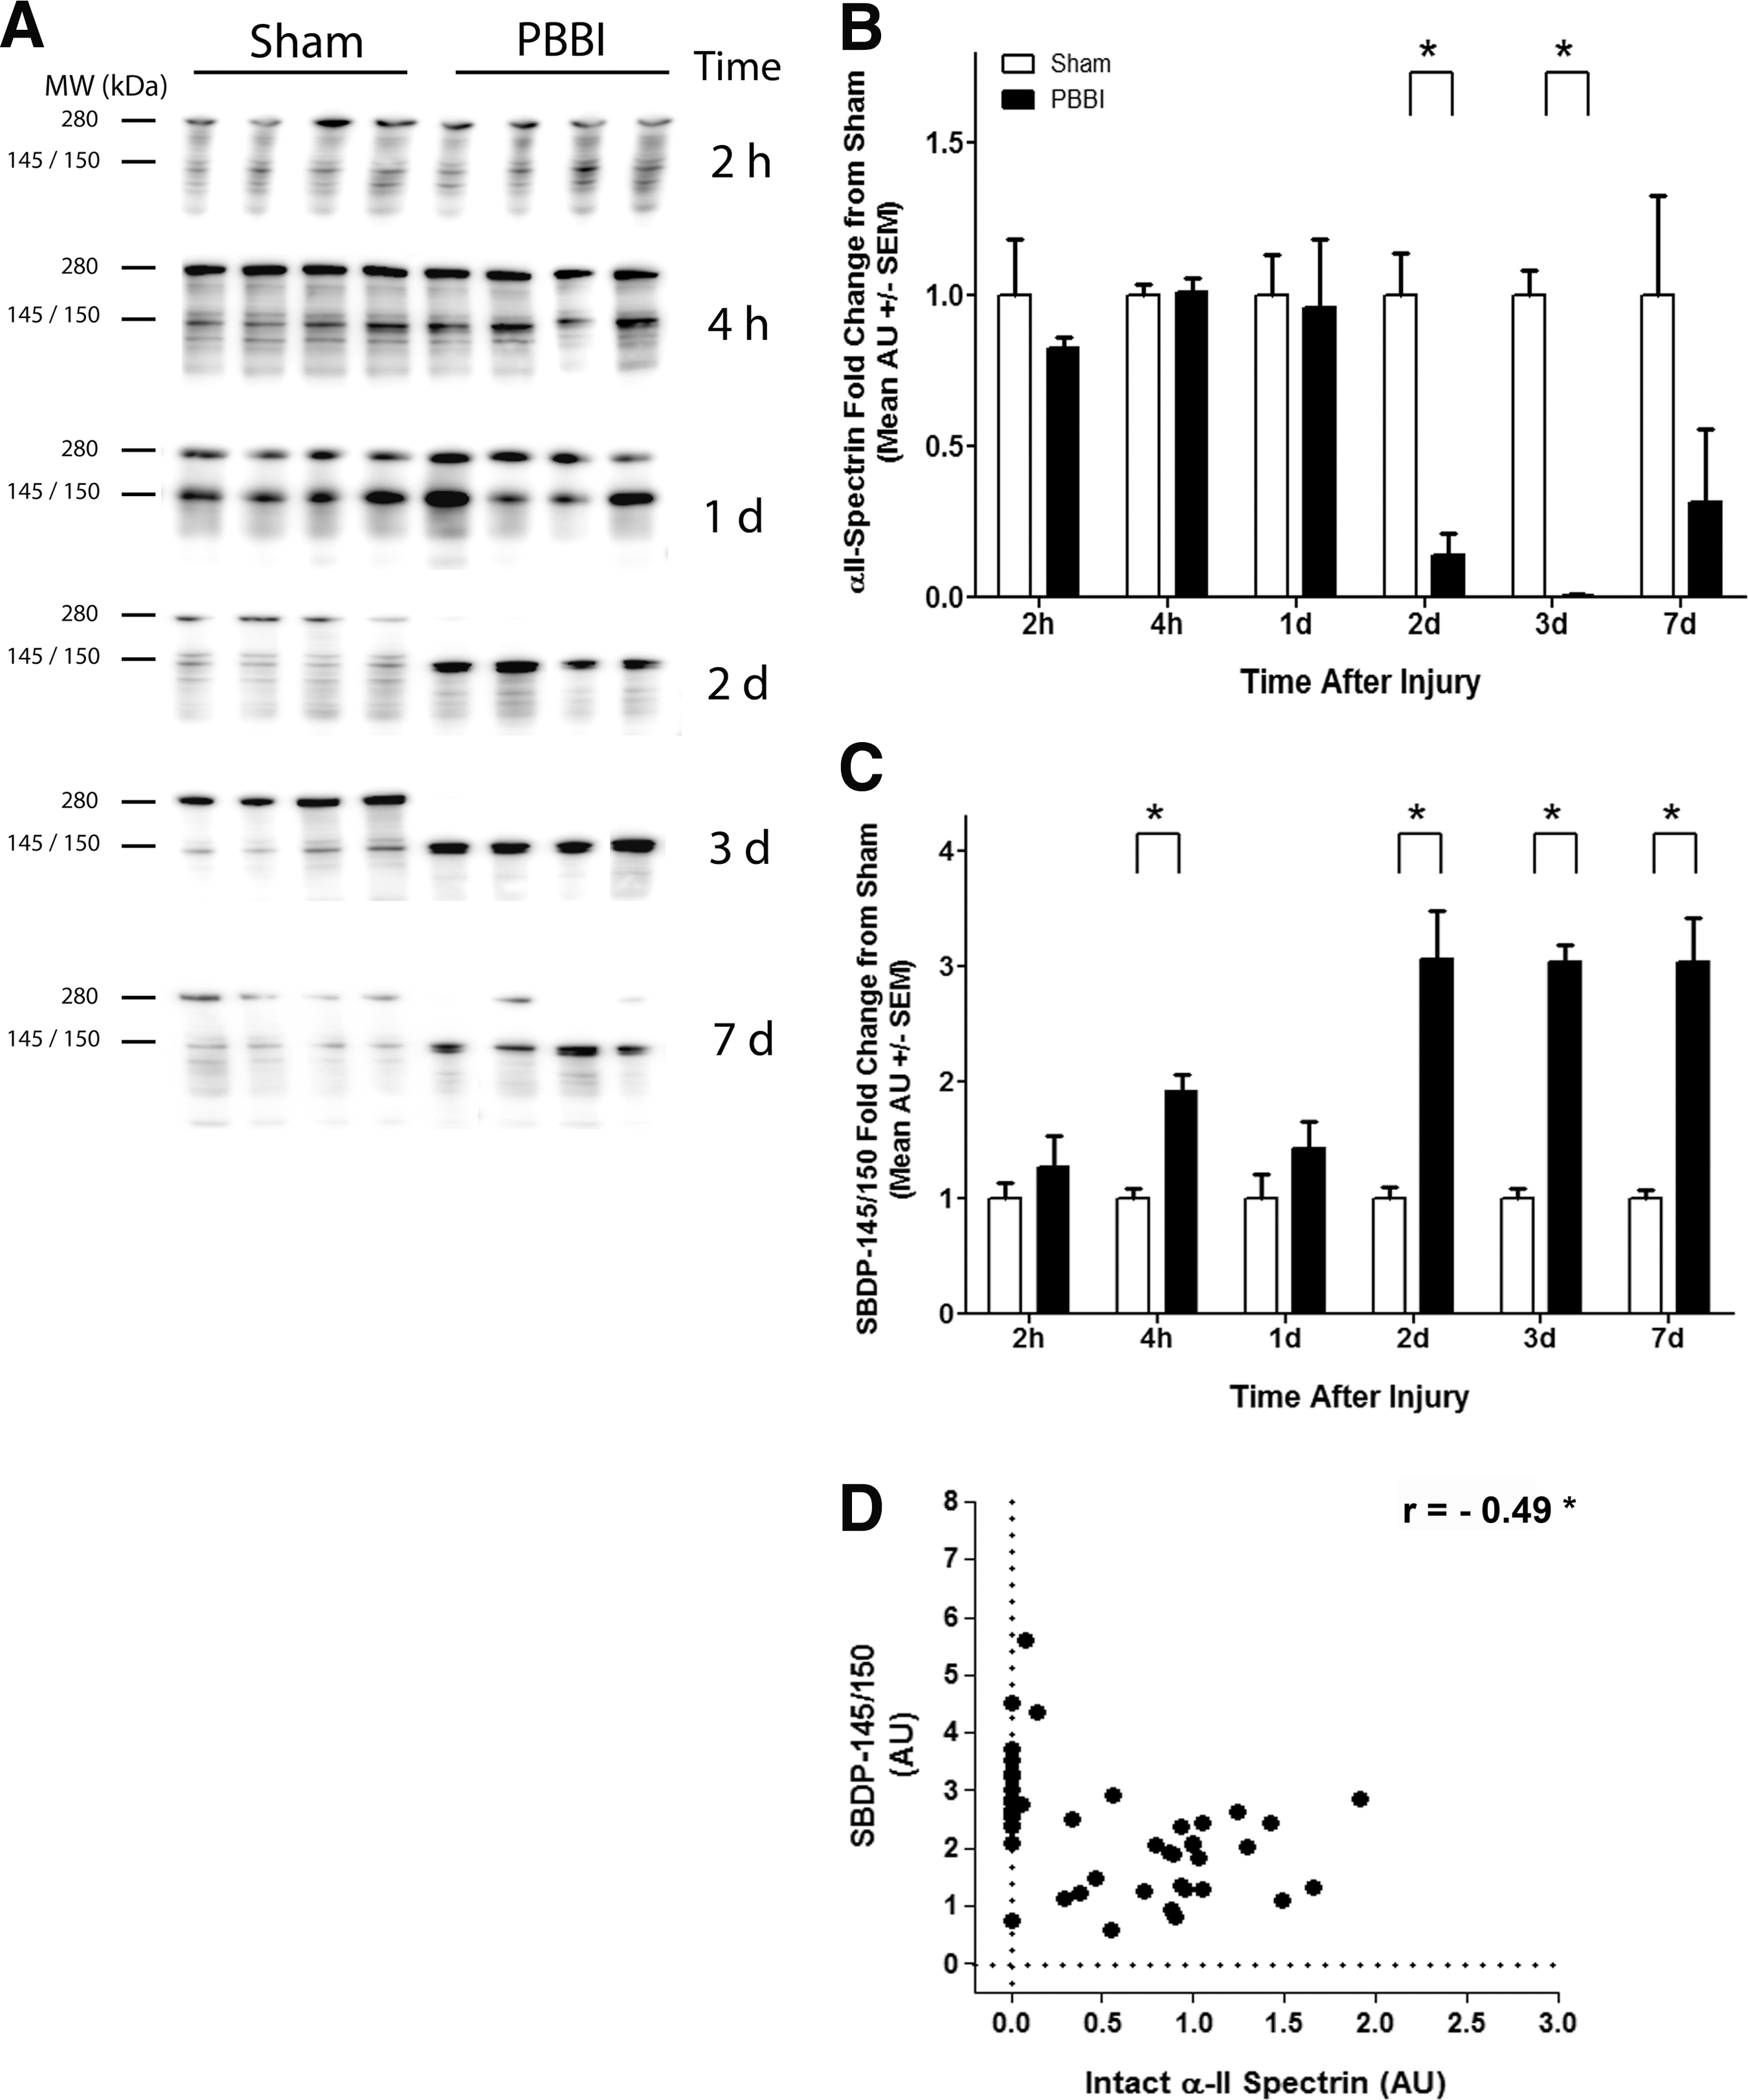
Alpha-II spectrin is nearly ablated as α-II spectrin break-down product (SBDP)-145/150 becomes abundant during subacute penetrating ballistic-like brain injury (PBBI).
Quantitative analysis confirmed that intact α-II spectrin was significantly decreased in tissues 2 d to 7 d after PBBI (Fig. 2B). Compared with sham levels, α-II spectrin was decreased by 7.3-fold (0.1±0.1 AU) at 2 d and by 150-fold (0.007±0.007 AU) of sham levels, thus nearly ablated 3 d after injury. Protein abundance partially recovered by 7 d post-PBBI and was only decreased by 3.2-fold (0.3±0.2 AU), compared with sham and was no longer significant.
SBDP-145/150 showed a progressive increase across the time-frame studied (Fig. 2C). Although there was no change between groups 2 h after injury, SBDP-145/150 densitometry nearly doubled 4 h after PBBI (1.9±0.14 AU), compared with sham (1.0±0.08 AU). The increase in SBDP-145/150 1 d after PBBI (1.4±0.23 AU) was not significant. At the later time-points studied, PBBI led to a very consistent and robust increase in SBDP-145/150, wherein it increased by three-fold at 2 d, 3 d, and 7 d.
The relationship between intact α-II spectrin and SBDP-145/150 in PBBI also was compared across all time-points. There was a moderate but significant negative correlation (Pearson's r=−0.49; Fig. 2D). Although SBDP-145/150 increased by 1.5-fold 1 d after PBBI (1.5±0.27 AU), compared with sham, the change was not significant. Overall, there was a delayed loss of α-II spectrin 2–3 d with minor recovery at 7 d, and a steady increase of SBDP-145/150 from 2–7 d after PBBI. Of note, SBDP-120 was detectable but visual inspection of Western blots and reconstructed histograms indicated that the band estimated at 120 kDa was poorly resolved (data not shown). Therefore, SBDP-120 was not included in this study.
Neuronal protein, UCH-L1, in brain tissues
UCH-L1 was readily detectable as a ∼25 kDa band at 2 h through 7 d in both PBBI and sham tissues. Large differences due to PBBI were not readily apparent (Supplementary Fig.1A; see online supplementary material at
GFAP and UCH-L1 in serum after PBBI
The temporal profile of GFAP and UCH-L1 in serum was determined 2 h, 4 h, 1 d, 2 d, 3 d, and 7 d after PBBI or sham (Fig. 3). Serum GFAP increased 3.2-fold at 2 h and 8.8-fold at 4 h after PBBI, compared with sham controls. GFAP was increased by approximately two-fold 1 d after PBBI, compared with sham, but this change was not significant. The difference between GFAP at 2 h and 4 h after PBBI also was significant, as serum GFAP increased by 2.7-fold after 4 h, compared with the level detected at 2 h post-PBBI. At later time-points (1 d to 7 d after PBBI), GFAP levels were very similar to those observed in sham (Fig. 3A). This study also sought to determine if there was a correlation between acute GFAP in serum (using the peak value at 4 h post-injury) and GFAP-BDP abundance in brain tissue after PBBI. There was no significant correlation between serum GFAP and tissue GFAP-BDP at 2 d (Pearson's r=−0.20; non-significant). However, there was a moderately strong, significant correlation to GFAP-BPDs 3 d after PBBI (Pearson's r=0.66, p<0.05; Fig. 3B).

Serum glial fibrillary acidic protein (GFAP) is increased during acute penetrating ballistic-like brain injury (PBBI) and was correlated to subacute GFAP break-down products (BDPs) in brain tissues.
Serum UCH-L1 showed a very different profile after PBBI (Supplementary Fig. 2; see online supplementary material at
Serum biomarkers after PBBI with therapeutic intervention
It is fairly well accepted that serum biomarkers are not necessary for the diagnosis of a severe TBI. However, serum biomarkers could be of value as surrogate markers of a drug response. Therefore, we investigated the ability of serum GFAP to monitor the therapeutic potential of CsA on acute neuroscore measurements at 1 d post-PBBI.
Baseline neurofunctional outcome at 15 min post-PBBI revealed comparable non-significant deficits in all injury groups (data not shown). Data measured 1 d after PBBI indicated that 2.5 mg/kg CsA significantly reduced neuroscore (composite score=4.2±0.5) by 1.4- to 1.5-fold, compared with either PBBI+vehicle (composite score=5.8±0.6; p<0.05) or PBBI+5.0 mg/kg CsA (composite score=6.3±0.31; p<0.05; Fig. 4A). In contrast, both doses of CsA reduced GFAP levels in serum at 2 h post-injury. PBBI animals treated with vehicle had serum GFAP levels that were two-fold greater than sham controls. Administration of 2.5 mg/kg of CsA resulted in a significant, 22.4-fold decrease in serum GFAP levels, compared with PBBI+vehicle, and an 11.7-fold decrease, compared with PBBI+5.0 mg/kg. The low (2.5 mg/kg) dose also decreased GFAP by 11.3-fold, compared with sham whereas the high dose (5 mg/kg of CsA) decreased GFAP by 1.9-fold, compared with PBBI+vehicle, which was near sham levels (Fig. 4B). A significant positive correlation was detected between serum GFAP levels and neuroscore based on data derived from all doses used (Spearman's r=0.36; p<0.05; Fig. 4C). Overall, the increase in serum GFAP following PBBI was abrogated by acute CsA treatment and correlated to neuroscore.
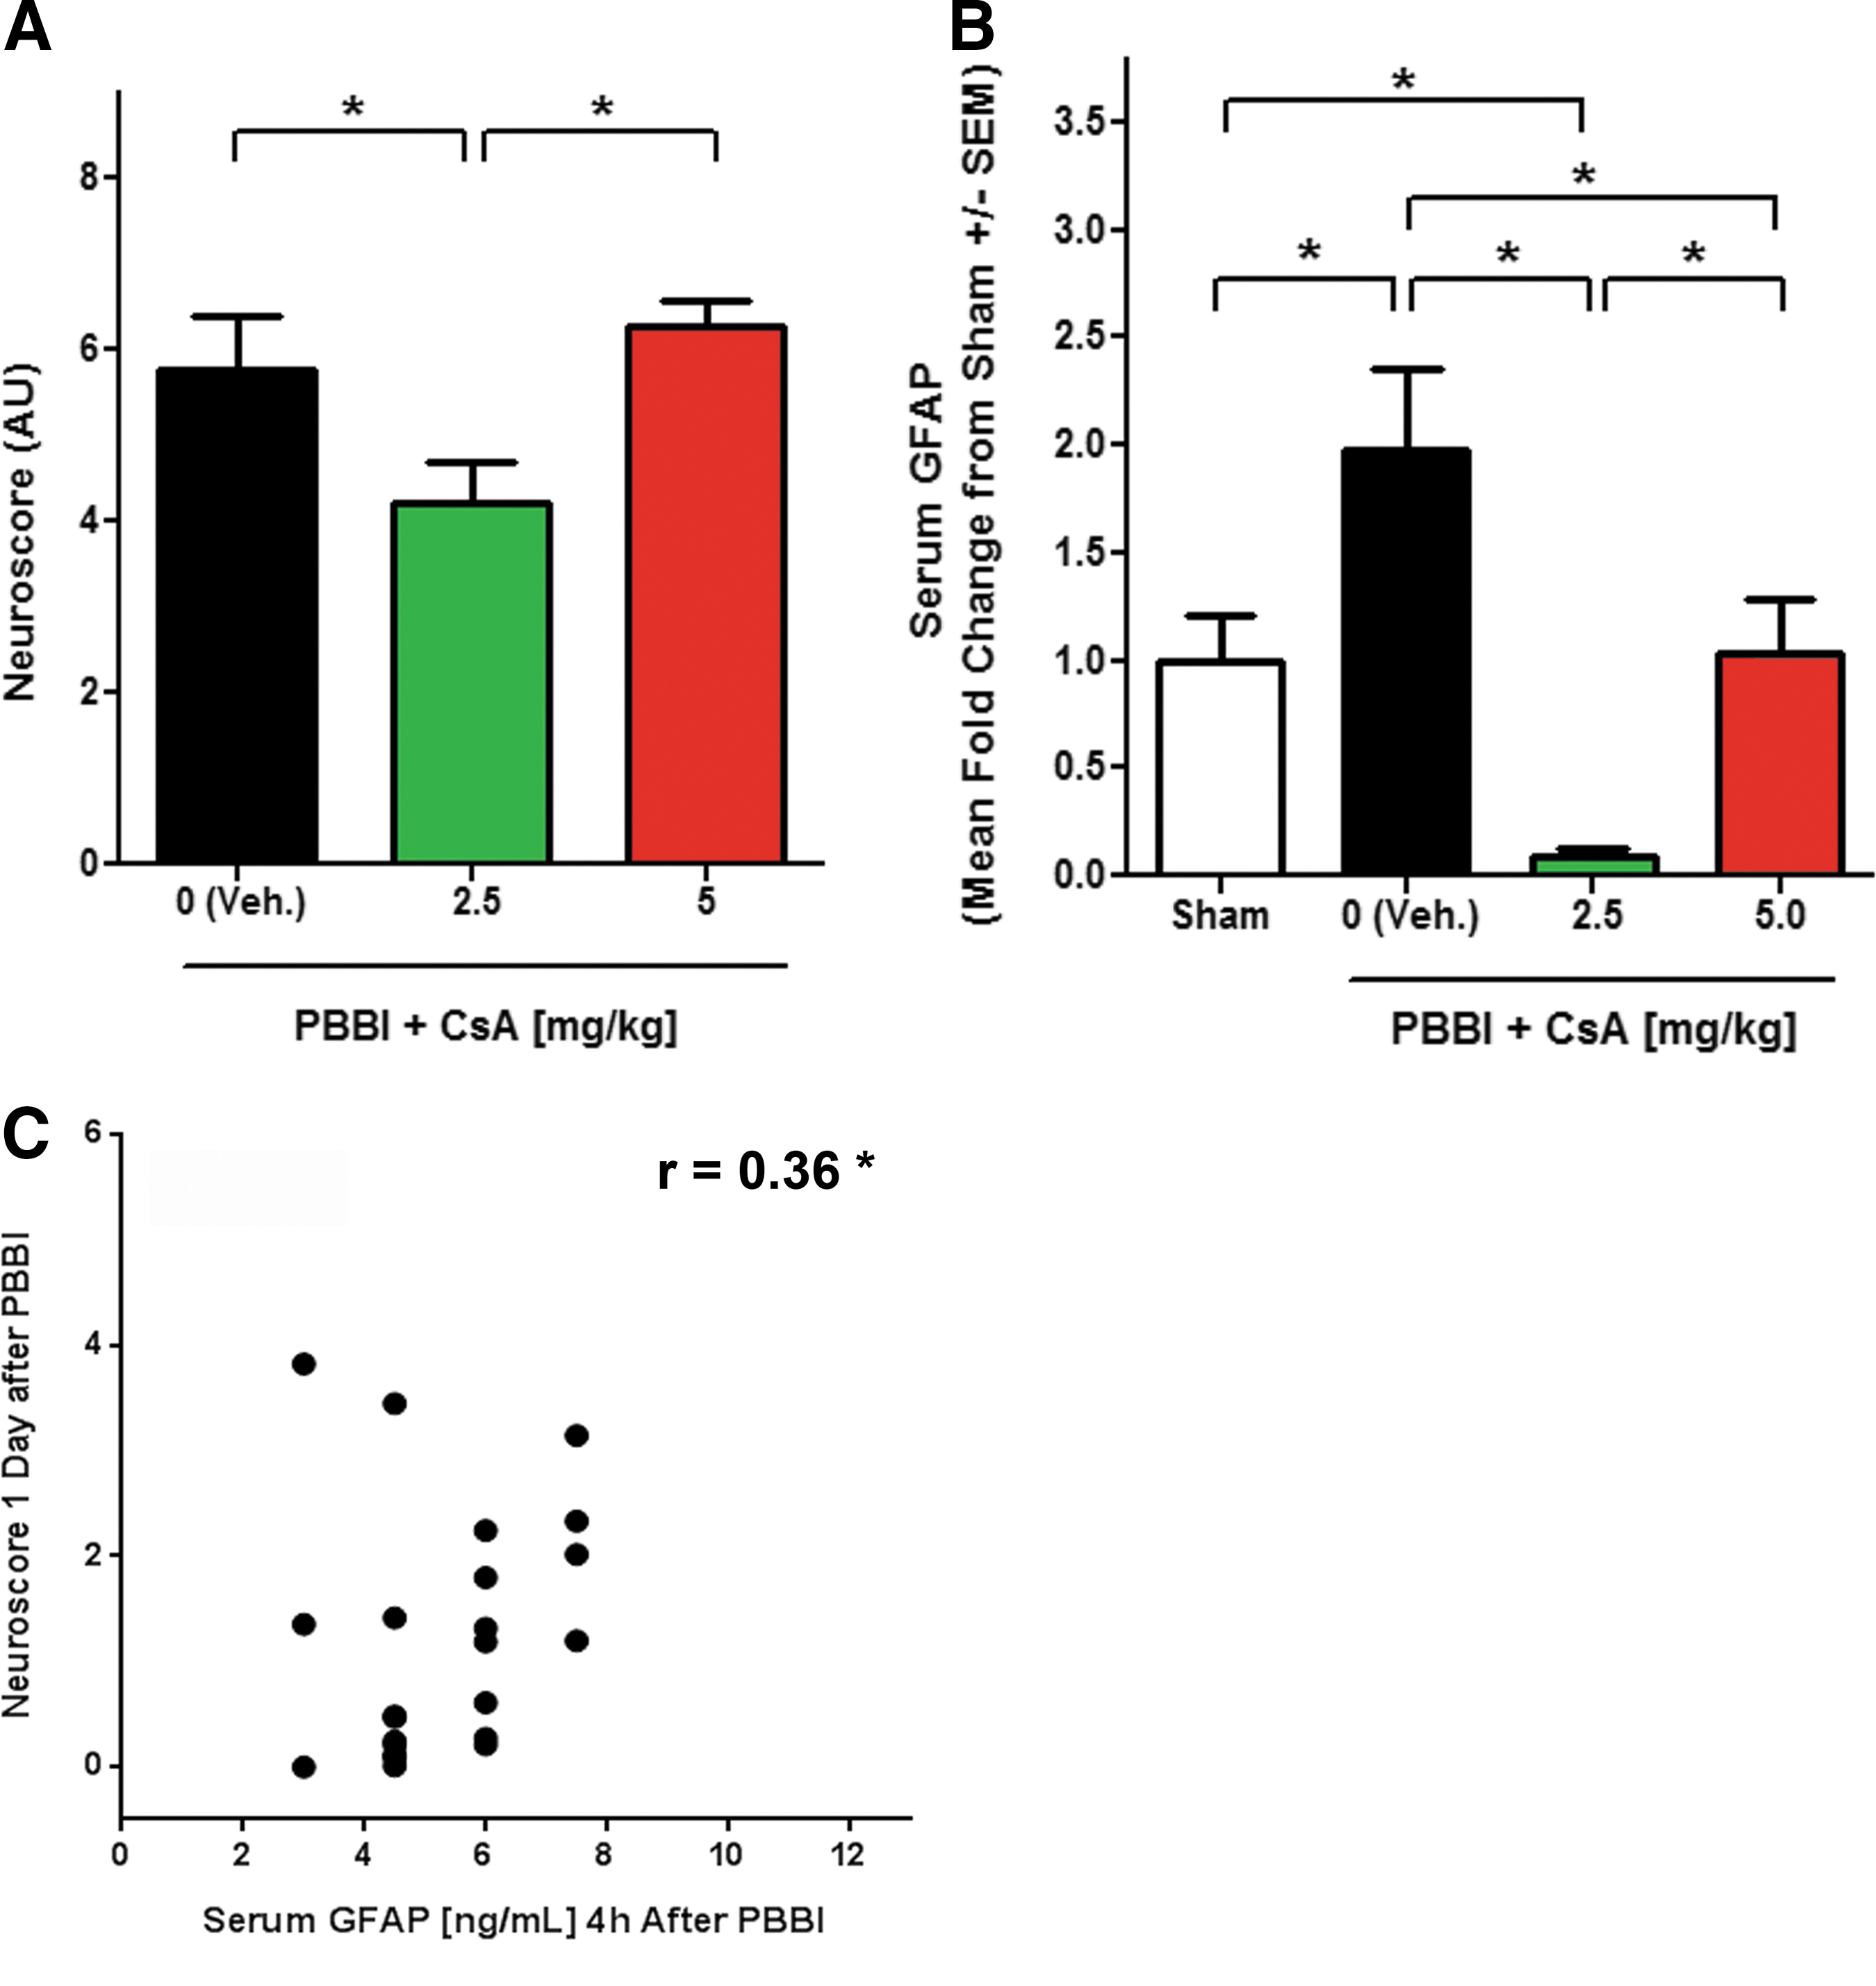
Cyclosporin A (CsA) reduced penetrating ballistic-like brain injury (PBBI) induced neuroscore and glial fibrillary acidic protein (GFAP) serum concentration.
Discussion
GFAP and UCH-L1 are both being studied as promising acute serum biomarkers of TBI. The majority of studies have focused on GFAP and UCHL1 and their ability to serve as diagnostic biomarkers of TBI. There also has been recent interest in the discovery of biomarkers that also may infer therapeutic efficacy in an effort to employ more effective treatments. 27 However, the ability of reliable biomarkers to serve as theranostic markers that also correlate to changes in brain tissues has not yet been determined. This aspect is further complicated by the fact that the full scope of protein changes that occur in the brain as a result of TBI in a translational rodent model are not fully known. The present study provides a comprehensive temporal profile of biomarkers in brain tissues over an extended acute time-frame after severe TBI. In addition, evaluation of protein biomarker abundance in serum as a consequence of PBBI was followed by theranostic evaluation of GFAP after administration of a neuroprotectant, CsA.
GFAP, rather than UCH-L1, is an appropriate indicator of PBBI induced sub-acute brain protein alterations
Although serum markers can be correlated to neurological outcomes in patients, it is not possible to directly correlate serum biomarkers to molecular changes within brain tissue. First, we confirmed that serum changes in GFAP were limited to the early acute time-points (≤24 h) after injury. The sharp increase in serum GFAP after injury suggests brain protein efflux during transient opening of the blood–brain barrier (BBB) that occurs during this time-frame. 28 Therefore, we applied a time-dependent offset in order to correlate early serum GFAP to late in tissues, wherein we demonstrated that early changes in serum GFAP positively correlated to changes in brain tissue GFAP-BDPs detected at later time-points. To our knowledge, this is the first study to correlate acute serum biomarkers, albeit with a temporal offset, to BDPs in brain tissues using animal models of severe TBI.
Although serum GFAP demonstrated correlation to changes in brain tissue, the same cannot be said for UCH-L1. UCH-L1 was not significant at any time-point after injury in serum and was marginally, albeit significantly, increased in brain tissue at the earliest (2 h) or latest (7 d) time-points. In brain tissues, UCH-L1 was decreased 7 d post-injury in accordance with observed delayed neurodegeneration in PBBI 29 but a definitive temporal pattern in brain tissues was not observed. These results were surprising since UCH-L1 has been reported to increase sharply in CSF and brain tissues after PBBI or CCI. 30 In part, the differences in UCH-L1 levels detected across these studies may be due to various injury-control iterations and normalization techniques. It also is possible that while increased UCH-L1 levels are detectible in CSF, the concentrations are not elevated enough to be significantly different in serum isolated from injured animals. In support of this theory, the median concentration of UCH-L1 is reported to be much lower in serum than in CSF within clinical samples collected within 7 d of injury. 31 Thus, UCH-L1 may be untenable as a clinically-relevant biomarker in relevant animal models of severe TBI and of therapeutic responses.
Recent studies have indicated that GFAP (compared with UCH-L1) was a more powerful prognostic marker of TBI. Specifically, increased GFAP levels have been detected in the serum of TBI patients in the absence of statistically significant increases in UCH-L1 levels. Moreover, GFAP was better at discriminating TBI patients, compared with controls, and was a more accurate overall predictor of poor outcomes. 32 –34 Thus, it is not surprising that changes in serum GFAP, rather than UCH-L1, were significant or that its observed increase was correlated to brain protein changes after PBBI. This current study confirms that serum GFAP, compared with UCH-L1, may be a more reliable prognostic biomarker for TBI. Interestingly, serum GFAP may be a mixture of intact protein and BDPs. The antibody used in the current study recognizes the C-terminal region present in both full length GFAP and its BDPs. In addition, GFAP-BDPs have specifically been reported in the serum of patients with mild-moderate TBI. 18 This study could not be expanded to include analysis of serum GFAP-BDP or SBDP-145/150 as they could not be reliably detected, even after depletion of interfering proteins (albumin and immunoglobulins, data not shown) by either Western blots or commercial ELISA assays. Additional reports indicate that BDP-specific antibodies either do not react with rodent samples or are not commercially available. 35
Brain tissue break-down products indicate persistent proteolysis and inflammation throughout acute PBBI
This study indicates a progressive, persistent increase of both GFAP and α-II spectrin BDPs throughout an extended time-frame of acute PBBI, which has not been shown in detail previously. Generation of BDPs is reported to be governed by caspase-3 (apoptotic) and calpain-II (necrotic) cell death pathways. Both cell death pathways are active within 1 d of PBBI and are reported to be modulated at the transcription level over time. 36 It is fitting that GFAP and α-II spectrin BDPs were visible throughout acute injury in the present study. We noticed that break-down products generated by only by calpain (GFAP-BDPs at 37–48kDa and SBDP-145/150) were abundant after PBBI. Interestingly, caspase generated BDPs (like 20 kDa GFAP-BDP 37 and SBDP-120) were not prominent in this study although they have been reported in models of brain injury including middle cerebral artery occlusion (MCAO) and controlled cortical impact (CCI). 38 This study suggests that calpain, rather than caspase, plays a more prominent role in the progression of acute penetrating injury over longer time-frames. This hypothesis is supported by recent reports demonstrating that calpain activity and resulting BDPs persist in regions near the injury site. 39
This study also observed a correlative loss between GFAP and α-II spectrin and their respective BDPs during PBBI. While increased total GFAP is a hallmark of TBI-induced inflammation and astrogliosis, commercially available antibodies bind to the common C-terminal region, which leads to simultaneous detection of both full-length GFAP and its BDPs. Thus, standard histological methods using these types of antibodies cannot differentiate between intact GFAP and its BDPs. The results of the present study indicated that intact GFAP was nearly ablated and that the actual metric of increased total GFAP was due to the overwhelming abundance of its BDPs. GFAP-BDPs are gaining a more significant role in elucidating mechanisms of TBI progression and converging evidence suggests that the loss of GFAP to its calpain-generated BDPs, presented herein, is part of the delayed inflammatory and cell death processes. In fact, loss of intact GFAP is speculated to contribute to neuronal loss 40 and GFAP degradation has been observed in human post-mortem brain tissues that also had gliosis. 41 Another source of these smaller GFAP species may be isoforms derived from an influx of neurogenic astrocytes in damaged tissues. These isoforms are a small percentage of the isoform population and reported in a chronic neurodegenerative model. 42 The presence of smaller molecular weight GFAP as BDPs is likely reflective of extensive proteolysis, cellular damage, and inflammation throughout peri-lesional and subcortical areas, void of the core lesion, in PBBI model at the time-frames tested.
Alpha-II spectrin is a key actin-binding cytoskeletal protein that is often not considered as an individual metric of injury or recovery. Interestingly, this study showed that full-length α-II spectrin was initially lost as a consequence of PBBI but seemed to recover, while SBDP-145/150 remained elevated 7 d after injury. The exact role and significance of intact α-II spectrin during TBI is unknown. However, studies have shown that protection or recovery of α-II spectrin is correlated to neuronal survival. 43 Spectrin also is involved in repairing DNA damage, 44 a process which occurs in TBI. 45,46 Perhaps the increase in α-II spectrin 7 d after injury is an indicator of spontaneous repair. The present findings may indicate a balance between degradation and attempted recovery, while showing that α-II spectrin may be a therapeutic indicator of potentially favorable outcomes.
Serum GFAP may be a valuable theranostic marker of neuroprotective intervention
We are currently testing multiple neuroprotective drugs, for which the neuroscore (a combined measurement of neurological and motor deficits) is often determined. In PBBI, the neuroscore is a key behavioral determinant of impairment that becomes worse as early as 1 d after PBBI. 47 One candidate neuroprotective drug, CsA, has garnered attention as a potential TBI treatment and has been shown to be neuroprotective in a model of subarachnoid hemorrhage. 48 However, its effect on acute biomarkers in relation to neurological deficit was previously unknown. A viable serum biomarker that fits these characteristics would be ideal. In the present study, GFAP seemed to be the most viable candidate to warrant further study as a theranostic biomarker.
This study indicated that low doses of CsA treatment mitigated the PBBI-induced increases in neuroscore and acute serum GFAP. These observations are in accordance with improvement on neuroscore and the reduction of serum biomarkers (neuron specific enolase and nitric oxide) in a model of spinal cord injury after CsA treatment. 49 Surprisingly, the lower dose (2.5 mg/kg) was more effective than the higher dose (5 mg/kg). CsA has been shown to have an early therapeutic window and to inhibit a myriad of molecular processes and histological outcomes, including reduced brain tissue BDP generation and decreased lesion volume. 50 –52 To our knowledge, this is the first study to indicate that acute serum GFAP correlated to BDPs, as well as neurobehavioral metrics. Notably, serum GFAP indicated a therapeutic response. Serum GFAP measurements may be a viable theranostic tool to monitor efficacy of a neuroprotective drug and potentially predict outcomes at the brain tissue protein level. Further studies to determine direct and indirect role of CsA mediated serum GFAP reduction warrant further investigation and are currently being conducted.
Conclusion
Using a translational model of severe, penetrating brain injury, this study indicated that GFAP and α-II spectrin BDPs steadily increased throughout acute (<7 d) to the beginning of subacute (≥7d) after PBBI; these features may persist well after subacute TBI. In addition, a correlative relationship between serum biomarkers and brain proteins during an expanded acute timeline was determined. Remarkably, serum GFAP showed a robust therapeutic response and was useful as an acute biomarker which correlates to deleterious damage of specific brain tissue proteins. Acute serum biomarkers are poised to become very useful tools for prediction of protein specific brain tissue damage as well as neuroprotective drug efficacy in TBI.
Footnotes
Acknowledgments
The views of the authors do not purport or reflect the position of the Department of the Army or the Department of Defense (para 4-3, AR 360-5). This research is funded by Combat Casualty Care Research Program and Congressionally Directed Medical Research Program (Contract #: W81XWH-12-2-0134). The authors thank Ms. Shonnette Grant, M.S.; SGT Myint, US Army; SPC Donkor, US Army; Ms. Rebecca Pedersen; and Mr. Francis Bustos for their technical expertise, as well as Dr. Ryan Readnower and Dr. Cartagena for their invaluable advice.
Author Disclosure Statement
This material has been reviewed by the Walter Reed Army Institute of Research. There is no objection to its presentation and/or publication. The opinions or assertions contained herein are the private views of the author, and are not to be construed as official, or as reflecting true views of the Department of the Army or the Department of Defense.
Drs. Kevin K. W. Wang and Ronald L. Hayes, an executive officer at Banyan Biomarkers, Inc., own stock and receive royalties from Banyan Biomarkers, Inc., and as such may benefit financially as a result of the outcomes of this research or work reported in this publication.
References
Supplementary Material
Please find the following supplemental material available below.
For Open Access articles published under a Creative Commons License, all supplemental material carries the same license as the article it is associated with.
For non-Open Access articles published, all supplemental material carries a non-exclusive license, and permission requests for re-use of supplemental material or any part of supplemental material shall be sent directly to the copyright owner as specified in the copyright notice associated with the article.