
Abstract
Rehabilitation is the predominant post-acute treatment for patients with traumatic brain injury (TBI). We retrospectively evaluated the effectiveness of post-acute TBI rehabilitation by comparing outcome measures and life care cost with that of patients with cerebrovascular accident (CVA) who underwent a multidisciplinary rehabilitation program within the same facility. To better assess the effects of rehabilitation, we only included patients with no benefit limitations from the insurance carrier. Functional effectiveness was determined by comparing outcome scales, which included the Disability Rating Scale, Mayo Portland Inventory, Occupational Status Scale, Living Status Scale, and the Centre for Neuro Skills Scale. Cost-effectiveness was determined by having certified life care planners create separate cost projections from the admission and discharge patient files. This allowed us to compare cost projections with and without rehabilitation for each patient. Significant decreases in the cost projections, i.e., rehabilitation savings (RS), were found after rehabilitation for TBI. These RS were equivalent to those of patients with CVA. Likewise, equivalent improvements were found on all of the outcome scales for both brain injury groups. We also evaluated if the latency from TBI to admission in the rehabilitation program had an influence on outcome. Cost and functional effectiveness was more marked when rehabilitation was initiated within the first year after TBI. The effects of age of TBI were also evaluated. Although RS were most marked in younger patients, improvements in outcome measures were observed in all age groups after post-acute rehabilitation.
Introduction
T
A predominant approach to identify long-term needs and associated costs, after TBI, is a Life Care Plan provided by a certified healthcare professional. Life care plans are widely implemented for financial, medical, and legal purposes. These care plans are developed through a methodical and thorough evaluation of patient information. To determine services and costs needed over the patient's expected life span, multiple outcome dimensions affecting the patient's quality of life and long-term needs are taken into consideration.
Increases in patient independence are not only likely to improve quality of life but also to markedly diminish TBI-related costs. Early retirement is one of the major contributing factors to the economic burden placed by TBI. 6 An effective means to reduce TBI-associated morbidity and increase the possibility of patients returning to work is through rehabilitation. 7,8 Acute rehabilitation has proven to improve patient outcome after TBI. 9,10 The beneficial effects of rehabilitation are still evidenced when it is continued. For example, a recent study showed that continuation of rehabilitative therapy was associated with cost-effectiveness in patients with severe TBI. 11 Likewise, a review of the literature indicates that rehabilitation during the post-acute period is effective after TBI. 12,13 In spite of this, there is still controversy regarding its effectiveness in both functional outcome and cost.
We set out to retrospectively determine if post-acute rehabilitation proved effective in reducing life care costs in patients with TBI and whether these costs were associated with an improvement in functional outcome measures. We also explored if exposure to earlier rehabilitation had an influence on the effectiveness of post-acute rehabilitation in patients with TBI. Findings of cost-effectiveness and outcome measures in TBI were also compared with those of patients who had had a cerebrovascular accident (CVA). CVA is another leading cause of morbidity in the United States 14 and accordingly constitutes a significant portion of patients receiving post-acute rehabilitation. Moreover, rehabilitation has proven effective in patients with CVA. 15 –17
Methods
Eligibility
To better assess the effects of rehabilitation, we only included patients who were able to undergo a comprehensive rehabilitation program with no benefit limitations from the insurance carrier. Patients with TBI and CVA with a moderate to severe Disability Rating Scale (DRS) result at the time of admission were included in the cohort. Other outcome measures obtained during the admission period were equivalent for the patients with TBI and CVA (Table 1).
TBI, traumatic brain injury; CVA, cardiovascular accident; DRS, Disability Rating Scale; OSS, Occupational Status Scale; LSS, Living Status Scale; MPAI-4, Mayo-Portland Adaptability Inventory-4; CIQ, Community Integration Questionnaire; CNS, Centre for Neuro Skills Scale.
This study was approved by the Institutional Review Board for the Centre for Neuro Skills. Thirty-six patients with TBI completed a comprehensive post-acute rehabilitative program for 5 days per week at the Centre for Neuro Skills (Bakersfield, CA). An additional eight patients who had had a CVA were included in the study. Patients with CVA also completed a comprehensive rehabilitative program within the same facility.
In addition to clinical treatment, the majority of the patients were engaged in a residential rehabilitation program focused on completion of activities of daily living, initiation, appropriate behavior, and community integration. Table 2 presents demographic data of the participants. The rehabilitation program consisted of 6 h per day of physical, occupational, cognitive/speech, education, and counseling therapies in a clinic setting.
SD, standard deviation.
Rehabilitation effectiveness
Effectiveness of rehabilitation was assessed by comparing differences between admission and discharge outcome scales. These functional evaluations were performed by the patients' case-manager during the admission and discharge periods as part of standard assessment. Case managers are fully certified and have received training on administration of these outcome measures. Individual items responses are entered into a computer and are scored by a software program according to instructions for each outcome scale. These outcome scales included the DRS, 18 Mayo-Portland Adaptability Inventory-4 (MPAI-4), 19 Community Integration Questionnaire (CIQ), 20 Centre for Neuro Skills Scale (CNS), 21 Occupational Status Scale (OSS), 21 and the Living Status Scale (LSS). 21 These scales are used to evaluate level of disability and social, cognitive, emotional, and physical problems during the post-acute period after brain injury.
In addition, functional independence was assessed at least a year after discharge by obtaining additional LSS and OSS measures via telephone interview. The LSS specifically determines the level of supervision that a patient may require, and the OSS provides vocational and educational information. Given that 66.7% of patients with TBI admitted to this rehabilitative program had been exposed to previous rehabilitation (PR) in a different setting, we compared whether there were differences in outcome measures.
Cost evaluation procedure
Three independent certified life care planners, from three different companies, were provided with patient reports devoid of direct identifiers. These reports included the patient's initial admission and discharge reports prepared by the patient's case manager. The admission report was written after a period of initial evaluation in the rehabilitation program, and the discharge report was written on the week of the patient's discharge from the program. These reports describe, but are not limited to, the following areas: cognitive, communication, mobility, self-care, psychosocial and medical areas.
Reports were randomly presented to the life care planners disallowing comparison of admission and discharge reports on any given patient. In other words, the life care planner was unable to actively compare admission and discharge status in the preparation of life care plan costs. Along with the admission and discharge reports, life care planners were also provided with the outcome measures that were obtained during the period that the report was generated. These outcome measures were the same as those described above.
Each life care planner independently generated a projected cost of care for each report file (i.e., admission or discharge report and corresponding outcome measures). To achieve consistent costs that would allow comparisons across each life care planner, projected costs were based on a template listing categories of services typically needed by patients with brain injury (Table 3). The projected cost obtained from the admission report file assumed that the patient had no further post-acute rehabilitation services. This projected cost was compared with the projected cost generated from the rehabilitation discharge report file.
Data analysis
Data are reported as mean values plus standard error of the mean (SEM). Raw data for outcome measures and cost projections were compared through a mixed model analysis with admission and discharge values as repeated measures (Time). All comparisons were Bonferroni corrected. Projected costs at admission—i.e., before rehabilitation (PreReh) and projected costs after completion of the rehabilitation program (PostReh)—were averaged across the three life care planners. The cost of the rehabilitation program was included in the calculation of the PostReh projected cost. Life care savings of post-acute rehabilitation were obtained by comparing the PreReh and PostReh costs. Rehabilitation savings (RS) were analyzed through a one-way analysis of variance (ANOVA). RS was calculated using a 3% annual inflation adjustment. Pearson product correlations were used to determine the relationships between outcome measures and projected costs. The effects of latency to initiate rehabilitation were analyzed by comparing values when rehabilitation was initiated within the first 3 months, between 3 to 12 months, and more than 12 months after TBI.
We also evaluated whether the age when TBI was sustained had an effect on outcome measures and rehabilitation savings. Age of TBI groups compared were as follows: 20–29, 30–39, 40–49 and more than 50 years. All statistical measures were performed by SPSS (Version 22). The level of significance was chosen as p<0.05.
Results
Effectiveness of post-acute TBI rehabilitation compared with CVA rehabilitation
There were no significant differences between injury groups when comparing admission and discharge scores for all outcome measures. Significant time effects indicative of functional improvement after rehabilitation were observed for DRS [F(1,42)=68.96, p<0.0005], OSS [F(1,38=18.87, p<0.0005], LSS [F(1,42=37.17, p<0.0005], MPAI-4 [F(1,42=81.2, p<0.0005], CIQ [F(1,42=81.2, p<0.0005] and CNS [F(1,42=22.3, p<0.0005] outcome measures. It should be noted that significance was approximated when analyzing the Injury by Time interaction for CIQ (p=0.08). This suggested that improvement was more pronounced in the TBI group (Fig. 1).

Comparison of outcome measures between traumatic brain injury (TBI) and cerebrovascular accident (CVA) patients. For illustrative purposes, the data are represented as percent improvement in discharge outcome measures compared with admission measures. Significant improvements in outcome scales were observed after post-acute rehabilitation. Disability Rating Scale (DRS), Occupational Status Scale (OSS), Living Status Scale (LSS), Mayo-Portland Adaptability Inventory-4 (MPAI-4), Community Integration Questionnaire (CIQ), and Centre for Neuro Skills Scale (CNS). *p<0.05, ***p<0.0005 compared with admission score. Each value represents the mean±standard error of the mean.
We were able contact 68% of the patients at least a year after discharge (25.5 months±1.52 SEM). LSS and OSS measures were obtained. The majority of patients remained stable or had improved status on these measures (Table 4).
LSS, Living Status Scale; OSS, Occupational Status Scale.
Life care costs
Analysis of costs indicated no significant difference between TBI and CVA groups. There was, however, a significant decrease in projected life care costs after completing the rehabilitation program compared with the projected cost generated from the admission file. This was supported by a significant main effect for Time [F(1,42=10.84, p<0.005] (Fig. 2). Correspondingly, RS were similar between injury groups (TBI: $2,267,967.71±$680,823.31 [SEM]; CVA: $1,232,061.14±415,543.90 [SEM]). All admission outcome measures, except for OSS, were significantly correlated with PreReh projected cost and RS. Likewise, discharge outcome measures were significantly correlated with PostReh projected cost and RS (Table 5). Correlational analysis of LSS and OSS measures obtained from follow-up showed no relationship between these measures and RS.
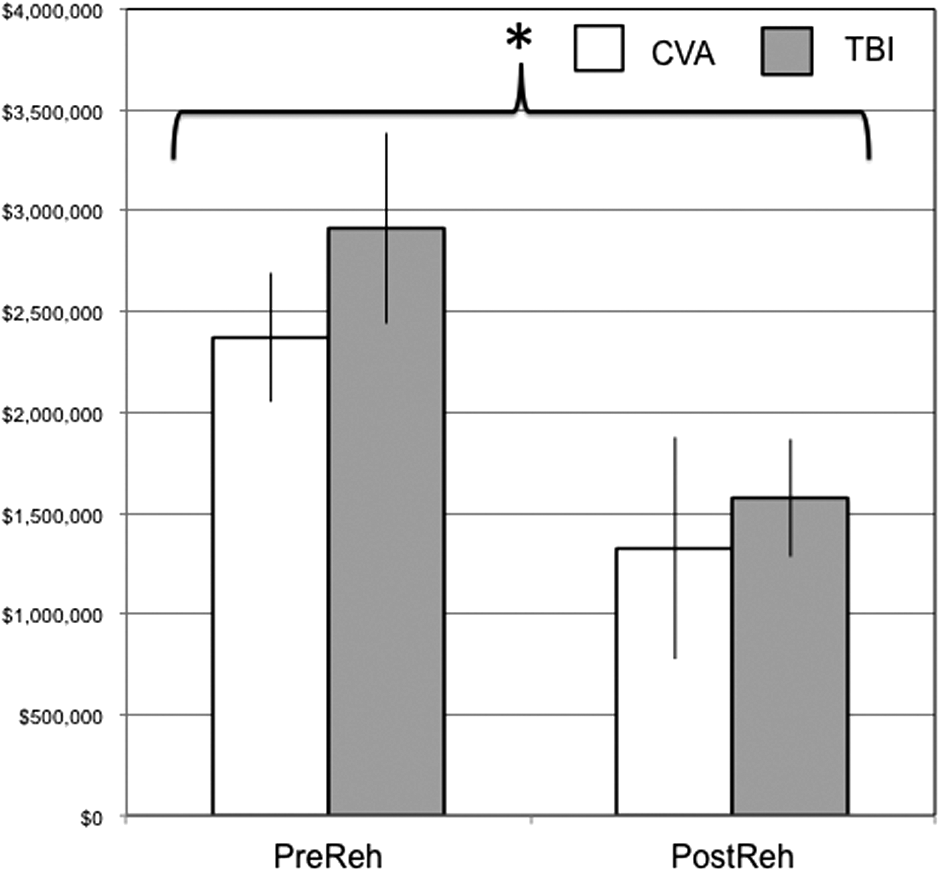
Projected life care costs before (PreReh) and after PostReh) completing rehabilitation in traumatic brain injury (TBI) and cerebrovascular accident (CVA) patients. Projected life-care cost generated from admission file (PreReh) and projected life care cost generated from discharge file (PostReh). *p<0.05. Each value represents the mean±standard error of the mean.
Projected costs were correlated with corresponding outcome measures and Rehabilitation Savings.
PreReh, before rehabilitation; PostReh, after rehabilitation; DRS, Disability Rating Scale; OSS, Occupational Status Scale; LSS, Living Status Scale; MPAI-4, Mayo-Portland Adaptability Inventory-4; CIQ, Community Integration Questionnaire; CNS, Centre for Neuro Skills Scale. * p<0.05; ** p<0.001.
We were able to obtain a follow-up on four of the seven patients who had negative RS. Of these four patients, two showed a decline in status because of not working, one had no change, and one showed improvement in occupational status according to the OSS scale. For the LSS scale, three showed no difference and one showed improvement in status.
Effects of previous rehabilitation on post-acute TBI rehabilitation
Improvements in discharge outcome measures, compared with admission measures, were observed for patients with TBI, independent of previous rehabilitation (Table 6).
Patients with TBI who had previous rehabilitation at a different setting were compared with those who had no rehabilitation before admission.
DRS, Disability Rating Scale; OSS, Occupational Status Scale; LSS, Living Status Scale; MPAI-4, Mayo-Portland Adaptability Inventory-4; CIQ, Community Integration Questionnaire; CNS, Centre for Neuro Skills Scale. ***
p < 0.0005 is indicative of improved outcome during discharge compared to admission.
DRS
A main effect for rehabilitation history [F(1,34)=5.63, p<0.05] was observed. This indicated that PR had a positive influence on admission and discharge scores compared with those patients who had no PR. Outcome scores, however, significantly improved with post-acute rehabilitation for all patients. This effect was supported by a main effect for Time [F(1,34)=71.53, p<0.0005].
OSS
Exposure to PR did not influence OSS scores. Both TBI groups showed a significant improvement when comparing admission and discharge scores. This was indicated by a main effect for Time [F(1,30=28.47, p<0.0005].
LSS
Exposure to PR resulted in overall better scores for LSS [F(1,34)=11.73, p<0.005]. Both groups, however, benefited with post-acute rehabilitation as indicated by a significant main effect for time [F(1,34)=33.5, p<0.0005].
MPAI-4
Higher function, as determined by MPAI-4, was observed in patients who underwent PR [F(1,34)=7.39, p<0.05]. Both TBI groups showed a significant improvement when comparing admission and discharge scores. This was indicated by a main effect for Time [F(1,34=122.1, p<0.0005].
CIQ
Exposure to PR did not influence CIQ scores. Both TBI groups showed a significant improvement when comparing admission and discharge scores. This was indicated by a main effect for Time [F(1,34=63.4, p<0.0005].
CNS
Exposure to PR resulted in overall better scores for CNS [F(1,34)=5.55, p<0.05]. Both groups, however, benefited with post-acute rehabilitation as indicated by a significant main effect for time [F(1,34)=126.26, p<0.0005].
Latency to initiate post-acute rehabilitation after TBI
Improvements in discharge outcome measures, compared with admission measures, were observed for all latency groups (Fig. 3).
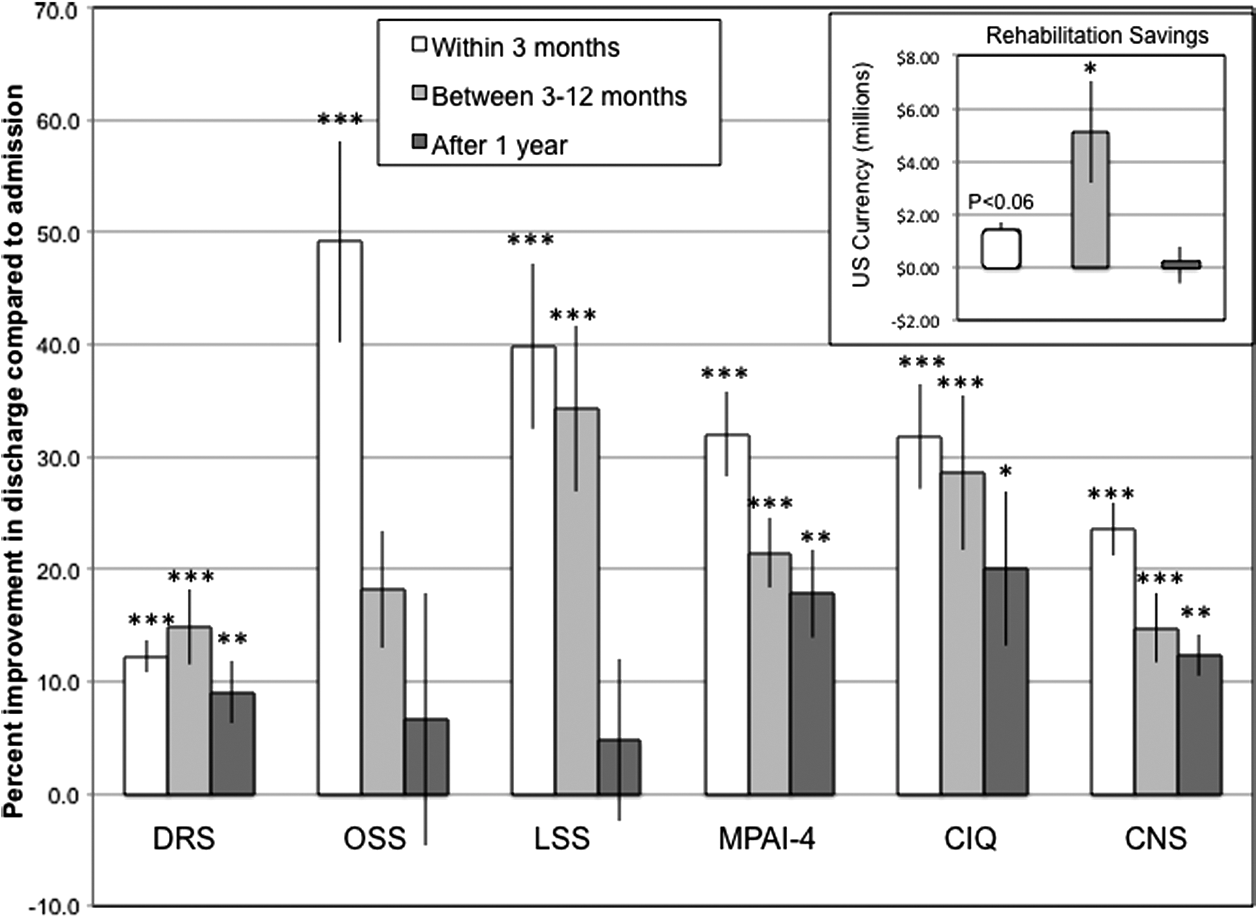
Latency to initiate post-acute rehabilitation in patients after traumatic brain injury. For illustrative purposes, the data are represented as percent improvement in discharge measures compared with admission measures. Significant improvements in outcome scales were observed after post-acute rehabilitation. Disability Rating Scale (DRS), Occupational Status Scale (OSS), Living Status Scale (LSS), Mayo-Portland Adaptability Inventory-4 (MPAI-4), Community Integration Questionnaire (CIQ), and Centre for Neuro Skills Scale (CNS). *p<0.05, **p<0.0005, ***p<0.0005 compared with admission scores. Each value represents the mean±standard error of the mean. Inset indicates estimated rehabilitation savings *p<0 .05 compared with other latency groups' savings.
DRS
Outcome scores significantly improved in all groups after discharge as indicated by a main effect for Time [F(1,33=68.27, p<0.0005].
OSS
Outcome scores significantly improved after discharge as indicated by a main effect for Time [F(1,32=10.18, p<0.005]. Latency by Time interaction for OSS approximated significance (p=0.08), suggesting that improvement was more pronounced in the group admitted within the first 3 months after injury.
LSS
Analysis of LSS indicated that improvements were only observed in the groups initiating rehabilitation within 3 months (p<0.0005) and between 3 and 12 months (p<0.0005). This was supported by a significant Latency by Time interaction [F(2,33=4.27, p<0.05].
MPAI-4
Higher function, as determined by MPAI-4, was observed during admission in the group that initiated early rehabilitation compared with those initiating rehabilitation between 3 and 12 months (p<0.005). Higher function was also observed at discharge in the “less than 3 months group” compared with the “between 3 and 12 months” group (p<0.0005) and the “after 12 months” group (p<0.0005). This was supported by a significant Latency by Time interaction [F(2,33=3.67, p<0.05]. All groups showed improvement in MPAI-4 scores after rehabilitation as indicated by a significant Time effect [F(2,33=96.29, p<0.0005].
CIQ
Outcome scores significantly improved in all groups after discharge as indicated by main effect for Time [F(1,33=53.47, p<0.0005].
CNS
Higher function, as determined by CNS, was observed in the group that initiated early rehabilitation compared with those initiating rehabilitation between 3 and 12 months (p<0.05). Higher function was also observed at discharge in the less than 3 months group compared with the between 3and 12 months group (p<0.0005) and the after 12 months group (p<0.05). This was supported by a significant Latency by Time interaction [F(2,33=5.06, p<0.05]. All groups showed improvement in CNS scores after rehabilitation as indicated by a significant Time effect [F(2,33=101.22, p<0.0005].
Savings
Rehabilitation savings were most marked in the group initiating rehabilitative treatment between 3 and 12 months after injury, reaching significance when compared with those receiving treatment 12 months after TBI (p<0.05) and approximating significance when compared with those receiving treatment within the first 3 months after injury (p=0.065) (Fig. 3 inset).
Age when sustaining TBI
Improvements in discharge outcome measures, compared with admission measures, were observed for all age groups (Fig. 4).
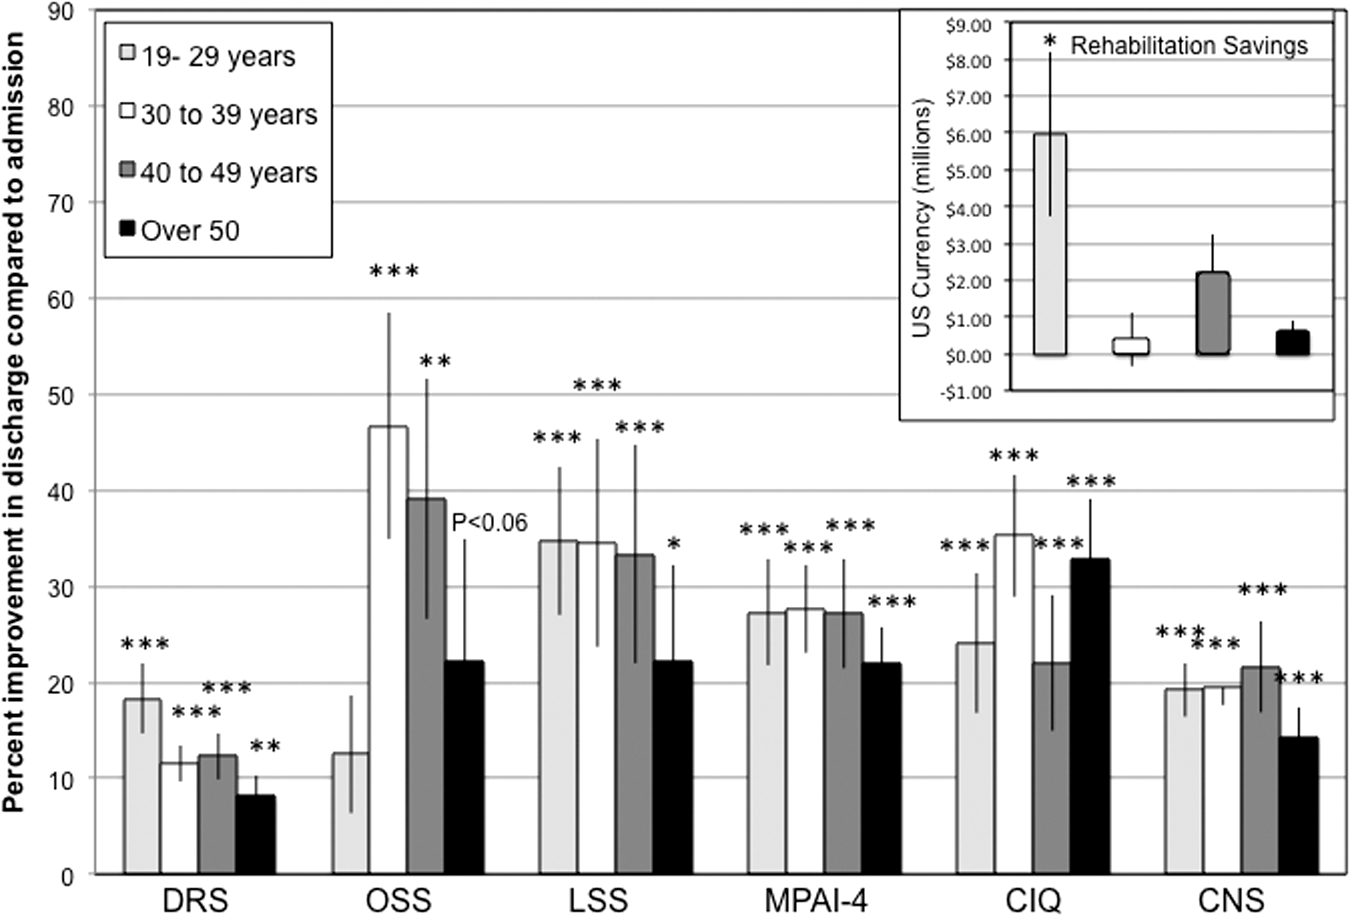
Effects of age of patients with traumatic brain injury and outcome measures. For illustrative purposes, the data are represented as percent improvement in discharge measures compared with admission measures. Significant improvements in outcome scales were observed after post-acute rehabilitation. Disability Rating Scale (DRS), Occupational Status Scale (OSS), Living Status Scale (LSS), Mayo-Portland Adaptability Inventory-4 (MPAI-4), Community Integration Questionnaire (CIQ), and Centre for Neuro Skills Scale (CNS). *p<0.05, **p<0.0005, ***p<0.0005 compared with admission score. Each value represents the mean±standard error of the mean. Inset indicates estimated rehabilitation savings *p<0.05 compared with other age groups' savings.
DRS
Outcome scores significantly improved in all groups after discharge as indicated by a main effect for Time [F(1,32=96.66, p<0.0005].
OSS
Outcome overall scores significantly improved after discharge as indicated by main effect for Time [F(1,28=26.9, p<0.0005]. Although an improvement was observed through a significant main effect, individual comparisons only indicated significant time differences in the “30 to 39” and “40 to 49” groups.
LSS
Analysis of LSS indicated that improvements were observed in all groups. This was supported by a significant Time effect [F(1,32=37.81, p<0.0005].
MPAI-4
Analysis of MPAI-4 indicated that improvements were observed in all groups. This was supported by a significant Time effect [F(1,32=108.22, p<0.0005].
CIQ
Outcome scores significantly improved in al groups after discharge as indicated by a main effect for Time [F(1,32=70.11, p<0.0005].
CNS
Outcome scores significantly improved in all groups after discharge as indicated by a main effect for Time [F(1,32=113.55, p<0.0005].
Savings
Rehabilitation savings were more pronounced when TBI occurred between 20 to 29 years of age. Significant differences were found when this group was compared with those that had a TBI in their 30s (p<0.05) and after the age of 50 (p<0.05). This was supported by a significant main effect for age F(1,36=3.93, p<0.05] (Fig. 4 inset).
Discussion
Post-acute rehabilitation improved functional outcome
Significant improvements on functional outcome were observed as determined by an array of outcome scales frequently used in the rehabilitation setting. These improvements were similar to those found in patients with CVA. Only those patients who did not present benefit limitations were included in this study. It yet needs to be determined whether shorter rehabilitation periods would be as effective.
Rehabilitation programs vary not only in length of stay but also in the degree of resources and therapeutic activities. Consequently, there is notable variability in outcome measures across different facilities. 22 Considering this, the criteria of no benefit limitations allowed us to include patients who were able to fully undertake a comprehensive program.
Rehabilitation programs with a multidisciplinary approach are more likely to be effective in the treatment for patients with TBI. 23 –25 These rehabilitation concepts have led to the development of clinical guidelines promoting the implementation of rehabilitation after acquired brain injury. 26,27 These guidelines recommend multidisciplinary rehabilitation. The improvement in rehabilitation was sustained as suggested by the patients' follow-up reports. These reports exclusively provided information on the levels of assistance needed for daily living and the occupational status.
Higher function was observed in patients who had previous rehabilitation as determined by DRS, MPAI, LSS, and CNS scores. This not only reiterates the importance of acute rehabilitation but also suggests that continuous courses of rehabilitation are more effective in patients with TBI. Nevertheless, significant functional improvements were also observed in those patients with TBI with no previous rehabilitative treatment before admission.
Post-acute rehabilitation decreased projected life care costs
Significant RS were observed with post-acute rehabilitation. These savings were similar for TBI and CVA patients. Interestingly, although we found that the projected costs as determined by the life care planners were associated with most of the outcome scales, this association was not as strong as initially hypothesized. It is likely that the life care planners mostly relied on patient reports to evaluate the different categories indicated in the template that was provided.
The patient reports contained detailed information on multiple areas, resulting from the therapists' evaluations as well as detailed medical information. Moreover, correlations between outcome measures and the corresponding PreReh and PostReh cost projections were more robust than those between outcome measures and RS. This may be attributed to the fact that the life care planners were blinded as to whether the patient files were created at admission or discharge, because these were not coupled for each patient.
Rehabilitation effectiveness is most pronounced within the first year after TBI
Functional effectiveness of rehabilitation was most robust when rehabilitation was initiated within the first year after sustaining TBI. This lack of benefit, in the group initiating rehabilitation after a year, was predominantly observed for the LSS and OSS scales. This may be partially attributed to medical complications after injury that prevented timely transfer to a rehabilitation facility. Correspondingly, this group showed minimal rehabilitative savings. Inspection of the life care cost evaluations for this group indicated that the elevated projected cost was predominantly from projected medical procedures, hospitalization, and nursing costs. This does not imply, however, that rehabilitation benefits were not observed when admission into the rehabilitation program was more than a year after sustaining TBI.
Patients initiating rehabilitation a year after TBI showed a decrease in the general level of disability as indicated by the DRS. These patients also showed improvement in emotional and social behavior, cognition, mobility, and speech as determined by the MPAI-4, CNS, and CIQ scales. Conversely, occupational status was notably improved when rehabilitation was initiated within the first 3 months after TBI. It is likely that these patients had an earlier hospital discharge and thus may present a confounding variable because of accelerated recovery and/or lesser injury severity or complexity.
Functional effectiveness was observed at all TBI age groups
All age groups showed significant improvements after completing the rehabilitation program. The only outcome scale that did not show improvement for all age groups was the OSS. Patients in the younger and older ends of the age spectrum did not have a change in occupational status after discharge. A possibility for this is that the younger group continued with educational pursuits and those over the age of 50 had a higher incidence of retirement. The younger age group also showed notable RS. This is expected, given that the life expectancy was factored in the cost projection that was generated by the life care planner.
Limitations
As a retrospective study, several limitations need to be taken into consideration. Foremost is the lack of a TBI group that did not undergo rehabilitation in order to evaluate rate of recovery over time. While it is unlikely that a group of TBI patients with no rehabilitative treatment would be ethically plausible, future studies could compare these findings with TBI patients having notable benefit limitations or no benefits at all that would consequently considerably restrict rehabilitative treatment. By comparing patients with TBI with CVA patients, we were able to control for additional effects of a traumatic injury.
An additional limitation would be the risk of a detection bias. While the life care planners reviewed the report files for each patient in such a manner that they were blinded as to whether the report was generated during the admission or discharge period, there was no blinding of the case mangers when obtaining outcome measures. Although case managers were unaware that this information would be included in a study, it is not certain to what degree blinding would influence the results.
Conclusions
These findings suggest that marked improvement can still be obtained after traditional acute rehabilitation when the patient enters an intensive and comprehensive rehabilitation program. Recovery past the post-acute stage can be promoted by facilitating neuroplasticity via rehabilitation. 28 We focused on a comprehensive rehabilitation program that facilitated patient adaptation to disability and maximized the possibility of returning to previous social and vocational activities. Unfortunately, limited benefits are likely to affect a large part of the population with TBI. It yet needs to be determined whether similar findings are observed with more limited rehabilitative programs.
Footnotes
Author Disclosure Statement
No competing financial interests exist.